Introduction
The Euro area’s euro against the Japanese yen, in short, is termed as EURJPY. This pair, too, like the EURCHF, EURNZD, EURCAD, EURGBP, etc. is a minor or cross currency pair. It is one of the most traded currency pairs in the forex market. Here, the EUR is the base currency, and JPY is the quote currency. The value of this pair is quoted in terms of the quote currency.
Understanding EUR/JPY
This currency pair is precisely quoted as 1 EUR per X JPY. In simple terms, the value determines the units of the quote currency (JPY) required to buy one unit of the base currency (EUR). For example, if the market value of EURJPY is 121.00, it basically means that these many yen are required to purchase one euro.
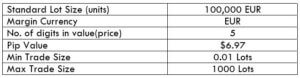
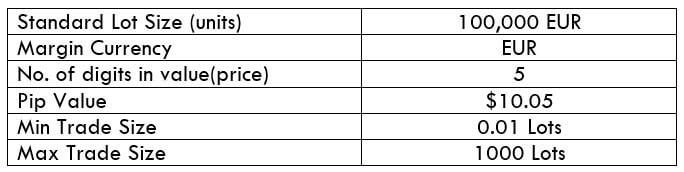
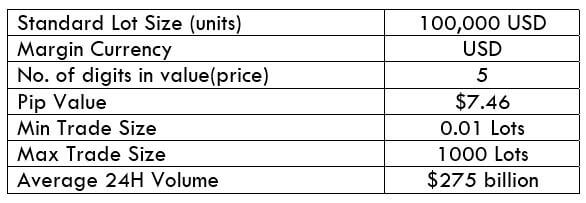
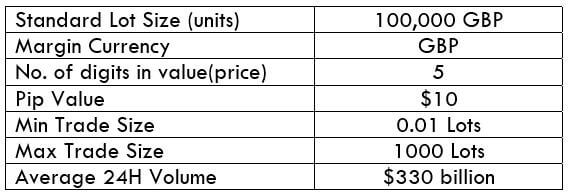
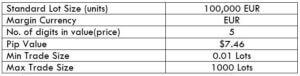
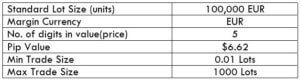
EUR/JPY Specification
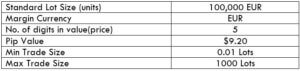
Spread
Spread is the difference between the bid price and the ask price set by the broker. This value is not constant and varies from broker to broker. It also varies on the type of account model.
Spread on ECN model: 0.6
Spread on STP model: 1.5
Fees
Spread is not the only way through which brokers generate their revenue. They charge some fee (commission) on each trade as well. Fees again vary from broker to broker and account model. Typically, there is no fee on an STP account. However, there are a few pips or fees on an ECN account as their spread is lesser than an STP account.
Slippage
Slippage is the difference between the trader’s asked price and the actual price given to him. Two factors majorly affect slippage on a trade; one, the volatility of the market, and two, broker’s execution speed. The slippage is usually within 0.5 to 5 pips. For major currencies, the slippage is much lower.
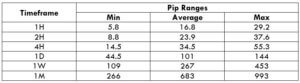
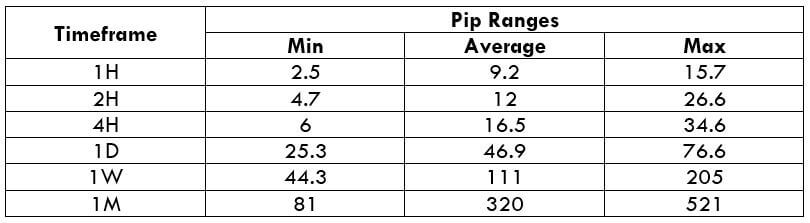
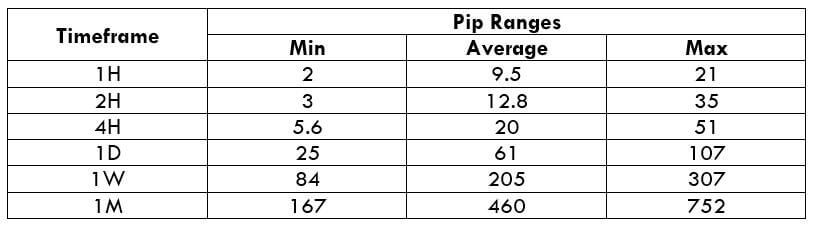
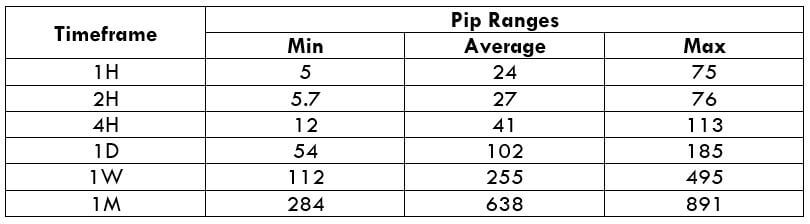
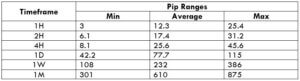
Trading Range in EUR/JPY
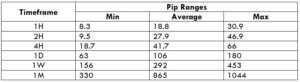
The trading range is the illustration of the minimum, average, and the maximum number of the pips the currency pair has moved in a given time frame. These values help assess the profit/loss potential of a trade. For instance, if the max volatility on the 1H is 10 pips, then one can expect to win or lose a maximum of $92 (10 pip x 9.20 value per pip) in an hour or two.
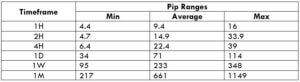
Procedure to assess Pip Ranges
- Add the ATR indicator to your chart
- Set the period to 1
- Add a 200-period SMA to this indicator
- Shrink the chart so you can determine an extensive period
- Select your desired timeframe
- Measure the floor level and set this value as the min
- Measure the level of the 200-period SMA and set this as the average
- Measure the peak levels and set this as Max.
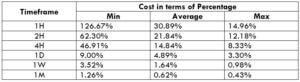
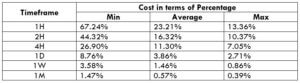
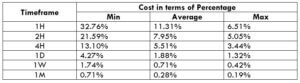
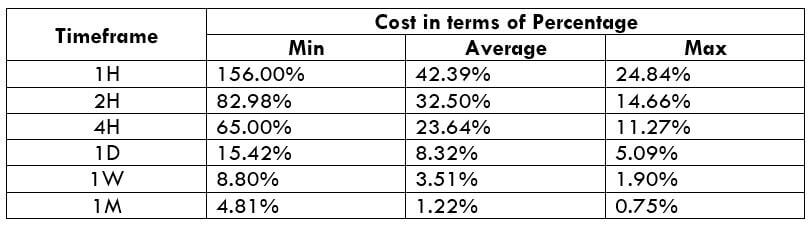
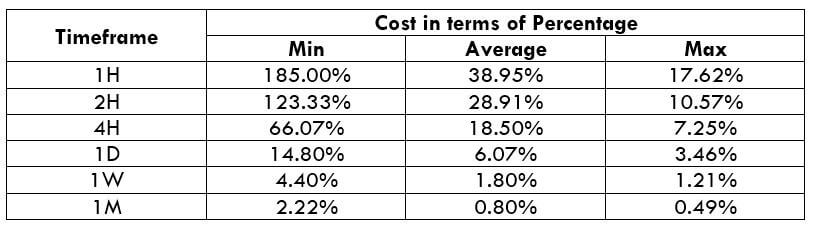
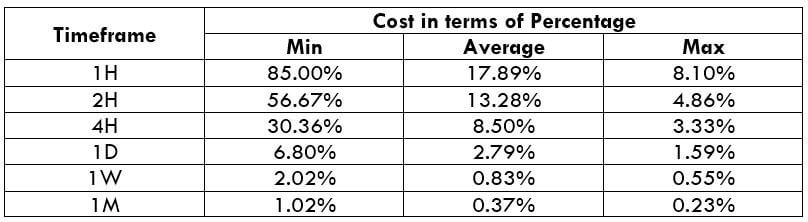
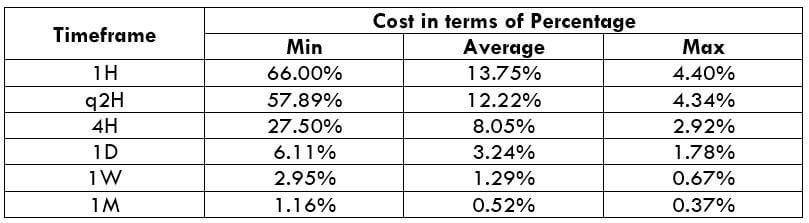
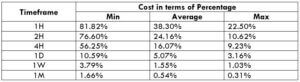
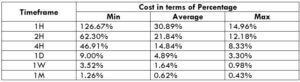
EUR/JPY Cost as a Percent of the Trading Range
In addition to assessing the profit/loss in a timeframe ahead of time, we can use these values in determining the cost variation in different timeframes and volatility as well. The cost as a percent of the trading range tells the min, average, max costs by considering the timeframes and volatility as its variables.
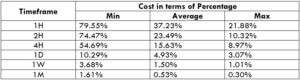
ECN Model Account
Spread = 0.6 | Slippage = 2 | Trading fee = 1
Total cost = Slippage + Spread + Trading Fee = 2 + 0.6 + 1 = 3.6
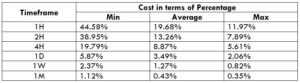
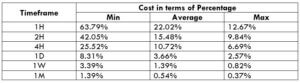
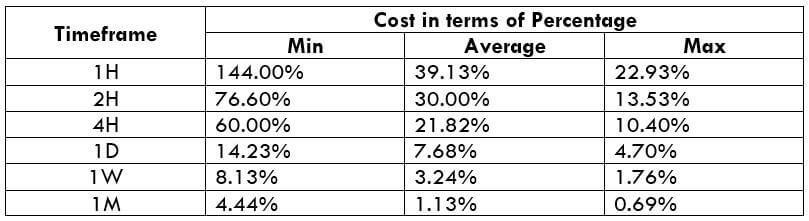
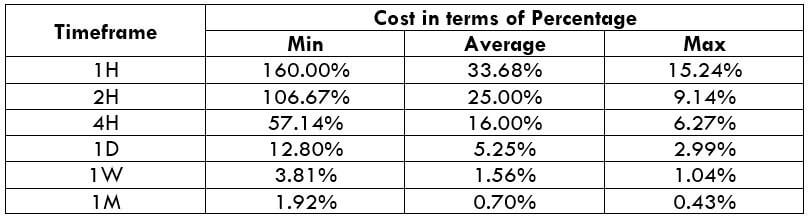
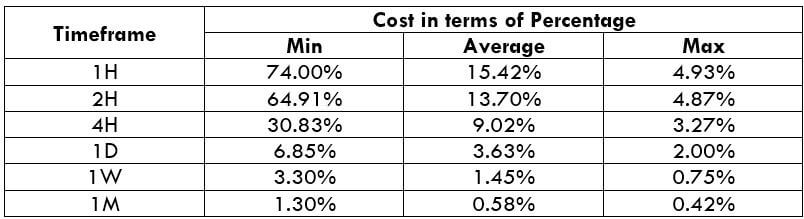
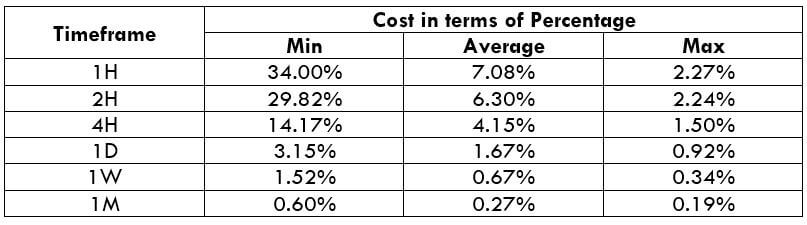
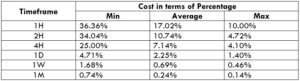
STP Model Account
Spread = 1.5 | Slippage = 2 | Trading fee = 0
Total cost = Slippage + Spread + Trading Fee = 2 + 1.5 + 0 = 3.5
The Ideal way to trade the EUR/JPY
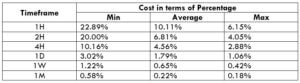
Above are the costs of each trade in terms of percentages. Note that they do not represent the actual cost on trade in terms of dollars, but are magnitude values which can be used for comparing with other values. The higher the magnitude of the percentage, the higher is the cost on the trade for that particular timeframe and volatility. From the tables, it can be ascertained that the values are highest on the min column and lowest on the max column. This, in turn, implies that the costs are higher when the volatility is low and vice versa. Talking about the timeframe, the costs are high on the lower timeframes and low on the higher timeframes. So, a day trader may preferably trade on the 2H/4H when the volatility is around the average values. And long-term traders may trade the 1W/1M whatsoever be the volatility of the market.
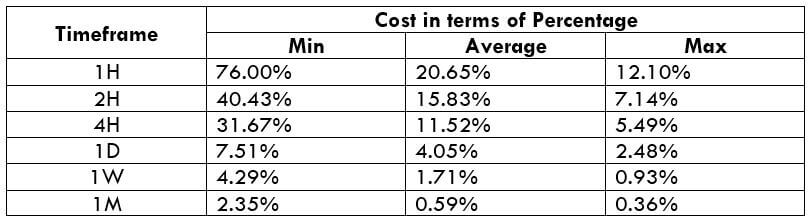
Furthermore, a trader may reduce their costs by entering and exiting trades using limit order instead of market orders. This will completely erase the slippage on the trade. An example of the same is given below.
Total cost = Spread + trading fee = 0.6 +1 = 1.6


 Spread