Description
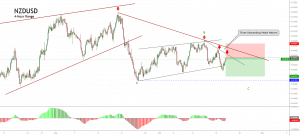
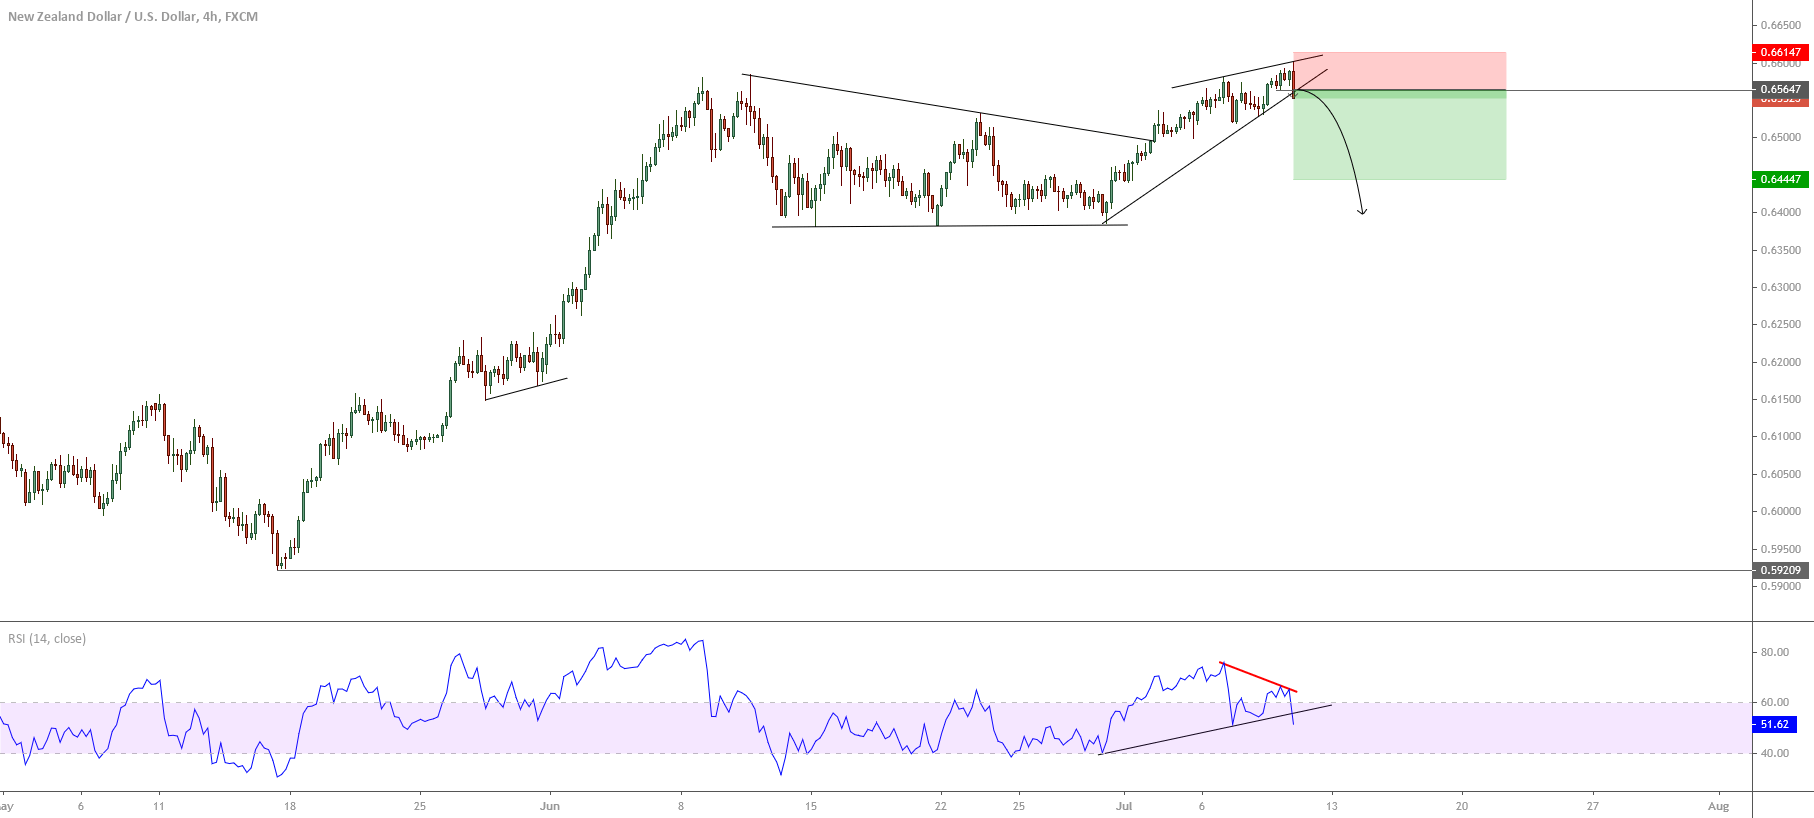
The NZDUSD pair in its 4-hour chart reveals the breakdown of an ascending wedge pattern in progress, suggesting the possibility of further declines for the following trading sessions.

The oceanic currency against the US Dollar started to develop a rally from 0.5920 on May 15th, which took a breath once topped at 0.6584 on June 10th, beginning to move mostly sideways. Once the price action tested by the third time the baseline of the consolidation sequence, the price action began to advance on a terminal pattern identified as an ascending wedge formation.
On the other hand, the RSI oscillator illustrates a bearish divergence exposing the mid-term uptrend’s exhaustion. Simultaneously, the breakdown of the ascending trendline and the perforation of the previous intraday lows at 0.6564r lead us to expect further declines in the coming trading sessions. This breakdown could drag the price at least until level 0.6444.
The invalidation level of the bearish outlook locates at 0.6614.
Chart
Trading Plan Summary
- Entry Level: 0.6564
- Protective Stop: 0.6614
- Profit Target: 0.6444
- Risk/Reward Ratio: 2.4
- Position Size: 0.01 lot per $1,000 in trading account.
Check out the latest trading signals on the Forex Academy App for your mobile phone from the Android and iOS App Store.