Description
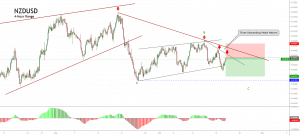
The NZDUSD pair in its hourly chart shows a sideways sequence that reacted mostly bullish after dropped to 0.5468, the lowest level reached since April 2009.
This Tuesday, the stock markets began to show bounces signals despite the bearish opening observed on Monday trading session. The context seen makes us suspect an increase in the traders’ interest on the risk-on side. This scenario could lead to a boost to commodity currencies such as the New Zealand Dollar.
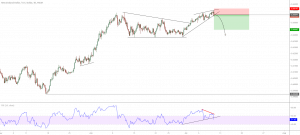
The breakout and close above the level 0.5878 make us foresee that the price could confirm an upward which could drive to the oceanic currency until 0.6186.
The level that invalidates our bullish scenario locates at 0.5655.
Chart
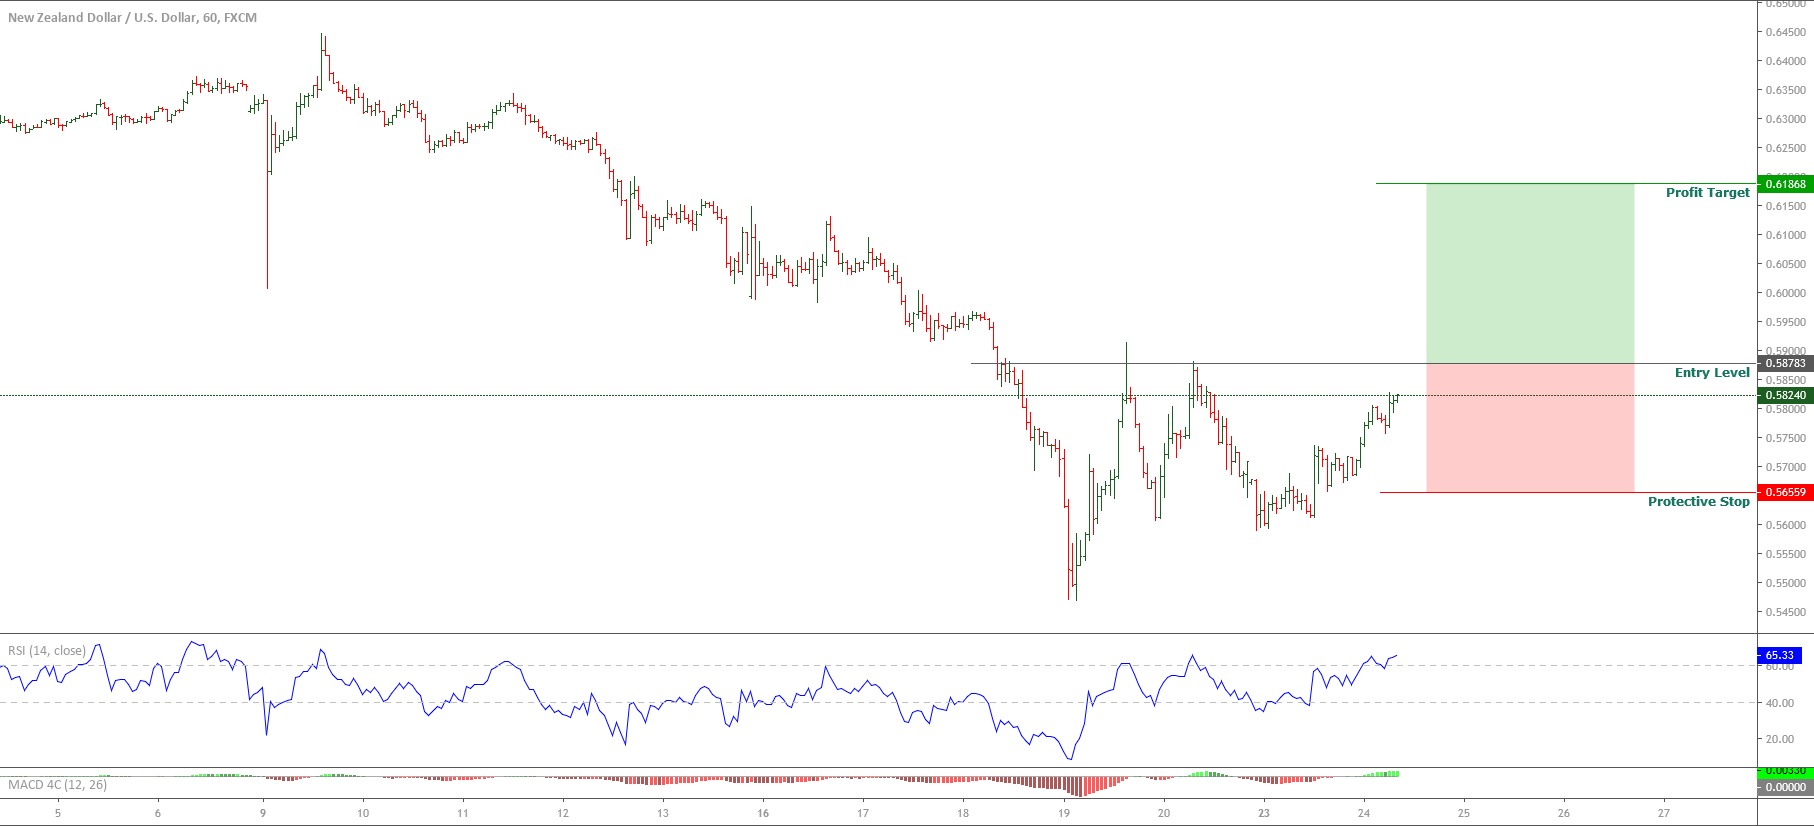
Trading Plan Summary
- Entry Level: 0.5878
- Protective Stop: 0.5655
- Profit Target: 0.6186