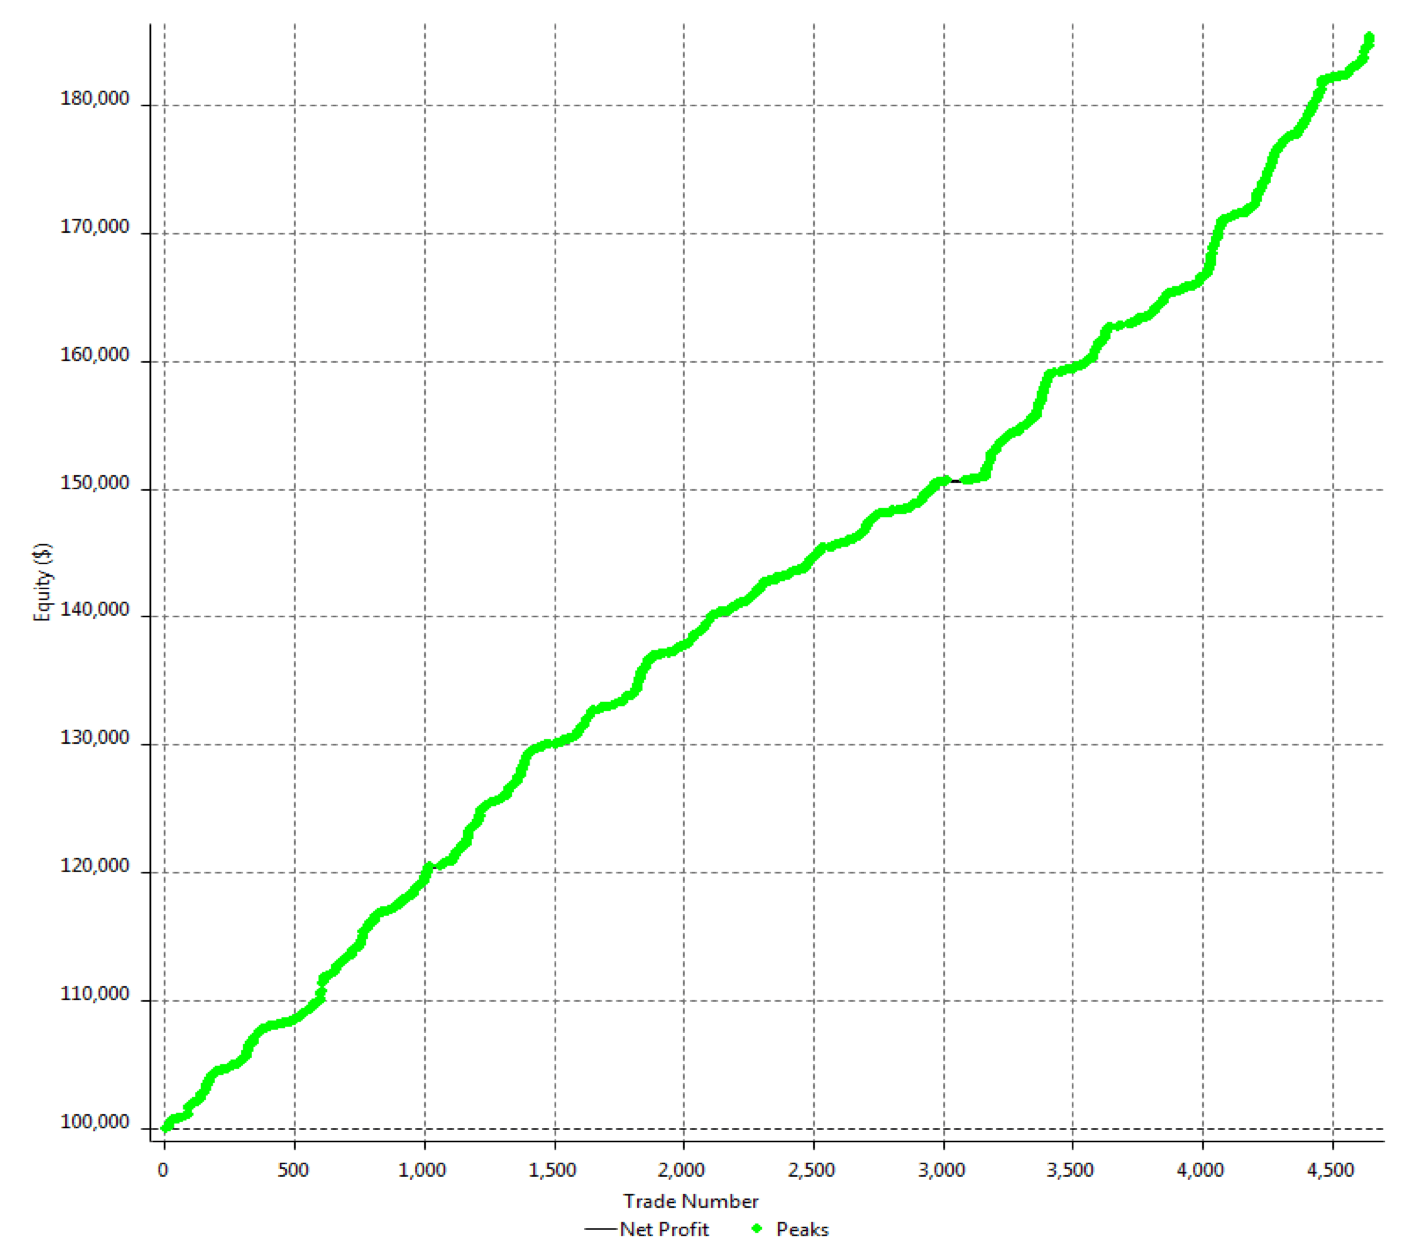
This article outlines the steps needed to find, create, test, and verify a trading system. We have to bear in mind that there is no way to create a forex trading system with an equity curve straight upward. Well, yes, it can be made. I’ve made it, but only optimizing it so much that expecting it to continue performing like this under real trading would be silly. Most trading bots advertise curves like this. If you believe them, your money will be in jeopardy.
It would be best if you’re proficient in coding on a trading platform such as MT4/5, Ctrader, Tradestation, Multicharts, or Ninjatrader. Not all traders can do it, so we will approach this for anyone willing to create a DIY trading system without programming. It would take longer, but the added benefit is you will learn a lot while doing your testing. This methodology will also create simpler and less prone to over-optimization systems.
The results obtained will vary, and not always will we get sound systems. Of course, we should not expect great, drawdown-free equity curves. But, there is no need for that. We will show you that what is necessary is only long-term profitability.
The Idea

The first step to creating a trading system is an idea that will provide us with an edge. Among the most basic concepts are,
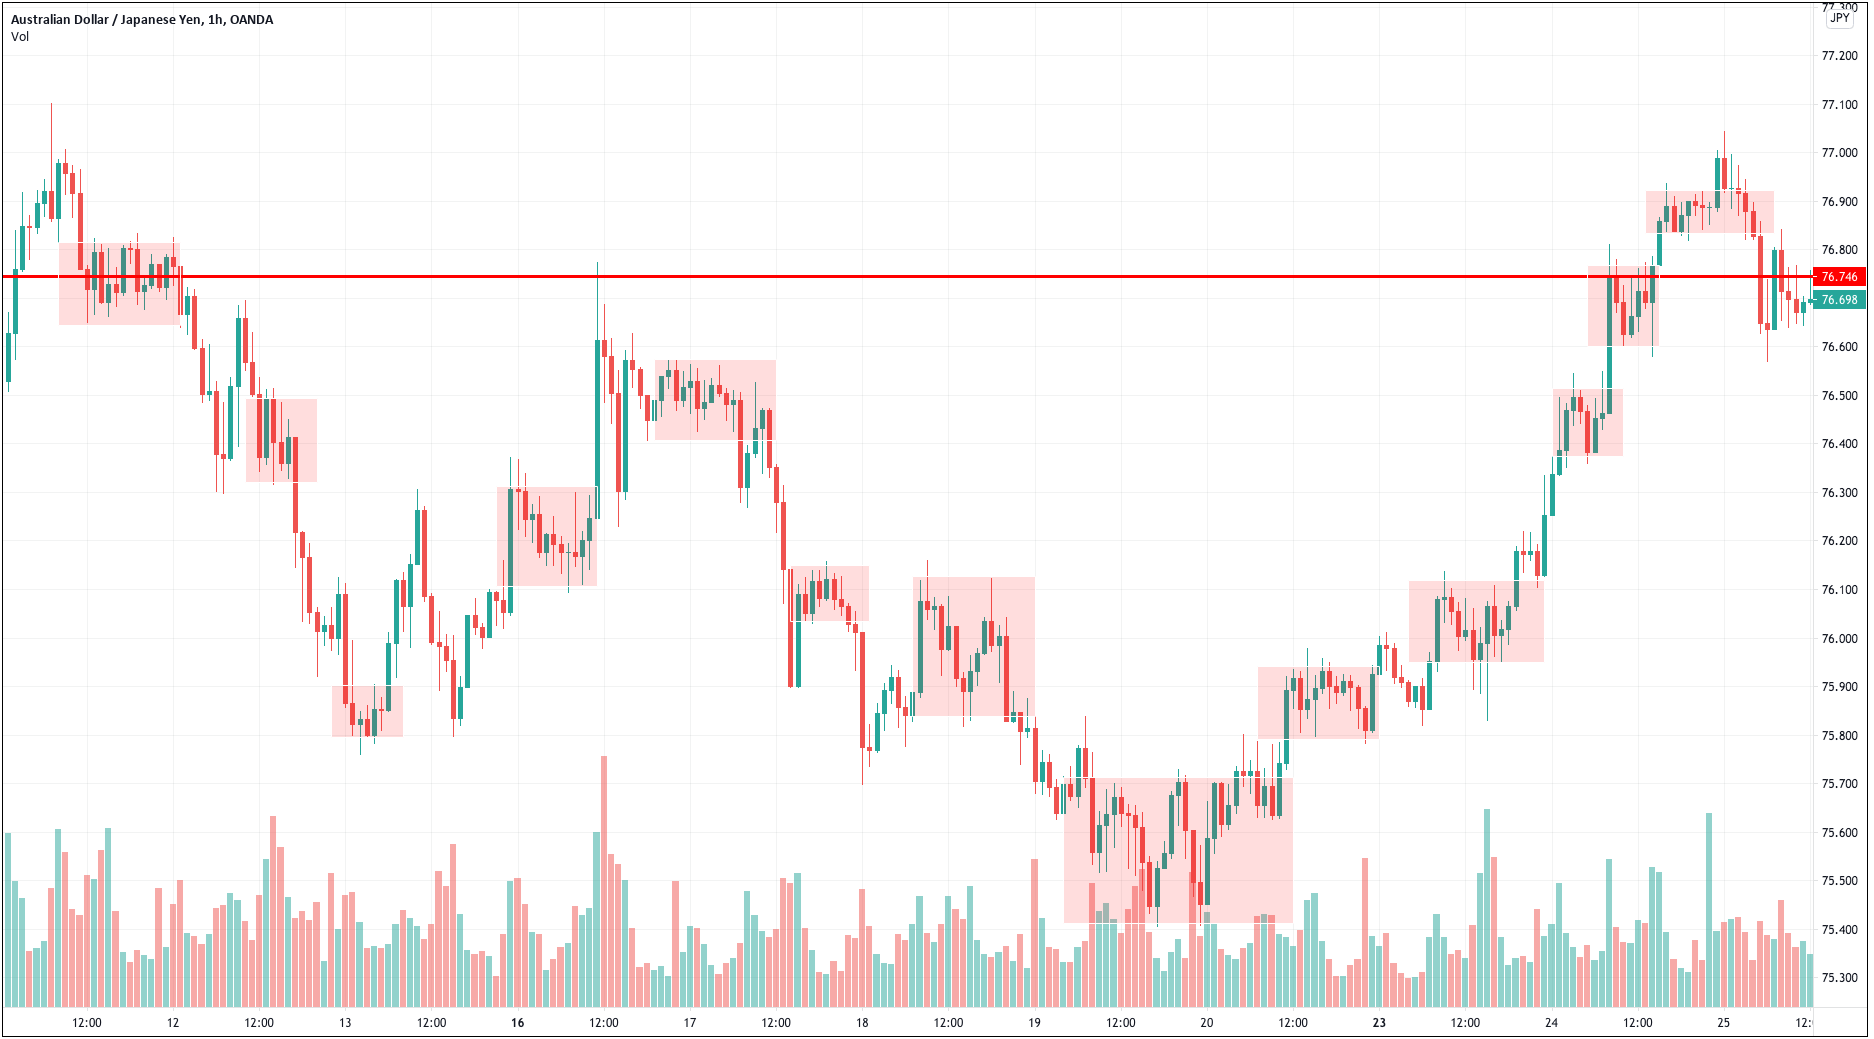
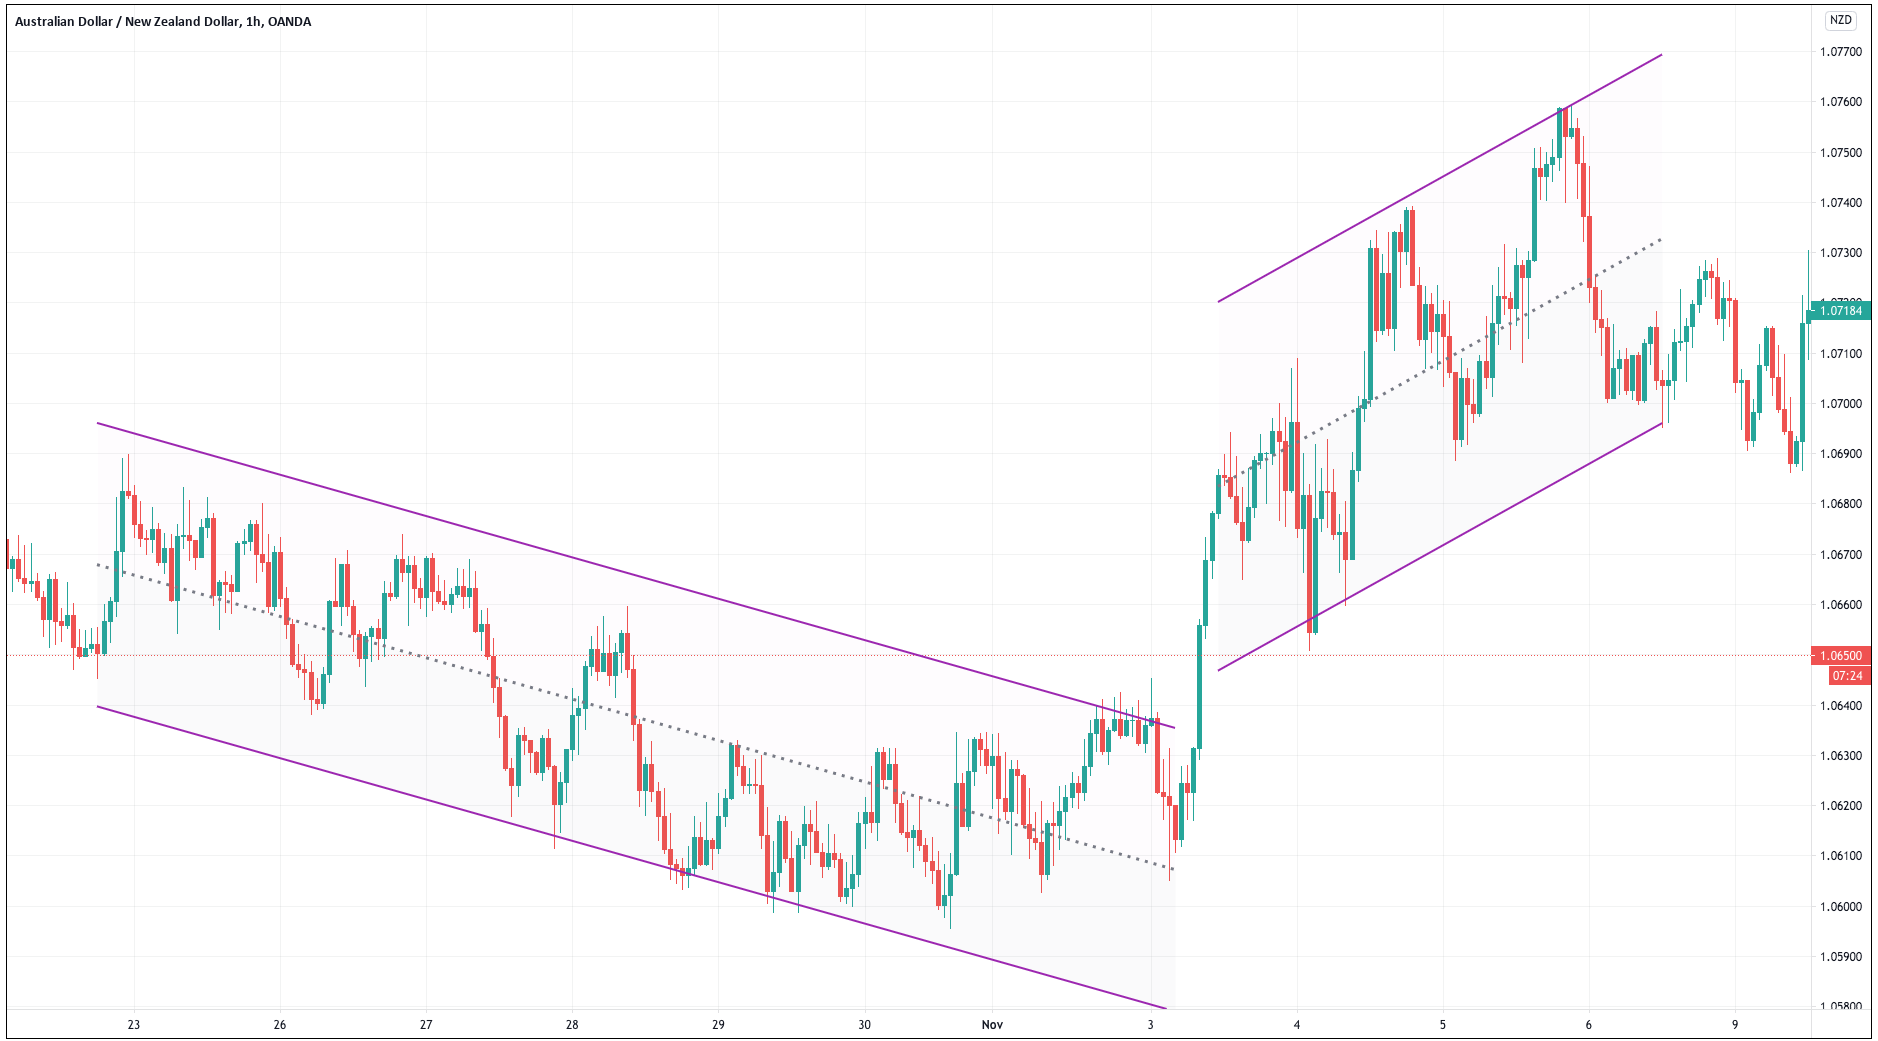
- Breakouts from a range or Fading breakouts from a range
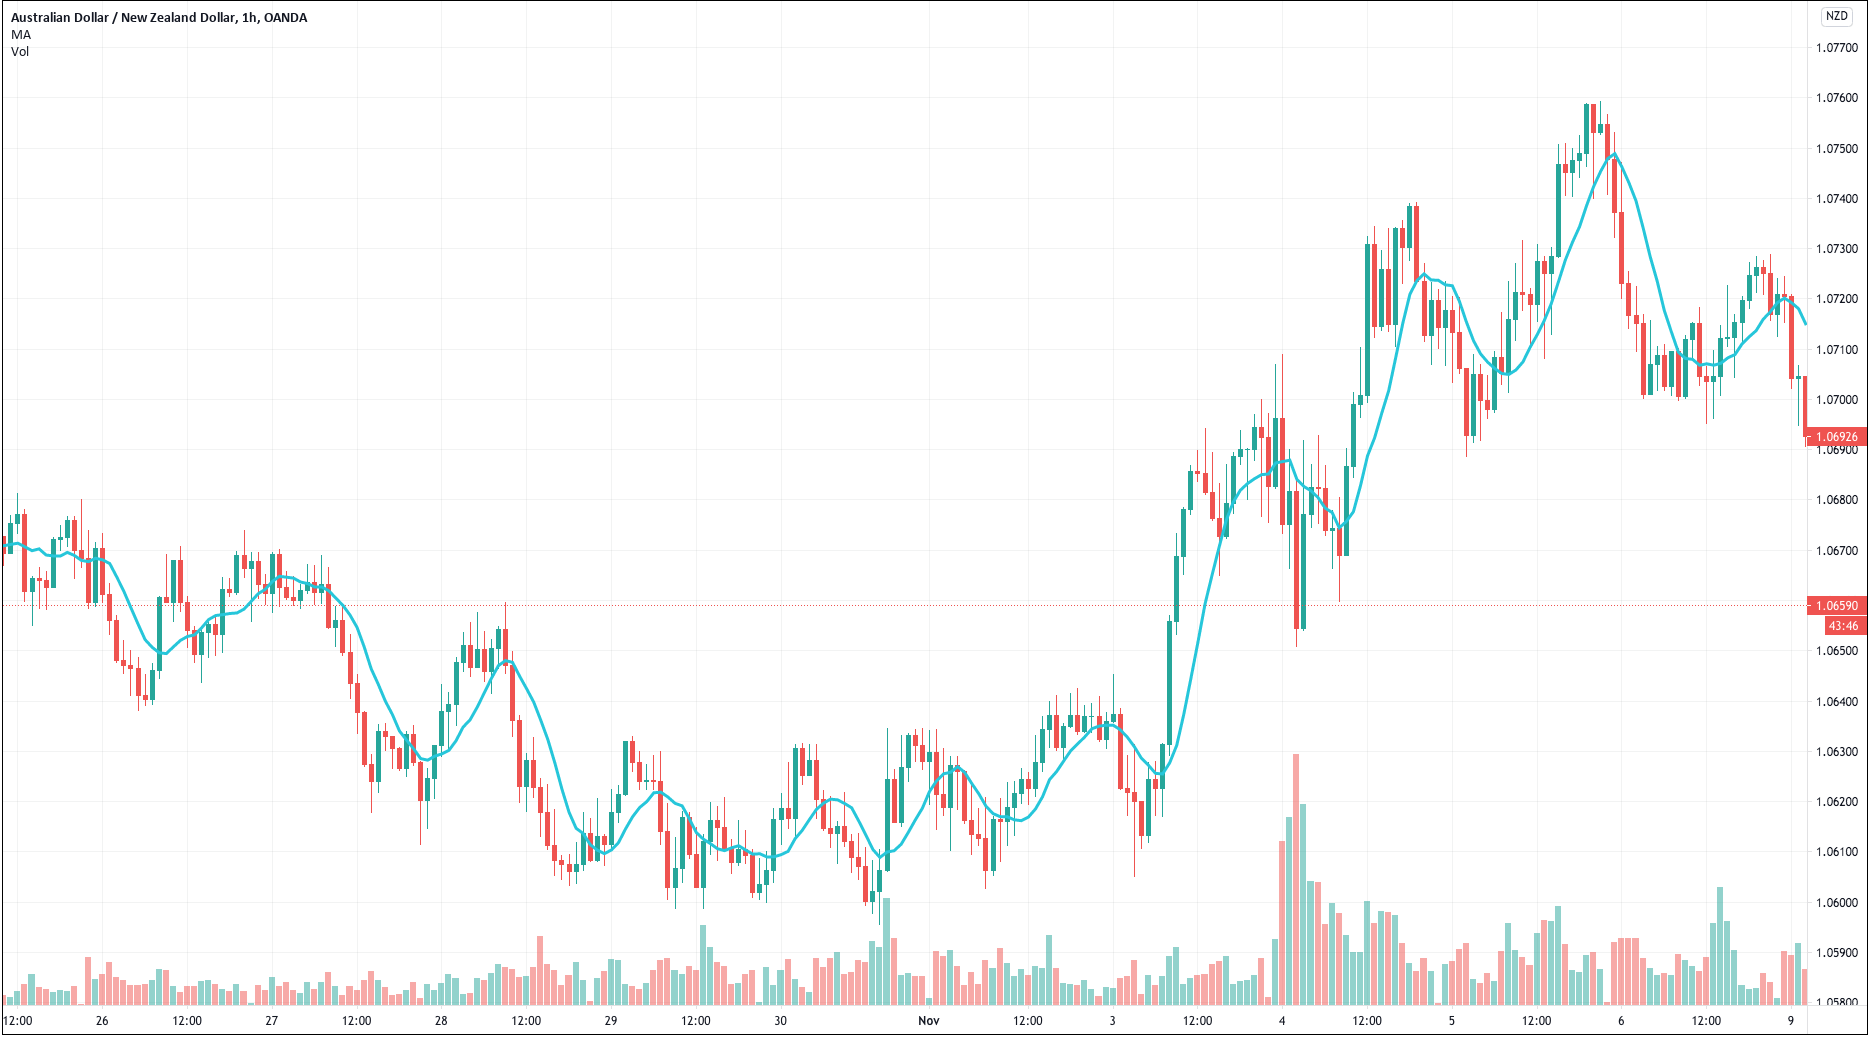
- price above/below a moving average
- Moving average crossovers
- Overbought/oversold conditions using an indicator such as the MACD, the RSI, or the Stochastic
- A momentum indicator to spot a new market direction
- Volatility spikes
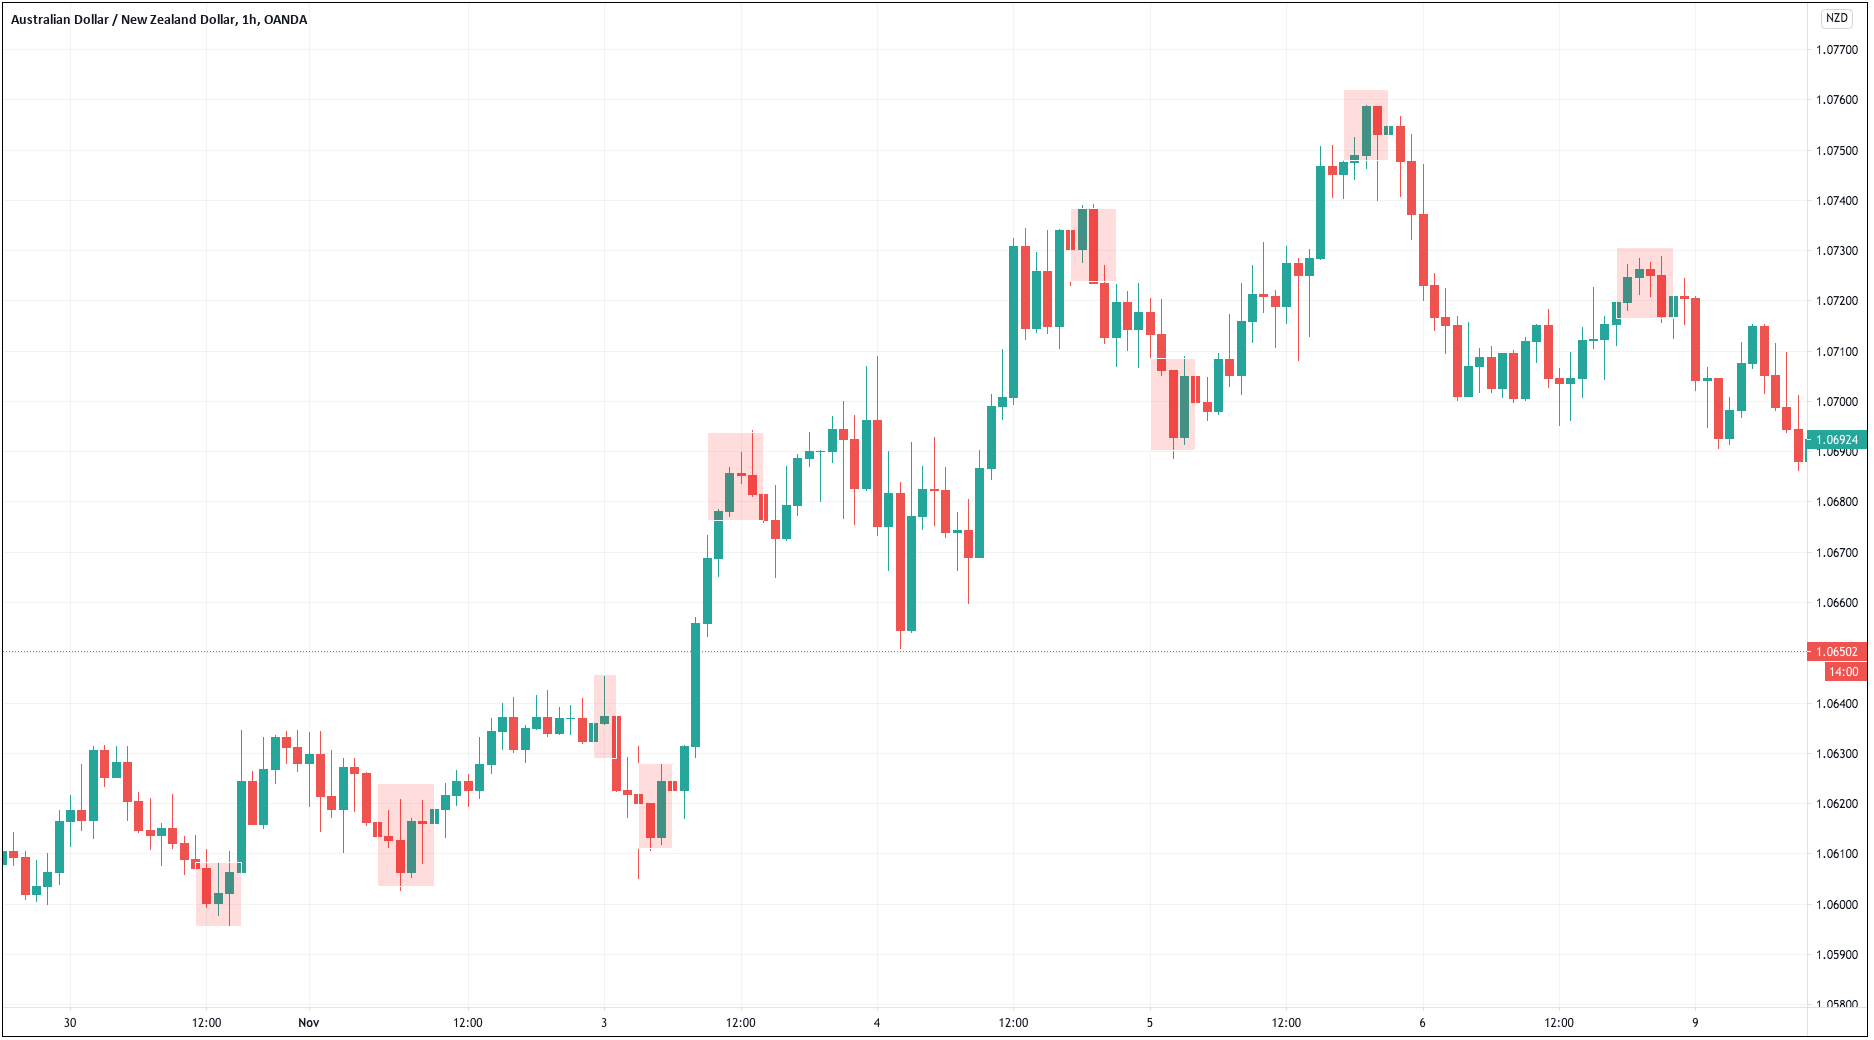
- Candlestick reversal formations
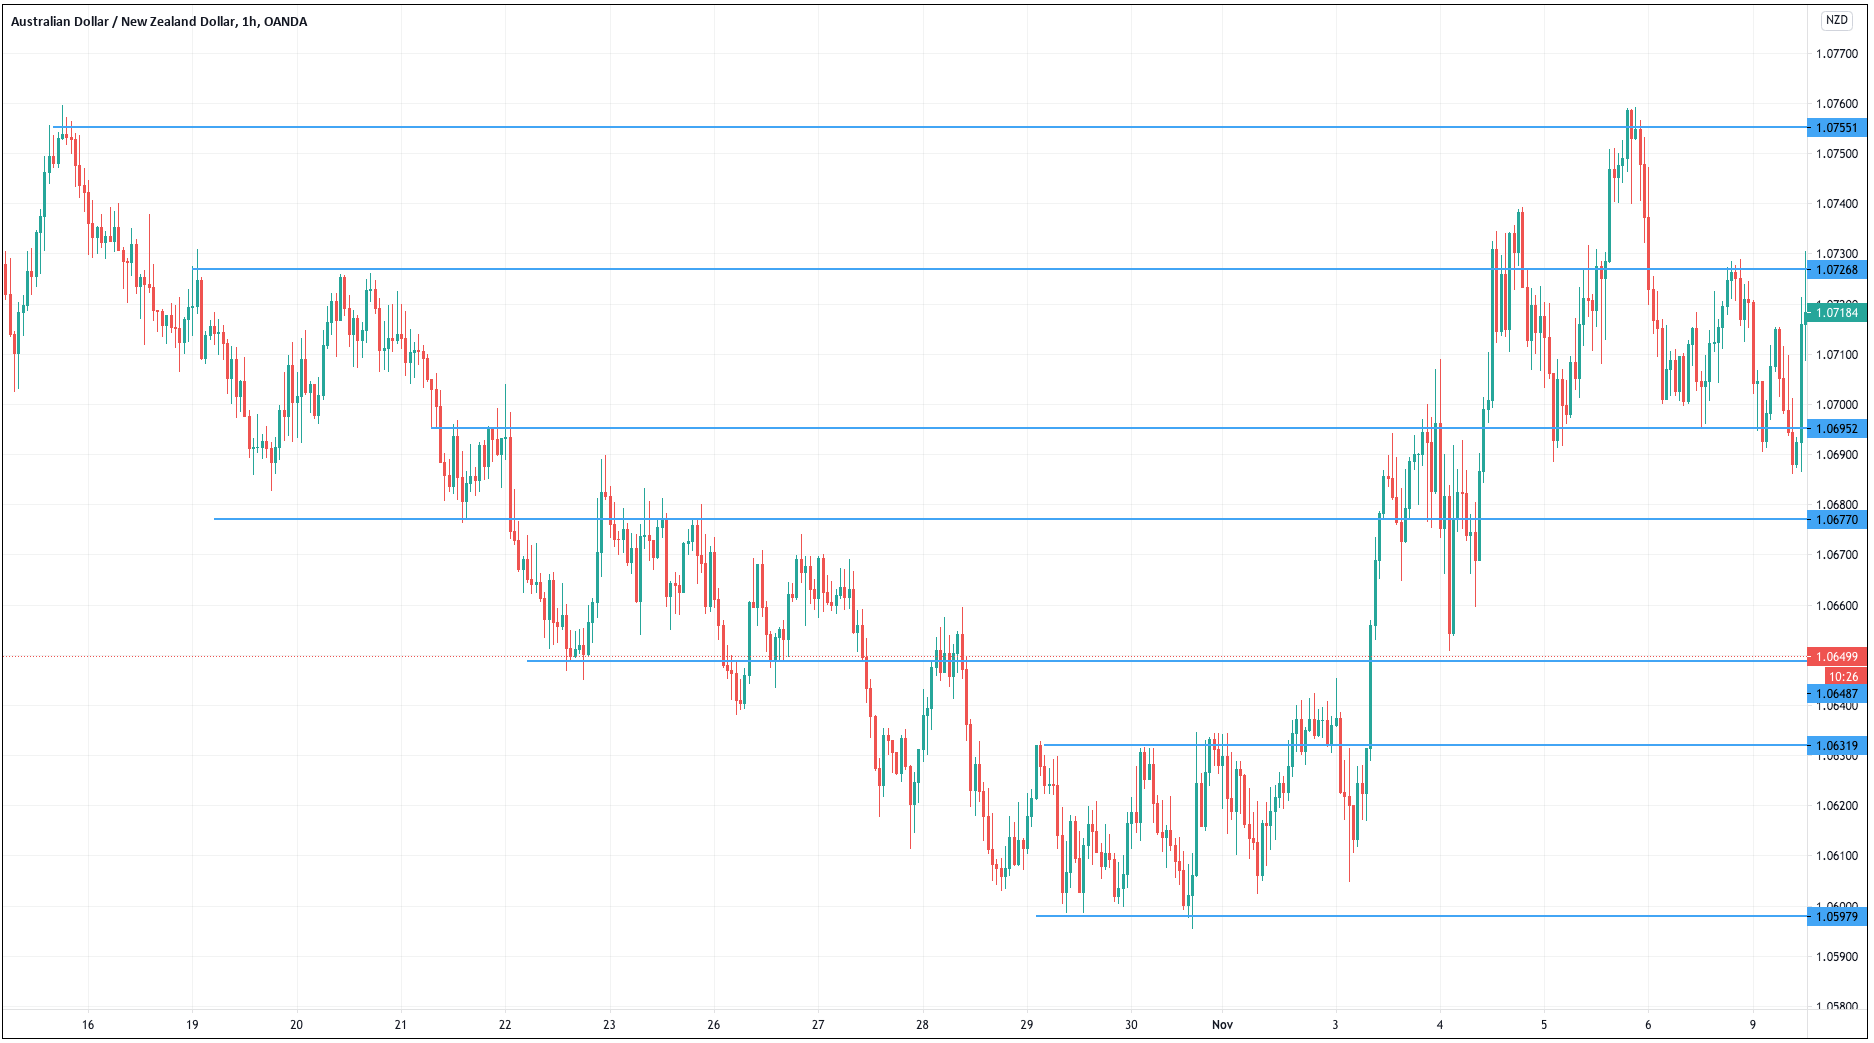
- Support/resistance levels
Please bear in mind that the market already knows all these key concepts. Therefore, their direct application would probably fail.
Testing the Idea
 The first step to see if the idea has merit is to test it in a historical sample under the market conditions it was supposed to operate. Of course, a trading idea is almost always referring to a market entry, as the concept is supposed to time the market. This entry is usually combined with a stop-loss and a take-profit to create a complete solution.
But, to test the efficacy of the idea, we should forget the stop-loss and take-profit and use a standard exit, be it,
- After n bars
- After a percentage profit
- A random exit.
If you don’t have the means or skills to code, the best solution is closing after a determined number of bars. You can even register the results of closing after 5, 10, and 20 bars, so we test the predicting power at increasing time intervals.
You could also use Tradingview.com to perform the test; therefore, we recommend you open a free account there. The free account gives most of the capabilities of a pro account but is limited to fewer indicators.
There are four kinds of testing:
- Historical backtest
- Out‐of‐sample test. Also called forward test
- Walk‐forward test
- Real‐time testing
Historical backtest

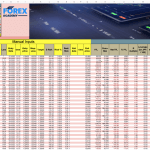
The Historical backtest is the simplest test. You will need to create a spreadsheet with the required fields and computations.
After defining the rules of the trading idea, you define a start date, for instance, one year ago. For initial testing, it is recommended not to register the trades with spreads and commissions. Just the brute profit.
- Set the desired timeframe and move your chart so that the initial date is near the chart’s right end.
- From there, you shift your chart one by one.
- When you spot an entry point, you write it down in your trading log:
- Trade #
- Entry date and time
- Trade size: enter one lot
- Entry price
- Expected stop-loss: use a standard 2 ATR
- Expected target: use also 2ATR
- Exit price
- Exit date and time
- Maximum Adverse Excursion: Written down after the trade ended.
- Maximum Favorable Excursion: Write down the next pivot point higher/ lower than your exit.
- Compute the profit of the transaction.
- Trade #
- Continue the test until you reach at least 100 trades.
- Compute the statistical figures of your exercise
- Average profit: Sum of the profits / N, the number of trades
- The standard deviation of the profit = STD (profits)
Optimization
 After 100 backtested trades, the developer has enough information to detect the basic mistakes of the strategy. Maybe the entry has a large lag that hurts profits, or, worse, it is too early, thus triggering the stop-loss too often.
We could also spot if the stop-loss can be improved. Maybe it’s too close, so the percent winners are low or too far. The use of the Maximum Adverse Excursion info will surely help in deciding the best placement.
On the profit side, we can use the Maximum Favorable Excursion to check if the system is leaving money on the table. The idea is to adjust the profit target, so most of the trades end close to the MFE level.
Walk-forward Test / Real-time trading

After optimizing the strategy’s main parameters, we could begin a forward test, using a demo account and live market data. We should proceed as if it was a real trade. In this stage, if we use a demo account, you’ll be able to add the costs of the trade: Spread, slippage, and commissions.
This last stage before committing real money should last at least one month, preferably two or three months, during which you should continue detecting errors, improving the strategy, and having a feel of its behavior. In this stage and the coming use with real money, the trader needs to be disciplined and accept all signals the system delivers. You cannot cherry-pick the trades because this introduces a random factor that will change your system’s parameters, so you’re losing information about it.
Changing the parameters of the system
When trading it live for several trades, you may feel you need to optimize your system. This is wrong. Of course, you may adapt the system to the market, but modifying it too often is a mistake. You need to have statistical evidence that something has changed and the system is now underperforming. Therefore, at least 30 trades must occur before doing a change. In fact, since the distribution of results is not normally distributed, it would be optimal to wait for about 60-100 trades for a measure with statistical significance.
Starting light
That means you need to start slow, risking no more than 0.5 percent on every trade, or whatever you consider is small for you. That way, you won’t be affected psychologically, follow the system for the required time to have propper stats, and get a grip on the normal behavior of your strategy.