

As promised, in this article, we will go through the steps to create a custom strategy, from the initial idea to the implementation of signals, stops, and targets.
The skeleton of a trading Strategy
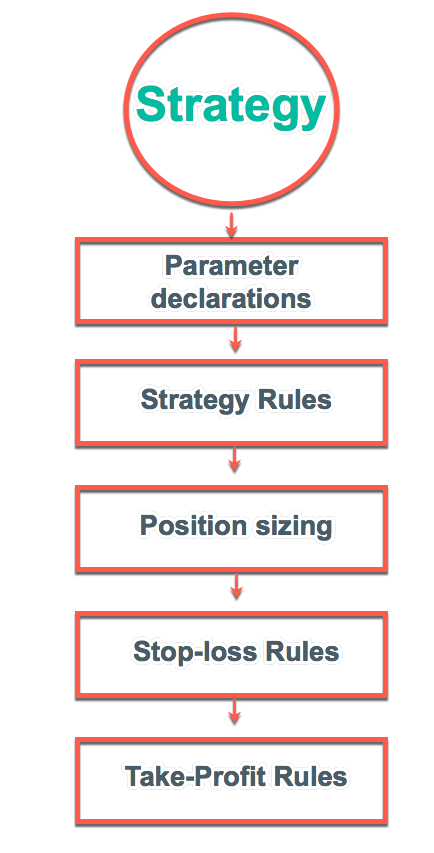
To create a strategy programmatically is relatively simple. We need to define the Parameters and the trade rules first, followed by the position sizing algorithm, the entry commands, and the stop-loss and take-profit settings.
Visualizing the idea
Human beings are visual. We may think our trading idea is fantastic, but translating it into code may not be straightforward. It is much easier to detect the errors if we see our rules depicted on a chart.
With the parameter declarations and trade rules, we can create an indicator first, so we can see how it appears. After we are happy with the visual
The idea
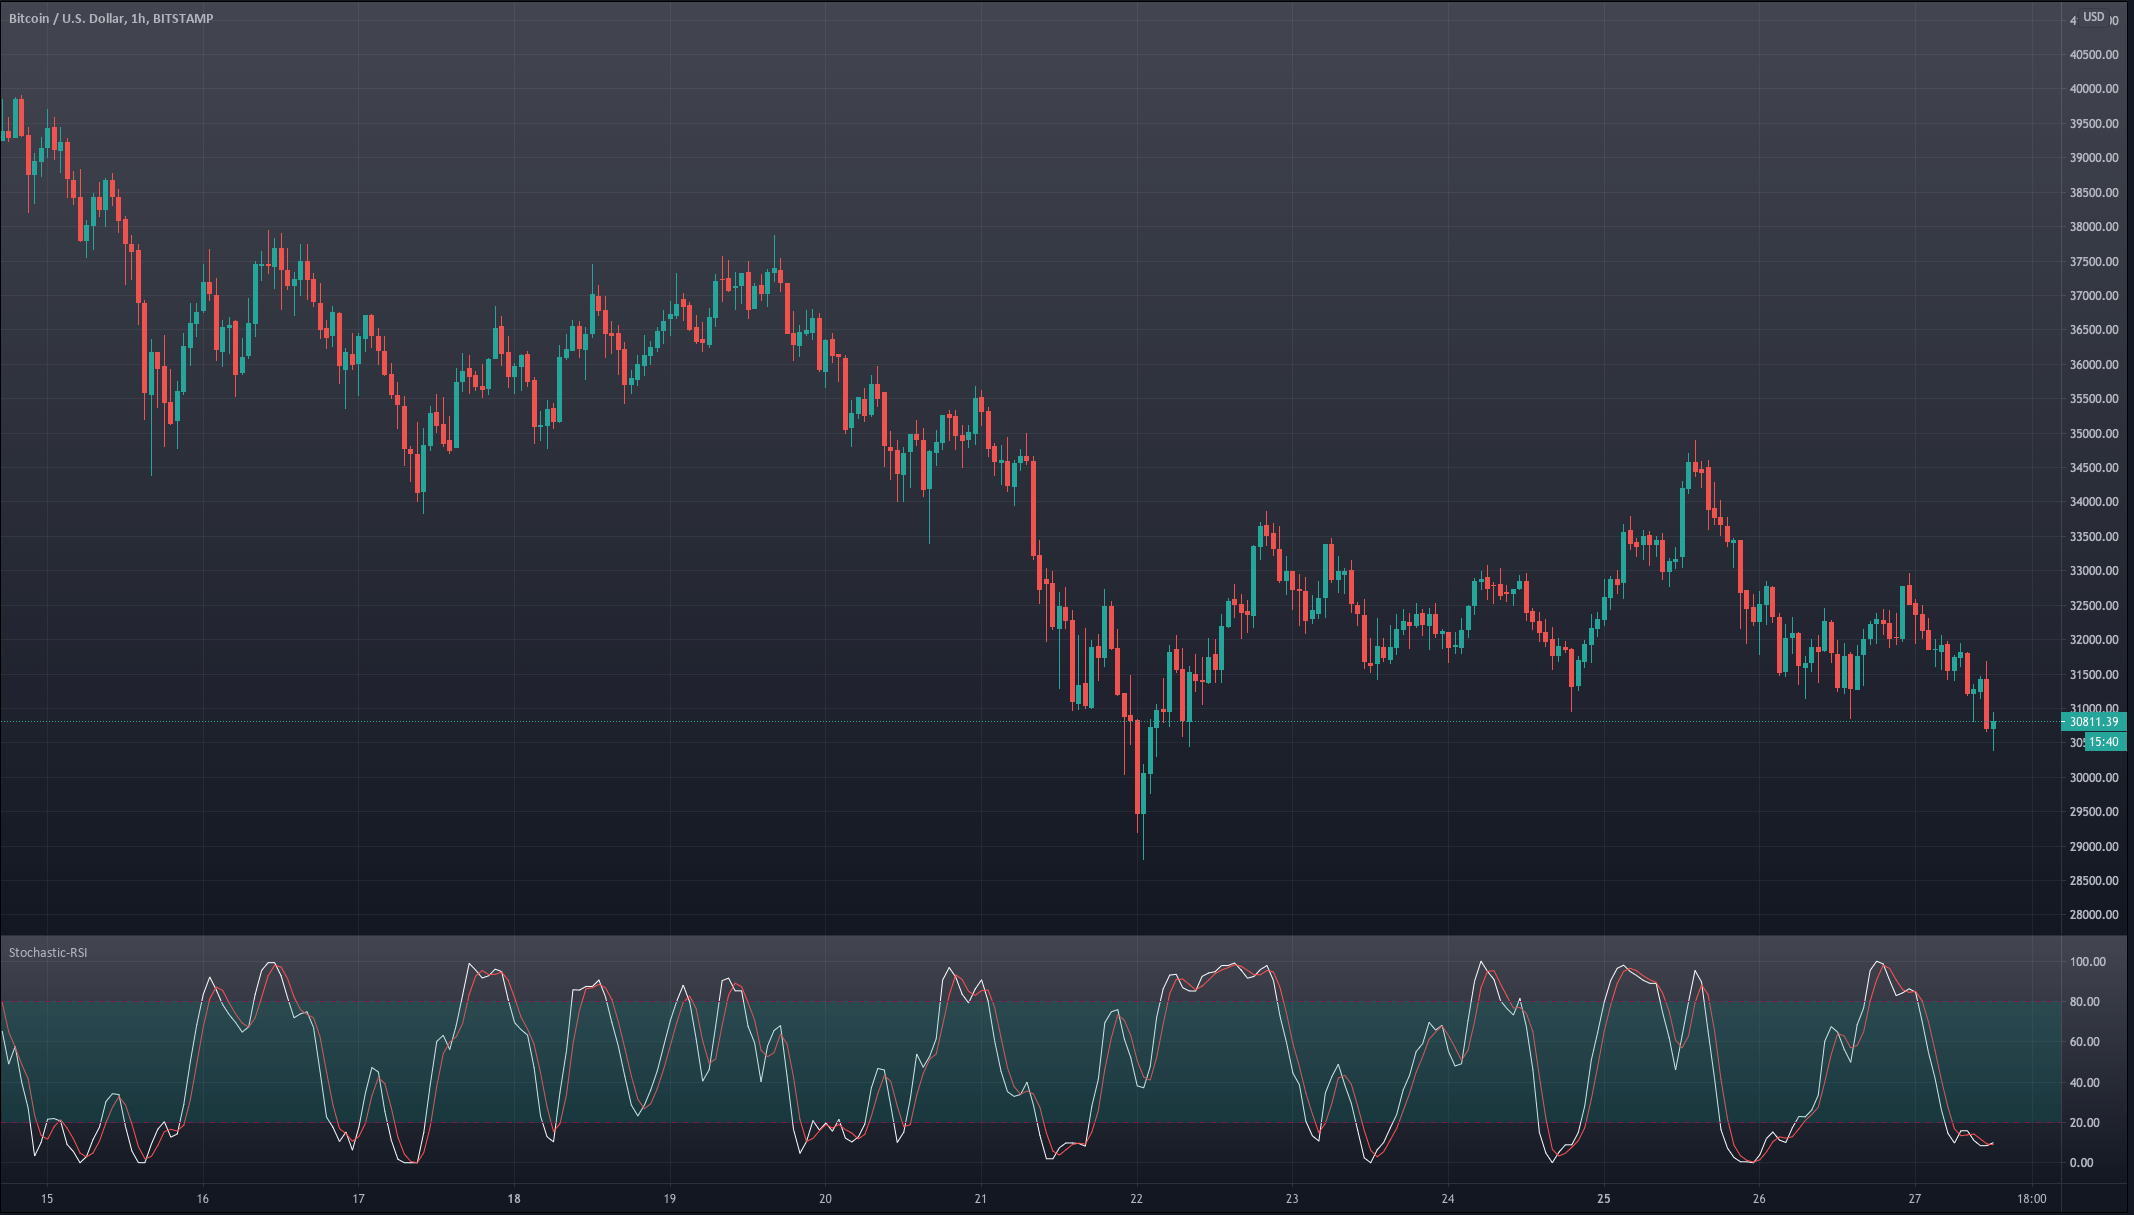
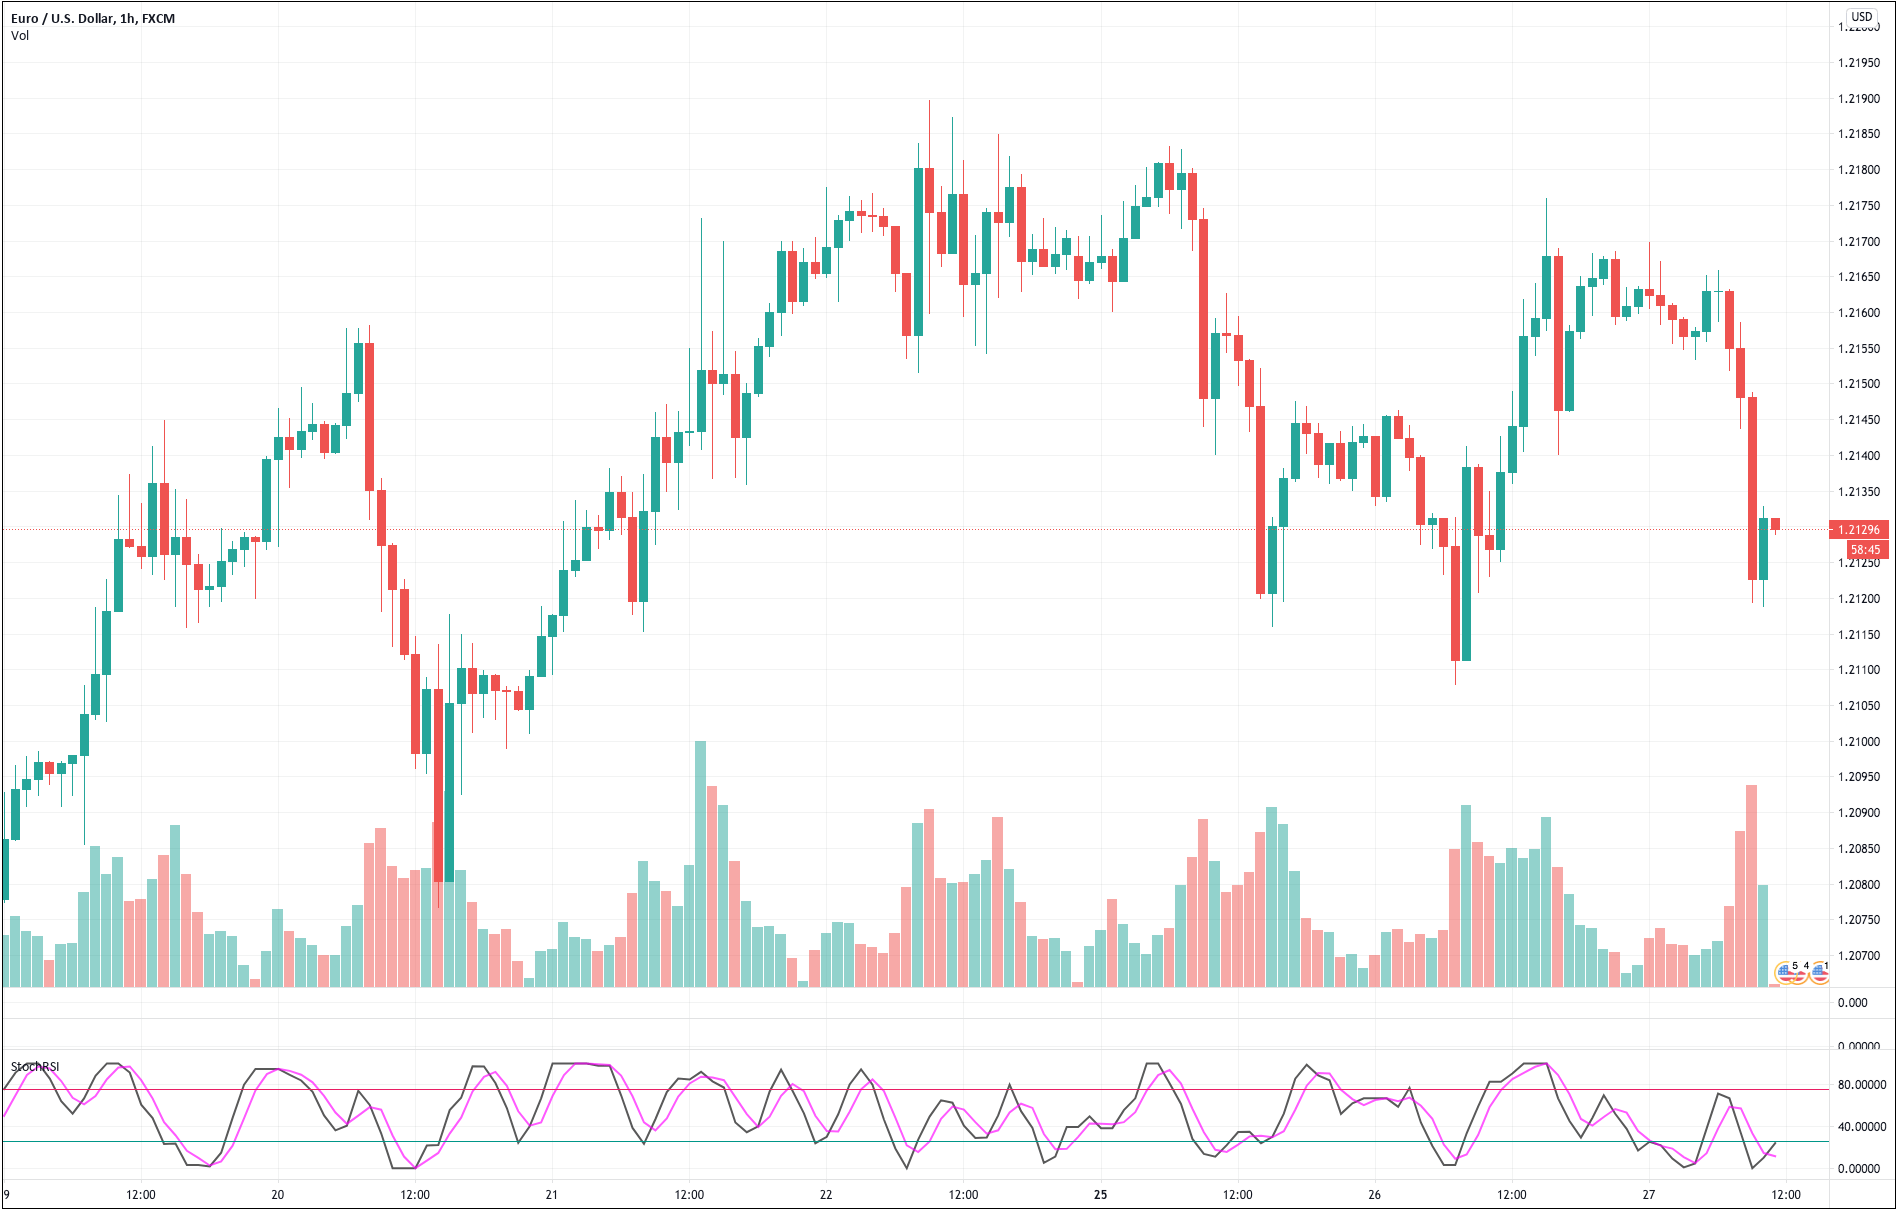 For our example, we will use a simple yet quite exciting indicator called Stochastic RSI, which applies the Stochastic study to the RSI values. This operation smoothes the RSI, and it reveals much better the turning points on mean-reverting markets, such as in Forex. Let’s see how it behaves as a naked strategy.
Diving into the process
First, you need to open an account with Tradingview. Once we are in, we create a new layout.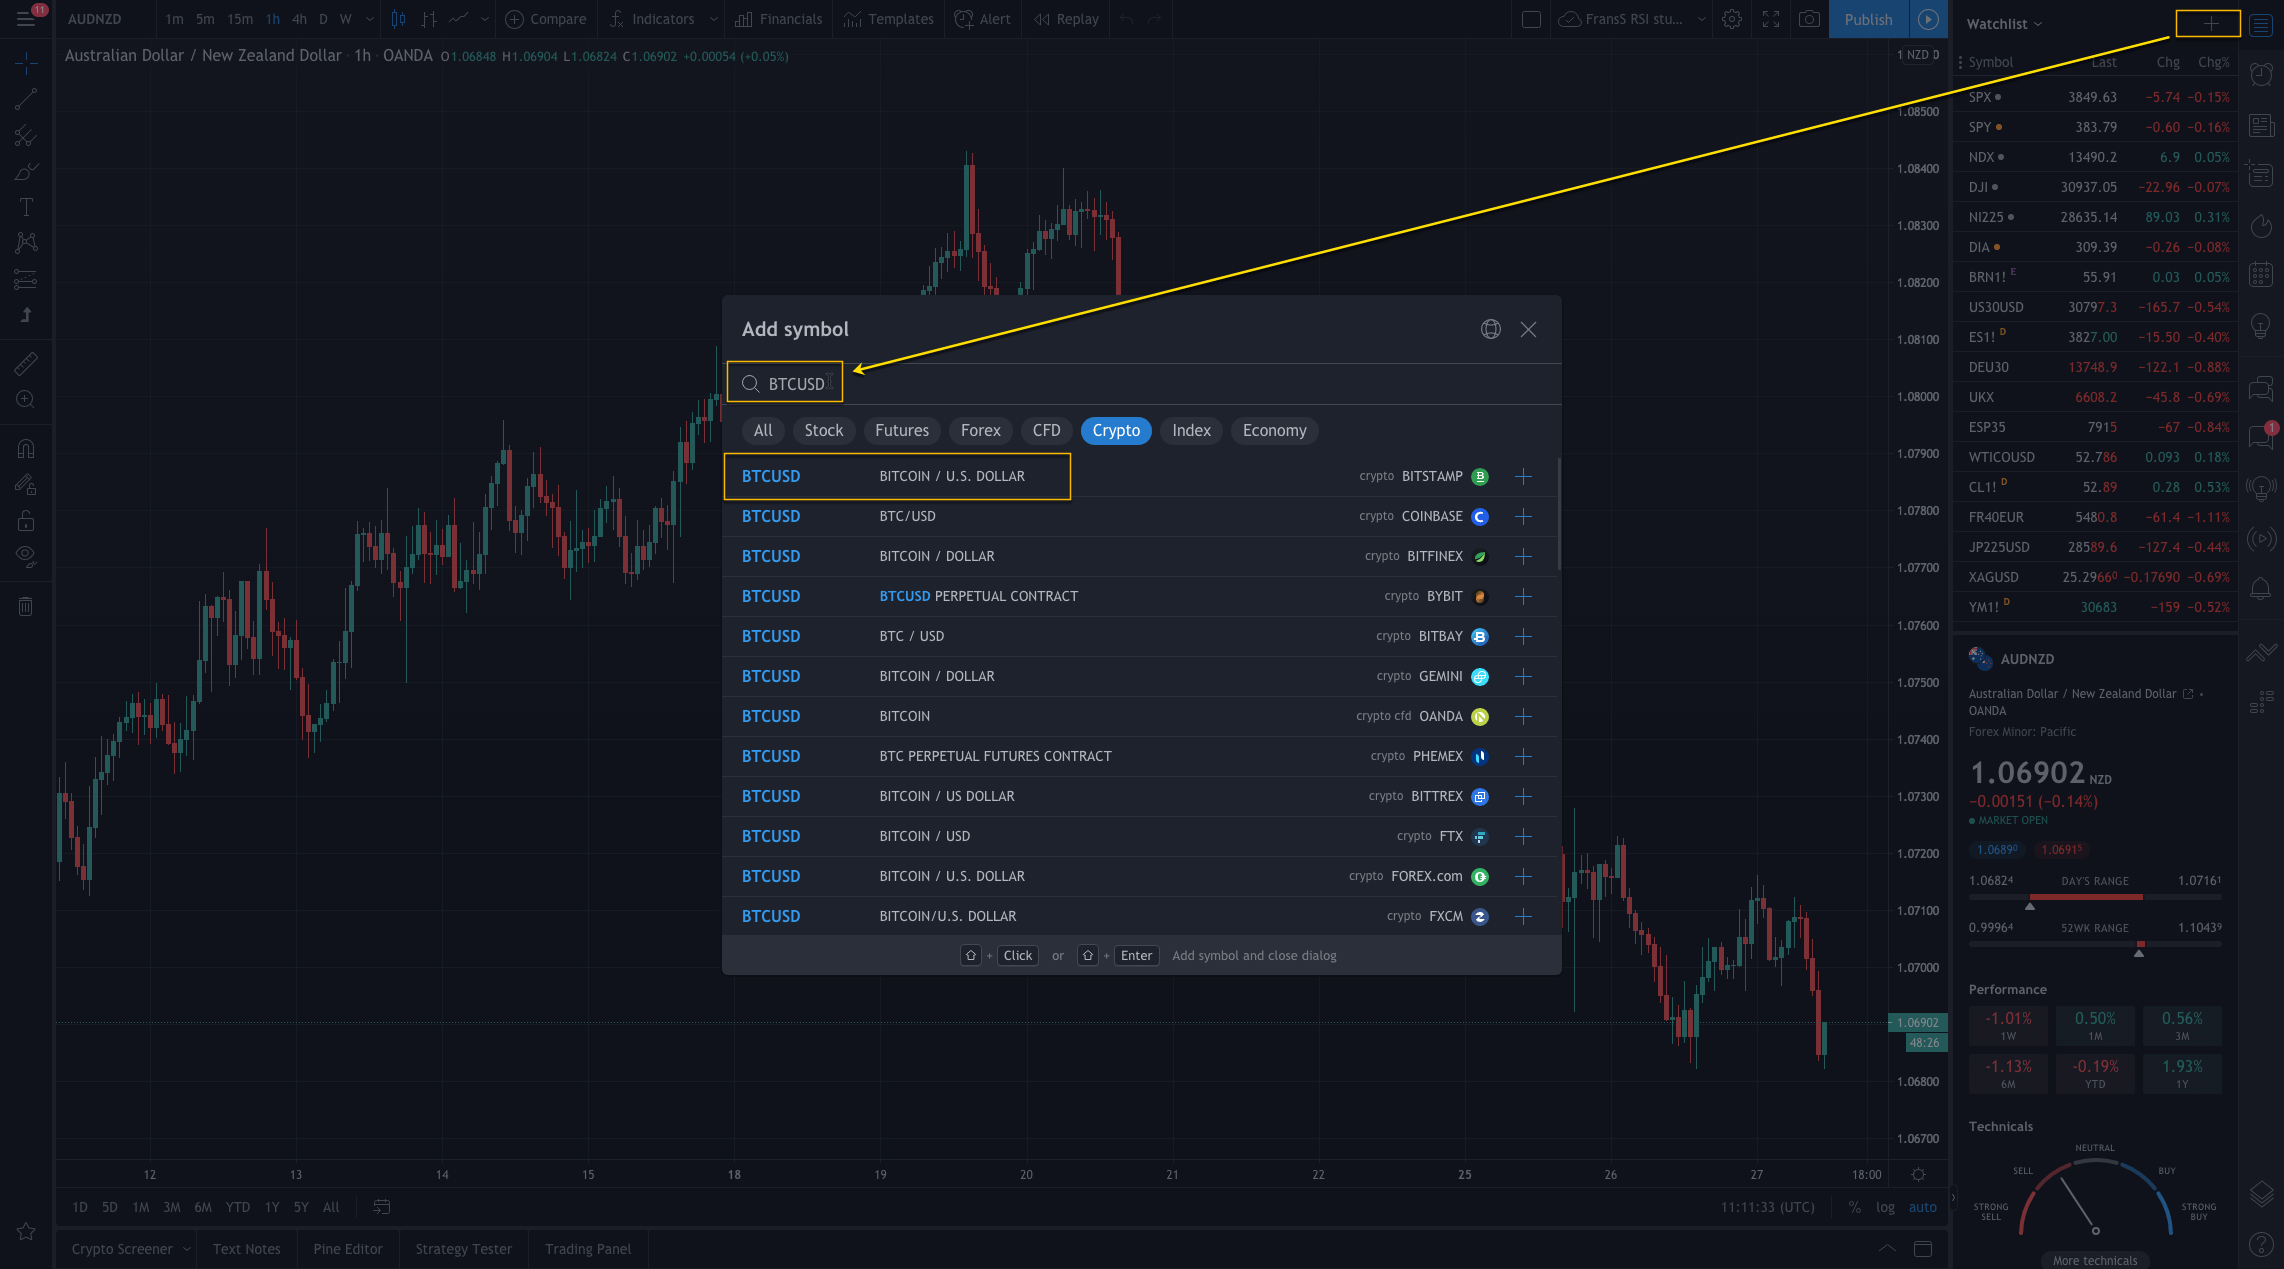
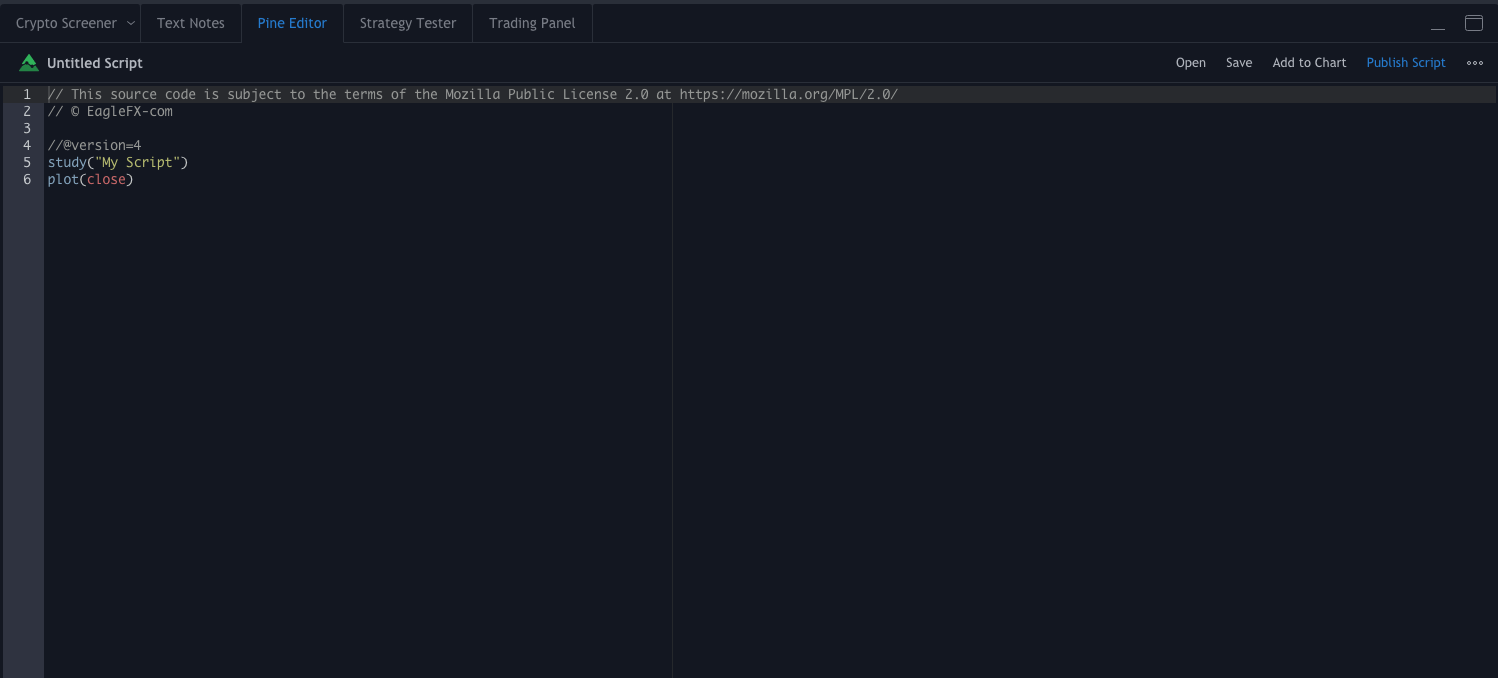
Then we open the Pine Editor.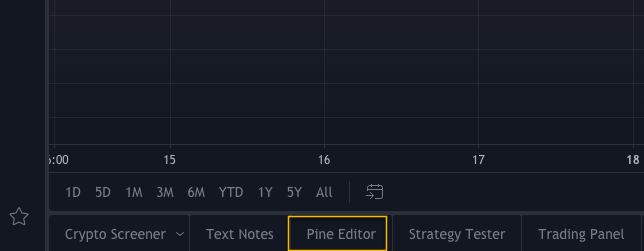
It appears in the bottom left of your layout. Click on it… and it shows with a basic skeleton code.
The Stochastic RSI code.
As said, to create the Stochastic RSI indicator, we will make the RSI and then apply the stochastic algorithm to it.
1 study(title="Stochastic-RSI", format=format.price, overlay = false)
This first line declares the code to be a study, called Stochastic-RSI.
format = format.price is used for selecting the formatting of output as prices in the study function.
Overlay = false means we desire the RSI lines to appear in a separate section. If it were a moving average to be plotted with the prices, overlay should be set to true.
RSIlength = input(14, "RSI-Length", minval=1)
We define the RSI length as an input parameter called RSI-Length.
src = input(close, title="RSI Source")
The variable src will collect the input values on every bar. The default is the bar close, but it may be modified by other values such as (o+c)/2.
myrsi = rsi(src, RSIlength)
This line creates the variable myrsi that stores the time series of the rsi.
This completes the calculation of the RSI.
smooth_K = input(3, "K", minval=1)
smooth_D = input(3, "D", minval=1)
These two lines create the smoothing values of the stochastic %K and %D. Since it comes from input, they can be changed at will.
Stochlength = input(14, "Stochastic Length", minval=1)
This code defined the variable lengthStoch, computed from the input parameter.
k = sma(stoch(rsi1, rsi1, rsi1, Stochlength), smooth_K)
d = sma(k, smooth_D)
These two lines completes the calculation of the stochastic rsi.
plot(k, "K", color=color.white) - Plot a white k line
plot(d, "D", color=color.red) - Plot a red d line.
To end this study, we will plot the overbought and oversold limits of 80 and 20, filling the mid-band with a distinctive color.
t0 = hline(80, "Upper Band", color=color.maroon)
t1 = hline(20, "Lower Band", color=color.maroon)
fill(t0, t1, color=color.purple, transp=80, title="Background")
The complete code ends as:
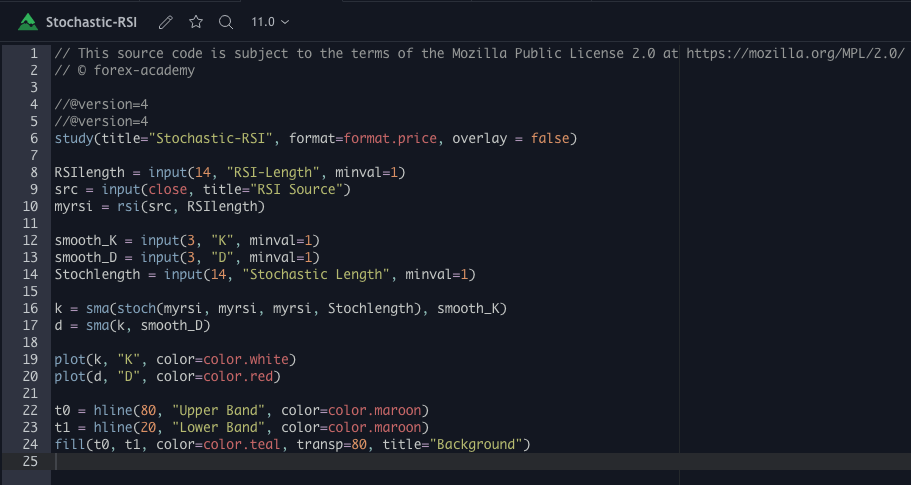
// This source code is subject to the terms of
// the Mozilla Public License 2.0 at https://mozilla.org/MPL/2.0/
// © forex-academy
//@version=4
study(title="Stochastic-RSI", format=format.price, overlay = false)

RSIlength = input(14, "RSI-Length", minval=1)
src = input(close, title="RSI Source")
myrsi = rsi(src, RSIlength)

smooth_K = input(3, "K", minval=1)
smooth_D = input(3, "D", minval=1)
Stochlength = input(14, "Stochastic Length", minval=1)

k = sma(stoch(myrsi, myrsi, myrsi, Stochlength), smooth_K)
d = sma(k, smooth_D)

plot(k, "K", color=color.white)
plot(d, "D", color=color.red)

t0 = hline(80, "Upper Band", color=color.maroon)
t1 = hline(20, "Lower Band", color=color.maroon)
fill(t0, t1, color=color.teal, transp=80, title="Background")
This code is shown in our layout as
Stay tuned for the second part of this article, where we will evolve the Stochastic RSI into a viable strategy.