

Trading Algorithms VIII – Two RSI algorithms
The Relative Strength Index (RSI) was created by Welles Wilder as a momentum oscillator that measures price movements’ speed. The RSI is bounded between zero and 100. According to its author, an overbought condition occurs when the RSI is above 70, whereas an oversold condition is the RSI below 30. RSI is one of the most popular indicators because of its simplicity and is included in all charting packages.
How to compute the N-period RSI
1.- go back N bars and compare the Close of that bar with the prior bar’s Close. If positive, add this value to a UP summation variable. If negative, add it to a Dwn summation variable. Do this for every bar in the period.
2.- After all summations have been performed, divide the results by N, the period. This will create an average of up and down changes: avgUp and avgDwn.
3.- The RS is the ratio of avgUP to avgDwn.
RS = avgUP/avgDwn
4.- Finally, the RSI can be calculated by a normalization operation to bounded it between zero and 100:
RSI = 100 – 100/(1-RS)
Spotting market tops and bottoms
Welles Wilder designed the RSI with a standard 14-bar period, so it was meant for short-term asset analysis. This indicator works at its best on mean-reverting market states. According to Mr. Wilder’s research, the RSI usually tops/bottoms ahead of the actual market top/bottom.
The basic form of RSI trading is shown in the RSI flowchart below.
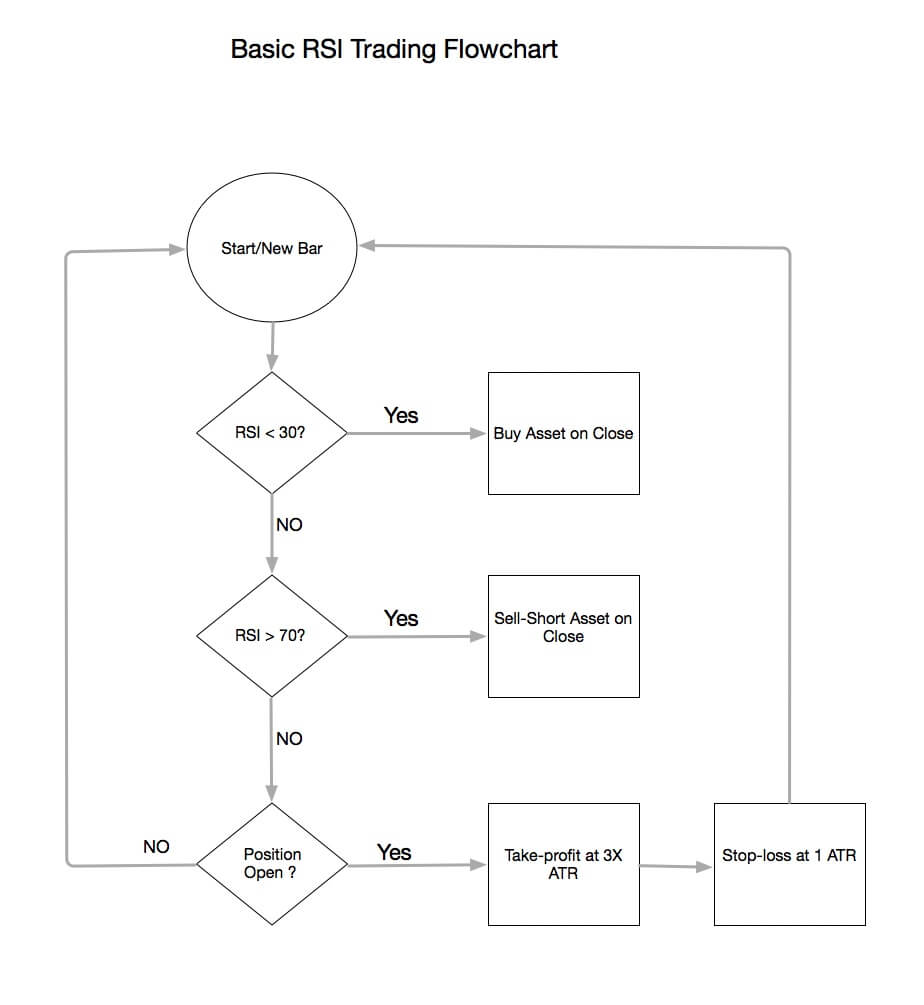
RSI Flowchart
The basic rules of the System are:
if   RSI(14-period) is below 30:
    Buy on Close
If RSI (14-period) is above 70:
    Sell-short on Close
If position = long:
    If Close > Entry_Price + 3xATR:
        Sell the open position on Close
    if Close < Entry_Price -1 ATR:
        Sell the position on Close
If Position= Short:
    If Close < entry-Price - 3xATR:
        Buy-to-cover the position on Close.
    if Close > Entry_Price - 1 ATR:
        Buy-to-cover the position on Close
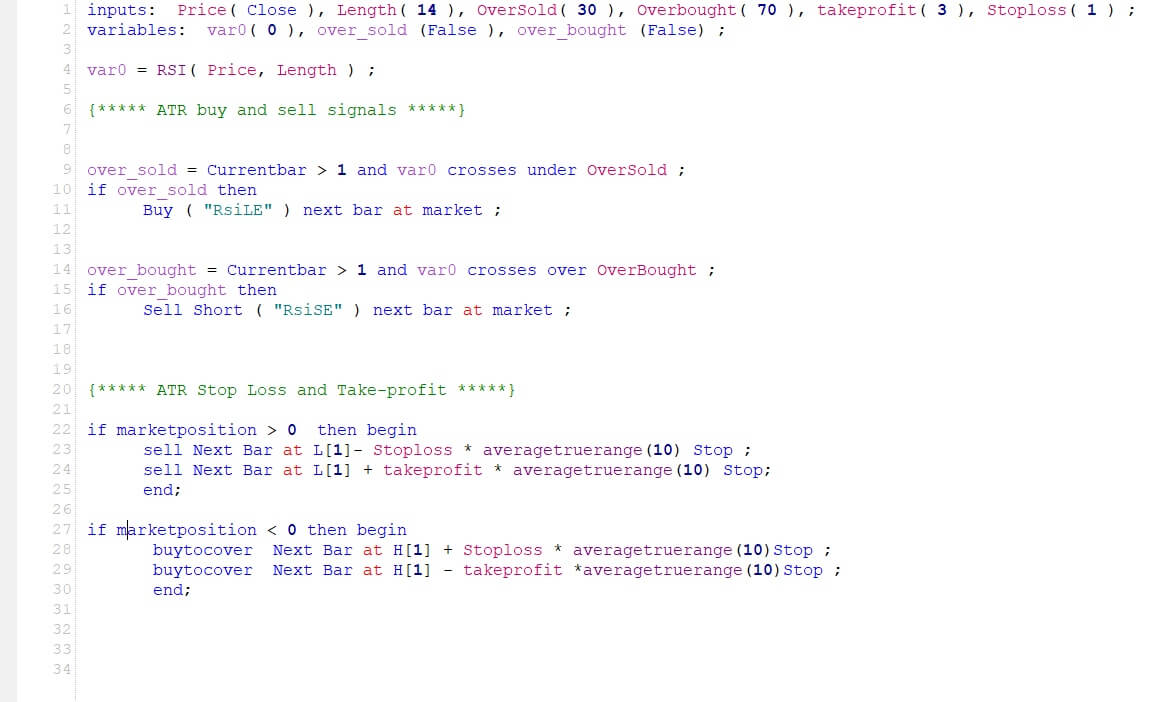
And below the code in EasyLanguage, for Tradestation and Multicharts platforms, with input parameters to allow for optimization of the length, overbought/oversold levels, as well as take-profit and stop-loss levels in the form of ATR multiples.
This algorithm works fine as long as it is applied to a non-trending, mean-reverting asset but fails when a trend has been established. Please, bear in mind that the strategy as-is will not work.
An optimized version, tested in the EURUSD pair from 2014 till 2020, showed the following equity curve and values:
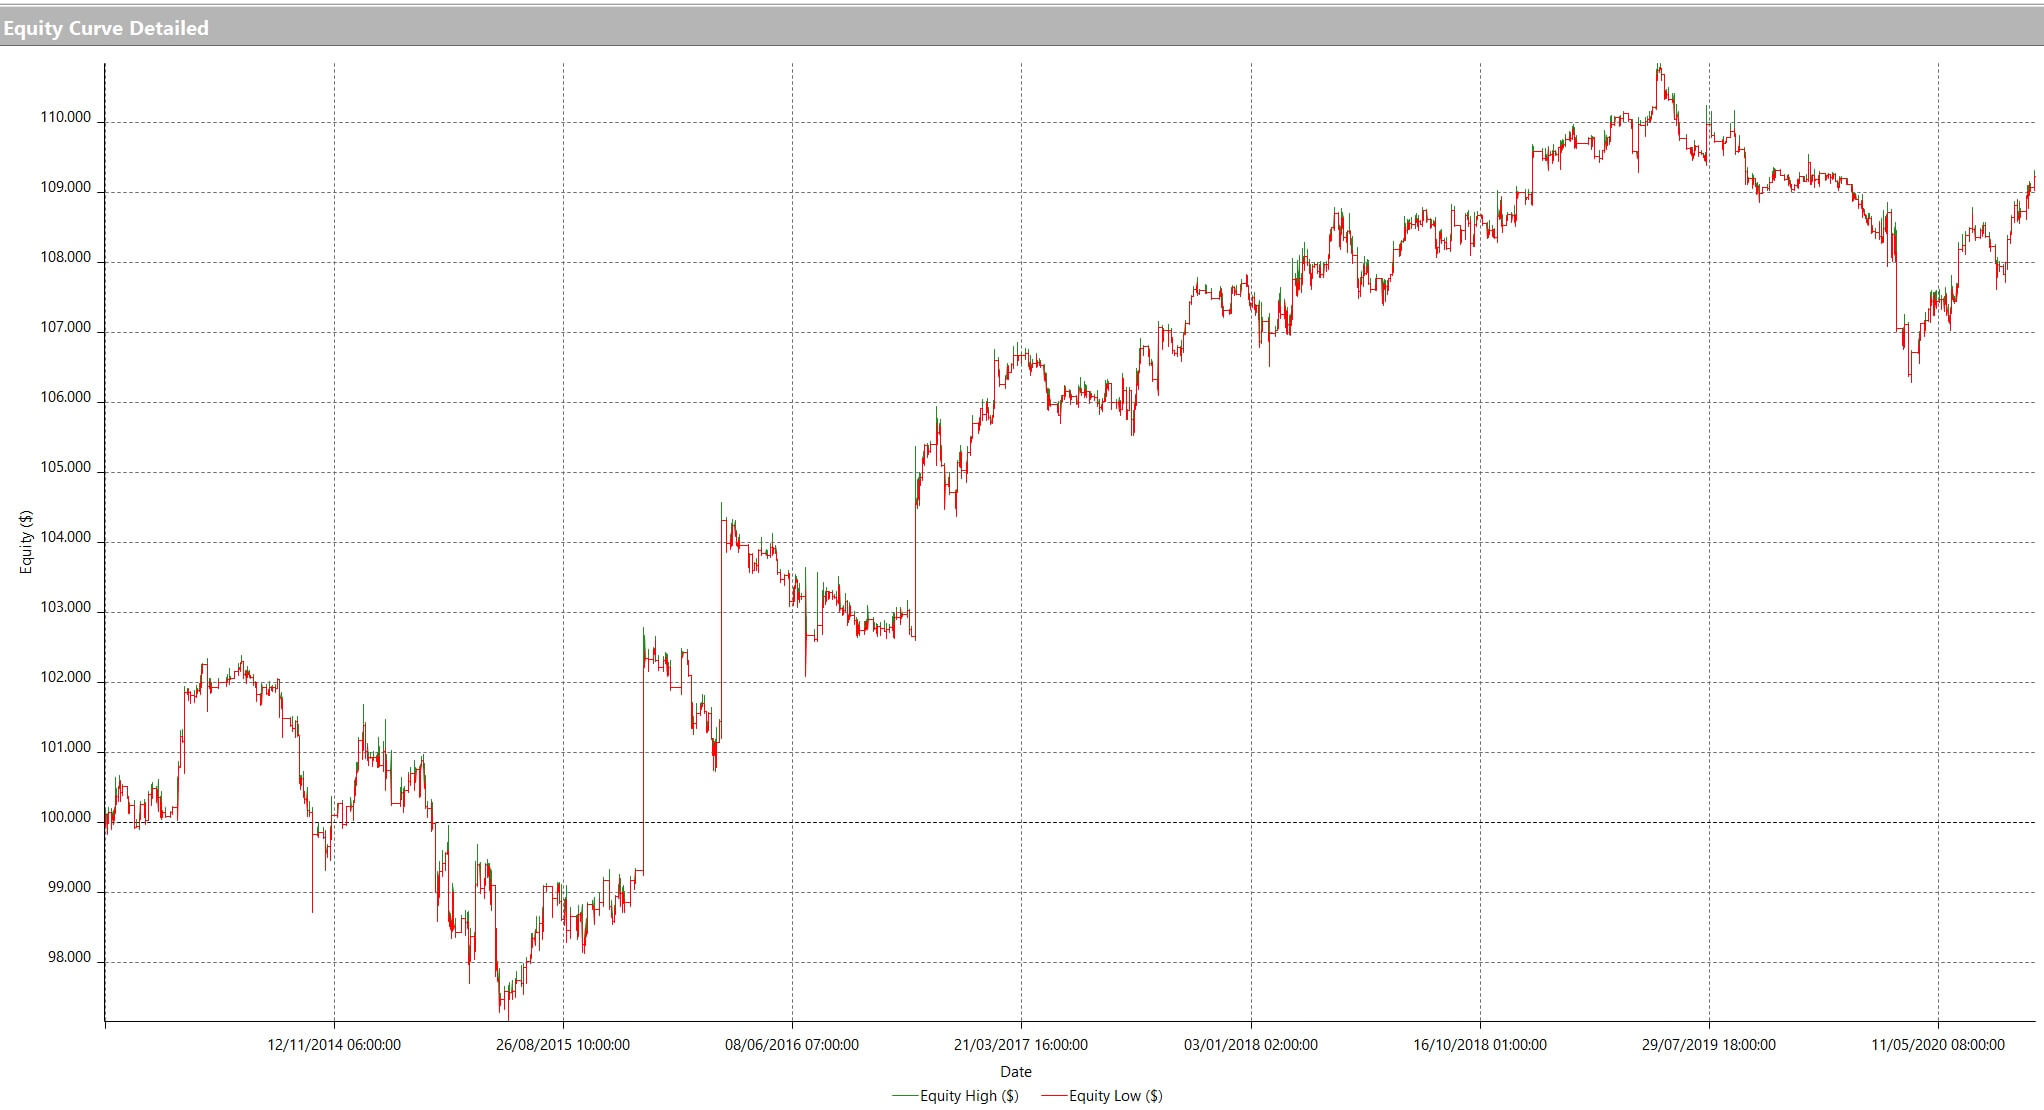
Equity Curve
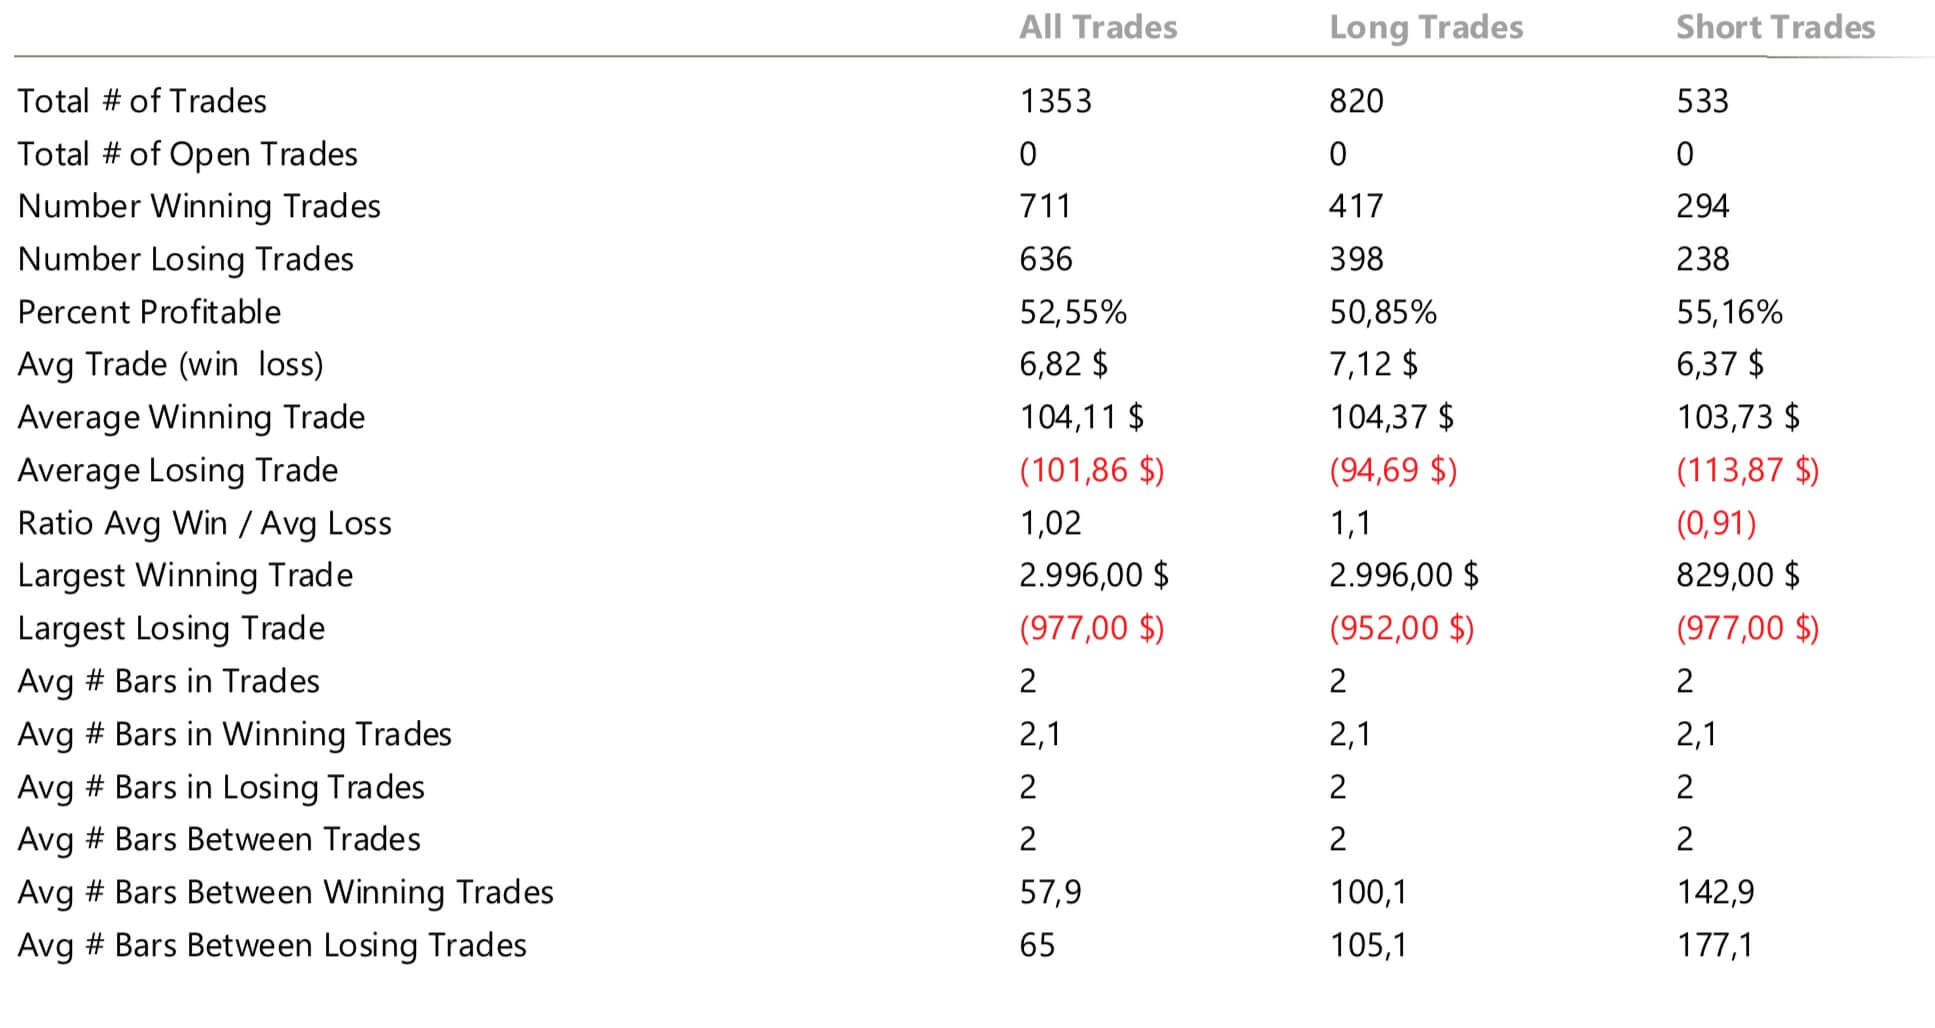
The results are a bit disappointing, as we see. After the optimization, the strategy shows only 52.55% profitable trades with a meager 1.02 reward/risk ratio. The RSI is very close to a coin-toss in performance, meaning the results are mostly due to chance. Furthermore, the average trade of $6.82 before commissions means a trader working using the classic RSI entries is really profiting his broker.
In our next video, we will cover a new way of using the RSI on trending securities.
APPENDIX: The RSI code for Easylanguage
inputs:  Price( Close ), Length( 14 ), OverSold( 30 ),
         Overbought( 70 ), takeprofit( 3 ), Stoploss( 1 ) ;
variables:  var0( 0 ), over_sold (False ), over_bought (False) ;

var0 = RSI( Price, Length ) ;

{***** ATR buy and sell signals *****}

over_sold = Currentbar > 1 and var0 crosses under OverSold ;
if over_sold then
    Buy ( "RsiLE" ) next bar at market ;

over_bought = Currentbar > 1 and var0 crosses over OverBought ;
if over_bought then
    Sell Short ( "RsiSE" ) next bar at market ;

{***** ATR Stop Loss and Take-profit *****}

if marketposition > 0  then begin
    sell Next Bar at L[1]- Stoploss * averagetruerange(10) Stop ;
    sell Next Bar at L[1] + takeprofit * averagetruerange(10) Stop;
    end;

if marketposition < 0 then begin
     buytocover  Next Bar at H[1] + Stoploss * averagetruerange(10)Stop ;
     buytocover  Next Bar at H[1] - takeprofit *averagetruerange(10)Stop ;
     end;