Categories
Forex Videos

Forex Trading Algorithms Part 8 Elements Of Computer Languages For EA Design!


Trading Algorithms VIII – Two RSI algorithms


The Relative Strength Index (RSI) was created by Welles Wilder as a momentum oscillator that measures price movements’ speed. The RSI is bounded between zero and 100. According to its author, an overbought condition occurs when the RSI is above 70, whereas an oversold condition is the RSI below 30.  RSI is one of the most popular indicators because of its simplicity and is included in all charting packages.


How to compute  the N-period RSI

1.-  go back N bars and compare the Close of that bar with the prior bar’s Close. If positive, add this value to a UP summation variable. If negative, add it to a Dwn summation variable. Do this for every bar in the period.

2.- After all summations have been performed, divide the results by N, the period. This will create an average of up and down changes: avgUp and avgDwn.

3.- The RS is the ratio of avgUP to avgDwn.

RS = avgUP/avgDwn

4.- Finally, the RSI can be calculated by a normalization operation to bounded it between zero and 100:

RSI = 100 – 100/(1-RS)


Spotting market tops and bottoms

Welles Wilder designed the RSI with a standard 14-bar period, so it was meant for short-term asset analysis. This indicator works at its best on mean-reverting market states. According to Mr. Wilder’s research, the RSI usually tops/bottoms ahead of the actual market top/bottom.

The basic form of RSI trading is shown in the RSI flowchart below.
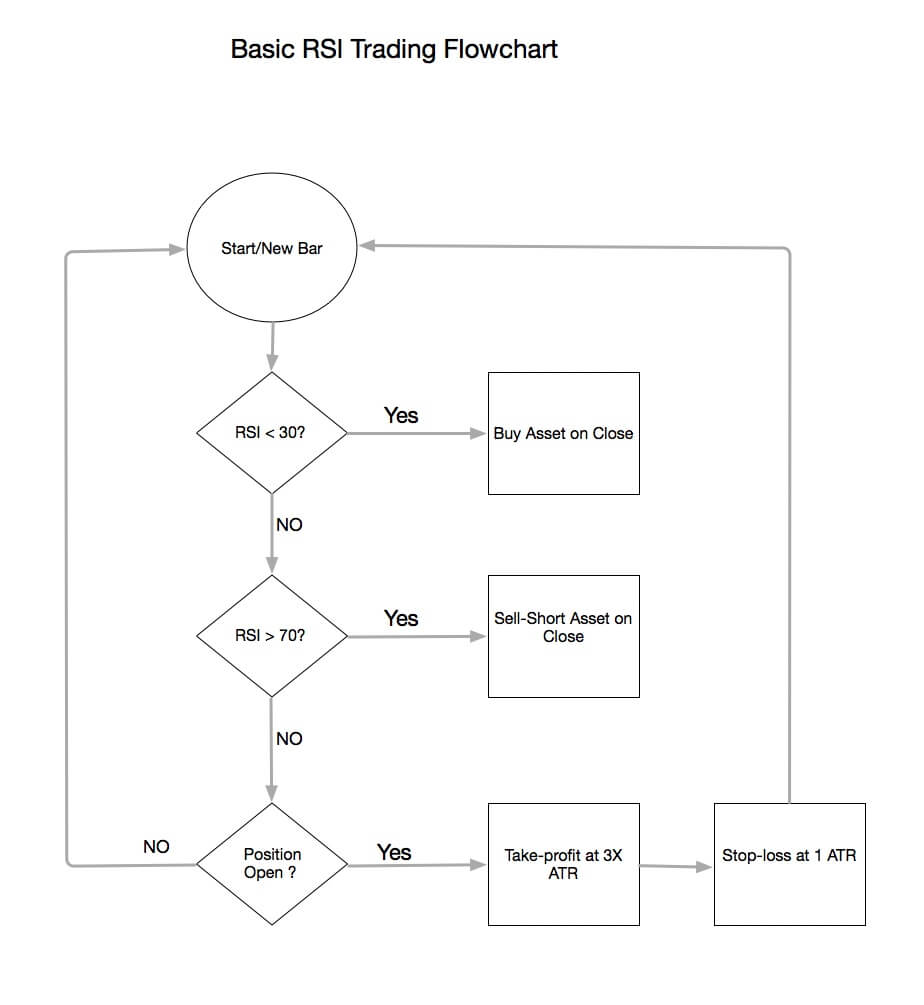
RSI Flowchart


The basic rules of the System are:

if   RSI(14-period) is below 30:
    Buy on Close
If RSI (14-period) is above 70:
    Sell-short on Close
If position = long:
    If Close > Entry_Price + 3xATR:
        Sell the open position on Close
    if Close < Entry_Price -1 ATR:
        Sell the position on Close
If Position= Short:
    If Close < entry-Price - 3xATR:
        Buy-to-cover the position on Close.
    if Close > Entry_Price - 1 ATR:
        Buy-to-cover the position on Close

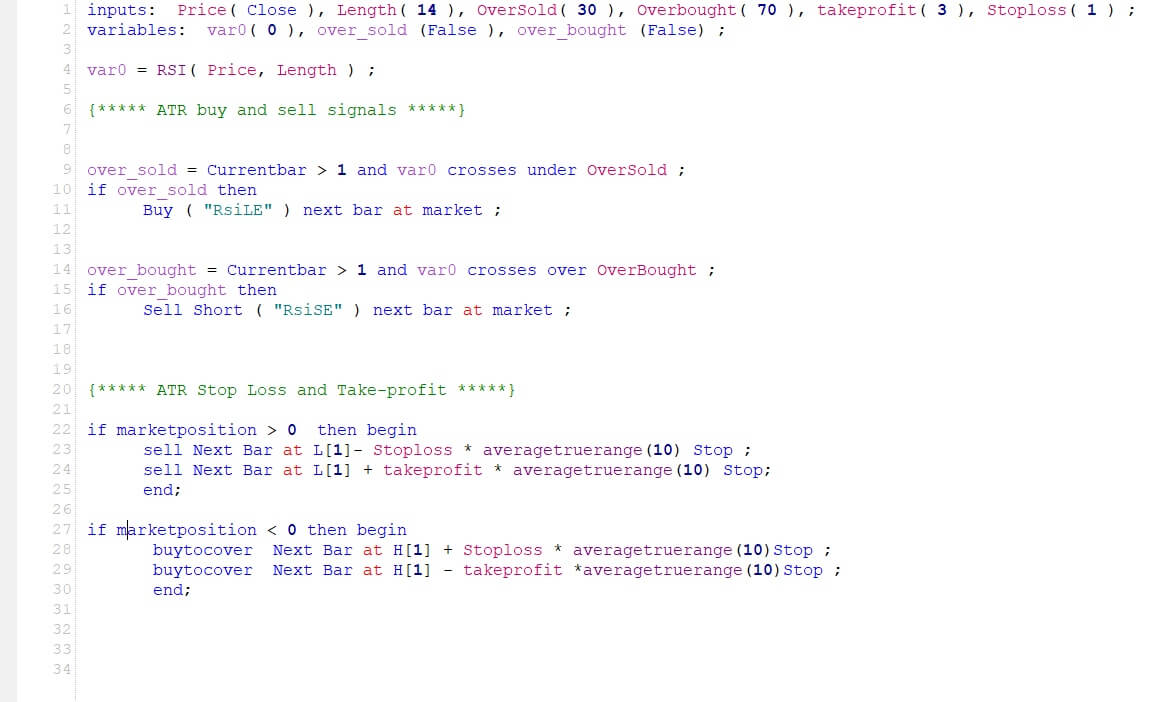
And below the code in EasyLanguage,  for Tradestation and Multicharts platforms, with input parameters to allow for optimization of the length, overbought/oversold levels, as well as take-profit and stop-loss levels in the form of ATR multiples.

This algorithm works fine as long as it is applied to a non-trending, mean-reverting asset but fails when a trend has been established.   Please, bear in mind that the strategy as-is will not work.

An optimized version, tested in the EURUSD pair from 2014 till 2020, showed the following equity curve and values:
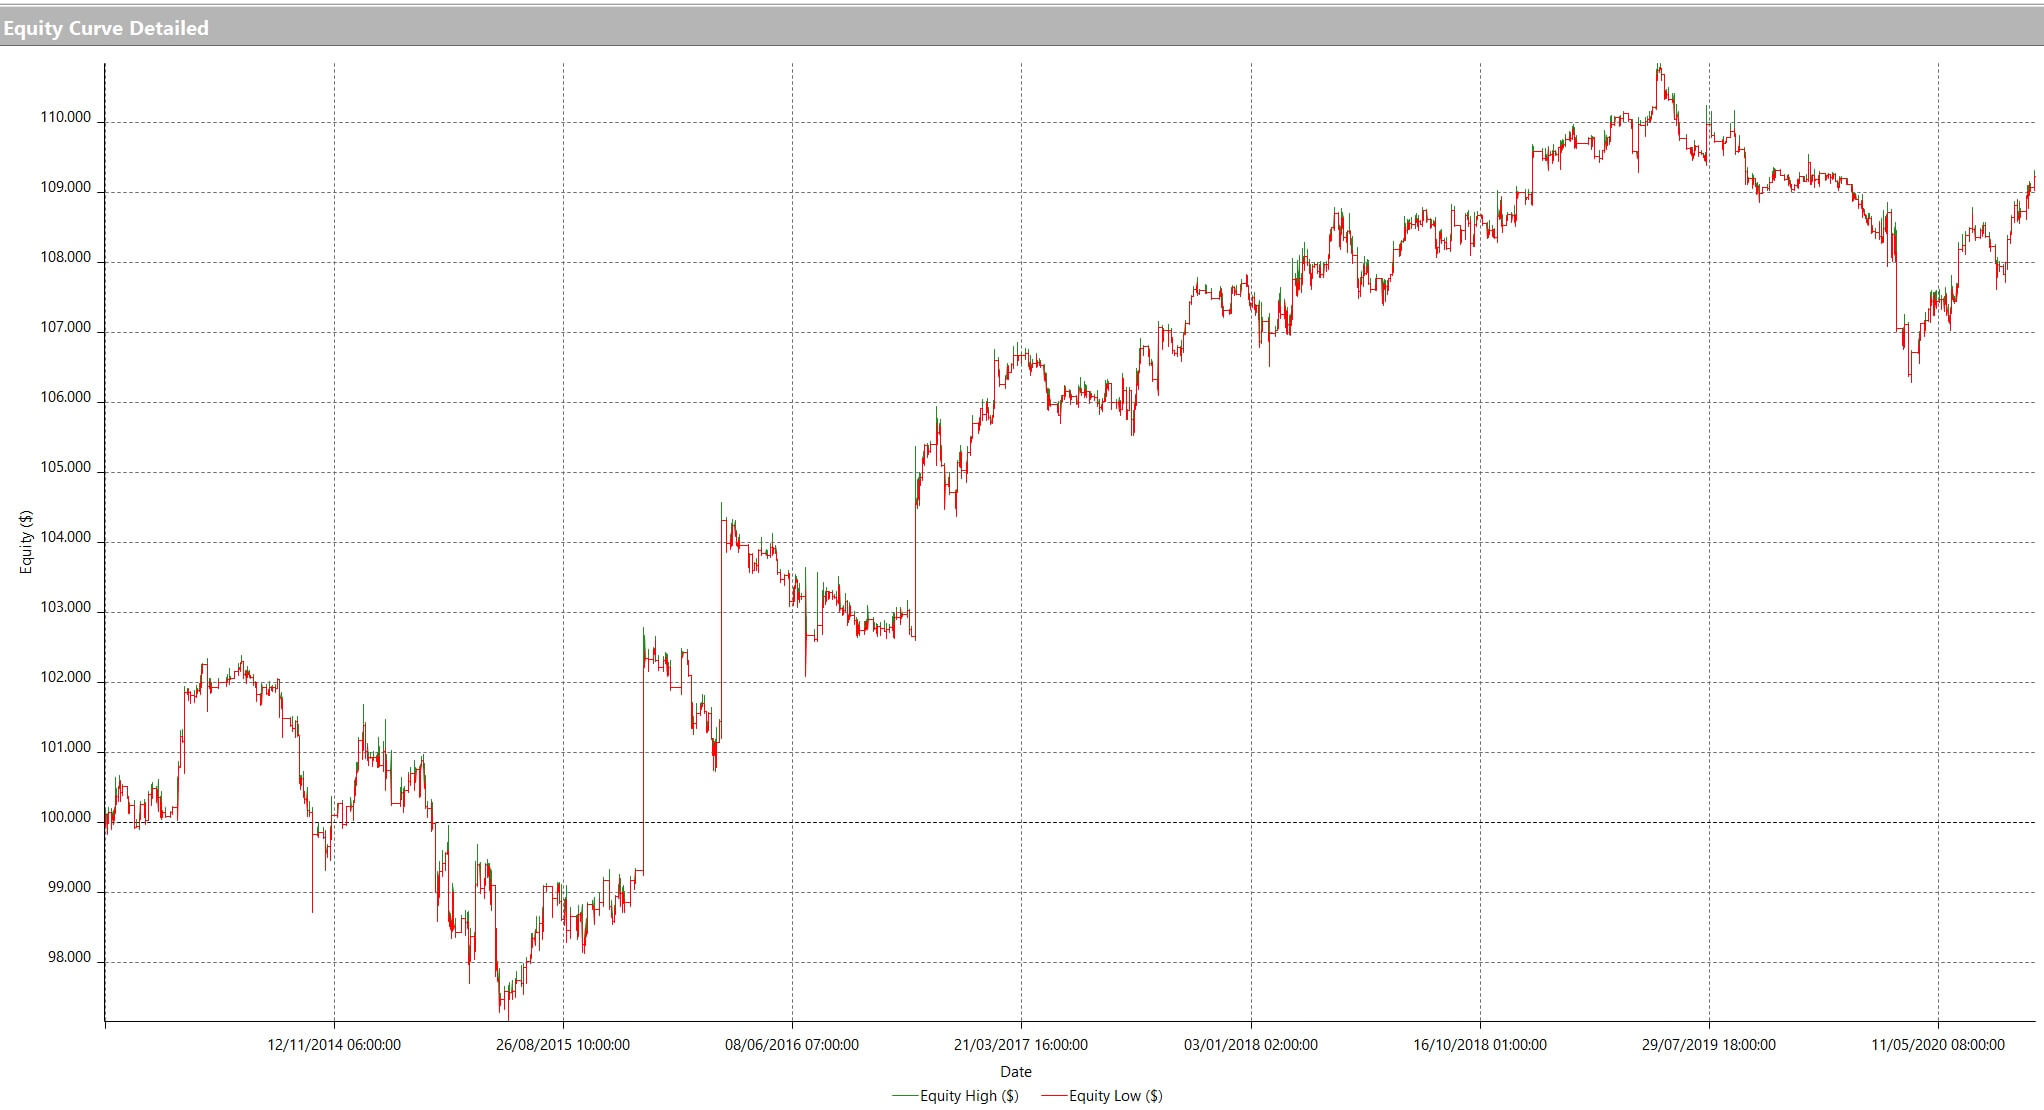
Equity Curve
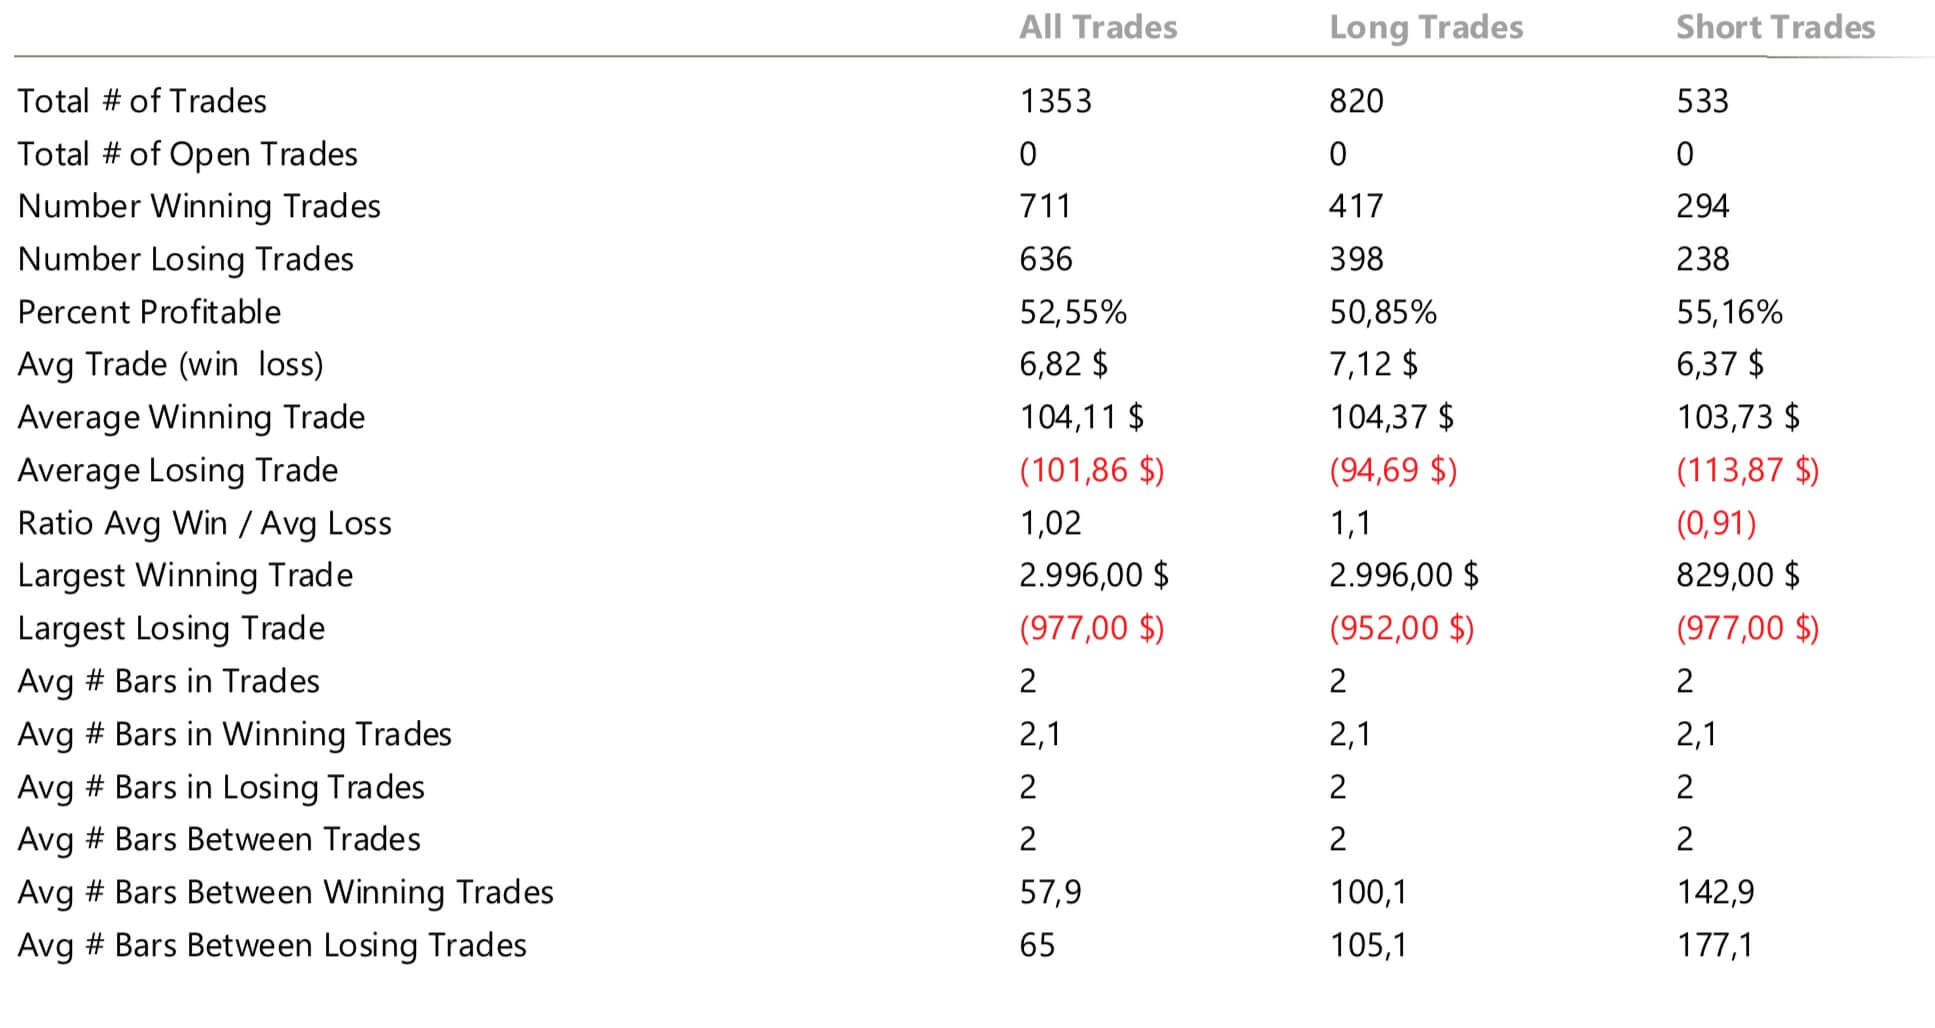
The results are a bit disappointing, as we see. After the optimization, the strategy shows only 52.55% profitable trades with a meager 1.02 reward/risk ratio. The RSI is very close to a coin-toss in performance, meaning the results are mostly due to chance.  Furthermore, the average trade of $6.82 before commissions means a trader working using the classic RSI entries is really profiting his broker.

In our next video, we will cover a new way of using the RSI on trending securities.


APPENDIX: The RSI code for Easylanguage

inputs:  Price( Close ), Length( 14 ), OverSold( 30 ), 
         Overbought( 70 ), takeprofit( 3 ), Stoploss( 1 ) ;
variables:  var0( 0 ), over_sold (False ), over_bought (False) ;

var0 = RSI( Price, Length ) ;

{***** ATR buy and sell signals *****} 

over_sold = Currentbar > 1 and var0 crosses under OverSold ;
if over_sold then                                                                    
    Buy ( "RsiLE" ) next bar at market ;

over_bought = Currentbar > 1 and var0 crosses over OverBought ;
if over_bought then                                                                    
    Sell Short ( "RsiSE" ) next bar at market ;

{***** ATR Stop Loss and Take-profit *****} 

if marketposition > 0  then begin 
    sell Next Bar at L[1]- Stoploss * averagetruerange(10) Stop ; 
    sell Next Bar at L[1] + takeprofit * averagetruerange(10) Stop;
    end;     

if marketposition < 0 then begin
     buytocover  Next Bar at H[1] + Stoploss * averagetruerange(10)Stop ; 
     buytocover  Next Bar at H[1] - takeprofit *averagetruerange(10)Stop ; 
     end;


Categories
Forex Videos

Forex Trading Algorithms Part 2 Converting Trading Strategy To EA’s! From Ideas To Code!


Trading Algorithms -From Ideas to code


As we have already said, computers are dumb. We need to explain to them everything. Moreover, digital computers are binary. They only understand ones and zeroes. Nothing else. 

Compilers and interpreters

To make our lives easier, we have created interpreters and compilers, able to translate our ideas into binary. Basically, both do the same job. Compilers produce a binary file that a computer can later execute, whereas interpreters translate each instruction as it comes in real-time.

From idea to the algorithm

Usually, traders think about when to enter and exit trades. An example brought by George Pruitt in his book The Ultimate Algorithmic Trading System Toolbox is the following. A trader wanted a code to enter the market and told him: 

” Buy when the market closes above the 200-day moving average and then starts to trend downward and the RSI bottoms out below 20 and starts moving up. The sell-short side is just the opposite.” 

No computer would understand that. In this case, the idea was partially defined, though: To buy when the price was above the 200-day SMA, and the RSI crosses down below 20. But what did he mean by “downward trend”? or “starts moving up”?

Pseudo-code

The first step to make a trading algorithm is to create an approximation to the code using plain English, but with more concise wording.

In the example above, Pruitt says that he could translate the above sentence into the following pseudo-code after some calls to his client:

The number inside brackets represents the close x days before the current session; thus, [1] is yesterday’s close.

In the pseudo-code, close below close[1] and close [1] below close [2] and close[2] below close[3] is the definition of a downtrend. But we could define it differently. What’s important is that a computer doesn’t know what a downtrend is, and every concept needed for our purposes should be defined, such as a moving average, RSI, and so forth.

The code

The next thing we need to do is move the pseudo-code to the actual code. There are several languages devised for trading. MT4/5 offers MQL4/5, which are variants of C++, with a complete library for trading. Another popular language is Easylanguage, created by Tradestation, which is also compatible with other platforms, such as Multicharts. Another popular language among quants is Python, a terrific high-level language with extensive libraries to design and test trading systems.

The code snippet above creates a Python function that translates the above code idea. In this case, the myBuy function must be told the actual asset to buy ( which should point to the asset’s historical data), and it checks for a buy condition. If true, it will return a label for the buy and the level to perform the buy, the next open of the asset in this case.

Systematic or discretionary?

The steps from idea to pseudo-code to code is critical. If you do not have a working algorithm, there is no way you could create a systematic trading system. But this is only the beginning. Creating a successful automated trading system is very hard and involves many developing, testing, and optimizing cycles. The market shifts its condition, and not always your system will perform. Then, you have to ask yourself if you’ll endure the drawdown stage until the market comes in sync with the system again.

Some systematic traders think that the best way to attack the market is to have a basket of uncorrelated trading systems, which are in tune with the market’s different stages: low-volatility trend, high-volatility trend, low-volatility sideways, high-volatility sideways, so your risk and reward is an average of all of them.

In the coming videos, we will dissect the steps to create an automated trading system. Stay tuned!