Introduction
After understanding various applications of the Fibonacci indicator, it’s time to learn about the next best indicator in technical analysis – Moving Average. MA is one of the most popular indicators in the technical trading community. This indicator, just like the Fibonacci Indicator, has a lot of applications and is commonly used by traders for different reasons.
A moving average smoothens the price movements and its fluctuations by eliminating the ‘noise’ in the market. By doing this, MAs shows us the actual underlying trend. A moving average is computed by taking the average closing price of a currency for the last ‘X’ number of candles. There are many moving averages depending on the number of periods (candles) considered.
Below is how a 5-Period Moving Average looks on the price chart.
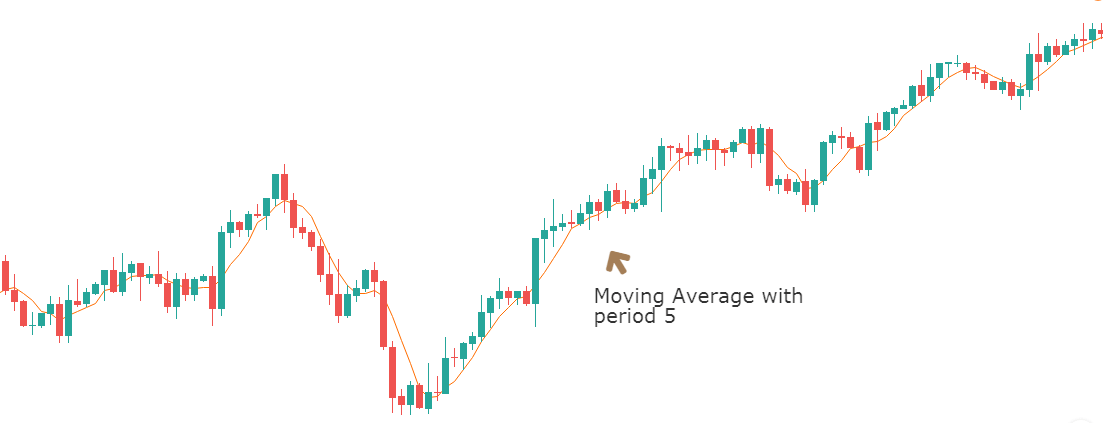
One of the primary applications of the Moving Average indicator is to predict future price movements with high accuracy. As we can see in the above chart, the slope of the line determines the potential direction of the market. In this case, it is a clear uptrend.
Every Moving Average has its own level of smoothness. This essentially means how quickly the MA line reacts to the change in price. To make a Moving Average smoother, we can easily do so by choosing the average closing prices of many candles. In simpler words, higher the number of periods chosen, smoother is the Moving Average.
Selecting the appropriate ‘Length’ (Period) of a Moving Average
The ‘length’ of the Moving Average affects how this indicator would look on the chart. When we choose an MA with a shorter length, only a few data points will be included in the calculation of that MA. This results in the line overlapping with almost every candlestick.
The below chart gives a clear idea of a small ‘length’ Moving Average.
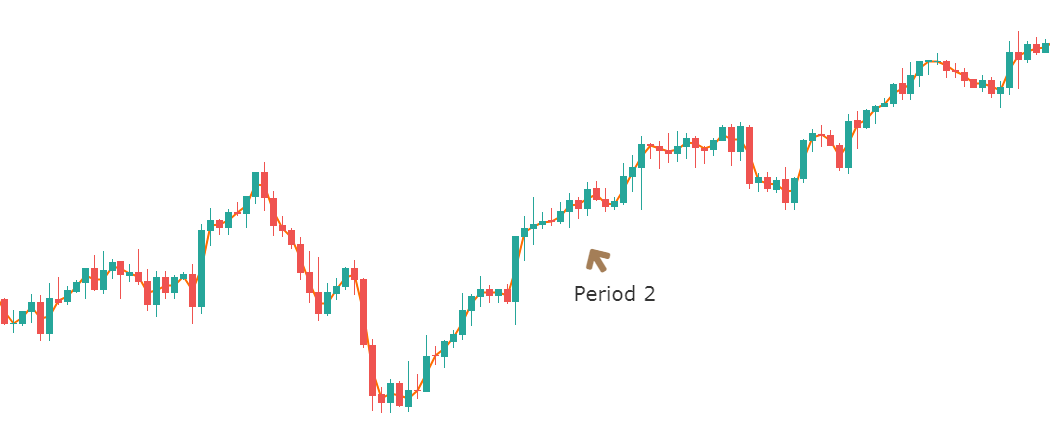 The advantage of a smaller length moving average is that every price will have an influence on the line. However, when a moving average of small ‘length’ is chosen, it reduces the usefulness of it, and one might not get an insight into the overall trend.
The longer the length of the moving average, the more data points it ll have. This means every single price movement will not have a significant effect on the MA line. The below chart gives a clear idea of a long ‘length’ moving average.
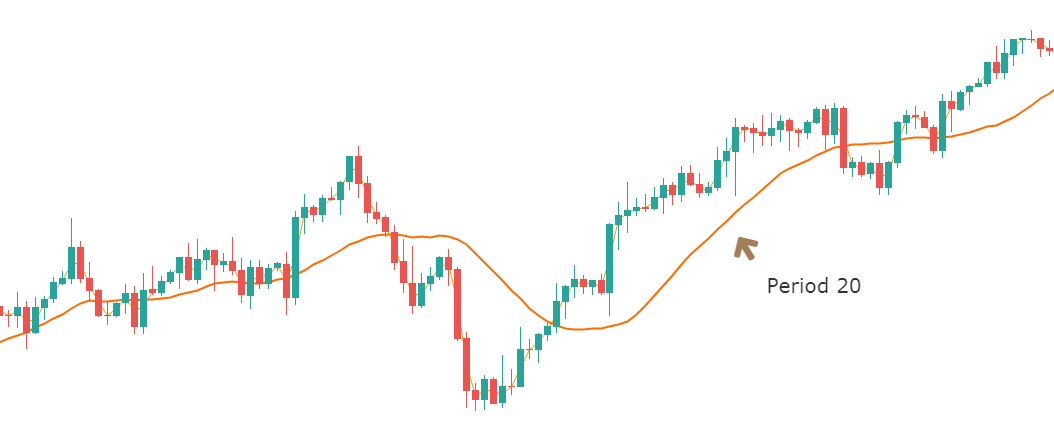
On the flip side, if too many data points are included, large and vital price fluctuations will never be considered making the MA too smooth. Hence we won’t be able to detect any kind of trend.
Both situations of choosing ‘lengths’ can make it difficult for users to predict the direction of the market in the near future. For this reason, it is crucial to choose the optimal ‘length’ of the Moving Average, and that should be based on our trading time frame and not any random number.
Conclusion
Moving Averages generate important trading signals and especially when two MAs are paired with each other. They give both trend continuation and reversal signals with risk-free trade entries. A simple way of reading the MA line is as follows – A rising MA indicates that the underlying currency pair is in an uptrend. Likewise, a declining MA means that the currency pair is in a downtrend.
In the next article, we will be learning two critical types of moving averages – Simple Moving Average and Exponential Moving Average, along with their applications on the charts. Stay Tuned!
[wp_quiz id=”65304″]