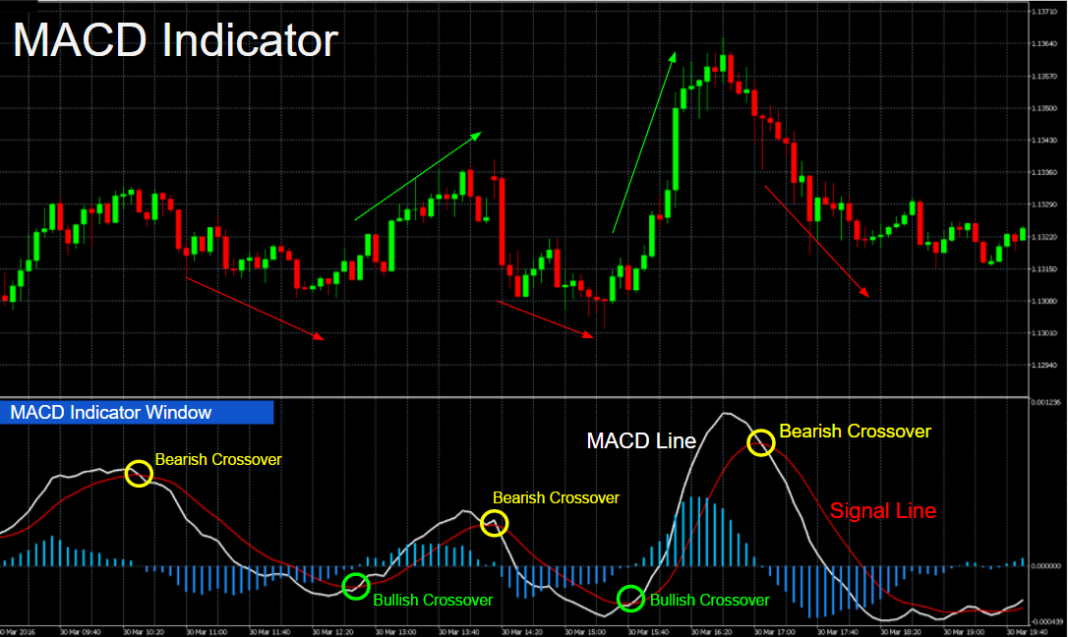
Moving averages identify trends when filtering price fluctuations. Under this idea, Gerald Appel, an analyst and portfolio manager from New York, developed a more advanced indicator. He called it Moving Average Convergence Divergence indicator MACD, which consists of not one but three exponential moving averages. It is seen in the graphs as two lines, whose intersections between them provide trading signals. One is called a MACD line and the other is called a signal line.
This oscillator has been involved in some controversy as to its classification. Mainly because there are analysts who classify it as a trend tracking indicator and others who consider it a follower of the cycle. We can be sure of the following: we are talking about the most effective oscillator after long-term cycles, hence the fact that it can be considered a follower of short- and medium-term trends.
Creating MACD
The MACD indicator originally consists of two lines: a solid line (called a MACD line) and a “strokes” line (called a signal line or signal). The MACD line develops from two exponential moving averages. It responds to price changes quite quickly. The signal line is developed from the MACD line, smoothed with another exponential moving average that responds to price changes in a slower way.
Buying and selling signals are given when the MACD line crosses above or below the signal line. The MACD indicator is included in most technical analysis software and is also on the DIF platform. Nowadays, no analyst needs to calculate it by hand as did its creator, Gerard Appel, because computers do this work faster and with greater precision. The MACD indicator is included in most technical analysis software.
Creation of the MACD:
- Calculate an exponential 12-day moving average at closing prices.
- Calculate an exponential moving average of 26 days of closing prices.
- Subtract the 26-day MME from the 12-day MME and draw its difference, as a continuous line. This is the MACD line.
- Calculate an exponential 9-day moving average of the MACD hotline and draw the result as a dashed line. This is the signal line.

Additional MACD Applications
Many operators try to optimize MACD by using other moving averages instead of the more commonly used MME for 12-26 and 9 days. Another option is to use MME 5-37 and 7 days. Some traders try to establish MACD links with market cycles. In the case of using cycles, the first MME should be one-quarter of the duration of the dominant cycle and the second MME should be half of the cycle. The third MME is a smoothing instrument, the length of which does not need to be connected to a cycle.
MACD Trading Rules
The intersections or intersections between the MACD and the signal lines identify changes in the market trend. Trading in the direction of crossing these lines means following the flow of the market. This system generates fewer operations and signal investments than an automatic system, based on an MMS.
- When the MACD indicator passes the signal line, it gives a buy sign. Enter long and place a stop loss below the last minimum.
- When the MACD indicator passes below the signal line, it gives a sell signal. Enter short and place a stop loss above the last maximum.
This type of oscillator has two uses. It helps to point out divergences. It also helps to identify short- and long-term variations, not only when the short average moves far above or below the larger average, but also by crossing the two.

MACD Histogram
The MACD histogram offers a deeper understanding of the balance of power between buyers and sellers than the original MACD. It shows not only who controls the market, buyers or sellers, but also whether they are strong or weak.
MACD histogram = MACD line – Signal line
The histogram of the MACD indicator shows the difference between the signal line and the MACD line. It graphically represents that difference as a histogram, a series of vertical bars.
When the MACD fast line is above the slow signal line, the MACD histogram is positive and is represented above the zero line. When the MACD fast line is below the slow signal line, the MACD histogram is negative and is represented below the zero line. When the two lines are touched, the MACD histogram is equal to zero.
Each time the distance between MACD and the signal lines increases, the MACD histogram expands. Each time the two lines join, the MACD histogram is shortened. The slope of the MACD histogram identifies the dominant market group. A growing MACD histogram shows that buyers are starting to strengthen. A decreasing MACD histogram shows that vendors are starting to strengthen.

The slope of the MACD histogram is more important than its position above or below the center line. The best-selling signals are when the MACD histogram is above zero but its address is bearish, showing that buyers are starting to sell out. The best buy signals occur when the MACD histogram is below the zero center line and its slope is bullish, showing that vendors are starting to tire.
However, there are systems that consider buying and selling signals at points where the MACD histogram cuts the zero line. In this case, the buy signal is given when the oscillator crosses from the bottom up, while the sell signal is given when the oscillator crosses the reference line from the top down.

