Categories
Forex Service Review

Market Trend Direction Indicator Review

This is a classic composite trend confirmation indicator designed for trend following on the MetaTrader 4 platform. The author is Andrey Kozak who also has no less than 85 other products published on the MQL5 market. None of these products received any notable attention for the community. This is also the case with the Market Trend, even though the indicator may produce good results. The initial version was published on 16th January 2018 and has never been updated. It may be reasonable not to put effort into a product that is not needed. Still, trend confirmation indicators like this may be hidden gold to someone.

Overview

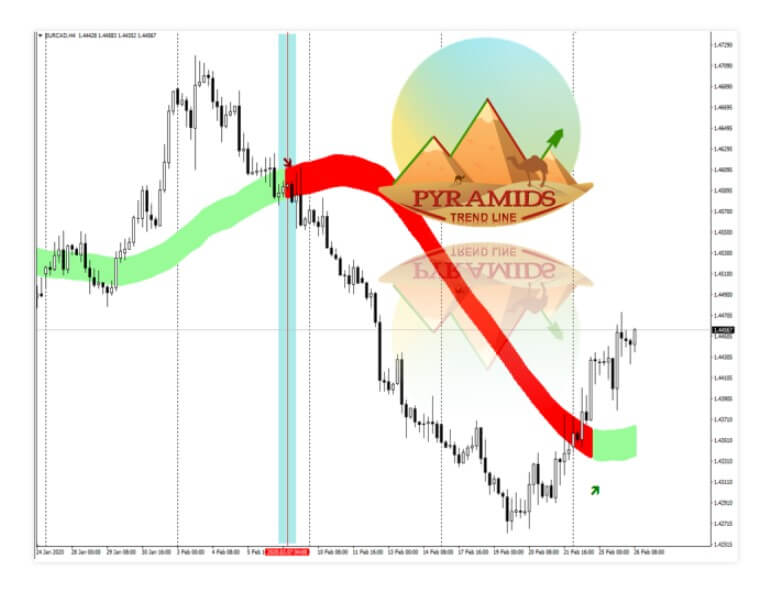
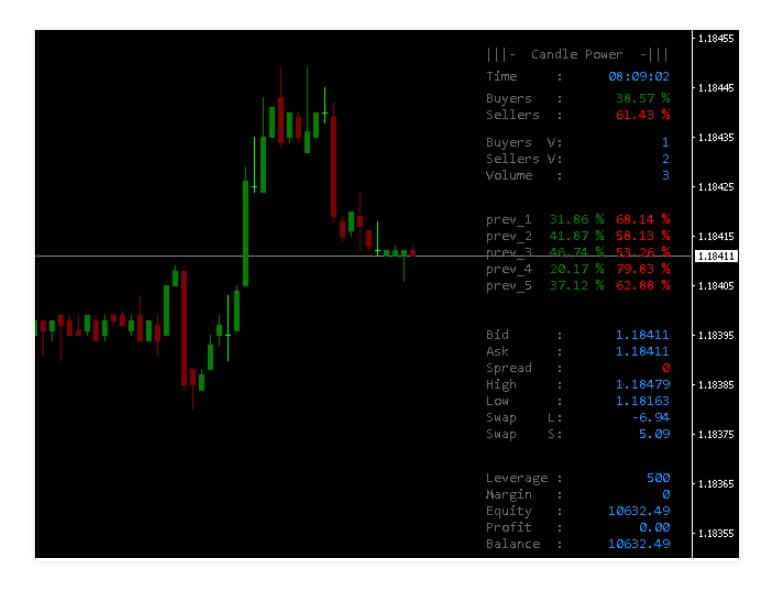
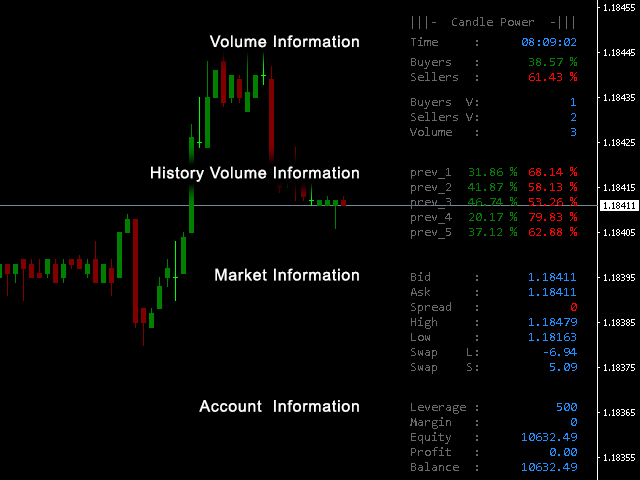
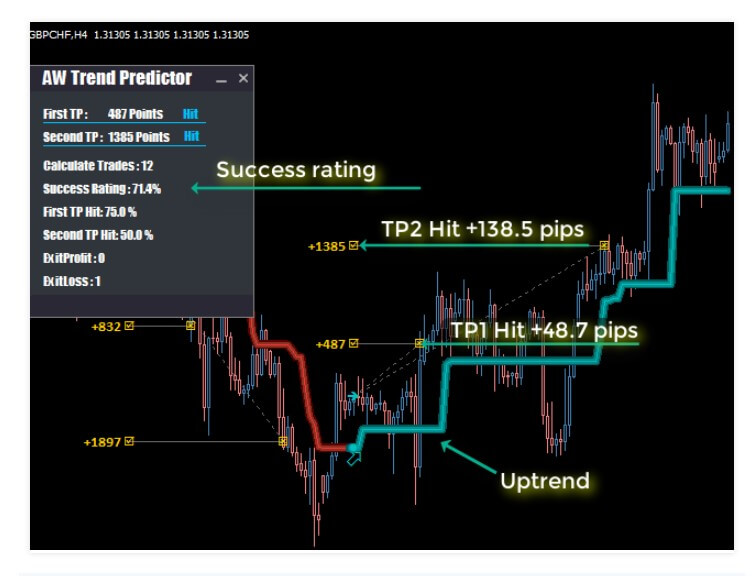
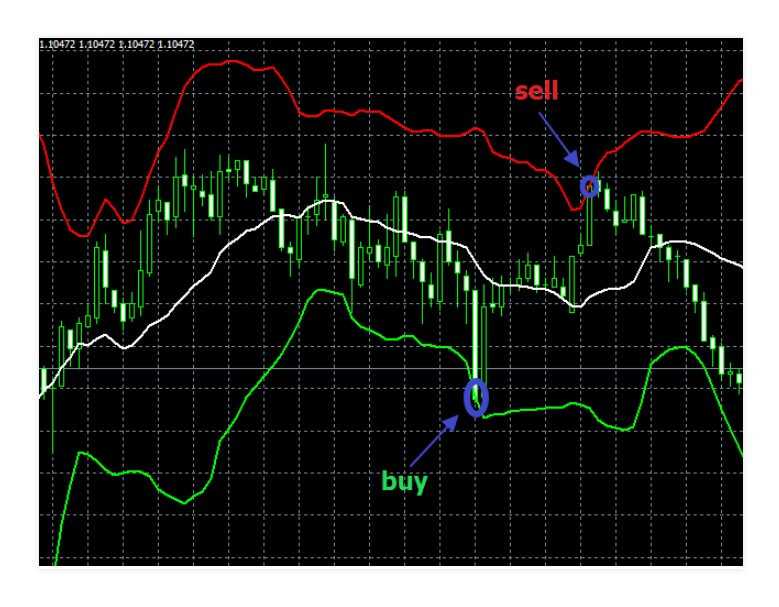
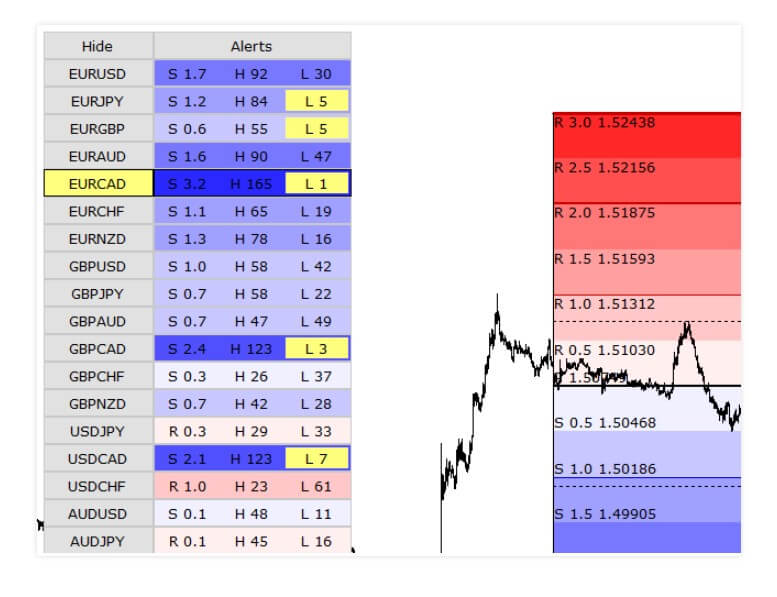
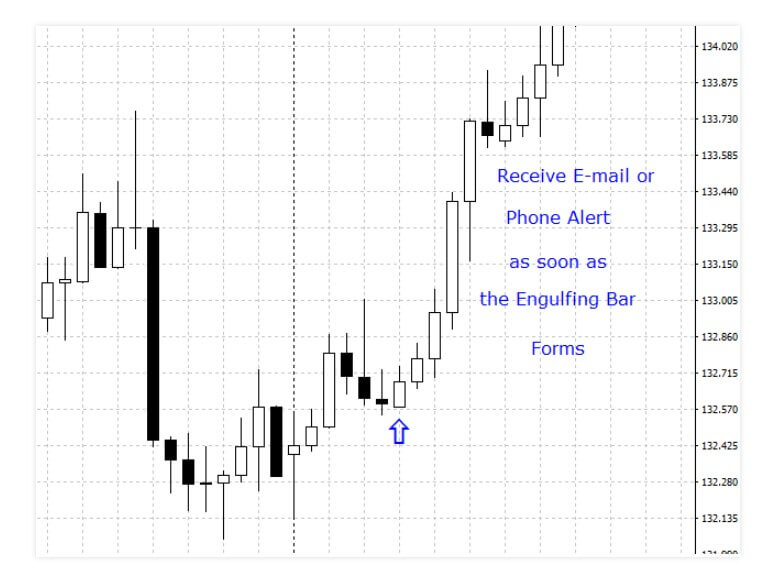
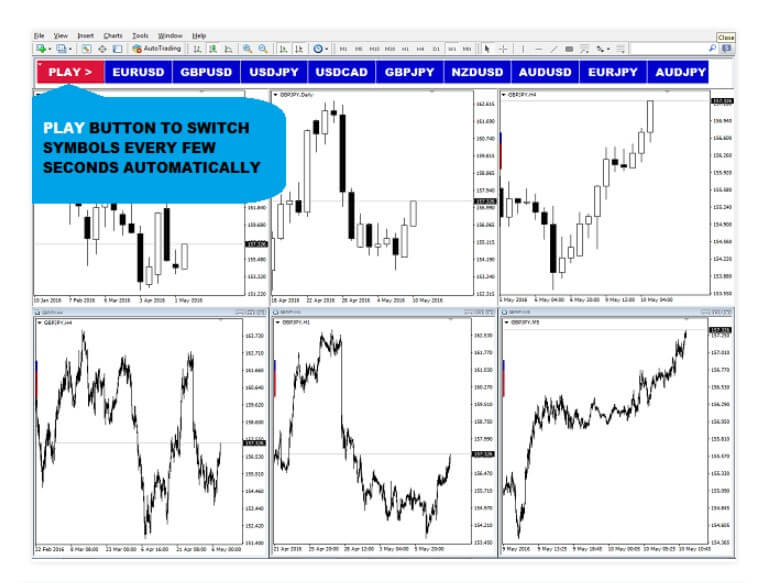
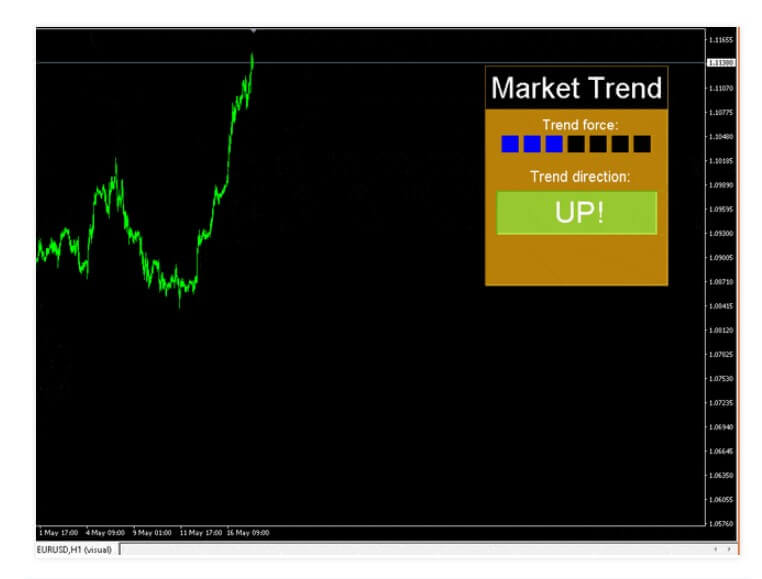
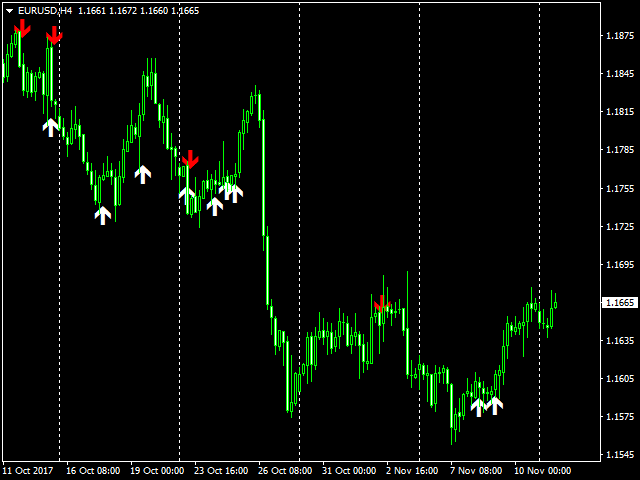
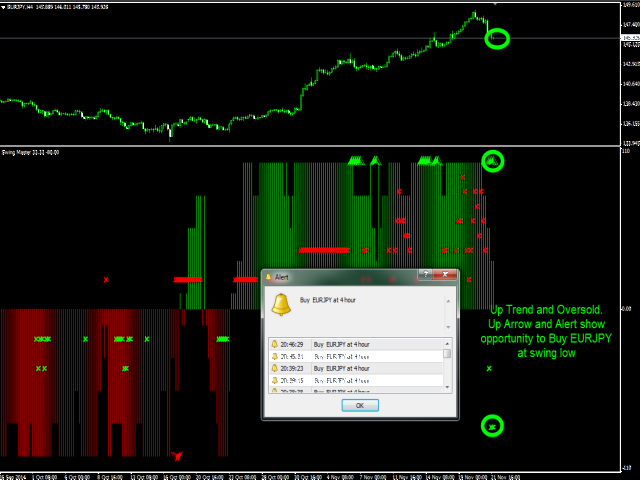
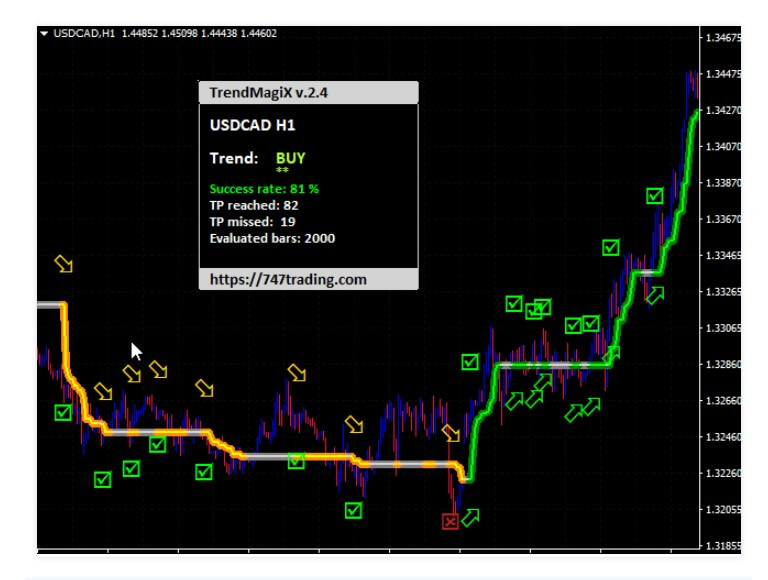
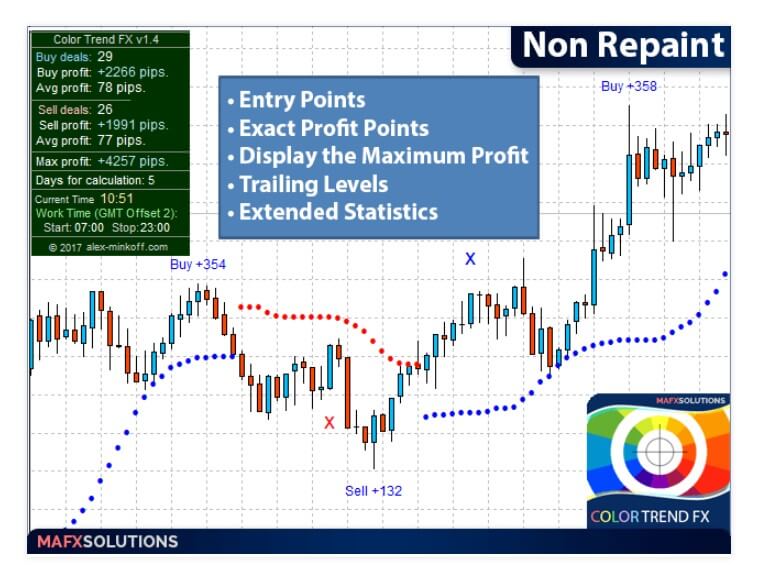
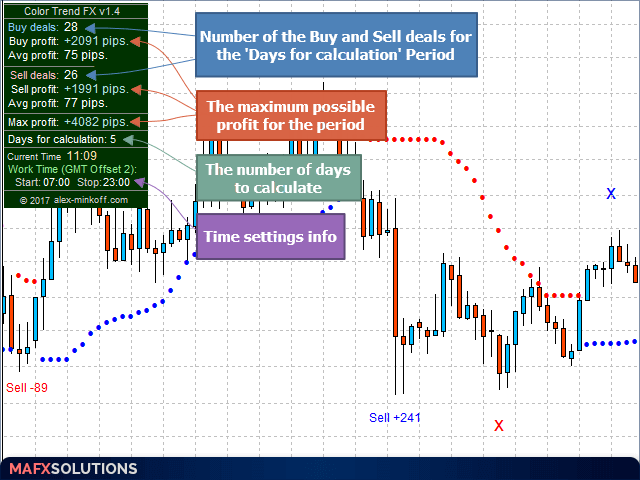
Market Trend is composed of several indicators but generates only the Buy and Sell signals. The exact formula of how the values are combined into a single signal is not disclosed. What is certain is the fact MFI, RSI, and two moving averages are used in the creation. The indicator will show the “UP!” and “DOWN!” on the dashboard to the upper right corner of the chart window. Also, a trend force or momentum will be represented by a meter. The meter can be used for exits, however, the indicator is not lagging, but will not change the signal too often.

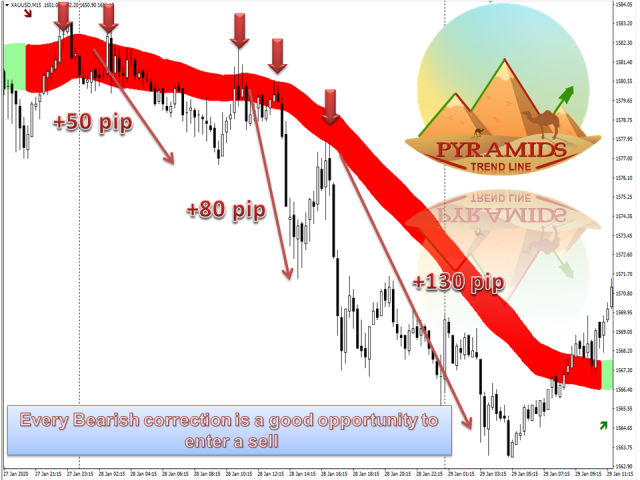
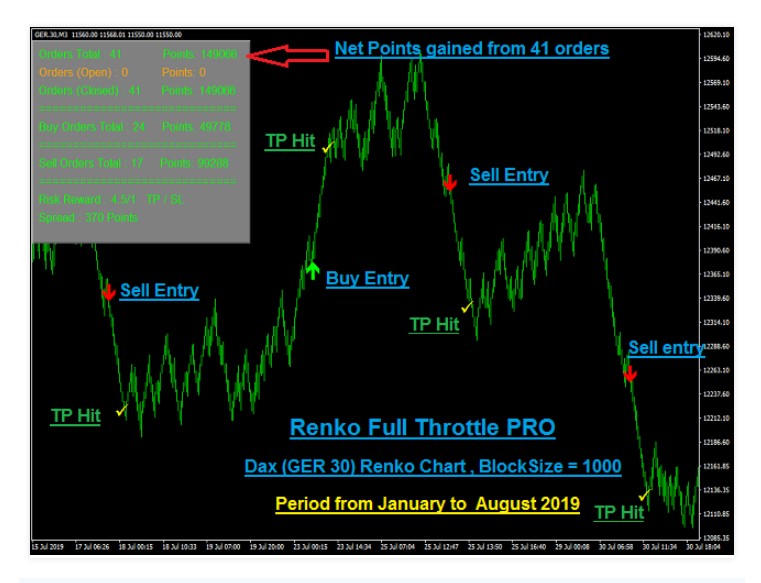
Having such an indicator that enters a trend early and stays on the move is not common to see. According to the video presented, the indicator has not missed a trade, catches the trend early, and was not imbalanced but the noise that at times was significant. Whatsmore, Market Trend is universal, it works on all timeframes and trading instruments.

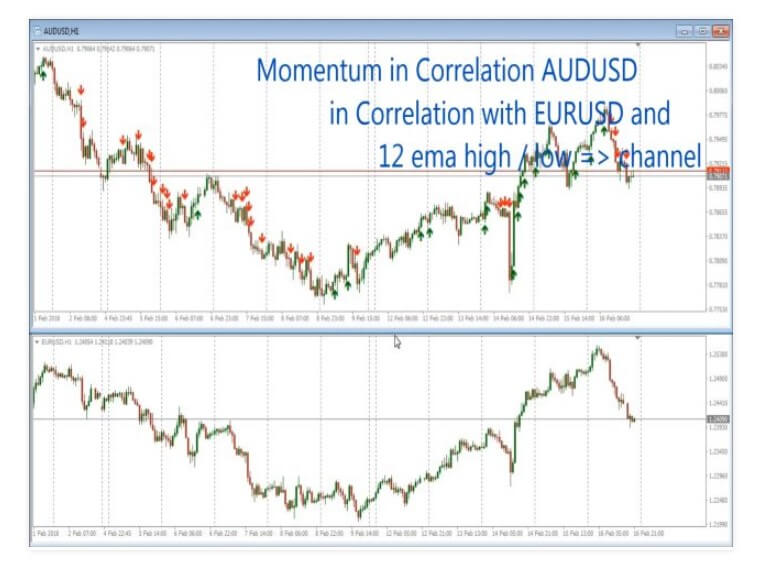
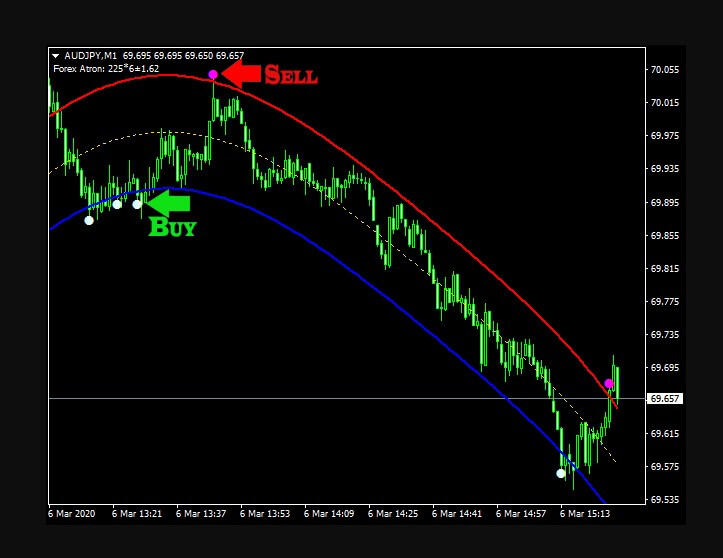
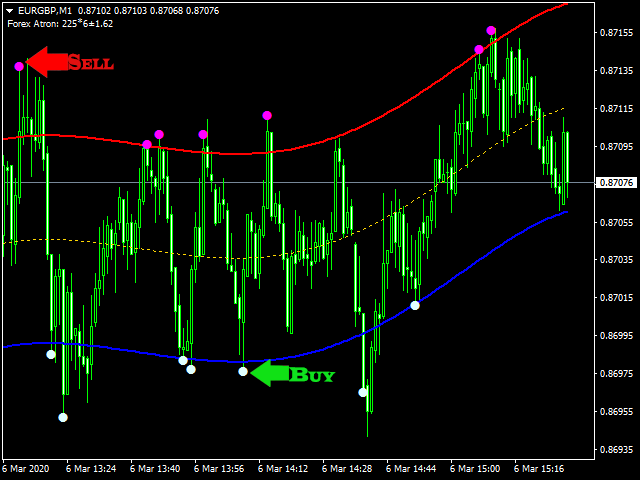
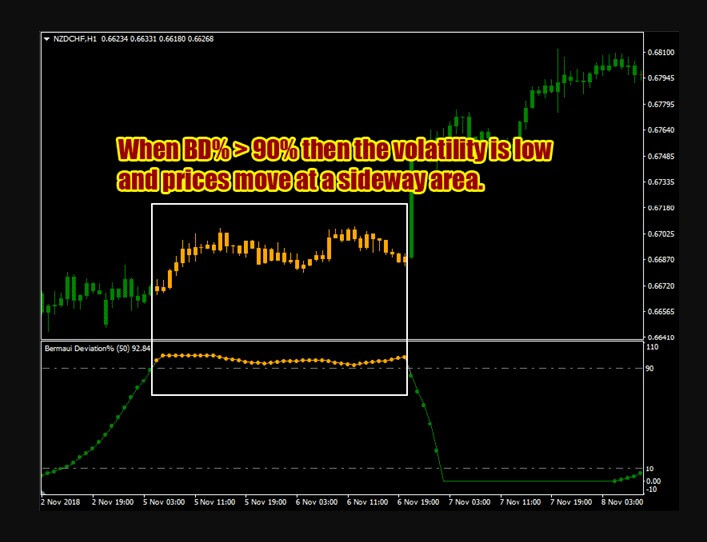
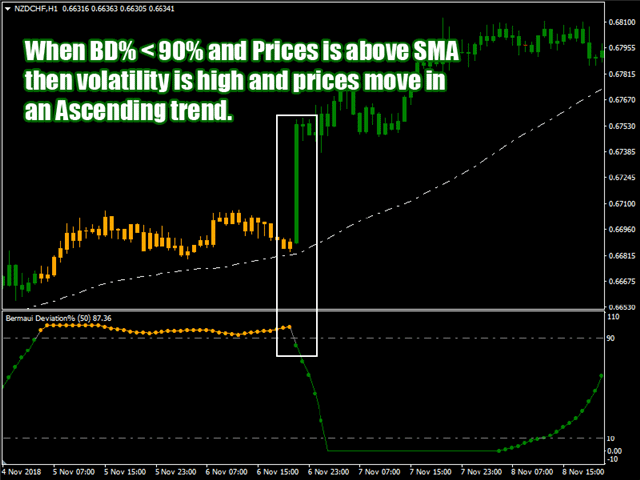
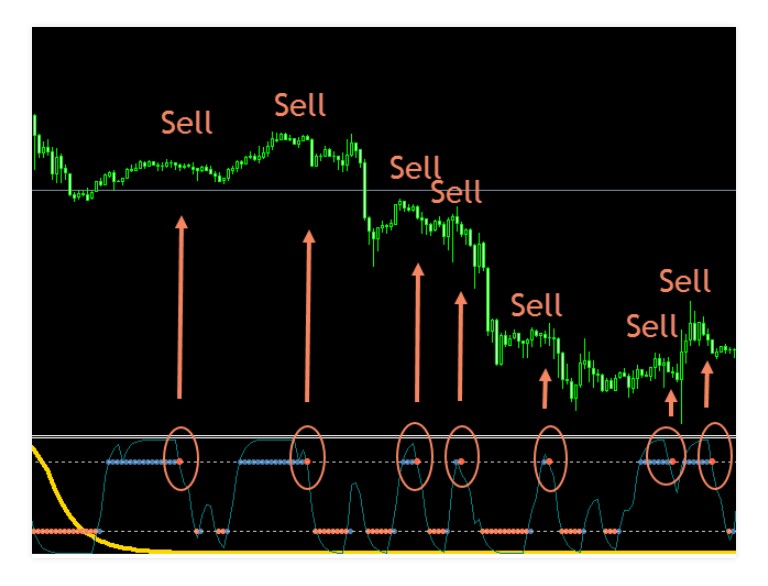
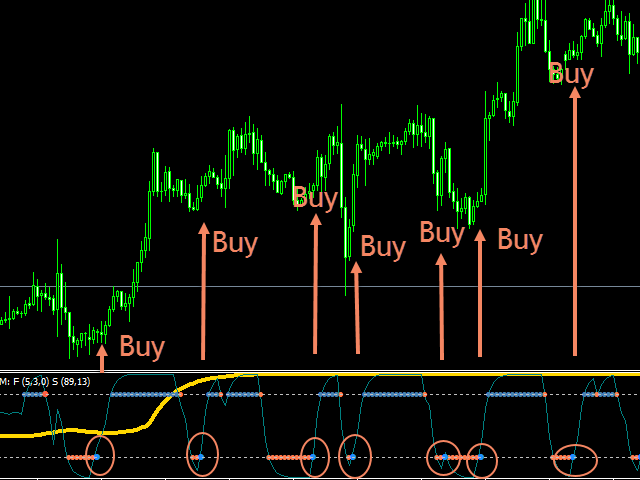
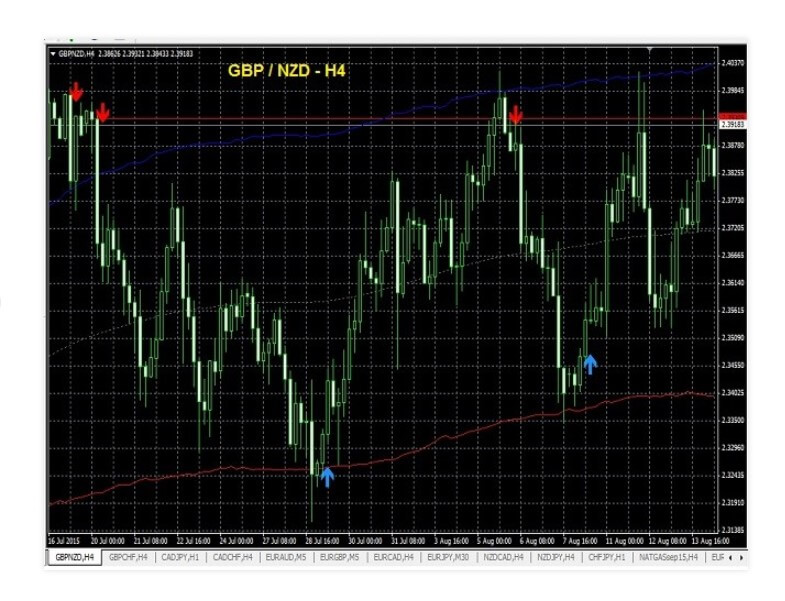
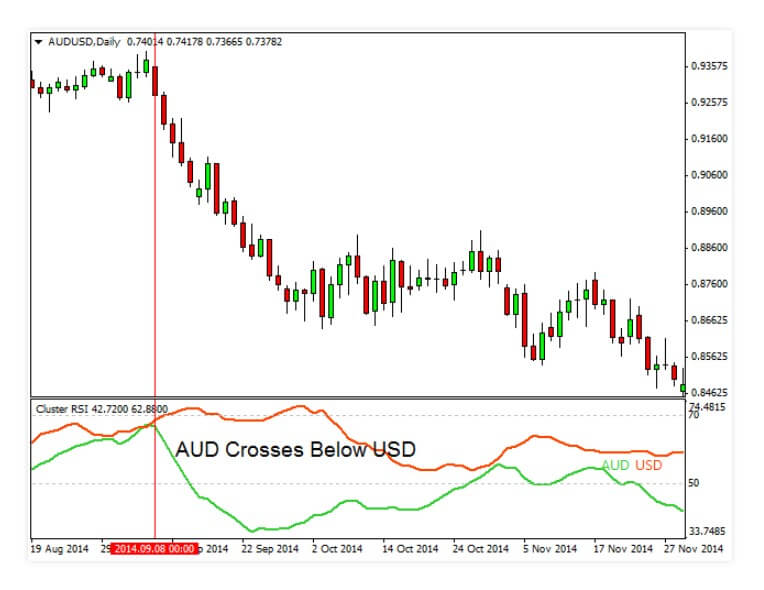
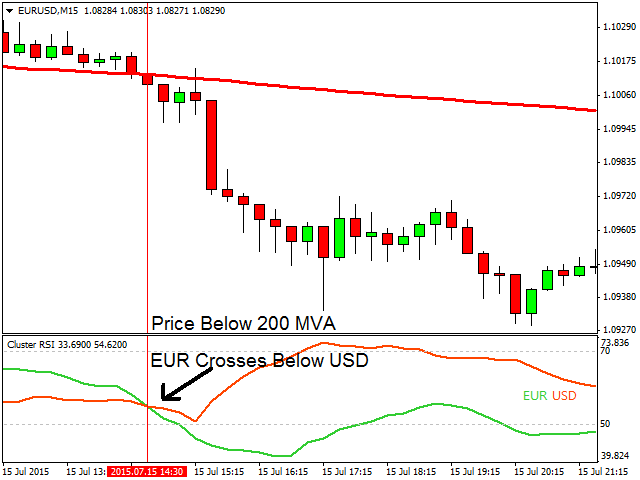
Based on some research, we suspect the indicator also has a filtering capability using the combination of the moving averages. Similarly to the MACD, there are two MAs with faster and slower sensitivity to the price change. Whenever the price level is in between the MA lines, it is filtered, and the trend prevails with the noise. Once the price levels reach above or below both MA lines, Market Trend looks at RSI and MFI for Oversold and Overbought signals and combines them for new trend confirmation. Since RSI and MFI are both oscillators, the non-lagging property of Market Trend may lie in the reversal signal these indicators are mostly used for. Now, reversals are not always reliable so the developer decided to insert two oscillators with different formulas to increase diversification.

https://youtu.be/ejJ0MzFzW8s

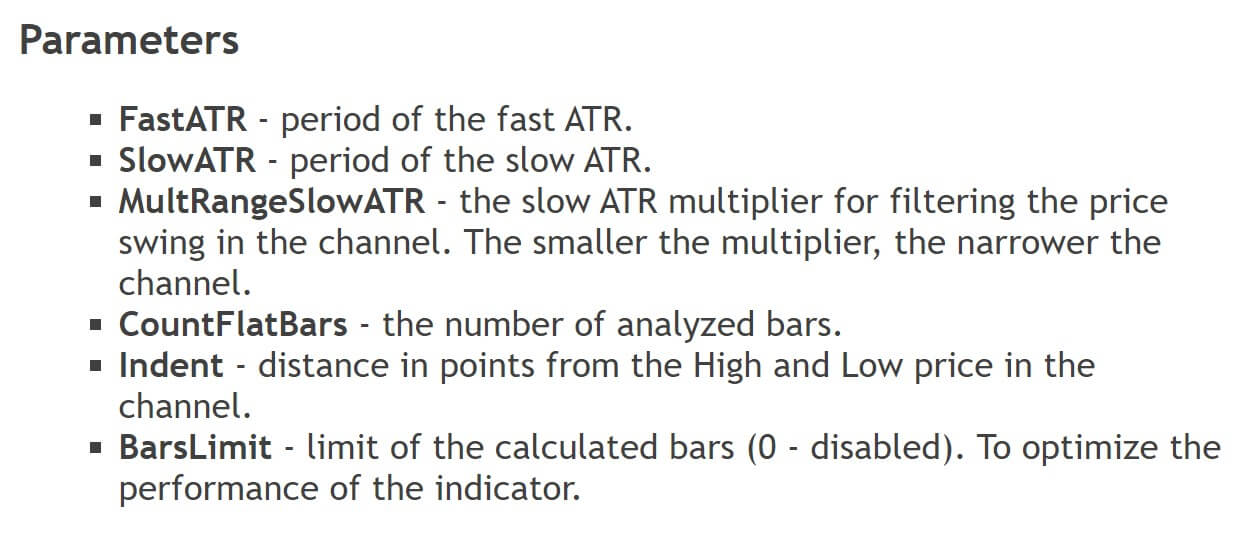
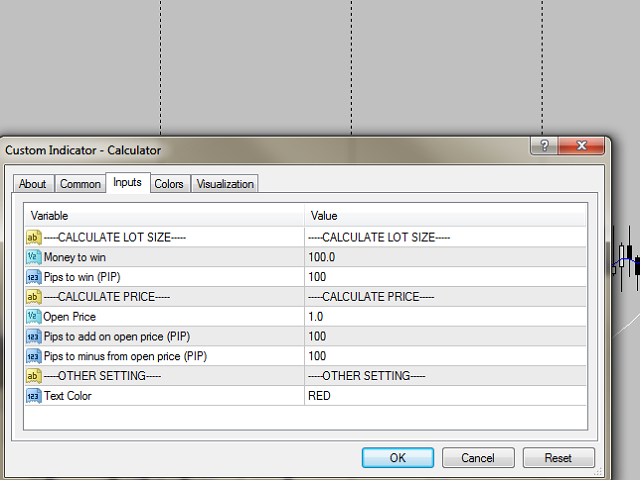
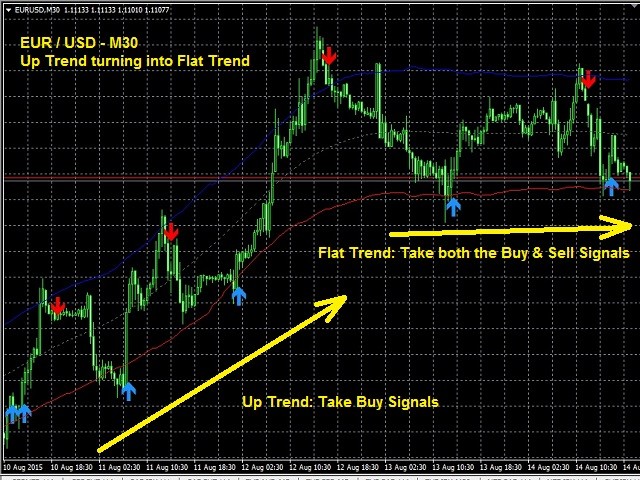
Using the Market Trend is easy, Buy or Sell when the dashboard says so. Combining this indicator with others for other purposes than trend confirmation could create a profitable trading system. Of course, testing is necessary to see if it is aligned and synergetic with other elements. For that purpose, the author has opened a few settings to tamper with. You can adjust the periods for the RSI, MAF, and both moving averages. Now, these are not displayed so traders may have trouble finetuning as they do not see the feedback, only how the signals on the dashboard.

Service Price

The price for the Market Trend is $70 with 915 activations, still, this price is higher than average. There is no possibility to rent it although you have a demo available.

Conclusion

Unfortunately, there are no reviews or comments based on which we could know more. We are not certain why this indicator received such low popularity, even the 168 demo downloads do not point to the price barrier issue. The gif type screenshot is eyecatching presenting the indicator in action, but as it turns out, this is not enough.

This Forex service can be found at the following web address: https://www.mql5.com/en/market/product/27412

Categories
Forex Service Review

Smart Pattern Candlestick Indicator Review

Candle pattern is a popular Price Action method for discovering trends and reversals. By discovering patterns traders can predict the price move making this method non-lagging although the reliability is relative. SmartPattern is published on 20th November 2017 with version 2.1 for the MetaTrader 4 platform and not updated meaning this indicator was probably already developed before publishing on the MQL5 market.

The developer is Pavel Krysanov from Russia, having 38 published products although none of them achieved notable attention from the users. Indicators belonging to this category are numerous, many developers make them just to boost their SEO rating as the candle pattern trading is one of the most popular Price Action methods, in close relation to Fractals and Harmonic Patterns.

Overview

The Overview page is simple and short with good explanations of what the indicator does but without details. SmartPattern database of candle patterns is not disclosed but traders will have the basic and the expanded range to set on or off in the settings. Since they are predicting the move the author described them as superior to other indicators that “confirm” what has already happened, such as the Moving Averages. SmartPattern will draw arrows once the pattern, be it bullish or bearish, appears. It is real-time, traders will have the option to show labels over each pattern in case they follow only the ones regarded as the most reliable. According to the author, this indicator can filter false signals, although the logic or the method used for this purpose is not disclosed.

Scalpers and trend following strategies can use this indicator according to the author, we would also add reversals, channel strategies, and so on. Virtually any strategy can use a non-lagging indicator. Of course, not all traders belong to the pattern, Price Action, or scalping domain, relying only on strict rules generated by the confirmation lagging indicators. We would not say any is superior over the other, it is just the kind of trader that exploits them best is better than others.

SmartPattern can be mixed with any strategy, traders will have basic options in the settings to adapt this indicator to their system though. The main parameters are the mentioned pattern range setting, labeling, and alert notification methods such as email, mobile, or classic sound alert in the MT4. We have noticed a few pictures presented by the developer showing conflicting and frequent signals.

Since there are no settings to increase filtering, reliability or frequency of the signals, except to set to just basic patterns, you may be overwhelmed. There are a few times the signal is quickly opposed with another one and a few signals in the same direction. This can be used for Scaling in or out for one trade per signal or even gauging Support and Resistance levels. However, judging by the arrows frequency, we believe this indicator would be great for scalpers.

It does not lag and does not hold for a big trend. On other screenshots, we have noticed the indicator will not tell you when to exit properly. One bullish pattern may show a correct entry to a degree but do not expect an opposite arrow for the exit, you could end losing more than 10 profit trades combined. Therefore, having a system for other purposes is a must before adding this indicator to it. There is no specific timeframe recommended for SmartPatterns, based on the screenshots it can be used from H4 to M15, on most major currency pairs. Patterns are used on all markets and timeframes so this indicator is universal.

Service Price

Smart Patterns does not have a buying price, just a one year rental for $15. A demo is offered and there are 8 activations possible.

Conclusion

Since there are many indicators of this kind, traders may want to search elsewhere although the inner filtering, patterns base, and indicators may be different that make this indicator stand out. The specifics mentioned in this review also mean this one is more appropriate for certain systems. There are no users that left a review and there are no comments so SmartPatterns remains unproven in practice.

This Forex service can be found at the following web address: https://www.mql5.com/en/market/product/26393

Categories
Forex Service Review

Modified VIX Fix Indicator Review

VIX is a volatility index used worldwide to measure this parameter crucial to many trading strategies for various tasks. Chicago Board Options Exchange calculates this Index and is available at cboe.com. The author of Modified VIX Fix is Jay Jantz from Canada working at Synapse Investments Research Group, publishing this indicator for the MetaTrader 4 platform on the MQL5 market. It belongs to the paid category, initially uploaded on 25th October 2016, and updated to version 1.1 in March 2017. The updates are minor, mostly visual additions and alert functionalities.

Jay Jantz has 25 products in total, only one of them received a bit of attention from users. Modified VIX Fix is a very specialized indicator, the author starts the Overview page with a quote by Larry Williams “The VIX Fix is a powerful indicator that detects market bottoms for any asset”. This means this indicator is a long trade after bottom specialist, tending towards the reversal type strategies as it is not lagging.

Overview

Fix in the Modified VIX Fix means the indicator is not only based on the S&P 500 but can be applied to any trading asset. Market bottoms are identified by peaks in the indicator histogram representation after which a bullish trend appears. According to the author, this indicator has two components integrated, standard deviation and stochastics as per Larry Williams VIX application from 2007.

Modified VIX Fix has two modes, both of them can be applied to the same analysis for better precision. The first one is regular VIX standard deviation mode where the market bottoms are identified with a teal-shaded bar by default. Long trade entry is made on the first gray histogram bar. The second mode is using the stochastic oscillator line crossing. When both modes are used, a trader can combine for more reliable trade entries only when the stochastic indicator lines are exiting the “80” range and crossing each other. For all signals, an alert can be set on various conditions.

In the indicator settings panel, traders have a few functional parameters. You will be able to change the modes to regular or stochastic. The regular one uses Bolinger Bands to highlight the bottoms. Standard deviation is included in the Bollinger Bands and can be adjusted. The standard deviation period and the Bollinger Bands length are also optional. Modified VIX Fix is based on percentages, not fixed values, and therefore always has the same range. This range can be modified with the periods and with the threshold for which the signal is regarded as valid.

The stochastic oscillator is adjustable just like the classic one, with the D and K periods. To appear more logically, the histogram and the stochastic oscillator can be inverted, so the signal bottoms appear in the lower part of the indicator window. The rest of the settings are aesthetic.

Since the Fix in the Modified VIX does not show exit points or anything other than market bottoms, exit and other supporting indicators are a must. Of course, the developer is suggesting some of his own although we are certain there is an endless number of combinations and systems that can be made with this indicator. The Overview page will give you some screenshots that are easy to understand and will give you the right insight on how the indicator works using both modes. Even the author does not mention it, the points where the bottoms appear can also be used for the Support Line determination meaning this indicator is also good for Price Action strategies.

Service Cost

Modified VIX Fix cost is $49 with 984 activations, $16 to rent for 1 month, and $33 to rent for 3 months. A demo is offered and certainly your first step before the purchase.

Conclusion

Certainly, for scalpers on low timeframes, VIX is not recommended, as most of the market bottoms are defined on higher timeframes such as Daily. Another interesting use for this indicator is the short trade exit marker, using the same logic. This indicator belongs to the specialized and interestingly composed category, it could be the most precise and useful to you or a complete waste of time. Unfortunately, there are no reviews based on which we could say more about users’ success. In the comments section, notably, some want to use it on shorter timeframes than Daily, and this may be the reason why this indicator is not popular. Most of the traders use lower timeframes, especially very popular scalpers.

This Forex service can be found at the following web address: https://www.mql5.com/en/market/product/18972

Categories
Forex Service Review

MTF (Multi Time-Frame) Money Flow Index Review

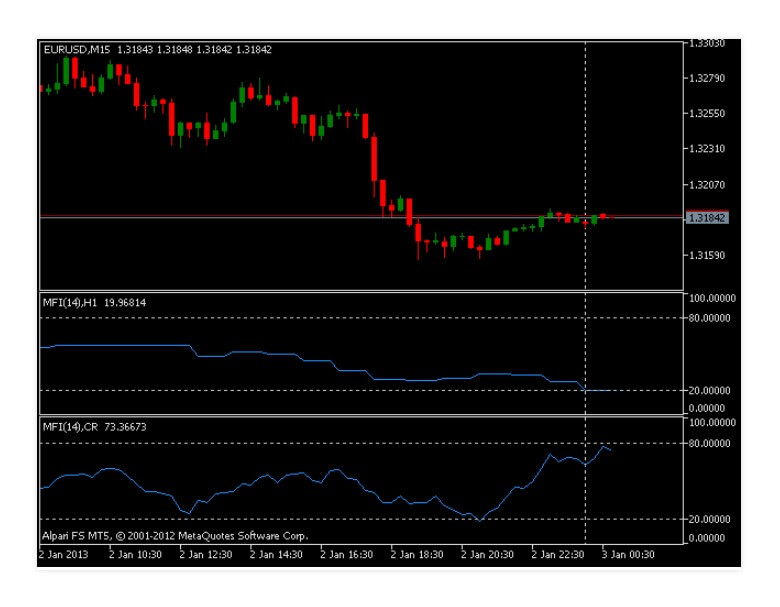
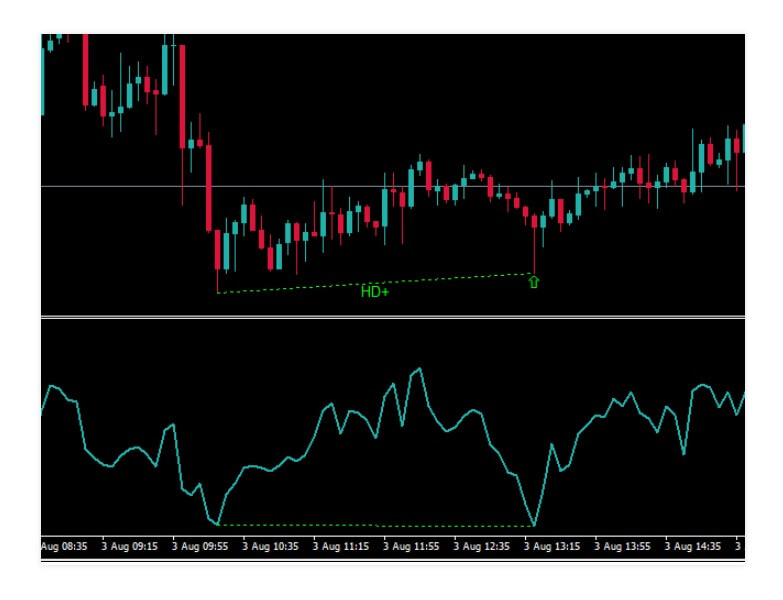
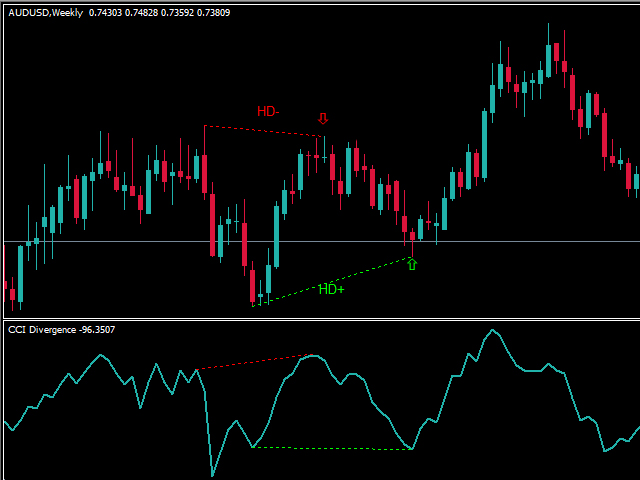
Money Flow Index or MFI is a commonly used oscillator indicator that can generate a few signals for reversals, trend confirmation, and even continuations. The specifics of this MFI is the Multi-timeframe dimension that gives trades more information on the higher timeframe without the need to switch to another chart. This is a very simple indicator modification without any other extras that could make it a versatile tool or an Expert Advisor.

MFI is developed for the MetaTrader 5 platform by Gabor Torma from Hungary who has a total of 18 products released on the MQL5 market. Almost all of his products are indicators transformed to have the MTF component, and even though it Is a simple modification, none of them are free.

Overview

Money Flow Index is already included in the MT4 and the MT5 platform by default. As an oscillator, it can show divergencies and to some traders, this is the main function for their trading systems. Divergencies are leading signals, happening before the possible price change and therefore are somewhat less reliable. However, divergencies could be used as a precaution that a trend might be dying out and exit before a reversal or a flat zone. MFI indicator has a volume factor inside its formula which makes it different than the commonly used RSI oscillator. This element makes the MFI more reliable when used for divergencies.

Another aspect of the MFI is the Overbought and Oversold levels, similar to the RSI. These levels are mostly used as reversal signals similarly to the RSI, when the MFI line crosses the 20 level upwards this is a Buy signal, and a Sell signal is generated when the MFI line crosses downwards from the 80 mark. Now, these levels can be placed to 10-90 or 30-70 depending on the trader’s strategy. Overbought and Oversold moments in the Forex market are considered to be nonexistent by a wide group of traders.

The third common use of the MFI is the continuation trade. Trades sometimes set the MFI as the momentum indicator, changing the period and the levels. Once the MFI line moves back into, for example, 30 or 70 level zones, the trend can be considered and continuing as there is enough momentum. This is especially useful since the MFI has the volume factor.

The Overview page is very simple and short for the MTF Money Flow Index, yet enough to grasp all of the features. The MFI indicator formula is not modified, but traders will have optional multi-timeframes not available in the MT4, just within the MT5. Since this altered product is made for the MT5, all of the possible higher timeframes can be set. So, for example, you may want to have one MFI on the current timeframe, which can be done just by adding the default MFI, and add this MTF MFI and set to calculate on a higher timeframe.

Even better, you can mix the two on in the same indicator window giving you the ability to see the MFI lines crosses as another signal generator. You do not have to stop there and you can add a third one on an even higher timeframe or change the period parameter, making a new structured indicator you may find uniquely useful.

As for the setting panel, the only addition if the multi-timeframe parameter. The developer also suggests using the Every Tick method when testing your custom indicators made out of this one. The developer has an MTF converter he is using on various indicators and has published them on the MQL5 market, for a price. Now, most of these small alterations of the default indicators such as the MFI can be found for free on the internet.

Service Cost

The price for Gabor Torma’s conversion is $12.99, which is quite affordable. There are currently 5 activations. There are no rental options and the demo version which is available has been downloaded 47 times as of this writing.

Conclusion

If you are looking for an indicator not widely used to have the MTF component, then you may need a coder that should make this easy work on your indicator. The product has been some time on the market, from 7th January 2013, for this period it has not received any reviews or comments. It has probably never been bought for reasons stated above.

This Forex service can be found at the following web address: https://www.mql5.com/en/market/product/606

Categories
Forex Service Review

Point n Figure Charting Indicator Review

The Point n Figure indicator functions by using alternative price chart presentations, similar to Renko charts. There are many types on charts although Renko is used by traders that like to approach forex and other markets from a very different angle. Essentially, these indicators or tools aim to filter the noise by “pixelating” movements into equal bars or box figures in case of the Point n Figure chart. The developer is Wang Qi from China who published this tool on the MQL5 market on 19th January 2016. It has never been updated as it never received any attention on the market. There are other products from this author, including a very complex Expert Advisor, yet none of them received a single review.

Overview

This tool uses X and O figures to present the price movements. Bull movement is represented with the X and O for bearish. Each movement has to be at least a certain amount of pips to be drawn on the chart. This amount is customizable by the trader, by default it is 20 pips. Since the figure plot is only done when the timeframe period closes, the movement will not have the highs and lows displayed.

Note that the price type measurement can be defined in the settings panel of this tool. Comparing it to the Renko charts, Renko is also defined by the price movement threshold to plot a bar, but in the case of Point n Figure chart, there could be many boxes in a single bar so they are not all equal like with the Renko. Therefore, this tool is in between the common candle chart and the Renko, allowing momentum to be presented with unequal bars.

To some extent, having less sensitive or pixelated chart allows better Price Action patterns and levels to be drawn and recognized. Therefore, it can be said this is a Price Action tool, but it is not limited to. Having a tool that filters noise is very useful for trend following strategies, although not so much for scalpers as it may misinterpret the noise that may put scalping ranges off balance.

Point n Figure chart opens a distinctively new way of how we can approach trading and create strategies. Like with Renko charts, it is affecting the indicators you insert, giving you new signals. Strategies developed with these do not resemble anything that we usually see. For this reason, Point n Figure Chart is an alternative, unpopular, and abstract way of trading. This is a reason for such low attention from the market. Still, this does not mean the tool is useless, just not for everyone.

The author has made Point n Figure to be used on both 4 digit and 5 digit brokers. You can customize the colors and have several price type calculations to select from. The Overview page presents the advantages mostly about easy finding the Support and Resistance levels, patterns, tops and bottoms, etc. This is just a small portion of what can be done here, especially since the columns generated are not just visuals, they affect any of the indicators added to the MT4.

In the settings panel, you can adjust the box size in pips, then the number of boxes needed for the column to reverse in the opposite direction, price calculation type, whether to use the High-Low levels, price close and to include an incomplete bar. The developer suggests searching for the patterns using the Point n Figure chart, although you can use the chart for noise filtering and many other strategies.

Service Cost

Point n Figure chart price is $65 with 5 activations and without the option to rent it. A demo is available and downloaded just 371 times by other MQL5 users.

Conclusion

There are no reviews or comments. There may be other alternatives on the internet that present the crat this way, some even for free. These may have different settings options or different execution so you might want to try the demo first and compare which option is better.

This Forex service can be found at the following web address: https://www.mql5.com/en/market/product/14074

Categories
Forex Service Review

Tipu RSI Indicator Review

Products from the Tipu Trading group are one of the most popular on the MQL5 market. They have intuitive designs and many are free. Tipu RSI is a free indicator with extended and enhanced functionality of this popular oscillator. It is very well presented in the Overview page, the formulas are disclosed and the features show it is made by a professional trading group too. The initial version showed in April 2016 designed for the MetaTrader 4 platform. Tipu RSI is supported through the years with many updates that further extend the functionality along with the bugfixes.

The final version is 2.40 published on the 19th of June 2018. Arrows plotting is added for the buy/sell signals and more options for alerts when RSI enters/exits the Overbought/Oversold zone. The author is Kaleem Haider from Canada who is also the CEO at the popular TIpu Trading group. They have 15 products total published on the MQL5 market and almost all of them are popular with great user ratings.

Overview

RSI is the most popular Oscillator indicator and used in many strategies, mostly for the reversals. Tipu RSI brings it to another level but retaining the original indicator purpose, without adding other indicators or making it specialized to single strategies or systems. Assuming most traders are familiar with the RSI, the Overview page starts with features.

The Dashboard is the dominant element of this indicator. It has 28 symbols (all major currency pairs combinations although it is also possible to add custom ones), it is a multi-timeframe or having the ability to show higher timeframes chart then the current one, various alert types, and visuals customization.

There is no change to the original formula of the oscillator, but the Dashboard opens a whole new way RSI can be used. This Dashboard is also used in other indicators enhancement published on the market by this group that extends their value. There are several tabs the panel will show. The major market overwatch enables you to see cross-symbol RSI values on M1, M5, M25, M30, H1, H4, D1, W1, and Monthly timeframe. As the cells are color filtered, when RSI is in the Overbought/Oversold zone, they will be shaded, giving you opportunities glance on the whole forex market. You will be able to customize what symbols are in the rows.

The settings tab brings alerts customization and RSI parameters specific to each timeframe, in a matrix-like design. Here, you can set alerts to be on mobile, classic MT4 pop-up, and email alert. Tipu Planel is another module that shows the trend box signal and RSI value box which is also colored if in the zone. This panel also has multiple timeframes, M15, H1, H4, and Daily. The Dashboard and the Panel all have drag and drop feature across the MT4 platform.

RSI is usually used as a reversal oscillator, but with extended functionality, it has many uses. Tipu suggests it can be used as a trend confirmator, tops and bottoms (classic), divergence, support and resistance levels, and swing failure signals (divergence using only price higher lows or lower highs as a trend exhaustion pattern). We would also add that sometimes reversal indicators are great exit indicators in certain non-reversal strategies.

The setting range is complete, there are no factors or elements that are not customizable. Besides, there are many price calculation options for the RSI module alone. Arrows or vertical lines can be placed for the RSI signals on exit or Overbought/Oversold zone entry, visuals for many elements and conditions, display modes, and the mentioned alerts options. There are a short video and screenshots that present the best parts of Tipu RSI.

Service Cost

The best part about TIpu RSI is it is free. This fact makes for a huge boost in popularity, not to discredit the quality, design, and application value.

Conclusion

There are 29 reviews to date averaging a 4.4-star rating. Interestingly, the low rating reviews do not have any reasons left and part of them are simply irrelevant. One simple review sums up all the products from the Tipu group:

“Another nice product from Tipu. Simple, but powerful and: FREE. Thank you!”

If you use the RSI indicator and need extra functionality or just want to experiment, Tipu RSI is probably the best RSI indicator on the market.

This Forex service can be found at the following web address: https://www.mql5.com/en/market/product/14208

Categories
Forex Service Review

Swing Master Indicator Review

Swing trading usually means catching trends and keeping positions open for a day to a few weeks, as long the trend is sustained. Swing Master does not quite act as a trend confirmation tool but more like a continuation entries indicator. It was first published on the MQL5 market on 25th November 2014 and has never been updated. The author is Michalis Phylactou from Cyprus which has at least 15 other products on the market, some of which have great popularity and ratings.

This is not the case with the Swing Master indicator, and it is probably the reason it was never updated. Another fact about the Swing Master is that it is specialized and not a complete solution most of the beginner traders will seek. The Overview page will give you a brief description and almost no info about what determines the signal.

Overview

Traders who focus on trend following strategies and have developed systems may find some value with this indicator. Once you enter the trend, it is common to see changes in the momentum that may cause you to exit too early missing another trend impulse. This will happen especially if your main trend exit indicator is more sensitive. Swing Master will give out signals where you can reopen a position in the prevailing trend. Of course, having such a specialized indicator requires that traders have a trading system.

Swing Master has 3 types of signals generating on the MT4 chart. Based on the values range of -100 and 100 the trend and extremes are registered. Therefore, this indicator is based on the oscillator indicator combination that is mostly used as reversals. Now, this means the signals will be generated before the trend momentum resumes. Therefore, the Swing Master does not signal if the trend momentum is extinguished, and if the major trend will continue.

The indicator will assume the trend and continue to generate the signals based on few overbought and oversold levels. At its core, this is a risky proposition. Another issue with this indicator is that it will probably conflict with your exit indicator, giving you a buy or sell signal when your exit indicator tells you to close positions. To compose the Swing Master with your system will require a lot of testing.

The histogram part of this indicator shows the major trend. Green and red shaded bars show the bullish or bearish trend. Extremes are marked with an “X” on the histogram, also colored in green or red. In conjunction with the trend and the oversold/overbought levels, the arrow will be generated which means to enter a continuation trade. Swing Master will work on any timeframe although the author recommends M30, H1, H4, and Daily, probably because of smoother trends.

The setting panel will allow users to set only basic parameters. Maxcandles setting adjusts how many histogram bars are drawn in the indicator, to adjust to computer performance. This may mean the indicator is heavy and cause MT4 crashes. The trend level setting is the main parameter you will use to adjust the indicator to your system as it is defining the threshold for the arrow or trade entry. Other settings are related to the alerts, the notification methods, only on one candle, email sending, etc.

Service Cost

Swing Master cost is $30 with 5 activations, with no option to rent it. A demo is available and has been downloaded just 363 times, showing very low popularity.

Conclusion

Based on the screenshots we have noted the author did not present the trading logic very well and that the signals are not precise, even wrong in some places. In certain circumstances, the indicator is also filtering some of the noise, only when the oversold/overbought and the histogram are aligned the signal is generated.

There is just one review with a perfect score and it reads as follows:

“Very good indicator. It complements my trend following strategy by catching more pips instead of picking tops in uptrend and bottoms in downtrend.”

Low popularity comes not just because the indicator is specialized and requires a system, but also because it is based on small reversals, it is not reliable enough, and the presentation does not disclose enough information. Experienced traders will pass on this one also because it is hard to adjust.

This Forex service can be found at the following web address: https://www.mql5.com/en/market/product/7017

Categories
Forex Service Review

Scalper Gun Indicator Review

Scalper Gun is a trading indicator that was published on the mql5 website by programmer Mikhail Nazarenko in May of 2019. It was most previous updated to version 1.2 approximately 6 months later.

Overview

Scalper Gun is an indicator that combines scalping and swing trading strategies with visualization and pop-up, push notifications, and email alerts of entry points. The scalping aspect focuses on the concept of placing multiple orders to make multiple small gains, while the swing-trading factor attempts to capture gains over a longer period of time, like a few days or several weeks.

Here are a few more facts about the indicator:

  • Works on the MetaTrader 4 platform
  • Suitable for traders of all different skill levels
  • Does not redraw
  • Works in both trend and non-trend markets

According to the author, speed, quality, visualization, and accuracy help this indicator to be more beneficial than other popular indicators. When using it, traders will see two lines on the chart; the yellow line indicates the “slow line”, which indicates the main trend, while the “fast” dark blue line is used to enter the market. The author goes on to explain how those lines are created and used in the product’s description.

Service Cost

Traders can either rent the indicator for $89 USD for one year or purchase it outright for $100 USD. The developer throws in 10 activations, which is more than what is standardly provided. In our opinion, the product would receive more feedback if the developer was willing to allow traders to rent it for a lower rate for a smaller amount of time since the two licensing options are rather high for this type of product. Although it does cost a good bit to buy the indicator, traders can still test the demo version for free.

Conclusion

Scalper Gun provides traders with entry point alerts based on short-term scalping strategies and long-term swing trading strategies while working in different market conditions. This product hasn’t received a rating or any reviews on the mql5 website, but there are a few comments that show us that the developer is willing to implement changes on request in featured updates, so this is a plus for any users that might have a recommendation for improvement.

In the end, we feel that this product may be a bit overpriced, which has likely resulted in the lack of popularity that it has received. This doesn’t mean that it isn’t a good product, as the developer has created a successful tool. Traders will simply need to determine if the investment is worth it, so long as the indicator suits their trading strategies.

This Forex service can be found at the following web address: https://www.mql5.com/en/market/product/38584

Categories
Forex Service Review

ZigZag Probabilities Indicator Review

The ZigZag Probablilities indicator is an indicator to be used on the MetaTrader 4 trading platform, it uses several ZigZag level predictions based on probabilities. The indicator combines analysis of 5 zigzags with different rages, for every zigzag, the indicator will process the available history for calculating density distribution of the zigzag edges and conditional probabilities for their consecutive pairs.

Overview

The indicator will display up to 8 horizontal lines on price levels where future zigzags will most likely occur. Any trades placed must be placed manually as the indicator will not place them for you, the analysis provided by the indicator is to give you a better idea of where the trade entries and exits should be. There are few different settings that come with the indicator which can alter the way it looks functions slightly. These include the depth of history to use, the zigzag range to use, and then some various changes to the colors of lines and zigzags on the chart.

Service Cost

The indicator can currently be purchased for $75, it can also be rented on a monthly basis which will cost you $18 per month to use. There is also a free demo version available, but we do not know if this version comes with any limitations or time limits, but it is always worth trying out before purchasing.

Conclusion

There arent any review for this indicator which is a shame as it does not give us actual users’ opinions. There are currently 5 activations, so it is being used by a few people, or at least was at some point in time, but we do not know how well it functions for them. As always, we would suggest that you try out the free demo version before making a purchase, just so you can make sure that it does in fact offer the features that you require and to make sure that you are able to get it set up correctly.

This Forex service can be found at the following web address: https://www.mql5.com/en/market/product/4805

Categories
Forex Service Review

Renko Full Throttle Pro Indicator Review

Renko Full Throttle PRO is an indicator that is the sole product of author Dalya Elsadany. It was launched in August of 2018 and most recently updated to version 1.40 in November of 2019.

Overview

The Renko Full Throttle PRO indicator provides traders with clear “buy” or “exit” signals with TP and SL levels based on information that is received from analyzing Renko and/or standard charts. The indicator also evaluates the overall performance by taking the net points gained from the signals and the spread into consideration so that traders can review that information. Here are a few key highlights:

  • Works on the most popular, most commonly used MetaTrader 4 platform
  • Works on all symbols, indices, & timeframes
  • Doesn’t repaint, backpaint, or recalculate
  • Alert options: sound, pop-up, email, push notifications

While the product can be used on its own, it can also be used in combination with any Expert Advisor.

Service Cost

There are two price options for acquiring the indicator:

  • Rent for $50 USD for one month
  • Purchase for $68 USD

Five standard activations are included with the product. Although the ability to rent does lower the overall cost, the prices are close enough that it may be economically smarter to purchase the indicator, otherwise you’ll be paying more than the overall price by the second month. Note that a free demo is also available for testing.

Conclusion

Renko Full Throttle PRO is an indicator that can be used alone or with an EA to analyze Renko or standard charts for any symbol/indices/timeframe. The product has received a lot of attention on the mql5 website, with 47 reviews, nearly 200 comments, and a 5-star rating. Here’s what some users have to say about their results:

“”This is a really good indicator and EA. Dalya constantly providing better set files. I am really happy with the results on live account and managed to recover cost in a single day with 3 trades. But the most important thing the level of service and help you get from Dalya is excellent.”” -Ujjwal

“”The support is top-notch. Dalya shows amazing patience and works with you to ensure the product you buy and the service is top quality. Simply blown away with Dalya competence and focus on delivering excellent service. Highly recommend”” -amitk01

Judging by the reviews, it seems that the author is highly responsive and willing to help with questions that go beyond her duties. Almost every review mentions how effective the product is and boasts about service quality, so it is safe to say that this is a great product when used appropriately. If you plan on using it, you’ll simply want to compare the renting and purchase cost to make the best investment.

This Forex service can be found at the following web address: https://www.mql5.com/en/market/product/40527

Categories
Forex Service Review

VJ Sniper MT4 Buy/Sell Indicator Review

VJ Sniper is a trading indicator that was created by author Vijayaratna Kumar Boda and launched on the mql5 website in August of 2015. Most recently, the product was updated to version 4.0 in March of 2019.

Overview

VJ Sniper provides buy signals for uptrends and sell signals for downtrends on the MetaTrader 4 trading platform. It is based on the close of the previous candle so that traders can enter at the beginning of the candle in order to avoid waiting for the closing of the candle.

Here are a few more facts about the indicator:

  • Works on any timeframe except M1 – M30, H1, H4 are recommended
  • Contains 3 trend bands & signal arrows
  • Best used with Forex instruments
  • Automatically drawn support & resistance line lets traders choose the best signal
  • Does not repaint on low volatile instruments, rarely repaints on high volatile instruments

The developer doesn’t try to lure in traders with promises of amazing results, he is very straightforward about the fact that this product reduces false signals as much as possible and bases its signals off of high profitability. He also explains that it is best to use this indicator in combination with other products, especially Price Action & Candlestick strategies for the best results.

Service Cost

There are two options available for those wishing to acquire the indicator:

  • Rent for $22 USD for one month
  • Purchase for $66 USD

This indicator should be used in combination with other products, so you’ll need to consider the total cost of your investment. A free demo version is also available.

Conclusion

VJ Sniper is an indicator that provides early buy/sell signals based on the closing of the previous candle and high probability uptrends and downtrends in the market. It works best with low volatile instruments and certain timeframes, and in combination with other products. This product has received mostly 5-star ratings, but there are a few one-star reviews in the mix. For example:

“This indicator is 10 times better than Bollinger bands. It gives you more precision and you can determine support and resistance levels way better. For the price this indicator costs it’s almost free.” -PES

“This has to be the best indicator I have ever come across. When used with MACD crossover (if possible) then it works amazing well.” -John

“This one repaints a lot. The arrows and the channel!!! Stay away” -Stephane

Most of the one-star comments, like the one above, mention repainting as the primary issue. The best way to avoid this would be to stick with low volatile instruments. Still, even with a handful of bad reviews, the indicator has still managed to earn a 4 ½ star rating. This could certainly be a useful product when it is put in the hands of a trader who practices effective risk-management while avoiding certain instruments.

This Forex service can be found at the following web address: https://www.mql5.com/en/market/product/11256

Categories
Forex Service Review

Two MA Crossover Indicator Review

Two MA Crossover is a trading indicator that was published on the mql5 website by developer Thushara Dissanayake in December of 2017. It was last updated to version 1.5 in November of 2018.

Overview

Two MA Crossover is an alert system that attaches to MT4 charts and notifies traders of “buy” or “sell” signals when it detects moving average crossovers based on the user’s settings. It is based on the well-known Moving Average Crossover trading strategy, which looks for periods when a short-term moving average crosses above or below a long-term one to define a short-term trend. Many of its features focus on the alert settings that are available with sound on mobile, email and pop-up alerts. Additional email alerts can be set for time-frame, bid, ask, signal, spread, account balance, and several other options.

Service Cost

This indicator can be rented for the low price of $10 USD for an entire year, or purchased for $30. It comes with 50 activations, which should be enough to last a lifetime (most standard indicators only allow 5 total activations). The author does promote an automated EA named Crossover action and an indicator named Three MA Alert, both of which would work well with this product. If you’re interested, both can be rented for $10 a year or purchased for $30, the same as with this product. Free demo versions are also available for each product.

Conclusion

Two MA Crossover was designed to provide traders with buy/sell notifications when it detects moving average crossovers, which detect short-term trends. Naturally, this indicator is intended for those that don’t want to miss market events and that are familiar with the Moving Average Crossover trading strategy. If you’re curious about feedback, take a look at what this user has to say:

“PERFECT! This indicator works really well in combination with my strategy.” -John

The product’s 5-star rating is only based on two reviews, so do keep that in mind. We would only recommend renting/buying this indicator if you are familiar with the concept behind it, or to consider purchasing the inexpensive EA if you don’t want to do all of the trading manually. Either way, this is a useful product that seems to do its job effectively.

This Forex service can be found at the following web address: https://www.mql5.com/en/market/product/27090

Categories
Forex Service Review

Volume Pointer Indicator Review

Volume Pointer is an indicator that was created by author Adrian Modlinski to aid traders. It was published to the mql5 marketplace in March of 2015 and most previously updated to version 1.1 in July of the same year.

Overview

This indicator’s purpose is to confirm whether the open interest among traders is high or low, according to the volume. This data is useful because volume is the most valuable data after the price. This can be measured on any type of security, such as stocks, bonds, commodities, etc. Volume Pointer also works with what is likely the most popular trading platform in existence, MetaTrader 4. Traders should note that it is impossible for the indicator to pinpoint the exact volume; however, it makes the closest estimate possible based on the number of ticks.

Service Cost

Traders can buy the indicator for $29 USD with 5 activations, or choose from several renting options:

  • Rent for 1 month for $10 USD
  • Rent for 3 months for $12 USD
  • Rent for 6 months for $15 USD
  • Rent for 1 year for $19 USD

A demo version is also available and can be accessed from the author’s portfolio on the website.

Conclusion

Volume Pointer provides traders with the closest possible estimate of volume. It is a fairly simple indicator, which works with any type of security on MT4. The indicator had received a 5-star rating, which is based on the following review:

“Great product! I was looking for something that would allow me to get an overall look at volume instead of looking it on a single bar basis. This is product exceeded all my expectations! Thank you to Adrian for creating such a simple and powerful tool.” -ninja3925

While there isn’t any other feedback, the above review tells us that the product does what it is advertised to do effectively. Should you decide to purchase it, you’ll have the advantage of choosing from several pricing options, starting as low as $10 USD for a month.

This Forex service can be found at the following web address: https://www.mql5.com/en/market/product/8369

Categories
Forex Service Review

Super Soft Indicator Review

Super Soft is an indicator that was uploaded to the mql5 online marketplace by Tatisiana Mironava in December of 2018. The product has never received any updates.

Overview

This indicator was developed with both binary options and scalping strategies in mind. Through the aspect of binary options, the indicator needs to decide if an underlying asset will be above a certain price at a certain time, resulting in either a fixed payment amount or nothing at all. At the same time, the indicator follows scalping techniques that would require the user to place multiple trades in order to profit with small gains that add up over time.

The indicator uses a complex algorithm to decide which trades to place while following those ideas and provides trades with time-sensitive signals that let them know when to enter and exit the trade. Beginners shouldn’t have any issue using this tool, as parameters are very limited, and placing a trade is simple – traders should open a deal when the up arrow appears, and close the deal when the down arrow appears.

Service Cost

Perhaps one of the main reasons that this indicator hasn’t received any feedback is the cost. At $300 USD, Super Soft is priced well over the $30 average we’re used to seeing for the type of product. Keep in mind that the product would eventually pay for itself if it’s worth it, but the author doesn’t offer the ability to rent it, which isn’t the best sign. If you’re interested in testing, then the demo version will be the only option that doesn’t break your bank account.

Conclusion

Super Soft is a beginner-friendly indicator that uses a unique algorithm to determine when traders should execute deals based on binary options and scalping methods. Overall, it sounds like a well thought out product, but here’s where we’re skeptical – the $300 product doesn’t have a single rating, review, or comment, and it’s been on the market since 2018. Sure, 60+ users have tested the demo account, so it isn’t a completely disregarded product. We just aren’t so sure about paying that amount of money for something that could go either way, especially when there are so many products out there with tried and tested user reviews. If you think the general idea behind this tool is noteworthy, then you’ll have to decide whether you’re willing to be one of the first ones to try it out.

Categories
Forex Service Review

Weis Wave with Alert Indicator Review

Weis Wave with Alert is a trading indicator that was published on the mql5 website in May of 2018 by author Panagiotis Diamantopoulos. The most recent update to version 5.9 occurred in September of 2019.

Overview

The Weis Wave indicator is based on Richard D. Wyckoff’s theory, which involves a 5-step approach to stock selection and trade entry. To explain its purpose more directly, the indicator adds the volume of previous price waves, draws a histogram, and follows a special pattern that predicts where the market will go by reading previous waves. Each wave moves up or down until it reverses, and in order for the wave to reverse in the opposite direction, the price must exceed the number of points set in the parameters. Although the last wave repaints, the trading method still manages to let traders know which way the market is heading.

This is especially helpful for trend trading, although other strategies can be used as well. Here are a few key facts about the indicator:

-Works on the award-winning MetaTrader 4 platform.

-Can be used in any market or timeframe with range bar and tick bar charts (not to be used with constant tick charts).

-Speed Index has been added to show the speed of the wave.

-Alerts can be set up when the waves meet certain criteria set in the parameters or if the Speed Index is above/below a certain value.

-Manual and YouTube channels are provided to explain wave trading.

Service Cost

The author offers three separate pricing options, along with demo accounts:

  • Rent for $140 USD for one month
  • Rent for $320 USD for 3 months
  • Purchase for $420 USD

Each option comes with 5 total activations of the product. For an indicator, the price is set fairly high, as traders can find many options in the $30 range, or purchase an automated trading robot for less than the monthly renting price in some cases. Keep reading to find out if others got their money’s worth.

Conclusion

Weis Wave with Alert is based on the Wyckoff Method, which was created by Richard D. Wyckoff, who is considered a pioneer in the technical approach of the stock market. The indicator analyzes waves, follows a system to predict which way the market will go, and provides traders with helpful alerts when waves follow certain criteria. It’s on the expensive side, so we were curious about other’s experiences. Fortunately, 5/5 users have left a 5-star review. Here are a few examples:

“Simply a good quality indicator. It helps me to understand what the market is doing. Suitable for a different type of strategies.” -johnlyj

“This purchase was smooth and the indicator delivered exactly as it promised.” -knighttrader7

“…The alerts help you monitor wave pips and the download is perfect and trouble-free, an upgraded indicator is certainly worth paying for and also has many different trading opportunities…” -forix7

The last user went on the claim that the product paid for itself within the first 12 hours of using it, although this wouldn’t be the case for everyone. Still, feedback for this product is excellent and it seems to be a helpful tool when used correctly. If you can afford it, then you’ll want to consider whether this indicator could be helpful in combination with your personal trading strategies.

This Forex service can be found at the following web address: https://www.mql5.com/en/market/product/29677

Categories
Forex Service Review

TrendMagiX Forex Indicator Review

TrendMagiX is an indicator that is available on the mql5 marketplace. It was developed by Radek Reznicek, who has published 25 separate products on the website. The indicator was originally added on January 11th of 2020, with the latest update to version 2.4 occurring a few months later.

Overview

TrendMagiX is a trend-following indicator that uses an advanced algorithm to provide traders with trend detection alerts, take profit advisors, and a success rate calculator. Traders will find that the indicator is compatible with the most well-known trading platform, MT4, and it is versatile enough to be used with any timeframe or trading instrument. It is important to use the correct timeframe for the type of trading you’re doing, however, i.e. D1 and above for long term trading, M15 for scalping, and so on.

Service Cost

Traders can buy the indicator outright for the standard $30 USD price, or rent it at a lower rate. There are multiple renting options, including $15 for one month, $20 for 3 months, $25 for 6 months, or $29 for one year. The developer’s decision to offer lower prices is an added advantage, along with the fact that free demo versions of TendMagiX are also available for testing.

Conclusion

TrendMagiX is a trend-finding indicator that works with all timeframes and instruments, although traders will want to use specific timeframes with certain strategies. It is suggested to use pairs with a success rate that is higher than 65%, along with a low spread broker for scalping strategies. It costs $30, but it can also be rented at various lower rates. This indicator is well-liked among community members, with all 21 reviewers giving it a 5-star rating.

Here’s what some traders are saying:

“This indicator is easy to use and it is powerful. Author is also very helpful and is responding fast.” -StephB

“The best indicator I have tried.”-Maxitrader87

“It’s Great, its push notification is invaluable.” -Simba

As you can see, this is a tried and tested product that has been used effectively by multiple traders. The best way to set yourself up for success would be to choose the most economic price option and to follow the author’s advice (located within his attached blog) about the best ways to use this indicator.

This Forex service can be found at the following web address: https://www.mql5.com/en/market/product/45324

Categories
Forex Service Review

Harmonic Pattern Plus MT4 Indicator Review

Harmonic patterns are used to best predict the possible tipping point in trends. Therefore, the harmonic patterns are the secondary patterns of the inflection point patterns. Traditionally, the Harmonic Pattern was identified manually by connecting extreme points in the charts. Manual detection of harmonic patterns is quite tedious and not suitable for all traders. It is often exposed under the subjective identification of the pattern with manual detection of the pattern. To avoid these limitations, Harmonic Pattern Plus was designed to automate your harmonic pattern detection process.

Overview

The functionality of the Harmonic Pattern Plus goes beyond the manual pattern detection and focus that appears in textbooks. Harmonic Pattern Plus provides many harmonic patterns that have been tested in many historical moments, and have been researched by its developers. In addition, you can use the three most important trading items, including the Pattern Completion Interval (PCI), the Potential Investment Zone (PRZ), and the Potential Continuation Zone (PCZ), to improve the accuracy of your trade. You will be able to experience, with the use of this indicator, very high performance in your trade.

The main features of the Harmonic Pattern Plus are:

  • Up to 11 Harmonic Patterns can be detected automatically.
  • Detection of potential investment area (PRZ) for identification of point D.
  • Detection of potential continuation zone (PCZ) for prediction of future price movements.
  • Pattern termination interval detection (PCI) for precision trading.
  • Forward and backward response function to create a new trading strategy.
  • Function locking and unlocking patterns to avoid repainting patterns.
  • Up to 52 different upward and downward patterns characteristic of candelabra recognition.
  • You have email support, sound alerts or Push notification
  • Setting Harmonic Pattern Plus indicators and Parameters

The default setting will work most of the time. If you want to change the look of the indicator on your chart, you can certainly change it from the input settings to your liking. All input settings are self-explanatory. The simple description is given in the columns on the left side and you will only need to change the value in the columns on the right side.

Special Note

The purchase of this product does not include free encoding support to build EA or any other indicator. All the harmonic pattern indicators and the scanner are repainting. If you prefer not to repaint Elliott’s harmonic pattern and wave pattern indicator, please use the cost-effective pattern scanner. The cost-effective pattern scanner is just a harmonic pattern indicator not repainted and not delayed in the world.

Conclusion

In short, we are talking about an indicator that is well known and used, especially by experienced traders. This indicator was created in 2014 and since then has accumulated hundreds of comments, most of them very positive. So we can say that this is a highly useful indicator. This indicator can be found in the MQL market in the indicators section for a price of 98 USD, although you can also rent it monthly for 30 USD. It has a free demo version so you can try it before purchasing it and see if the indicator can be adapted to your trading style or not.

This Forex service can be found at the following web address: https://www.mql5.com/en/market/product/4488

Categories
Forex Service Review

I Win Forever Indicator Review

I Win Forever EA is a robot created in March 2020 by Bulgarian developer Kolyo Kolev. The I Win Forever EA is a robot that works with multiple indicators grouped in pairs with different input parameters. The robot opens offers in both directions and may or may not use a stop or benefit.

Overview

When you purchase the robot you will get the optimal configuration for 8-10 currency pairs and long proven gold. You can download the demo version and upload it to a demo account and try it out in real-time or try it out in a strategy tester. In the trial version, we will load ready configurations for 2-3 currency pairs and gold. For optimal real-time operation, a virtual server must be used (VPR), and in case you do not have a server, you will have to leave the computer on 24/7 to make sure the transactions are executed correctly.

For each currency pair, you need between 700-1000 USD balance on the balance sheet and 1000 USD to trade gold. The developer claims that this robot is able to generate a minimum profit of 500-800% in a year, which to us seems an excessive profit and too good to be true, but nothing is impossible.

Additional considerations:

  • Larger accounts equal larger profits.
  • Any disconnection or sleep from the computer will disrupt functionality.
  • Some brokers may not be suitable.
  • Testing on leverage account set at 1:500 is recommended.
  • No need to change anything from the default settings.

If you make a calculation of what it’s worth to keep your computer working, then it’s possible for the VPS to come out cheaper and you don’t risk having the robot stop working. The developer will help you to configure the robot according to your own personal trading account. This is a good move on the part of the creator.

An important condition is to test the robot on the account that you are going to use. The specified test period is for demonstration only because the test takes quite some time. If you are testing, set a period of at least 1 year or longer. You can stop the tester with the stop button and then select the configuration if preferred. As with any EA, it is highly recommended to use an ECN account combined with a reliable broker with low latency, this way transactions will be completed faster.

Conclusion

In conclusion, we are talking about a robot based on position management. It matters not so much whether you open a purchase or a sale but how much you get out of the position. The developer does not explain many details of how the robot works apart from this, but it does seem to have been developing this EA for a long time. The after-sales service seems good and personalized, and this is to be welcomed given the high price of this tool. The selling price of I Win forever EA on the MQL market is 1200 USD, and is also available for rent at a price of 250 USD for a 3-months of use. Our advice is always to download the free demo version to know how the tool works, and to be able to verify the profitability that can be expected from it.

This Forex service can be found at the following web address: https://www.mql5.com/en/market/product/47748

Categories
Forex Service Review

Narrator Fibonacci Auto Indicator Review

The Moving Average Cross EA is an expert advisor that can be found on QUIVOfx. The expert advisor is currently on version 1.03. The way that the expert advisor works is that it will use moving averages to trade, a buy signal will be generated from the moving average crosses, either buy or sell depending on where the cross is. The expert advisor allows for trading simple, exponential, smoothed, and linear-weighted moving averages.

Overview

The Moving Average Cross EA can be used on the MetaTrader 4 trading platform and is currently not available to sue on any other platforms, it comes with three different versions, Basic, Advanced, and Pro, each having their own little features.

-The Basic version comes with money management, the ability to trade on a new bar, and an inverse strategy.

-The Advanced version comes with everything the basic version does, as well as the ability to use trailing stops, a break-even system, a spread filter, an MA trend filter, and a feature called trade max once per bar.

-The Pro version comes with everything the advanced and basic versions do, as well as the ability to close on a new signal, the martingale system, a candle trail, an ATR trail, a da/time filter, the ability to reverse on opposite signals and a trade direction feature.

Service Cost

The basic version of this expert advisor is free of charge, the advanced version has a cost of CHF 29.90 while the Pro version has a cost of CHF 39.90. There isn’t a demo but as the basic version is free, this could be used as a demo for other tier versions. If you do not like the expert advisors, you are able to exchange it for a different one within the first 7 days after purchase.

Conclusion

There aren’t any written reviews on the site, instead, there is a small rating section that has had 361 ratings added to it. The current score is 4/5 stars which are pretty impressive for something with so many ratings, this shows that it must have some potential and works for the majority that is currently using it.

This Forex service can be found at the following web address: https://www.mql5.com/en/market/product/11578

Categories
Forex Service Review

Narrator Fibonacci Automated/Manual Indicator Review

Narrator Fibonacci Auto and Manual can be found on the MQL5 marketplace, it was first uploaded by Artiom Choults on the 20th of October 2015, it has not received any further updates and so the indicator is still on version 1.0.

Overview

Narrator Fibonacci Auto and Manual is an indicator that was created for the MetaTrader 4 trading platform, its main purpose s to draw ZigZags onto the chart, it will then use these ZigZags to work out Fibonacci levels, it will do the majority of it fully automatically.

The main benefits of using this expert advisor:

  • Voice alerts, with a built-in sound pack.
  • User-friendly navigation and interface.
  • Highly customizable input parameters.
  • Recovers itself after lost Internet connection, terminal restart, or timeframe change.

You do not even need to be in front of your computer and still have an idea where the market is heading to simply by listening to the voice alerts. You can predefine yourself the number of pips you want to be alerted in advance. Currently, they support the following levels: 38.2%, 61.8%, 127.0%, 161.8%, 261.8%, 423.6% and 685.3%.

If you do not use all these levels, then you can easily remove them in the “Fibo properties…” window after selecting and right-clicking on the Fibonacci object. The alerts for the removed levels will disappear automatically. In terms of parameters, three are a few such as setting the depth, deviation, backstep for ZigZags, changing the number of ZigZag lines, which lines to use Fibonacci levels on and more.

Service Cost

The indicator will currently cost you %400 if you wanted to purchase it outright, this will give you 7 activations of the software. There is also the option to rent it, you can do this on a monthly basis which will cost you $20 per month, for three months it will cost $40, for six months it will cost $59 and for a one-year rental, it will cost you $100.

There is a free demo version, but the details of it are not stated, due to the lack of information it may only be usable on the strategy tester within MetaTrader 4.

Conclusion

Sadly, there are no user reviews given for the indicator so we do not know how people are finding it or if it is, in fact, doing what it is meant to be doing. There are two comments from people who have purchased it, the developer has not responded to either of them which is not a great sign, we would strongly suggest trying out the free version, we would also send any queries or questions that you may have to the developer, to make sure that it will do what you need it to, and also to check whether the creator of the indicator is still supporting it and the people who have purchased or rented it.

This Forex service can be found at the following web address: https://www.mql5.com/en/market/product/11578

Categories
Forex Service Review

Market Profile Multi-Sessions Indicator Review

The Market Profile Multi Sessions is an indicator that can be found on the MQL5 website and marketplace, we have provided a link just in case there is another similarly names indicator so you know exactly which one we are referring to. The original indicator was released on the 16th of April 2015, it has been updated a number of times and was last updated on the 25th of December 2017 and is now at version 1.53.

Overview

The Market Profile Multi Sessions is an indicator that can be used with the MetaTrader 4 trading platform. The indicator is designed to give a graphic representation that will show you the price and time information of distribution.

The indicator can:

-Determine the amount of time, number of ticks and volume traded at specific price levels or price ranges during a period
Identify prices perceived as fair by the market.

-Identify support and resistance levels to anticipate future price movements.

The indicator will show you the price ranges where trades were made and the most traded trade ranges.

Some of the main other features of this indicator:

-It can have up to 4 sessions each day. You can choose whether to display 1, 2, 3, or 4 sessions by enabling or disabling the session number from indicator parameters.

-View the market generated data at glance, such as IBR (the Initial Balance Range), VA (Value Area), POC (Point of Controls), Single Print, Half Back (Mid Line).

-Mark price range levels by clicking the additional price scale level created by the indicator.

-View Splitted Profile (Segmented Profile).

There is a large number of parameters available, these include things like grid multiplier. Tick volumes, font sizes, row sizes in pips, and more.

Service Cost

The indicator can be purchased for $38, it can also be rented, you can rent the indicator for 1 month which will cost you $13 per month, you can also rent it for a 3 month period which will cost $20. There is also a free version available, but we do not know what the limitation of this free version is.

Conclusion

There are 9 reviews available, the overall rating of these reviews is 4.5 out of 5 stars which is an impressive score, the majority of the reviews are 5-star with a single 3-star review and one 4-star review.

“It is nice, but it needs the “merge profiles” function, like in TPO Chart2. You could add the tick volume profile to TPO Chart 2. We should be able to customize more options like the value area size, what If I wanted to use a 25% value area instead of 70%? We should be able to choose the value area to be highlighted based on TPO OR the volume profile. Should be able to show only TPO POC or Volume Profile POC. When those features are added I will give 5 stars.” – A 3-star review.

“This is really useful, all you need for trading with Profiles!” – A 5-star review.

“Thank you! It is really perfect work. I wish you much success my brother” – A 5-star review.

So the reviews ar every positive which shows that it does what it is meant to, you should always try out the demo version though, just to make sure it suits your needs and that you are able to get it working prior to splashing out any money.

This Forex service can be found at the following web address: https://www.mql5.com/en/market/product/9008

Categories
Forex Service Review

Market Open Hours Indicator Review

The Market Open Hours Indicator can be found within the indicators section of the marketplace on the MQL5 website. We have provided a link to it just in case there are others with similar names. The indicator was uploaded by Kok Jye Yen on the 4th of July 2016, it has had a few updates, the most recent update was on the 11th of June 2018 and that brought the indicator up to version 1.3.

Overview

The Market Open Hours is an indicator for the MetaTrader 43 trading platform, the purpose of the indicator is to show you the times where the markets open, change, and close. This will allow you to know when the liquidity in the markets might change, such as a time when the markets switch over, the indicator works with the M1, M5, M15, M30, and H1 charts and can give up to a 2-week time span.

Some of the main features of this indicator:

-Changeable market name; up to 7 market names with their respective time zone and color settings.

-Changeable open and close market hours for each market name. Default settings – open: 08:00, close: 17:00.

-Time Bar (option to turn On/Off).

-TimeLine (option to turn On/Off).

-Event Label (text indicating opening/closing on the timeline for the respective market, with the option to turn On/Off).

-Changeable market place name, time zone, and color.

-Dynamic Time Zone handling; meaning whichever time zone your server maybe, this indicator manages it dynamically. Hence, the indication of market opening hours is always correct.

-Dynamically handles daylight saving according to your PC settings.

-Time Bar and Event Label adjust dynamically with each change of the chart, giving the trader a sense of order.

There are also a number of parameters that can be altered, these include things like the market, time zones, time to open and close bar colors, to display bars, lines and labels, local time zone, number of weeks to display, and line and text color.

Service Cost

The indicator can be purchased for $200, this will purchase it outright and give you unlimited access without any limitations. There are also a few options to rent it, you can rent it on a monthly basis which will cost you $20 per month, for three months it will cost you $50, for six months it will cost you $75 and for one year it will cost you $100.

There is a free demo version, however, the site does not indicate what the possible limitations of the free version are, we would still suggest downloading and trying it out though.

Conclusion

Unfortunately, there aren’t any reviews available for the indicator, there is also just one comment the developer replied to it promptly which is positive. Due to there not being any reviews, we would very strongly suggest that you download the free version, even with the limitations that it may have, you should also contact the developer with any questions, this way you can make sure that the indicator is right for you before you make a purchase or a rental.

This Forex service can be found at the following web address: https://www.mql5.com/en/market/product/17075

Categories
Forex Service Review

Fractal Breakout Indicator Review

The Fractal Breakout Indicator is a creation from Forex Trading Robots, a site, and a company that has created a large number of different bots. This is slightly different from the other creations as it is an indicator and not an automated trading robot.

Overview

The purpose of this robot is to pinpoint the perfect trade on any forex chart. There are a number of features boasted on the site, some of them include the fact that the indicator evaluates the strength of a particular trend and calculates the best time to enter based on retracements. After a retracement, the indicator waits for a fractal set up. Easy to read arrows let you know a potential trade is coming up. It also has built-in Fibonacci levels in order to automatically take profits.

The indicator has been designed to work on the MetaTrader 4 trading platform and does not seem to be compatible with any other platform.

They have a few results posted on the site, we will have a brief look at the past three months results:

  • January 2020: $30,669
  • February 2020: $28,306
  • March 2020 up to 14th: $17,934

These results are very impressive, especially during a period of major volatility (the Coronavirus outbreak). In fact, they are a little too good, when we look into them in more detail, we can see in March 2020, there was a profit of nearly $18,000 (at the time of writing) and an absolute drawdown of just $22, these are some of the best figures you will see anywhere in the world, and so this leads us to believe that they may not be exactly true.

With lot sizes of 1 lot, we would expect a far greater absolute drawdown. The account being used also applies to be a demo account with equity of nearly 4 million USD, not an account size any of their potential clients will be using. The results are just as unrealistic on the February sheet, with an absolute drawdown of exactly 0 USD… a bit too hard to believe. The results have also not been verified by a third party like My FX Book, so there is a chance they could have been doctored.

Service Cost

The robot currently costs $59.00 to purchase, this is with a 70% discount as it originally cost $199.00, this is a similar discount to all other robots on the site and they seem to be on a permanent sale. There is also a timer on the site indicating that the sale will end, however when you refresh the page the time resets, this is a devious marketing ploy used by a lot of marketers to try and coerce people into making hasty purchasing decisions. There isn’t a demo available of this robot, but Forex Robot Trader is providing a few demo bot to use in order to test out how they may work.

Conclusion

There are a number of reviews on the site from customers, however, it always builds a bit of skepticism when all the reviews are 5 starts, there is just 1 four-star review, the order of the reviews in terms of where the 4-star review is located is very similar to the other robots on the site, so this again leads us to believe that the reviews may not be real.

“Here’s a quick shout to let you know this week has been a.w.e.s.o.m.e.! With the help of the webinars, I managed to close out 900 profit.” – A 5-star review.

Other reviews from around the internet state things like “I bought the EA and it doesn’t work as shown on the website. The website shows super high profits while my own account was killed within 2 weeks.” So there is a huge contrast in the opinions being made, we understand that Forex Trading Robot may not want to add lower star reviews on their site, but only having 5-star reviews is a little deceiving.

This Forex service can be found at the following web address: https://www.forexrobottrader.com/forex-indicators/fractal-breakout-forex-indicator

Categories
Forex Service Review

Cluster-RSI Indicator Review

The Cluster RSI can be found within the Indicator section of the MQL5 marketplace. There are several indicators with very similar names, so we have added a link below to the exact indicator that we are looking at. The indicator was first uploaded on the 31st of July 2015 by its creator Ahmed Saad Soliman, there haven’t been any further updates so the indicator is still on version 1.0.

Overview

The Cluster RSI is an indicator that has been created for the MetaTrader 4 trading platform, the indicator will calculate the performance of each currency against the 8 major currencies (EUR, USD, GBP, AUD, NZD, CAD, CHF, and JPY) using RSI. The Cluster RSI indicator will buffer 2 lines for each currency that is attached to the chart. So for the GBPUSD pair, it will draw a line for GBP and for USD.

The main advantage of the Cluster RSI over normal RSI is that the normal RSI only looks at the overall speed and movements, while the Cluster RSI looks at both currencies involved giving a much better view of what is actually happening.

There are just two inputs and parameters that can be altered within the indicator:

  • RSI Period: This is the RSI value, 14 is the Default input.
  • RSI MVA Period: This is MVA Period to smooth RSI Line, 5 is the Default Input.

You can use the indicator in the following ways:

-Lines Crosses.

-For Intraday Time Frame. This is working well when we use multiple Time Frames and take the cross over in the overall Trend Direction.

-For Daily Chart we can take the crosses in the direction of the moving average (for example when the price below 200MVA we will take the cross over and when the price is below 200MVA we will take down cross over).

Overbought and oversold with Divergence:

  • First Line currency (Base Currency or First Currency in the symbol) is overbought.
  • Price is making higher highs and higher lows.
  • Second Currency Line is making Divergence.

Service Cost

The Cluster RSI indicator can be purchased outright for $25, there isn’t a chance to rent this indicator, the only option is to purchase it. There is a free version available, this will have some limitations to it, but at this time we do not know what the limitations of the free demo version are.

Conclusion

At the time of writing, there are currently 4 different reviews available, each one giving the indicator a 5 out of 5 ratings.

“Very good! Thanks, Ahmed! Any chance you could optimize it for metals?” – User Review

“Hi Traders, here I review a very good product based on clusters(I recommend studying this stuff). It is working properly as described if you have enough history onboard (MT4). Support is very good and does solve your problems, if necessary. I don´t regret buying this high quality and really cheap product. 5 Stars Thumbs up! These days I realized, that you can use the indicator for signals from base currencies crossing the 50 line. In comparison with the normal RSI, you get earlier trend signals. But, still, you have to look at the currencies cross each other. In the case of the base currency cross the 50 line before the currencies cross each other, look carefully at your trade. If the currencies cross each other before the base currency crosses the 50 line, it would be a really strong signal. The Cluster RSI is just worth the money.” – User Review

So as you can see, the reviews are very positive, there are also a few comments, the author of the indicator has replied to some of them but not the most recent ones, however, it has only been a day or so. As there aren’t too many reviews, we would highly recommend that you download and try out the free version, this will give you a chance to try it out and ensure that it works before you put any money down for a purchase.

This Forex service can be found at the following web address: https://www.mql5.com/en/market/product/10648

Categories
Forex Service Review

Color Trend FX Indicator Review

The developers of the Color Trend FX indicator claim that it shows in the graph the exact entry points to the market, exact exit points, the maximum possible benefit of a trade (for those who make profits according to their own system for outbound offers), points behind open positions as well as detailed statistics. Statistics make it possible to choose the most cost-effective trading instruments and also to determine the potential benefits.

Overview

The indicator does not redraw your signals, is easy to configure and manage, and is suitable for beginners, advanced merchants, and professionals. Color Trend FX is just one part of the business tool portfolio that has Alexey Minkov, the developer of this indicator, and will, therefore, be continuously updated and supplemented with new features, which will be available to all users. He is a very active developer and gives an excellent after-sales service to his clients, according to the opinions contrasted by us.

Color Trend FX Features:

  • Automatically determines market entry points
  • Automatically determines market exit points
  • Can be used in any symbol and deadlines
  • Ability to track open positions
  • Extended ticket statistics (separate for bids for purchase and sale)
  • Email notification, terminal alerts, and push notifications functions
  • The signs are not repainted
  • Signs strictly on the “Bar Lock”

Main Adjustments

-Accuracydelta – precision of the input filter. The lower the value, the more “noise” the signals.

-If the rating is large, the signal may be delayed.

-Days needed for calculation – total number of days for calculation.

-If your computer is not very up-to-date on hardware, you may be able to limit the number of bars for calculations

-Show extended statistics – shows extended statistics on offers.

-Delta to Draw Arrows (in Pips) – scrolling in pips to show the signs on the chart.

Important Note

The purpose of this instrument is to show precise entry points, points for final open positions, and exit points. It also shows statistics on the potential benefit for the current instrument and the time frame. It is not advisable to trade during important news, in order to avoid false entries. Trading in a low volatility market is not recommended.

The principle of using the average profit data in the current symbol and timeframe. By analyzing different pairs and time frames, you can choose the most cost-effective pair and the right time frame for your trading style. Knowing the average benefit of the current instrument and the timeframe, you can select the average profit level for the next operations.

Conclusion

In short, we talk about a very complete indicator and it can be very useful for a beginner trader, as it is a straightforward tool to use and to understand. This indicator can be found in the MQL market in the indicators section, at a price of 60 USD, is not available for rent, but it has a demo version so you can try it out and know it before buying it.

This Forex service can be found at the following web address: https://www.mql5.com/en/market/product/21331

Categories
Forex Service Review

CCI Divergence Indicator Review

CCI Divergence is a reasonably useful indicator in itself, but it is even more effective when used with divergence pattern trading. The CCI Divergence indicator signal is one of the most potent signals among the indicators that exist in the market. Divergences indicate a potential investment point because the directional moment does not confirm the price. A bullish divergence occurs when the underlying value makes a low, and CCI forms a higher low, showing less downtime. A bearish divergence is formed when security records a higher and the JRC forms a lower high, showing less upward momentum.

Overview

The indicator, in addition, finds hidden divergences (HD). Hidden divergences are in the direction of the trend, and are often powerful signals for trade. This indicator is very functional and can significantly improve the outcome of your trading. With this indicator we can use several time frames, although time frames below M15 are not recommended, the most recommended are H1, H4, and D1.

Method of Price Detection

The indicator detects the price pivots and checks the corresponding value of the pivots on the CCI indicator. When divergence is found (a price movement with the oscillator in the opposite direction), the indicator will draw lines on the chart and the oscillator.

Parameters that can be adjusted on the indicator include:

  • ICC Period
  • CCI drawing type (line or histogram)
  • Color Of Lines CCI/ Bars
  • Bullish divergences, (Choose a color to draw bullish divergences)
  • Bassist Divergences, (Choose a color to draw bearish divergences)
  • CCI lines/bar thickness
  • Divergences Lines Thickness
  • Divergence line style (Enter a solid, discontinuous, etc.)
  • Alert (on/off)
  • Divergence filter (You can choose to show regular or hidden divergences or both)
  • Send Push notifications (To know when divergence occurs)

Conclusion

We are talking about a primary and very useful indicator, which can be used as a strategy by itself. Among the users’ comments, there are some dissatisfactions about the operation of the indicator in some periods of time, but the developer takes care of all the doubts and updates the versions of the indicator frequently, so it seems that the after-sales service is good. This indicator has a price of only 30 USD, and can also be rented for 12.50 USD for a period of 3 months. Also, you have a free version for your test before you buy it.

This Forex service can be found at the following web address: https://www.mql5.com/en/market/product/30884

Categories
Forex Service Review

AFX Stochastic Trendline Indicator Review

The AFX Stochastic Trendline is an indicator that draws on your screen all trends automatically and is fully customizable. The main features of this AFX Stochastic Trendline indicator are listed in this FX review.

Overview

AFX Stochastic Trendline Indicator draws the following on the stochastic indicator:

  • Moving average
  • Bollinger Bands
  • Trendlines
  • Canales
  • Channels of Linear Regression

This is an indicator for MT4 that detects the most straight trend lines and automatically plots them in the graph. If you often rely on trend lines for your daily trading, this indicator will make it much easier to work with them and ease the need to detect and draw lines each time manually. The indicator shows only the most real trend lines. This means that the line will be removed from the chart if its interaction with the price is no longer expected.

The indicator does not redraw, but can change the angle of the lines when new ends occur. This is a suitable indicator for intraday and swing currency trading. The optimal time frames to work with this indicator are M15-H1.

Trend lines (TL) are a primary analysis tool, so it is compatible with any indicator and trading system. If you are a novice trader, this indicator will help you understand what a trend line is. Also, as you observe the work of the current indicator, you will learn how to draw trend lines on your own. For experienced operators, the indicator will suggest trend line options and also save a lot of time setting them.

Initially, the indicator tries to locate all possible trend lines in the graph. Then, using specific filters, it will exclude more than half of the lines found. Then the indicator checks the quality of the remaining and shows the two best trend lines in the chart. Therefore, there can only be two lines in the chart at the same time:

  • Ascending line (blue)
  • Descending line (orange)

How to Trade with the Trend Indicator?

Most trade techniques with trend lines can be classified into two main groups:

  • Price rebound (reversal) from trend line
  • Break of trend line.

Price Rebound

It has always been commented that trade with trend is the most successful. This is explained by the fact that asset prices tend to continue the trend, while a reversal is less likely. Based on the above logic, it is more favorable to open a trade next time, once the price touches the trend line. When this happens, in addition to a potentially profitable trade, you will also get the optimal risk ratio. Thus, the strategy of “TL’s price rebound” implies:

  • Buy when the price has approached or has touched the rising line.
  • Sell if the price has approached or touched the low line.
  • Breaking the Trend Line

Finally, all trend lines will be broken. However, traders do not miss the opportunity to make a profit, even in this case. That’s why there’s a strategy of how to negotiate when the trend line breaks down.

Conditions for entering the market:

-If the downline has broken, and the price has been set above it, you must make a purchase when the price also touches the line again from the other side.

-If the ascending line has been broken, and the price has been set below it, you must make a sale if the price also touches the line again from the other side.

Conclusion

We are talking about a basic indicator, created in 2015, but quite complete, and that has a good number of users who, in general, are satisfied with it. It is recommended for all types of traders, you can find it in the MQL market for a price of 40 USD, although you also have a free trial version.

This Forex service can be found at the following web address: https://www.mql5.com/en/market/product/12089

Categories
Forex Service Review

ADXS Indicator Review

ADXS is a trend indicator, created in 2014 by Stanislav Korotky. The Mean Directional Index, or ADXS Indicator, is an indicator designed to measure the strength and direction of the market trend. The most powerful business strategies, or at least some of them, revolve around market trends, to work for or against you. If you are able to identify when a trend is forming correctly, you will be increasing the odds in your favor considerably. Just as useful as identifying a trend is measuring its strength. There are a variety of indicators that try to achieve this. ADXS is one such tool.

Overview

The ADXS Indicator is used for three purposes:

  • Measuring the strength of the trend
  • Find the Trend and Range
  • As a filter for different trading strategies

The ADX Indicator can be used in many financial markets, such as stock exchange, Forex, CFDs, etc.

Configure ADXS Flag

The value 14 comes by default, and the traditional way of representing the ADXS is to display three lines below the main price chart.

These lines include the following:

  • A thick blue line for the ADXS indicator
  • A green dotted line for +DI values
  • A dotted red line for -DI values

Basically, the ADXS indicator has a range of 0 to 100. Above 25 to suggest a trending market. Below 20 to suggest that there is no trend or that it is weak.
As you can see, these premises leave you in limbo with values between 20 and 25. For this reason, many technical analysts use the 25 as the key level between the existence of trend and not.

How to interpret the ADX indicator to measure trend strength:

-The ADXS directional system can also measure the change in market sentiment by following changes in price range.

-The current maximum is above the previous maximum, the ADXS indicator suggests that the market is more optimistic than before.

-If the current minimum is lower than the previous minimum, the ADXS indicator suggests that the market is now lower than before.
You can enter these levels manually within the properties of the indicator.

Conclusion

The ADX indicator is a real guide to the strength and direction of the trend. It uses the directional components + DI and – DI.
As a reminder, even if + DI, – DI, and ADXS are displayed simultaneously on the MT4 trading platform, the ADXS indicator for MT4 is a delay indicator. This means it does not indicate a trend until it starts, so you can miss good market entries.

The best way to use this ADX technical indicator is to use it as:

  • A method to confirm an ongoing trend.
  • Complementary tool, together with other analytical measures.

Therefore, whatever your trading style, you can trade a trading strategy with the ADXS flag. There are many similar indicators in the market, we have already analyzed some. We believe that a trend indicator, supplemented by other indicators, is a good option. This indicator does not have many user reviews, but the ones there are positive. If you want to purchase this indicator, you can find it on the MQL market for only 11.95 USD, and you also have a free trial.

This Forex service can be found at the following web address: https://www.mql5.com/en/market/product/5052

Categories
Forex Service Review

Average Directional Movement Index (ADX) Indicator Review

Average Directional Movement Index, or ADX indicator, was developed in 1978. J. Welles Wilder created this indicator, which is a trend based on the moving average. In the ADX indicator, we will display 3 lines: the ADX line, the plusDI (+DI) and the minusDI (-DI). This indicator is included in Metatrader 4 and 5.

Overview

One of the keys in trading is to know if the market is developing a definite trend, bullish or bearish, or on the contrary, if the market is evolving laterally, without a clear impulse. An operator who knows how to interpret market behavior will be better able to adapt its trading strategy or, which is the same, to be able to issue the most appropriate market orders at any given time.

As is known, operating in the direction of a sharply defined trend could reduce the risk of trading and increase the potential profit.
The technical analysis has specific tools to be able to identify the market situation at any time and to be able to determine the strength of a trend.
One of the most used tools for this purpose is the ADX indicator. In fact, ADX is the indicator that is often used to confirm the formation of a market trend ultimately.

The ADX is a technical indicator within the so-called oscillators. Being an oscillator its value moves within a defined range, between 0 and 100. The most important feature to be known about the ADX is that, unlike other indicators, such as stochastic, the ADX does not identify whether a trend is bullish or bearish. What the ADX determines is the strength of a trend. Therefore, a strong upward or strongly bearish trend will present the same values in this indicator. For this reason, the ADX is the indicator used to determine whether a market is in a lateral situation, oscillating over a given range or, conversely, whether that market is starting a new trend.

The ADX c
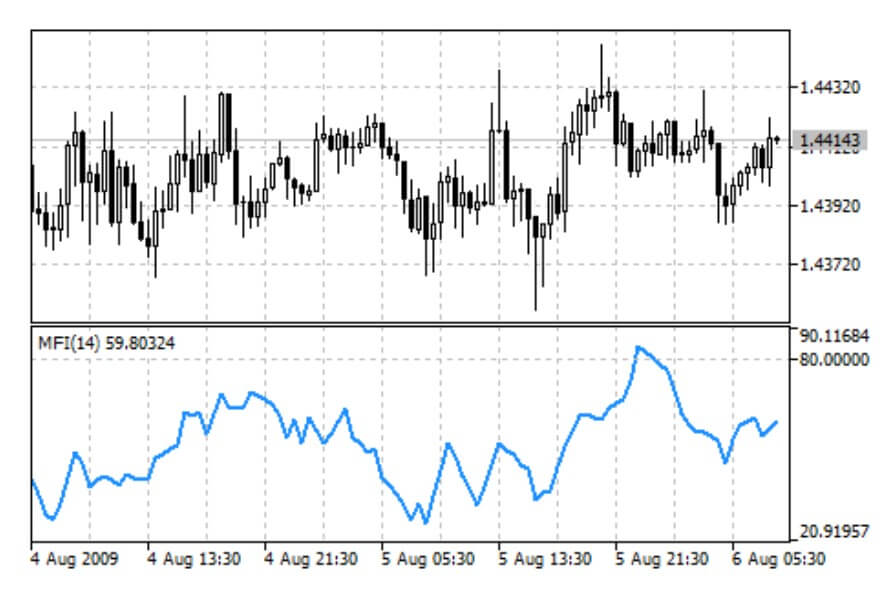
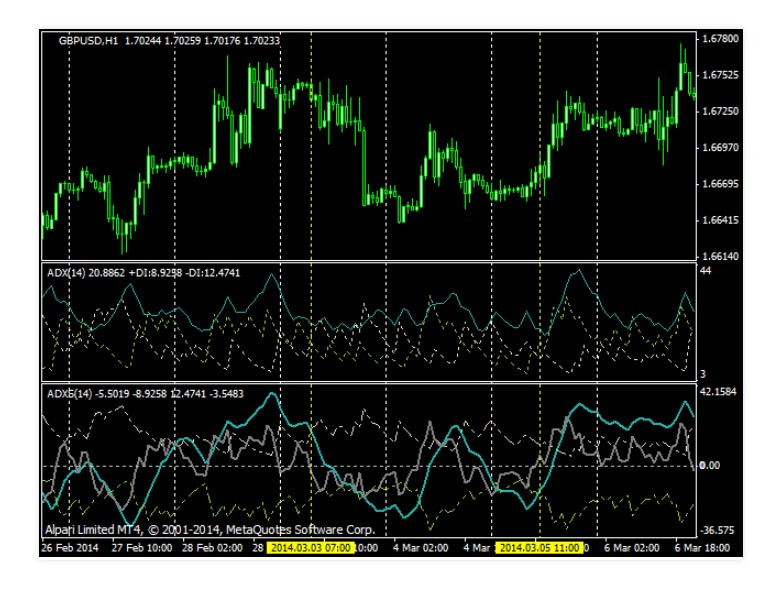
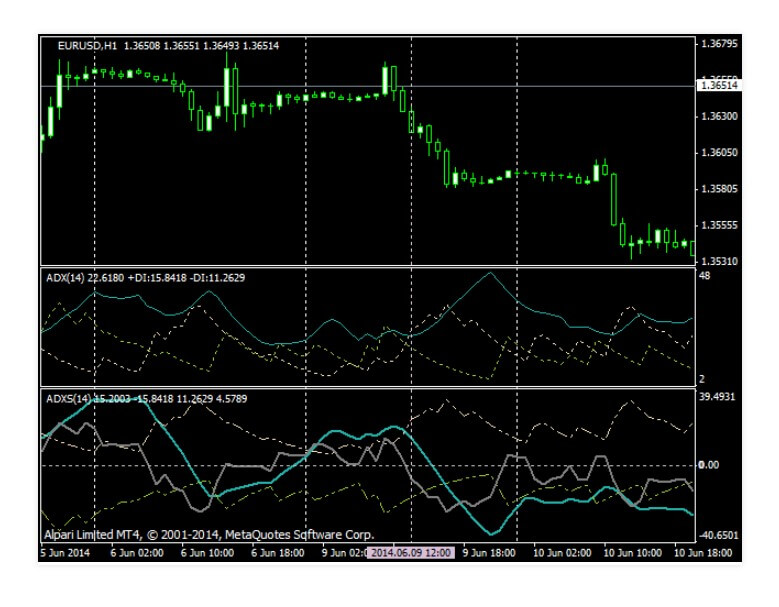
alculation is based on a moving average of the expansion of an asset’s price range over a given period of time. It is usually used as a calculation period of 14 days. The ADX can be used on any product that is traded on a financial market as shares or currency pairs. The ADX is represented as a line whose values range from 0 to 100. The higher the ADX value, the stronger the price trend. Similarly, low values indicate weak trends or even no trend. The following table represents the commonly used reference values when utilizing this indicator:

Value of the ADX Strength of the trend:

  • 0-25 Absence of trend
  • 25-50 The strong trend
  • 50-75 Very strong trend
  • 75-100 Extremely strong trend

The ADX is a key indicator for adapting trading strategies at any given time. An ADX below 25 is indicative that the price of an asset is moving without a definite trend. If the ADX is kept for a time below this value, the price of the asset will likely end up oscillating within a given range, with a defined pattern. In this case, an operator can take advantage of this movement by applying range trading strategies. When the ADX is above 25, the operator will change its previous range strategy and apply the trend based trading strategy.

Conclusion

The ADX EA is a straightforward robot, ideal for a beginner trader who wants to start using an easy to understand the automated system. In addition, there is a free basic version to test the robot with the most straightforward functions. If the robot is satisfactory to the user, there is an advanced version and a Pro version at affordable prices of 29.99 and 39.99 Swiss francs, respectively.

This Forex service can be found at the following web address: https://quivofx.com/expert-advisor/adx-ea

Categories
Forex Service Review

Pyramids Trend Line Indicator Review

Pyramids Trend Line is a trading indicator that was launched on the mql5 website in February of 2020 by author David Ayad. It was last updated to version 1.20 in March of 2020 to add a scanner tool.

Overview

The Pyramid Trend Line indicator combines multiple indicators in order to detect the current direction of each timeframe so that traders do not have to search for this manually. The tool also assigns a percentage to the trend to indicate the current strength of the trend. The indicator works with all timeframes and instruments on the MetaTrader 4 platform. It does not repaint, backpaint, or recalculate and informs traders of directional changes via alerts.

Directions for use are straightforward, as a green line indicates an uptrend and a red line indicates a downtrend. If the uptrend is above 60%, traders should go for the “long” buy position, while a downtrend above 60% means that traders should go for a “short” sell position.

Service Cost

The author offers three separate pricing options:

  • Rent for $38 USD for one month
  • Rent for $58 USD for three months
  • Purchase for $120 USD

It’s possible to find indicators for around $30 on the same site, so the $38 monthly rental price is a little high when compared to other options. The indicator comes with 5 standard activations and free demo accounts are also available.

Conclusion

Pyramids Trend Line is a trading/filtering tool with two main uses; finding the current direction of each timeframe, and assigning a percentage to indicate the strength of the trend. Although 30 users have downloaded the demo version, this product remains unrated and all comments were posted by the author. Typically, we’d take a look at the author’s other products to get a better idea of his/her capabilities, but this author has only added one other product that also remains unrated.

Overall, the author’s lack of popularity, along with the higher price of this indicator are downsides, but things should function accordingly if this indicator is used with a strong strategy and risk management. Perhaps testing a demo account could be a good start.

This Forex service can be found at the following web address: https://www.mql5.com/en/market/product/46682

Categories
Forex Service Review

Order Blocks Indicator Review

Order Blocks Indicator was published on the mql5 website in May of 2019 by the finance specialist/forex, futures, and stock trader Carlos Forero. The indicator was most previously updated to version 1.4 in January of 2020.

Overview

The Order Blocks Indicator points out high-probability zones where the price is headed, allowing one to trade on the order’s direction on the MT4 platform. Traders can also trade retracement or breakout patterns, and identify resistance or support levels, which can be used as take profit zones. Bullish order blocks are indicated with green horizontal lines, bearish blocks are indicated in red, and green, red, and yellow arrows signal bullish/bearish signals. The indicator was designed to be used with trend and market maker patterns, and a few different products are highly recommended by the author.

Service Cost

There are three options available for renting this indicator:

  • One month: $49.99 USD
  • Three months: $79.99 USD
  • Six months: $119.99 USD

With no option for purchasing the product outright, costs can quickly add up with the price coming to just under $240 a year. If you plan on following the developer’s advice to use one of the additionally recommended products, then you’ll be looking at extra added costs, although a couple of these products are free. The author does offer a free demo, which should be used for testing before making a purchase choice.

Conclusion

Order Blocks Indicator is useful for trading in a given order’s direction, using retracement/breakout patterns, and identifying support/resistance levels. The product has received a 5-star rating, based on the following review:

“Good. Do not trade arrow to arrow as signals, use it along with your strategy.” -Aravind

Keep in mind that this is the only review that the indicator has received. While it is an effective product, Order Blocks Indicator is best used along with other products (trend indicators, signal tools, pattern tools), and we would recommend comparing the recommended options or using a product that is already owned with this indicator.

This Forex service can be found at the following web address: https://www.mql5.com/en/market/product/37616

Categories
Forex Service Review

Extract Candle Power Indicator Review

Extract Candle Power is a trading indicator that was created by the programmer Thushara Dissanayake, who has published 57 total products on the mql5 website. The indicator was launched in November of 2017 and most previously updated to version 1.3 almost one year later.

Overview

Extract Candle Power extracts the volume of candles in real-time and allows traders to analyze the volume of previous candles in order to identify the trend. Once the volume has been extracted, traders can use the situation to determine their current position or compare with the Moving Average to find reversal points. Here are a few facts about this indicator:

-Works with the MetaTrader 4 platform, which is the most commonly available and most recommended trading platform on the market.

-Works with all timeframes, but is more accurate with higher timeframes.

-Can be used with any currency.

Traders are also given several parameters to work with, which mostly revolve around the display and sessions section, with different color choices and the ability to disable the display of certain sections.

Service Cost

Traders can rent the indicator for $20 USD for one year, or purchase it for $10 more, which is a standard price for the type of product. The developer includes 5 activations with any purchase and has also made free demo accounts available for testing.

Conclusion

Extract Candle Power identifies market trends by extracting the volume of the candles and can ultimately help traders to identify reversal points. It has received a 5-star rating that is based on the following review:

“The new update looks very good. Waiting for it. 5 stars for the effort and listening to the comments.” -Erdinc

The comments section is more filled out, but there isn’t any real information about results located there. We did notice that the author took one user’s suggestion and added the ability to rent this indicator upon request, which is a great indication that he/she is willing to listen to feedback and work with clients. Should you decide to rent/buy this product, then we would recommend choosing a broker with a low spread and practicing risk-management to help minimize losses. Forex knowledge is another crucial factor that will either help or hinder your chances of profiting when using this indicator.

This Forex service can be found at the following web address: https://www.mql5.com/en/market/product/26360

Categories
Forex Service Review

Classic Keltner Channel Indicator Review

Classic Keltner Channel is a trading indicator that was named after the classic ten-day moving average rule described by Chester W. Keltner. This indicator was published on July 26, 2017, by an author named Muhammed Al Bermaui, who has been trading since 1996 with multiple other published indicators in his portfolio. The indicator was recently updated to version 2.2 on March 8th of 2020.

Overview

Classic Keltner Channel is very much based off of Chester Keltner’s ten-day moving average rule, which is similar to Bollinger Bands. The indicator follows a trend that identifies reversals with channel breakouts and direction, which can signal possible price breakouts, show trends, and give overbought or oversold readings. The formula outlined on the website leads to two basic lines on the chart, the buy line, and the sell line. The indicator does not recalculate its results and works for cryptocurrencies, stocks, oil, and gold on all timeframes.

You can choose from four different color lists and receive alerts through email and mobile devices with sound. Parameters are set to the default versions that follow along with the modeled system. By default, 10 candles are used in bands calculations, the buy/sell line can separate by 1.0, the moving average type used in calculations is set at Simple Moving Average, and the Typical Price used in Line Calculations is the default. It’s possible to tweak things a bit if desired, so one doesn’t have to follow these settings exactly. There is also a buffer that will allow you to build your own expert advisors.

Service Cost

This indicator can be bought for a one-time $60 USD price or rented out at $10 per month or $30 for 3 months. While the one-time deal is the best value in the long run, those that aren’t 100% sure about this indicator could rent it for 1 month to test the results without making a large investment. There is also a free demo account, which is a good sign that the developer feels traders will see good results.

Conclusion

The developer of this indicator based the formula off of a popular moving average rule and has been trading for 20+ years himself. Even though settings can be changed, you’d need to be a fan of Chester Keltner’s formula to be a good candidate for this indicator. The demo has only been downloaded 200 times, but user reviews are slim to none. If you feel that this indicator may follow profitable guidelines, then it might be a good idea to rent it for a month in order to test it more thoroughly.

This Forex service can be found at the following web address: https://www.mql5.com/en/market/product/24390

Categories
Forex Service Review

Bruce’s Price Predictor Review

Bruce’s Price Predictor is an indicator that has been released for just over a year. It was developed by Bruce Webb and published on the mql5 marketplace, with the most recent update to version 3.0 taking place in November of 2019.

Overview

This indicator was designed to show precise price reversals on a chart in order to make it easier for traders to analyze data and make informed trading decisions. According to the developer, the predictor is highly accurate and is great for scalping and swing trading. You’ll only be able to use it on the desktop version of MT4, but the indicator works with any MT4 pair and timeframe. Buy and sell arrows are shown on the chart for entry signals and confirm entries with alerts after the close of the candle or bar. The author offers some YouTube videos that help explain in more detail as well.

Service Cost

Traders only have the option to rent this particular indicator, there’s no way to buy it outright. You can either rent for one year for $100 USD, or rent it out for one month at a price of $30 USD. It’s a tough decision, considering that renting the indicator for about 3 months equals the yearly price. A free demo is available for testing and using it may help one to decide how long to rent the indicator.

Conclusion

The developer of this indicator designed it to be beginner-friendly and to make analyzing charts easier by showing exact price reversals on charts. The demo has been downloaded more than 7,000 times. This indicator has received more feedback than many others. For example:

One user commented: “Used this indicator this week and had over 90%-win rate in trades I took. Definitely must already know how to trade price action and have a strategy for yourself in place.”

Another wrote: “Just got this indicator last night and it’s awesome. I’m up over 100 pips total on day one. I think imma use this long term.”

The majority of users chose to give this indicator a 5-star review, and unfavorable comments are few and far between. All of these are good signs that this indicator is helpful, but traders need to remember that some knowledge and time needs to be invested to profit using any indicator. This isn’t a guaranteed money maker, but many users have managed to profit using the tool.

This Forex service can be found at the following web address: https://www.mql5.com/en/market/product/35531

Categories
Forex Service Review

Breakdown Flat Indicator Review

Breakdown Flat is a trading indicator that was published to the mql5 marketplace by independent author Dmitrii Suslonov in April of 2018. It was updated to version 1.1 about four months after the initial launch date in order to upgrade alert settings.

Overview

Breakdown Flat was designed to indicate the breakout (any price movement outside a defined support & resistance area) of flat (neither rising nor declining) prices in the market. The indicator draws a channel of the flat and signals breakouts based on the comparison of the Average True Range indicator and the maximum swing for ‘n’ periods. This indicator does not redraw and can be used effectively with custom trading strategies. It can be helpful on its own or in combination with other products that are also compatible with MT4.

Service Cost

Traders can either rent the indicator for $10 USD for a one-month period or $20 for a three-month period, otherwise, one can purchase the product for the standard $30 price with 5 activations. Free demo accounts are also available to be used for testing without risking any funds.

Conclusion

The Breakdown Flat System is an indicator of flat and its breakout. The system can be rented or bought for $30 and works great in combination with other indicators or on its own. Its 5-star rating is based on 3 reviews, but the demo account seems to be more popular at 500+ downloads. Here’s what some traders are saying about this product:

“This Indicator is amazing. It allows you to identify consolidation and then the “move” follows. With other Indicators, it really does a great job!” -Marko

“This indicator can increase your win rate if you know how to use it. It is a good indicator. Far more useful than many of the indicators sold in the market.” -cvdestyfx

We agree with the above trader: this indicator can certainly be helpful for those that know what they’re doing. It’s impossible to guarantee profits with any type of indicator, but using risk-management skills and an effective trading strategy can certainly help one’s chances.

This Forex service can be found at the following web address: https://www.mql5.com/en/market/product/29044

Categories
Forex Service Review

AW Trend Predictor Indicator Review

AW Trend Predictor is a trading indicator that was published to the mql5 marketplace in November of 2019 by the author Alexander Nechaev. He last updated it to version 1.20 just a few weeks after the initial launch date.

Overview

As you likely guessed, AW Trend Predictor is an indicator that follows an advanced algorithm in order to provide traders with buy signals based on predicted future trends. The algorithm determines the trend, filters out market noise, and determines entry & exit levels. Traders would then receive a buy signal when the indicator determines that the success rating is more than 70%. Signals are also recorded within the statistics module so that traders can select suitable tools that would work effectively based on signal history.

Service Cost

Traders can choose between renting the indicator for $45 for one month, or buying it outright for $85 USD. The developer includes 15 activations with the purchase. Free demo accounts are additionally provided as a more cost-effective way to test the product before deciding whether renting or buying is the better avenue.

Conclusion

AW Trend Predictor takes multiple factors into account when predicting future trends and sends buy signals when the success rating is above 70%. It hasn’t received a ton of feedback, but we did find a handful of comments from verified users.

For example:

“I’m testing – review again after a few weeks but signals over 70% are pretty solid.” -Lorant

“Very useful indicator.” -Fabrizio

You’ll find that the indicator has a 5-star rating, but this is only based on 6 reviews. Since we don’t have much feedback to work with, we’d suggest testing out the demo account before buying the full version. Price is another factor in that recommendation, as the overall cost is somewhat expensive. Still, this indicator seems to provide a simple, yet effective experience and it could help traders to profit as long as it is used wisely.

This Forex service can be found at the following web address: https://www.mql5.com/en/market/product/43299

Categories
Forex Service Review

Advanced Supply Demand Indicator Review

Advanced Supply Demand is a trading indicator that was added to the mql5 marketplace in February of 2017. It was published by Bernhard Schweigert, who has 12 products in his portfolio. The indicator was last updated to version 3.0 in February of 2020.

Overview

This indicator is highly suitable for supply and demand traders because it pinpoints the exact point of entry using underlying algorithms, but it is also suitable for other trading strategies and in combination with other indicators published by the developer. Here are some of the indicator’s highlights.

-Traders will be able to view double timeframes, including both the chart and the higher timeframe through the newest update.

-Works with all products and timeframes.

-A new update will allow traders to choose zone strength functions, which will allow them to tell when the zone is too strong.

-This indicator is compatible with MT4, but an identical version is available for MT5 from the same author.

There are different options for alerts, making it possible for traders to choose when they want to be notified, such as when the price enters the zone or etc.
The indicator graphically shows the strongest supply & demand zones plus how it performed in the past

Service Cost

The indicator can only be rented at a rate of $65 USD for 3 months or $85 for one year. It’s a little disappointing that traders cannot simply buy the indicator outright if desired, especially considering that the costs are a little high. On the bright side, there is a free demo available that could certainly help one to get a feel of the indicator and aid in the decision as to whether the pricing fits.

Conclusion

Advanced Supply Demand is best for supply and demand traders, as one might assume, but it also works well with other trading strategies. The indicator has recently been updated with a new formula and comes with a variety of features and settings while remaining compatible with all timeframes and products. It has received more than 200 comments and 8,000+ have downloaded the demo version. We’ve provided a couple of user comments below:

“This is the most powerful tool I have ever used on MT4! Highly recommend” -Profit_Trader

“Very useful tool. Helps me with the key levels and those alerts are really amazing.” -Costy Tube

Many users also mentioned that support is great and this indicator works in combination with other tools developed by the author quite well. Although it is a bit expensive, the multitude of 5-star reviews and positive comments make us more confident that this indicator does its job well.

This Forex service can be found at the following web address: https://www.mql5.com/en/market/product/20582

Categories
Forex Service Review

RenkoMaSignals FX Indicator Review

RenkoMaSignals is an indicator that was added to the mql5 marketplace by Sergey Deev. It was uploaded in June of 2016 and has remained at version 1.2 since being launched.

Overview

This indicator was designed to display Renko Bars on the chart and to generate buy/sell signals based on whether the fast-moving average is above or below the slow-moving average. Automated trading is possible based on the buy/sell signals output to the indicator buffers and the indicator can work on any timeframe since Renko-bars are not bound to any timeframe. Automatic alerts are yet another feature that helps to make trading more efficient for the user.

Service Cost

It costs $30 USD to buy the indicator outright, and this comes with 5 activations. Traders also have the option to rent the tool at a lower price of $15 per month or $20 for 3 months, which makes testing possibilities more realistic. A free demo account is also available for any user that would like to use one.

Conclusion

RenkoMaSignals is one of many trading indicators that work with Renko-bars. This particular version displays buy/sell signals to aid traders in making profitable decisions. This indicator has managed to receive some online attention, with more than 500 traders testing the demo version, although there aren’t many reviews that mention how effective it was overall. Take a look at some of these comments that were left by users who purchased the product:

“This indicator uses a phenomenal amount of RAM, way too much!” -David

“Unfortunately, it reprints – it’s good for the purpose of education but you can’t count on it to make a sell or buy decision.” -sweethomeboy2

The author did respond to the latter comment stating that it does not reprint, but we did notice another user claiming that there was a problem downloading after purchase. The overall price of this indicator isn’t bad at $30, but we’d recommend testing the demo and perhaps renting for a month before making the larger deposit, based on these reviews.

This Forex service can be found at the following web address: https://www.mql5.com/en/market/product/16836

Categories
Forex Service Review

Renko Bars 3in1 Indicator Review

Renko Bars 3in1 is an indicator that was published in the mql5 marketplace on January 17, 2018, by an author named Yuriy Shatsckiy, who has published multiple other indicators that are based on similar concepts. The current running version is 1.10. It was previously updated with a change to the formula for the construction of bars at the beginning of March of this year.

Overview

This indicator is designed for plotting Standard Renko Bars where the price is twice the size of the bar, Renko Range Bars where the price is the same, and Renko Bars with the ability to adjust the size of the bar. Renko Bars deviate from traditional charts because they are only focused on the price and don’t show timeframes, but these chart types often depict trends clearly and can make indicator-based trading simpler.

The indicator offers the ability to test indicators and experts within the tester and is compatible with the popular MetaTrader 4 platform. Parameters cover the candle size and multiplier and allow users to work with some settings for testing and other factors. The developer has included a video that guides traders through the process of installing the indicator and running tests.

Service Cost

Traders have two options cost-wise. The first option would be the buy the indicator outright for $30 USD, or to rent it for 6 months at half the price. Both prices are relatively low, so traders won’t have too much of a loss if this indicator turns out to be a dud. Still, you’ll wind up paying the overall cost after one year of renting, so buying may be a more frugal choice in the long run.

Conclusion

Although Renko Bars don’t show timeframes, some traders prefer these chart types because they can make price action and indicator-based trading easier. That being said, Renko Bars don’t exactly give you a competitive edge in the markets, but the trading strategy can be profitable if you learn to use the indicator effectively. Take a look at this user’s comment below.

“It is very profitable. I have backtested with my EA. I have found unbelievable results.” -Alessio

There aren’t many other comments that actually talk about results. This indicator was published back in 2018, but the demo has only been downloaded 175 times. There’s always going to risk involved with using indicators, so traders will need to decide if these particular risks are worth the potential rewards.

This Forex service can be found at the following web address: https://www.mql5.com/en/market/product/27133

Categories
Forex Service Review

PipFinite Breakout Edge Indicator Review

PipFinite Breakout EDGE is an indicator that was published in the mql5 marketplace on January 9th of 2019. The author Karlo Wilson Vendiola runs the PipFinite website and has published 12 products on the website thus far. The indicator was recently updated to version 3.0 to make some compatibility improvements.

Overview

This indicator was designed to operate on MT4 and claims to follow a step-by-step system that identifies the most powerful breakouts. The strategy is supposedly tested and proven to discover market patterns that can yield impressive rewards for traders. The creator outlines three easy steps for placing a trade:

  • Enter a signal (the success rate must be equal to or more than 66%)
  • Set stop loss
  • Set take profit

The indicator then auto-detects entry, exit, stop loss, and take profit levels and auto-calculates statistics for each signal. It doesn’t repaint or recalculate. It works with all timeframes and symbols and is designed to be compatible with all Expert Advisors. The automatic calculations for statistics results are one of the highlights, as it provides more reliable data that gives out a success rate for the trade, thus giving traders the confidence they may need to follow through. The indicator also comes with a user manual and the developer has included step-by-step instructions and a YouTube tutorial video to help explain the setup process.

Service Cost

There are three separate pricing options for acquiring the indicator. Users can buy it outright for $98 USD, or rent it at a rate of $58 USD for 1 month or $88 USD for 1 year. The yearly cost of renting the indicator is only $10 less than buying, so we would recommend simply buying it if you think you’ll be using it for that long. The monthly price is rather high, but this indicator has received enough positive feedback to make it worth investing in. Note that there is a 5-time limit on the number of activations once the indicator is owned and exceeding that number would require traders to buy the software again.

Conclusion

PipFinite Breakout Edge has been on the receiving end of multiple 5-star reviews from users that have managed to turn a profit using it. Here are some examples of what consumers are saying:

“Very good indicator! Brought in profits” -disheng91

“I bought the indicator nearly one month ago. Great results, no lag, no repaint. Good job!” -yarixsegona

“This indicator is almost scarily good…I had my doubts and I wondered if this was another fake indicator with paid reviews…I was not paid for this review and I am telling you this indicator is the business! If you are skeptical like I was, just invest the monthly fee and give it a chance for one month and you will not regret it!” -mslightbourne

In fact, almost every user that commented on the thread wrote that they had good results, but some did mention that they used this indicator in combination with others. If you have a good trading strategy, then this indicator could help increase your profits greatly.

This Forex service can be found at the following web address: https://www.mql5.com/en/market/product/33638

Categories
Forex Service Review

Lot Size Calculator and TPSL Review

Lot Size Calculator and TPSL is an indicator that was created the equities and forex trader Han Hui Tan. It was launched in June of 2015 and most previous updated to version 1.3 the following month.

Overview

This indicator calculates order lot size, take profit price, and the stop-loss price. It has a couple of intended uses:

-Determines lot size that should be used when traders enter the money and pips they want to win.

-Automatically calculates the take profit and stop loss price when traders enter the open price plus however many pips they would like to add or subtract.

-The calculator was designed to be used on the MetaTrader 4 platform, which is the most common platform available. It can be used with multiple currency pairs but is most effective with USD based pairs.

-Traders can also choose from blue, white, green, or black color schemes.

Service Cost

The calculator can be purchased for just $10 USD. Being that it is a fairly simple indicator, we feel that this price is quite suitable. The author also offers free demo accounts for testing.

Conclusion

Lot Size Calculator and TPSL is a simple, yet effective calculator that determines lot size and take profit/stop-loss levels needed to earn a specified profit. It hasn’t received any ratings or comments, but this isn’t too worrisome, as the calculator should work effectively so long as one enters the correct details into each parameter.

This Forex service can be found at the following web address: https://www.mql5.com/en/market/product/10258

Categories
Forex Service Review

Exclusive Bollinger Professional Indicator Review

Exclusive Bollinger is a trading indicator that was created by the multi-product author Evgeny Belyaev. The original version (3.0) was launched on the mql5 marketplace in July of 2017.

Overview

Exclusive Bollinger is based on the classic Bollinger Bands indicator, with some improvements. The method focuses on price and volatility, in order to identify entry and exit points, with one primary use being to identify overbought and oversold conditions. This method isn’t perfect, as it focuses on some information while ignoring other important factors that need to be considered for the trades. The developer of this indicator has made improvements to the signals so that false signals are minimized, and added in more flexible settings that make it possible to use the product with different trading strategies, especially scalping. Here are a few other key facts:

  • Compatible with world’s favorite trading platform, MetaTrader 4
  • EURGBP, GBPJPY, AUDNZD, EURCHF, and EURUSD
  • Works on any financial instruments (Forex, CFD, binary options)
  • Works on all timeframes
  • Does not repaint
  • Alarm notifications

Service Cost

A few separate pricing options are available:

  • Rent for one month for $14 USD
  • Rent for three months for $25 USD
  • Purchase for $31.95 USD

Free demo accounts are also available.

Conclusion

Exclusive Bollinger makes some improvements to the classic Bollinger Bands trading strategy by minimizing false signals and adding in extra settings so that the indicator works with more trading strategies. Although this method isn’t the most reliable, other users have found great results using this product, with 5/5 users providing a 5-star rating. We found the following comments to be informative:

“It gives excellent signals; I will say at least 75% on the accurate side. I use it with Advance Stochastics to confirm. It’s excellent to pick top and bottoms! recommended!” -Rafael

“The most reliable scalping indicator I’ve come across.” -mxp1

According to these users, the product works as intended, but you may want to use an additional indicator, as recommended by the first reviewer. Exclusive Bollinger works best to identify overbought/oversold conditions, and scalping strategies work best with this indicator, although others will work as well. This indicator seems to be a good choice if it works with your trading style & strategy.

This Forex service can be found at the following web address: https://www.mql5.com/en/market/product/24336

Categories
Forex Service Review

EuroSmart Pro Trend Indicator Review

EuroSmart Pro is a trading indicator that is available on the mql5 website. As one of the most recently added products on the site, it was launched in January of 2020 and received its most previous update to version 1.22 in March of 2020. The indicator was created by professional trader Uci Sanusi.

Overview

EuroSmart Pro is a smart trend-detecting indicator with a filter that aims to eliminate false signals for more accurate results. This indicator is suitable for scalping, intraday trading, and swing trading strategies. Here are a few more key facts:

  • Works on the widely used MetaTrader 4 platform
  • Recommended pairs EURUSD and EURJPY
  • Recommended timeframes M15, M30, H1, and H4
  • Open buy, open sell, exit buy, exit sell indicated by different colors
  • London market and US market trading sessions

Service Cost

The developer only allows traders to rent this indicator for $10 per month – it cannot be rented for a longer time or purchased at all. While this keeps the price low initially, traders will end up paying more than they would for a typical indicator by month 4 or 5. Perks include 20 total activations and free demo accounts.

Conclusion

EuroSmart Pro is best used for detecting trends with minimalized false signals with scalping, intraday trading, and swing trading strategies. Unfortunately, there are no ratings or reviews that tell us about other’s experiences using this product. It’s disappointing, as we were curious about how effectively the indicator performed at reducing false signals. When considering EuroSmart Pro, you’ll also want to remember that it doesn’t work with all strategies and that it is only recommended for use with a couple of pairs and certain timeframes. Another considerable fact is that is it cheap to get started, but the indicator cannot be purchased outright and will run traders $120 per year.

This Forex service can be found at the following web address: https://www.mql5.com/en/market/product/45370

Categories
Forex Service Review

Pivot Points Pro Indicator Review

Pivot Points Pro is a trading indicator that was published on the mql5 marketplace in October of 2018. The author, Tsvetan Tsvetanov has never updated it from its original version.

Overview

This indicator is primarily based on the Pivot Points concept, which is centered around calculations that determine the overall trend of the market over different timeframes. This can help to give traders an idea of whether conditions are bullish or bearish and whether the price might experience support or resistance. In order to make this indicator more effective, the developer uses an improved formula that is based on volatility when calculating support & resistance levels, along with a multi-symbol scanner that can be used to detect the best conditions and to monitor a large number of symbols at once, and a built-in alert system that will allow traders to go about their daily lives without spending as much time staring at a computer screen. This indicator also allows traders to customize settings more accurately and to disable certain features that they may not like.

Service Cost

This indicator can be rented for $19 USD per month, or purchased with 6 activations for $49. Trading on the free demo account isn’t an effective way to test the indicator, as the author explains that the tester only works with one symbol at a time, making it impossible to switch between symbols or timeframes. However, she does provide a link to a limited free version of the product, which is limited to 5 symbols. The free version was created approximately one month after this product’s release, so it seems that the author released the limited version as an alternative to trading from the demo, rather than fixing the issues with the demo version.

Conclusion

This indicator uses tried and tested calculations to provide visual symbols that show traders when prices are reaching their daily highs and lows, making it a useful tool for predicting market trends and conditions. It hasn’t gained a lot of popularity. In fact, there isn’t a single review or comment, which is odd for a product that has been released for more than a year. When an indicator is good, it seems that traders flock to it, but good indicators can sometimes get lost within the sea of products that are available on the mql5 website.

If the lack of feedback makes you apprehensive, then it might be best to test the free limited version before renting or buying this indicator. If you do buy it, then we would recommend leaving the first comment so that others can read about your experience!

This Forex service can be found at the following web address: https://www.mql5.com/en/market/product/32731

Categories
Forex Service Review

Momentum-Solo Indicator Review

Momentum Solo is a trading indicator that was published on the mql5 marketplace in June of 2015 by the author Claus Dietrich. It was last updated to version 19.51 in May of 2019.

Overview

Momentum Solo informs traders about momentum strength in the appropriate direction based on a minimum candle size and candle body in relation to the average true range, which measures market volatility. Described as a “simple momentum informer” by the author, the indicator comes with 5 different filters and allows users to set up different types of alerts.

Here are a few more facts:

  • Works on the popular MetaTrader 4 platform
  • Works with all instruments on timeframes M5 to D1
  • Does not repaint, no cross-over signal, signal after close

The author also provides instructions for how to use the indicator, along with some helpful pointers about calculating risk-management, avoiding the market before high-impact news, and other tips.

https://youtu.be/a2VE6Q4kJQk

Service Cost

The indicator can be rented for $19 USD (one month) or purchased for $89 USD. To be fair, the purchase price is a little high for a simple indicator, and many others can be purchased for as little as $30. More than 1,000 traders have downloaded the demo version of this product, which would be a good idea before buying.

Conclusion

Momentum Solo informs traders of momentum strength and can be used with multiple timeframes and any instrument. It has received four 5-star ratings and a few positive reviews.

For example:

“Claus was very courteous, responsive, and professional after I informed him the alert function was not working properly.” -vtcpa04

“Great product and great seller, really helpful indicator.” -Pip Collecter

It’s a little worrisome to see that there was a technical problem with the alerts, but this has since been fixed in version 16.3 back in 2017. The product is a little pricey, but traders can still rent it at a lower rate. Like any other indicator, risk-management needs to be practiced, and we would recommend following the author’s advice to avoid trading before certain news hits the market and etc. for the best results.

This Forex service can be found at the following web address: https://www.mql5.com/en/market/product/9564

Categories
Forex Service Review

Engulfing Bar Alert Indicator Review

Engulfing Bar Alert is an indicator that was published to the mql5 marketplace in October of 2018 by the author Snapdragon Systems. The current version is 1.1 and it has not received any updates since launch.

Overview

This indicator is used to mark and alert traders when Engulfing Bars form. The bars have a higher high and a lower low than previous bars. Engulfing Bars can be bullish or bearish and are used to catch potential reversals in the market, therefore having these alerts could make it easier to spot these trends without having to watch your computer screen all day. This indicator is compatible with MT4 and allows traders to choose from range engulfing, body engulfing, or both. Traders can also manage alert symbols and choose which symbol to plot to highlight an outside bar.

Service Cost

Traders will have the choice between buying this indicator for $30 USD or renting it at a rate of $10 per month. Traders can also test a demo version in order to get a better idea of whether this indicator is a good match for their trading style.

Conclusion

Engulfing Bar Alert is a good choice for traders who look for trends surrounding engulfing bars, which can catch possible reversals in the market. The indicator can be rented for as little as $10 per month and makes the trader’s job easier by eliminating the need to watch charts all day long. On the downside, the demo has been downloaded less than 100 times and it hasn’t received any comments or reviews from users. If this indicator fits with your strategy, you may want to try the demo first, or simply invest $10 into the one-month application.

This Forex service can be found at the following web address: https://www.mql5.com/en/market/product/31873

Categories
Forex Service Review

Chart Clipper Indicator Review

Chart Clipper is an indicator that was published to the mql5 marketplace by the ISO Financial Services developer Payam Khataei in March of 2014. The indicator was last updated to version 4.32 in 2019.

Overview

This indicator is a simple organizational tool that allows traders to effectively analyze multiple charts at once. While using Chart Clipper, traders can categorize open charts, access a large number of those charts, or quickly auto-switch between them. The indicator is compatible with MT4 and runs alongside EAs and alerting indicators on PC and tablets with no issues. There is an unlimited number of chart groups and traders can categorize the charts by symbol names, timeframes, or any combination based on their personal preferences.

Service Cost

The cost of this indicator is $32 USD and it comes with a few extra activations (8 in total), but there isn’t an option for renting. The price is fairly standard and users are given the opportunity to test this indicator using a free demo account before buying.

Conclusion

Chart Clipper is a helpful tool that allows traders to organize their charts and to efficiently switch between them. Users are generally very accepting of this indicator, which has acquired a four-star rating. Take a look at what these users are saying:

“You set up your charts the way you like it for a certain group, edit the bottom label and voila they are grouped together depending on the label you gave each chart!! You can then switch between these views immediately without setting anything else up as the indicator inserts the shortcuts automatically according to the name you labeled your groups. It is really that simple, amazing programming.” -SpeedBug

“On the laptop, it is absolutely essential. There is no other way to trade charts when you really need to look at each chart periodically. It is also easier to focus on the charts when you don’t try to look at 12 all at the same time.” -Michael

While we’re confident that this EA does its job well, the bottom line is whether this simple indicator is worth its $32 price. Sure, it’s helpful, but other indicators tend to show us trends and guide users in making effective trading decisions. If cluttered charts are driving you crazy, then the price could definitely be worth the investment.

This Forex service can be found at the following web address: https://www.mql5.com/en/market/product/3768

Categories
Forex Service Review

Atron TT Channel Indicator Review

Atron TT is a trading indicator that was added to the mql5 marketplace in March of 2020 by the author Vitali Zyrko. It has not received any updates at this time.

Overview

Atron TT is a signal trading indicator with two purposes, the first of which being to display a trend channel, and the second as being one of the input signal sources. Here are a few of the indicator’s features:

Works on the MetaTrader 4 platform, which is one of the most popular trading terminals on the planet

  • Compatible with any currency pair and timeframe
  • Does not redraw
  • Is not entirely reliable on its own, should be used with input filters on other indicators

Traders will also be able to manage alert and basic display settings. The indicator was designed to occupy minimal space on the chart and to be an easy to use tool for beginners.

Service Cost

The developer offers three separate pricing options:

  • Rent at a rate of $12.99 USD per month
  • Rent for $29.99 USD for one year
  • Purchase for $38.99 USD

Traders will be limited to 6 total activations for the product. Note that the developer points out that it is absolutely necessary to use this product with one or more indicators, so you’ll want to factor those potential costs as well. If you’re interested in testing, you can access a risk-free demo account as well.

Conclusion

Atron TT is a versatile product that works with any timeframe/currency pair to display trend channels or work as an input signal source. It has received a 5-star rating, which is based on the following review:

“Been using for little but now pretty good. I use this in conjunction with other indicators. Working good.” -4xtrader41

The above statement simply clarifies the recommendation that this indicator is used with others, as it isn’t ideal when used on its own. Before purchasing, be sure that you can find an indicator(s) that can help provide better results.

This Forex service can be found at the following web address: https://www.mql5.com/en/market/product/47010

Categories
Forex Service Review

Bermaui Deviation Percent (BD%) Indicator Review

Bermaui Deviation Percent is an indicator that was published on the mql5 marketplace in July of 2017 by the author Muhammad Elbermawi, who has amassed 19 total products in his portfolio. The indicator was last updated to version 6.0 in December of 2019.

Overview

The indicator was designed to measure volatility in a percentage (rather than points) in order to make it possible to compare volatility for the same security in different timeframes. It can also compare securities from different markets in terms of percentages. The concept is to create an index based on Classic Standard Deviation that moves between 0 and 100 percent. Traders can then use the given percentage to determine if prices may move in a ranging area, as well as the beginning of ascending or descending trends. The developer throws a free Bermaui Average EA in with the indicator and all programs are compatible with the most popular trading platform MetaTrader 4.

Service Cost

The author includes three separate pricing plans; traders can rent the product at a rate of $10 USD per month or $30 for 3 months, or buy the indicator for $60 with 1,000 activations. Prices are low enough for the first month that testing is possible without making a large investment and the sheer number of activations included with purchase guarantees that traders will have access to the indicator for a lifetime. The author also offers a free demo version, which has been downloaded nearly 2,000 times so far.

Conclusion

Bermaui Deviation Percent (or BD%) is an indicator that was created to eliminate the guesswork when it comes to identifying trends. The indicator has received a 5-star rating from users, along with 100+ combined reviews and comments.

This is what some traders are saying:

“Works really great! Now I can find the trade which is really trending!” -acidtrader81

“Very nice and effective indicator for identity range and trend market” -Hefajatur

“A really good indicator! Simplifies entry on trends and avoids choppy sideways movement.” -Han

The majority of reviews mentioned how effective this indicator is. Some traders use it in combination with others, especially with the free EA that is included with the purchase. The developer is very involved with traders and has managed to create an effective product for a low cost.

This Forex service can be found at the following web address: https://www.mql5.com/en/market/product/24174

Categories
Forex Service Review

iPump Universal Indicator Review

Indicator iPump is a trading indicator that was published to the mql5 marketplace in July of 2019 by the multi-product author Sergei Lanin. It was last updated to version 3.10 three months after being released.

Overview

This indicator works to find the trend using an algorithm that the author has found resourceful enough to use in more than one product. It combines certain advantages that we would see in a variety of indicators, including a multi-step trend detection indicator, a levels indicator that determines support & resistance levels, an oscillator indicator that defines overbought & oversold zones, and a market screener. You’d typically find these features in separate indicators, so the fact that they are combined here makes this option both convenient and money-saving.

The indicator doesn’t repaint, is accurate, and processes incoming price data by the second. Determination of resistance and support levels is another highlight, as the indicator will identify verified levels, turning levels, and weak or untested levels. It also works on the most popular trading platform, MetaTrader 4.

Service Cost

This indicator is for sale for $40 USD. The author has combined the benefits of multiple different types of indicators into this product, so this could be a cheaper route than purchasing three or four separate products. It would be helpful if the author would allow traders to rent at a lower price, but the demo version does make testing possible.

Conclusion

Indicator iPump essentially combines four separate types of indicators into one product for a portion of the price. Using a unique algorithm, it scans the market and provides traders with a better sense of which trades to place based on the trend, support & resistance, and other factors. Overall, this indicator has received a 4 ½ star rating from the community, along with some supportive comments.

For example:

“A good comprehensive pack which helps me a lot. Recommended.” -dor2020

“It’s a useful indicator where you can see the trend, resistance, and support and also if the pairs are oversold or overbought. Great!” -Marcello

“Great indicator – using with support and resistance trading and an EA. Good support, and addresses questions/comments quickly” -mcd55

Although the product can’t be rented, the general idea behind it and the fact that others have found it to be an effective tool seems to make it worthy of its $40 price. Of course, you’ll always want to use these types of tools wisely and possibly in combination with a good EA and a reputable broker that doesn’t charge a high spread.

This Forex service can be found at the following web address: https://www.mql5.com/en/market/product/39895