The AFX Stochastic Trendline is an indicator that draws on your screen all trends automatically and is fully customizable. The main features of this AFX Stochastic Trendline indicator are listed in this FX review.
Overview
AFX Stochastic Trendline Indicator draws the following on the stochastic indicator:
- Moving average
- Bollinger Bands
- Trendlines
- Canales
- Channels of Linear Regression
This is an indicator for MT4 that detects the most straight trend lines and automatically plots them in the graph. If you often rely on trend lines for your daily trading, this indicator will make it much easier to work with them and ease the need to detect and draw lines each time manually. The indicator shows only the most real trend lines. This means that the line will be removed from the chart if its interaction with the price is no longer expected.
The indicator does not redraw, but can change the angle of the lines when new ends occur. This is a suitable indicator for intraday and swing currency trading. The optimal time frames to work with this indicator are M15-H1.
Trend lines (TL) are a primary analysis tool, so it is compatible with any indicator and trading system. If you are a novice trader, this indicator will help you understand what a trend line is. Also, as you observe the work of the current indicator, you will learn how to draw trend lines on your own. For experienced operators, the indicator will suggest trend line options and also save a lot of time setting them.
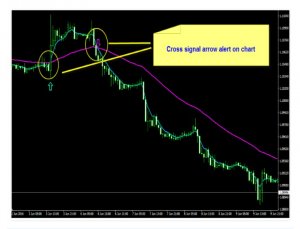
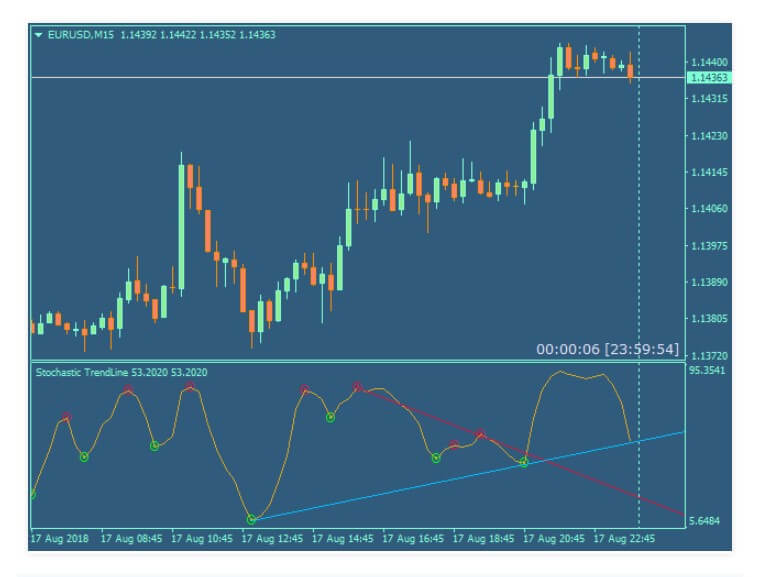
Initially, the indicator tries to locate all possible trend lines in the graph. Then, using specific filters, it will exclude more than half of the lines found. Then the indicator checks the quality of the remaining and shows the two best trend lines in the chart. Therefore, there can only be two lines in the chart at the same time:
- Ascending line (blue)
- Descending line (orange)
How to Trade with the Trend Indicator?
Most trade techniques with trend lines can be classified into two main groups:
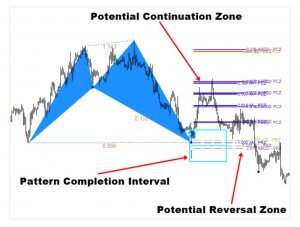
- Price rebound (reversal) from trend line
- Break of trend line.
Price Rebound
It has always been commented that trade with trend is the most successful. This is explained by the fact that asset prices tend to continue the trend, while a reversal is less likely. Based on the above logic, it is more favorable to open a trade next time, once the price touches the trend line. When this happens, in addition to a potentially profitable trade, you will also get the optimal risk ratio. Thus, the strategy of “TL’s price rebound” implies:
- Buy when the price has approached or has touched the rising line.
- Sell if the price has approached or touched the low line.
- Breaking the Trend Line
Finally, all trend lines will be broken. However, traders do not miss the opportunity to make a profit, even in this case. That’s why there’s a strategy of how to negotiate when the trend line breaks down.
Conditions for entering the market:
-If the downline has broken, and the price has been set above it, you must make a purchase when the price also touches the line again from the other side.
-If the ascending line has been broken, and the price has been set below it, you must make a sale if the price also touches the line again from the other side.
Conclusion
We are talking about a basic indicator, created in 2015, but quite complete, and that has a good number of users who, in general, are satisfied with it. It is recommended for all types of traders, you can find it in the MQL market for a price of 40 USD, although you also have a free trial version.
This Forex service can be found at the following web address: https://www.mql5.com/en/market/product/12089