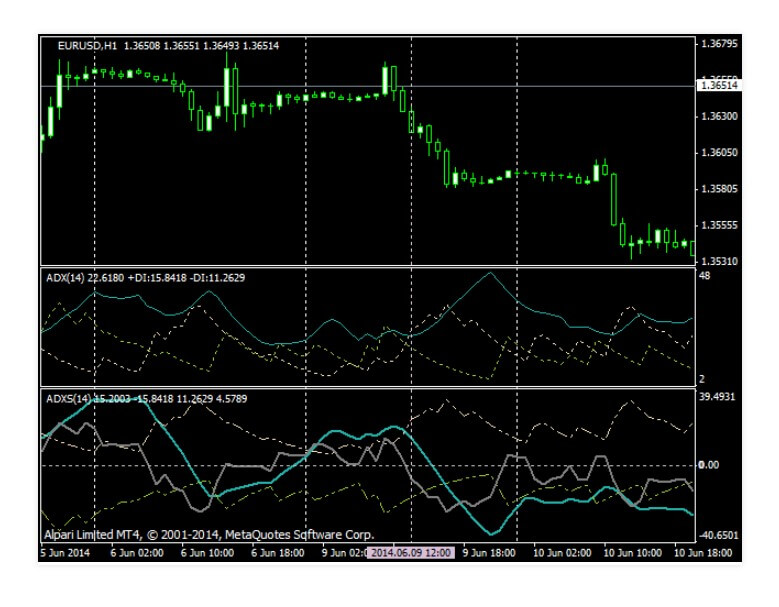
Average Directional Movement Index, or ADX indicator, was developed in 1978. J. Welles Wilder created this indicator, which is a trend based on the moving average. In the ADX indicator, we will display 3 lines: the ADX line, the plusDI (+DI) and the minusDI (-DI). This indicator is included in Metatrader 4 and 5.

Overview
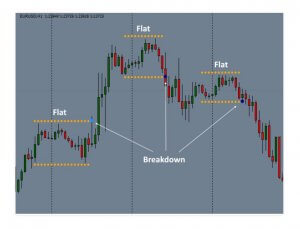
One of the keys in trading is to know if the market is developing a definite trend, bullish or bearish, or on the contrary, if the market is evolving laterally, without a clear impulse. An operator who knows how to interpret market behavior will be better able to adapt its trading strategy or, which is the same, to be able to issue the most appropriate market orders at any given time.
As is known, operating in the direction of a sharply defined trend could reduce the risk of trading and increase the potential profit.
The technical analysis has specific tools to be able to identify the market situation at any time and to be able to determine the strength of a trend.
One of the most used tools for this purpose is the ADX indicator. In fact, ADX is the indicator that is often used to confirm the formation of a market trend ultimately.
The ADX is a technical indicator within the so-called oscillators. Being an oscillator its value moves within a defined range, between 0 and 100. The most important feature to be known about the ADX is that, unlike other indicators, such as stochastic, the ADX does not identify whether a trend is bullish or bearish. What the ADX determines is the strength of a trend. Therefore, a strong upward or strongly bearish trend will present the same values in this indicator. For this reason, the ADX is the indicator used to determine whether a market is in a lateral situation, oscillating over a given range or, conversely, whether that market is starting a new trend.
The ADX c alculation is based on a moving average of the expansion of an asset’s price range over a given period of time. It is usually used as a calculation period of 14 days. The ADX can be used on any product that is traded on a financial market as shares or currency pairs. The ADX is represented as a line whose values range from 0 to 100. The higher the ADX value, the stronger the price trend. Similarly, low values indicate weak trends or even no trend. The following table represents the commonly used reference values when utilizing this indicator:
Value of the ADX Strength of the trend:
- 0-25 Absence of trend
- 25-50 The strong trend
- 50-75 Very strong trend
- 75-100 Extremely strong trend
The ADX is a key indicator for adapting trading strategies at any given time. An ADX below 25 is indicative that the price of an asset is moving without a definite trend. If the ADX is kept for a time below this value, the price of the asset will likely end up oscillating within a given range, with a defined pattern. In this case, an operator can take advantage of this movement by applying range trading strategies. When the ADX is above 25, the operator will change its previous range strategy and apply the trend based trading strategy.
Conclusion
The ADX EA is a straightforward robot, ideal for a beginner trader who wants to start using an easy to understand the automated system. In addition, there is a free basic version to test the robot with the most straightforward functions. If the robot is satisfactory to the user, there is an advanced version and a Pro version at affordable prices of 29.99 and 39.99 Swiss francs, respectively.
This Forex service can be found at the following web address: https://quivofx.com/expert-advisor/adx-ea