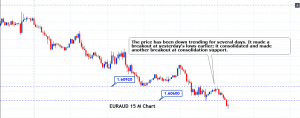
Introduction
Relative strength index and the stochastic oscillator both are momentum oscillator which is used to forecast the upcoming price movements. Both of these indicators have different objectives, theories, and methods to trade. RSI and Stochastic are the celebrity indicators in the industry which widely used by the all type of traders in stock and Forex market.

RELATIVE STRENGTH INDEX.{ RSI }
Developed by the J Welles Wilder, the Relative Strength Index is a momentum indicator that measures the speed and the change of the price movements of the underlying trend. Wilder featured this indicator in his book “New Concepts in Technical Trading Systems”. In his book, he also featured the Parabolic SAR, ATR and ADX indicator. RSI is a prevalent momentum indicator that featured in the number of books, articles and magazines over the years. Andrew Cardwell introduced the positive and negative reversals for the RSI indicator, and Constance Brown featured the concept of Bull and Bear market range for RSI in his book Technical Analysis for the Trading Professionals. RSI is an oscillator, and it consists of a single line which oscillates between the 0 to 100 levels. Wilder explains when the indicator goes near the 70 level, it indicates the overbought conditions and expects downside reversal. If the price holds at the 70 level for a more extended period, then it means the uptrend is super strong.
Conversely, when the indicator goes below the 30 level, it indicates the oversold market conditions and soon expects the buy side reversal and if the price action holds near the oversold level than simply means the sellers are desperate to move the price action down. RSI divergence is also a quite popular way to understand the upcoming market trend. Divergence is when the RSI indicator moves to one direction and price action move other direction, divergence shows the market is overextended and expect the reversal.
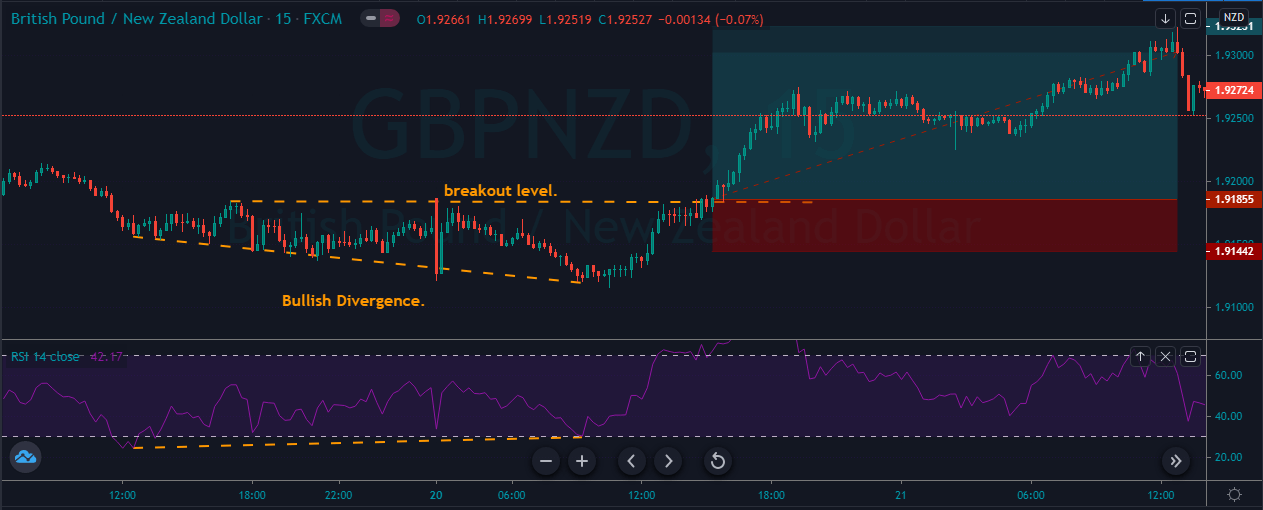
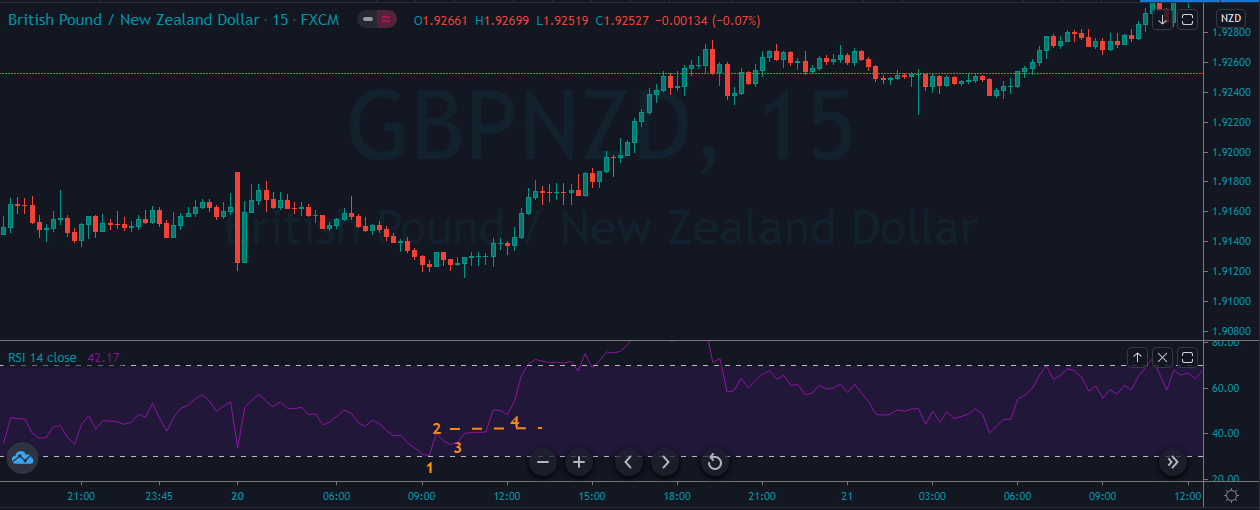
BULLISH DIVERGENCE.
A bullish divergence occurs when the price action prints the brand new lower low but indicator prints the higher low that matches correspondingly lower low in the price. This indicates the rising bullish momentum and any long trade from the break of the significant resistance area will be a good idea.
The image below represents the bullish divergence in the GBPNZD forex pair.
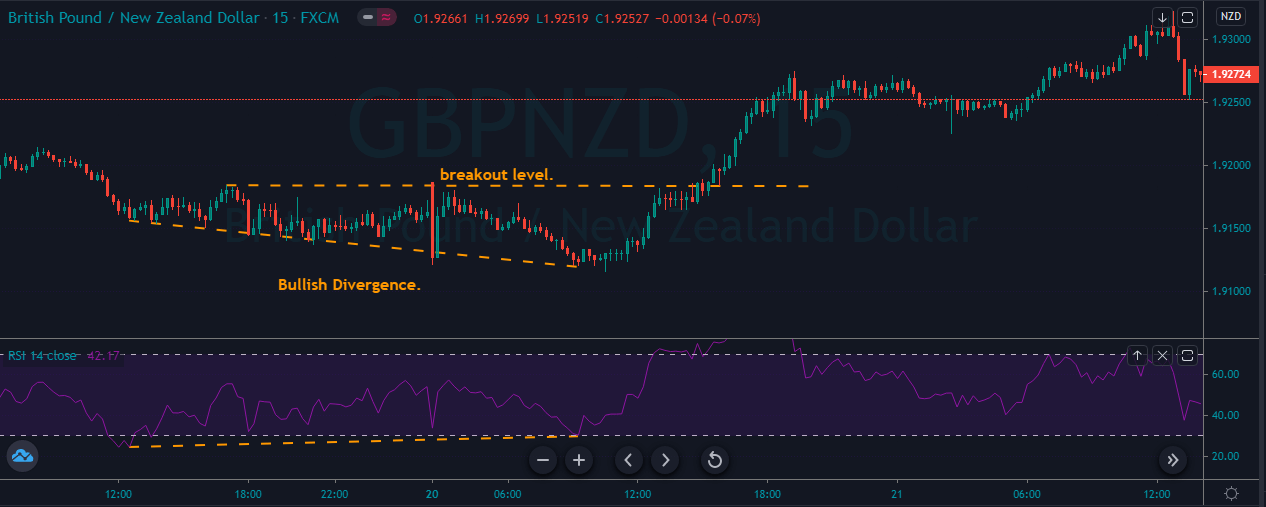
In the image below, the price action was printing the lower low, but the indicator failed to do so; instead, it starts moving to the upward direction which means the indicator didn’t like he selling anymore and now its buyers turn to lead the market. When the price action breaks the most recent resistance area, we choose to go long in this one.
BEARISH DIVERGENCE.
A bearish divergence occurs when the price action prints the brand new higher high but indicator prints the higher low that matches the correspondingly higher high in the price. This indicates the risking bearish momentum and any short trade from the break for the significant support area will be a good idea.
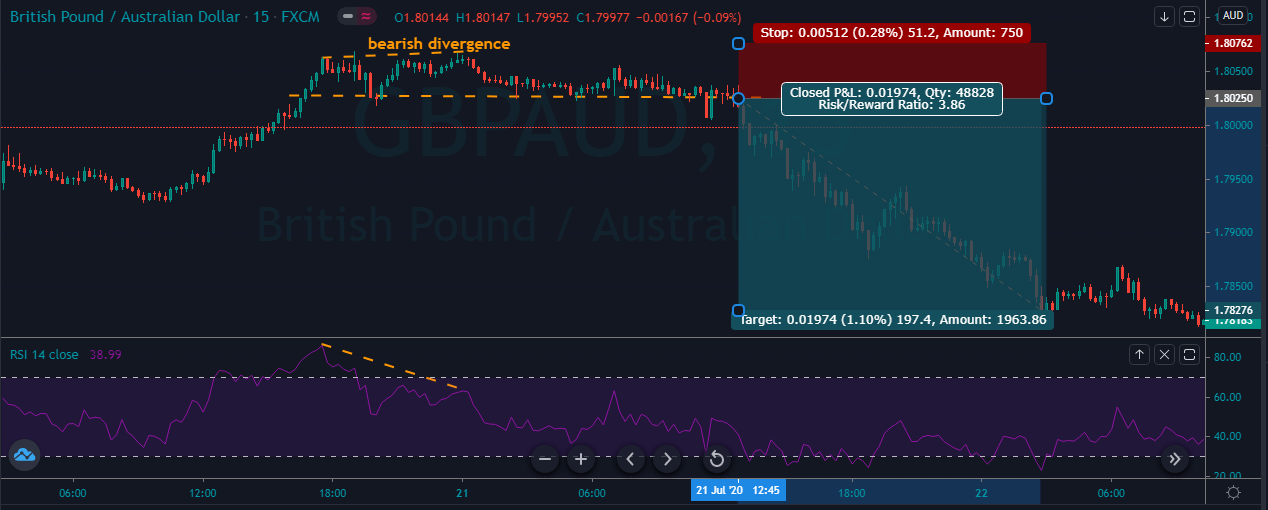
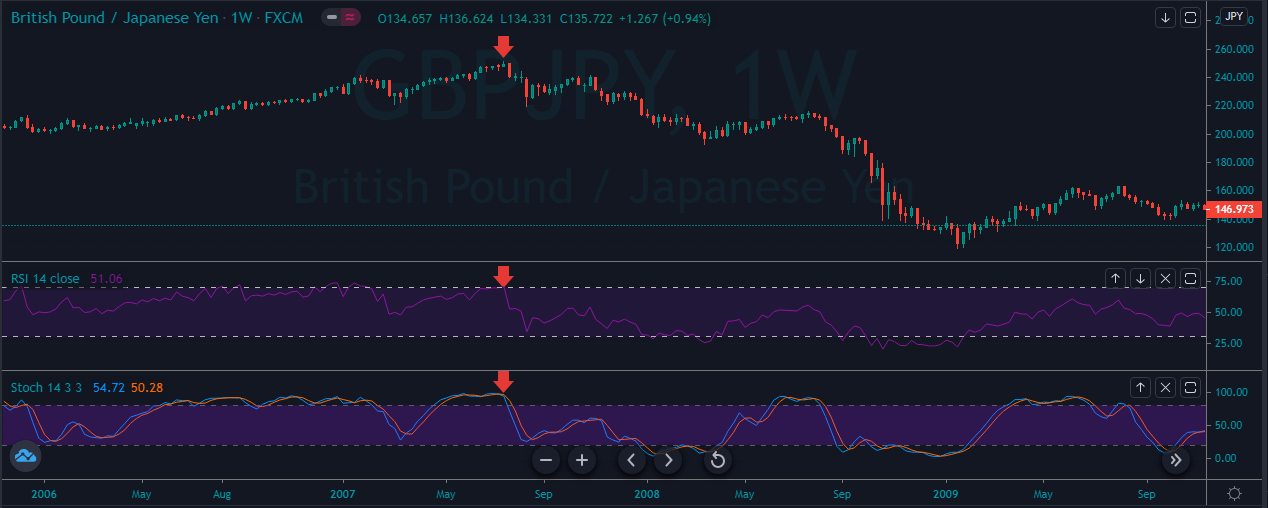
The image below represents the bearish divergence in the GBPAUD forex pair.
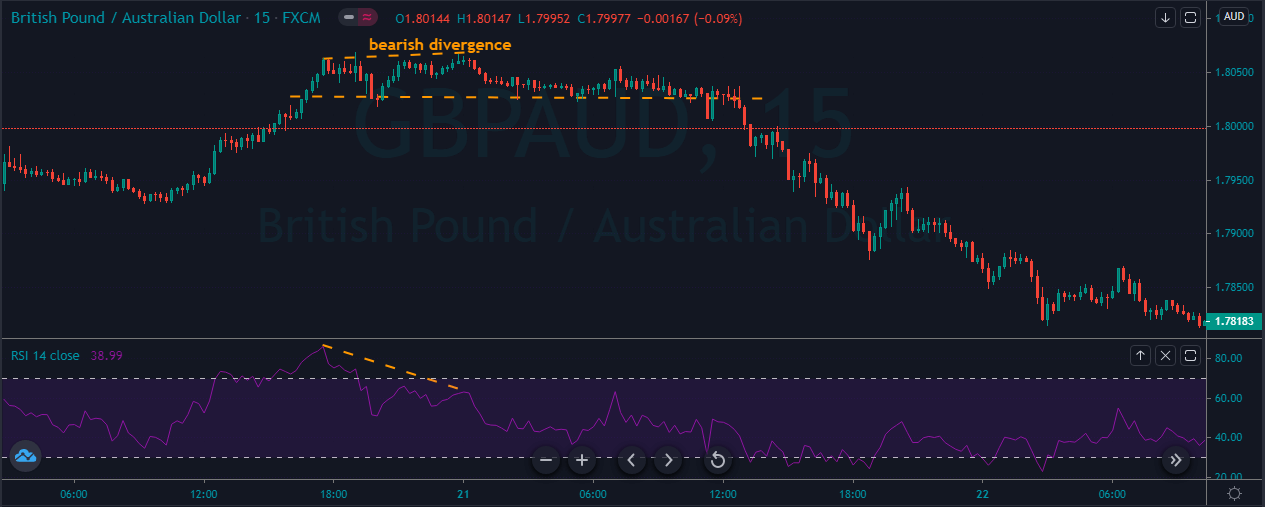
As you can see in the image below the prices was in an overall uptrend, and when the price action prints the bearish divergence, it means the market hit the top level, and now all we need to do is to prepare for reversals. As the price action breaks below the support area, we took sell entry for the brand new lower low.
RSI SWING REJECTIONS.
Another new RSI trading strategy which is not a quite popular but very effective way to trade the market. This strategy is known as swing rejection, and it has four parts:
BUY TRADE.
- Make sure RSI is in overbought territory.
- RSI reverse below the 70 level.
- RSI forms another high without crossing back into the overbought territory.
- RSI breaks its most recent low.
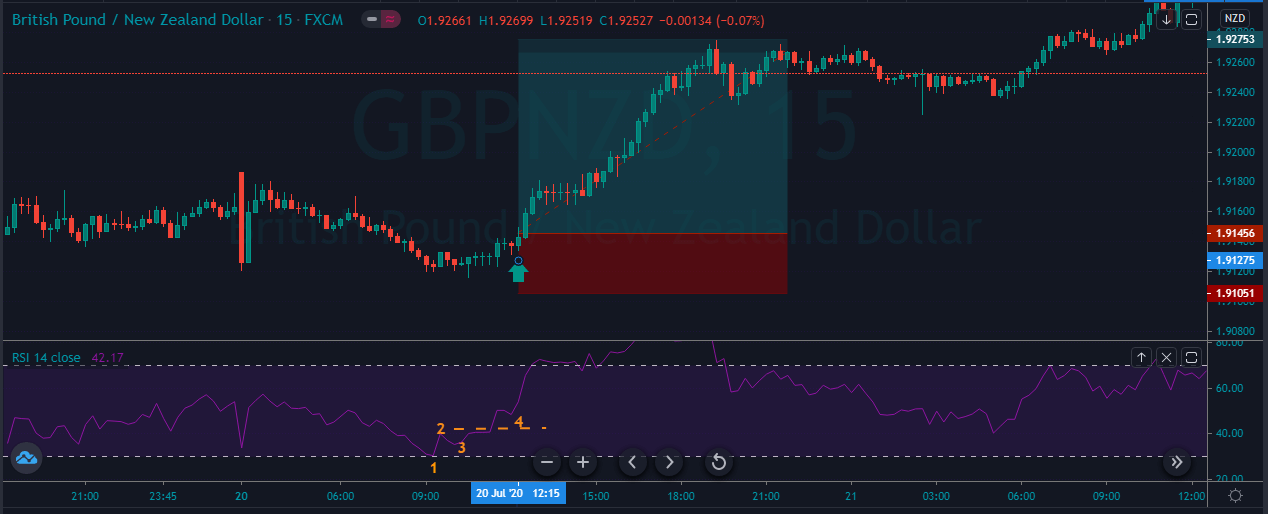
The image below represents the selling trade in the GBPNZD forex pair.
As you can see the image below represents our entry, exit and stop loss in this forex pair. So overall the pair was in a downtrend and during the pullback phase when the indicator reached the overbought area it’s a sign to go short, but we wait for the further signals and when the price action confirms all the four points we choose to go short. After the selling trade price action took a little bit of time to drop, and it printed the brand new lower low.
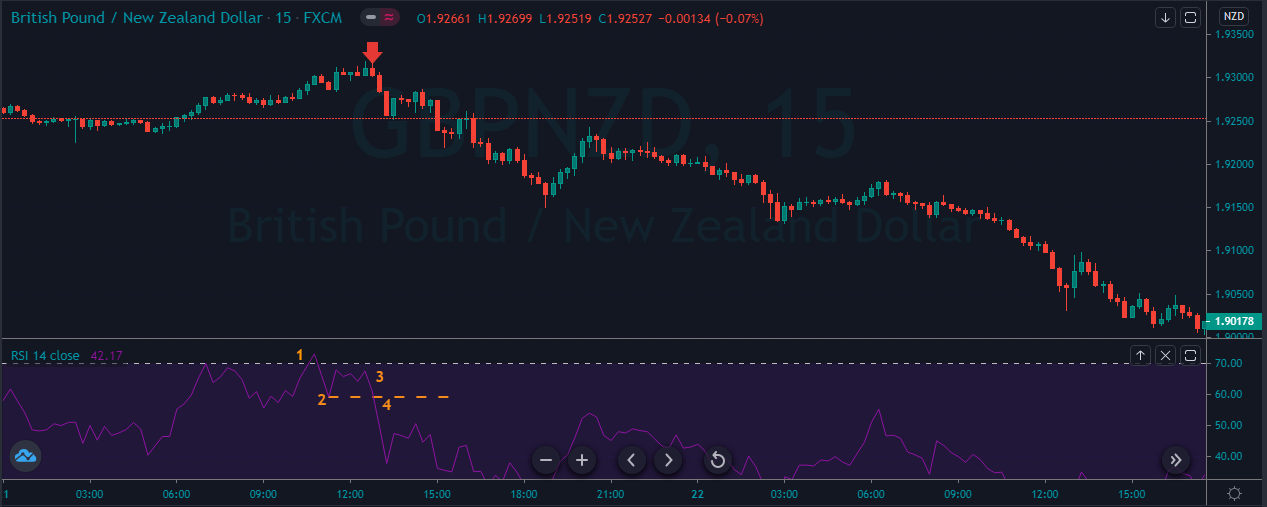
SELL TRADE.
- Make sure RSI is in oversold territory.
- RSI reverse below the 30 level.
- RSI forms another low without crossing back into the oversold territory.
- RSI breaks its most recent high.
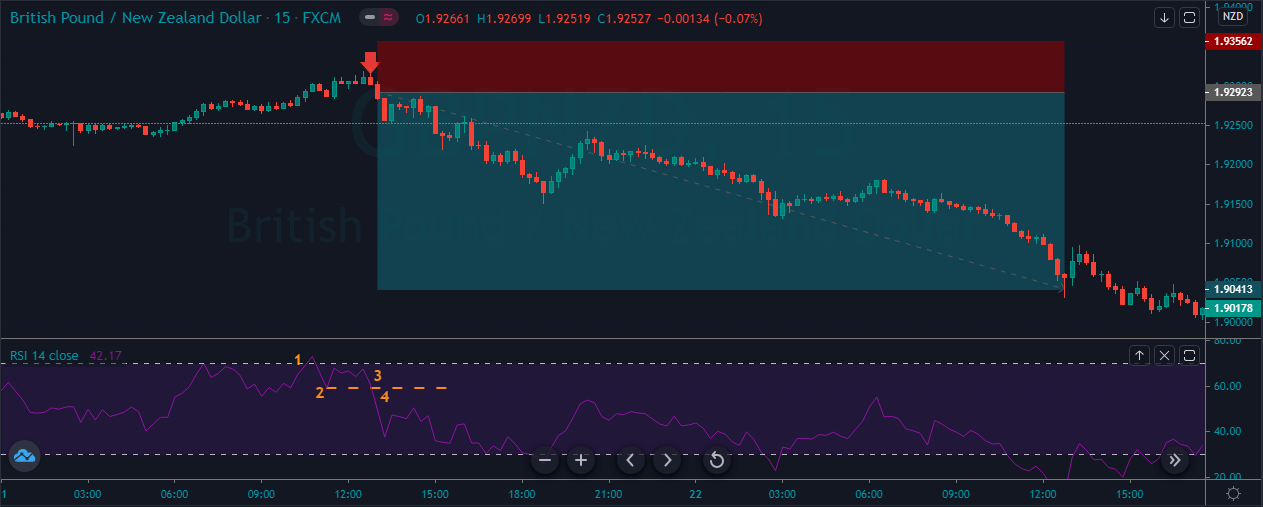
The image below represents the buying entry in the GBPNZD forex pair.
The image below represents the entry, exit and stop loss in the GBPNZD forex pair. As you can see, the pair was in a pullback phase, when the indicator fulfilled all four points. At point 1, the indicator represents the oversold market, at point 2, it represents some buyers try to take the price high, but at point 3 sellers came back. They tried to print the new lower low but failed, and immediately strong buyers smack back up, and they printed a brand new higher high.
STOCHASTIC OSCILLATOR.
Stochastic is a momentum indicator developed by George Lane in the late 1950s. Stochastic is a celebrity or even the favoured indicator because it is easy to understand, and it also has a higher accuracy to identify the potential trading signals. The indicator measured the relationship between a security closing price and its price range over the predetermined period of time. According to the Lane, Stochastic doesn’t follow the price, or it doesn’t follow the volume or anything instead the indicator follows the speed and the momentum of the price to shows what’s going on in the market. The indicator changes its momentum before the price action, which makes it the leading indicator in the industry. The bullish and bearish divergences are very useful when it comes to trading the upcoming potential reversals. The Stochastic is a range bound indicator scaled between the 0 to 100 level, and the 80 and 20 are the traditional levels which used by the traders to identify the potential trading opportunities when the indicator reaches the 80 level it indicates the overbought market conditions and expects a reversal, and when it reaches the 20 level it is a sign of the oversold conditions and any reversal will be good to go long. In short at overbought conditions, we take to sell, and in oversold conditions, we choose to sell. The indicator consists of two lines: one reflecting the actual value of the indicator and the other one reflecting its three day simple moving average. The intersection of these two lines is considered to be a signal of the upcoming price reversal, as it indicates a large shift in the momentum. Keep in mind that the stochastic can stay at the oversold and overbought conditions for long enough time, so don’t a stochastic sheep who just blindly hit the buy and sell when price action approaches these levels. Instead, use other indicator with the stochastic to filter out the bad trading opportunities.
PAIRING THE STOCHASTIC WITH THE RSI INDICATOR.
FOR BUY.
- Look for the trending market.
- Check both of the indicators if they both are saying the market is preparing to go long then take buy entry.
- Put the stop loss just below the entry.
- Go for the brand new higher high.
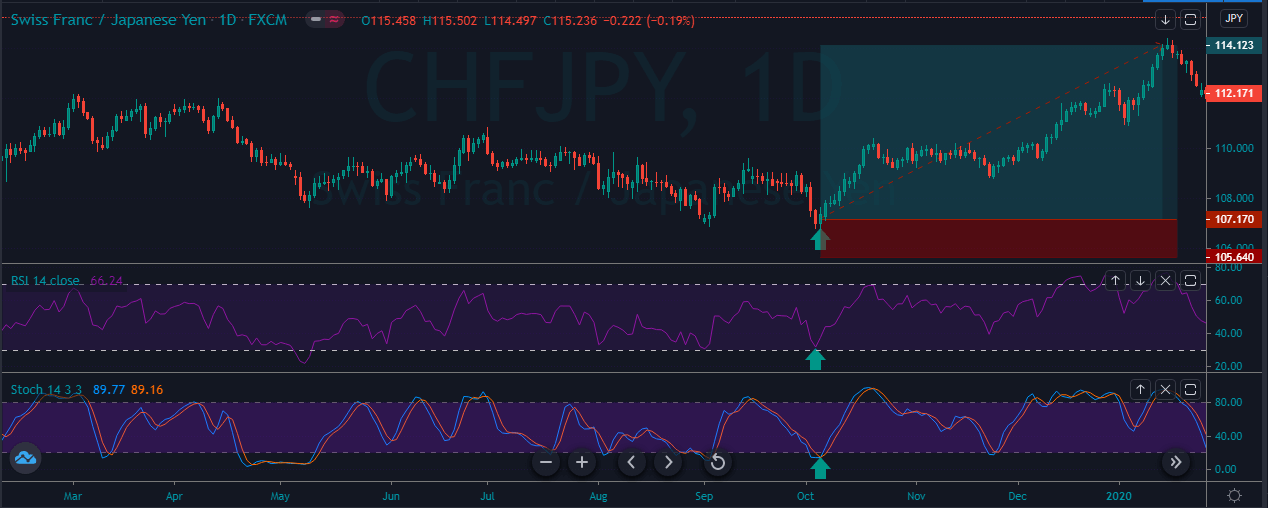
The image below represents the buying entry in the CHFJPY forex pair.
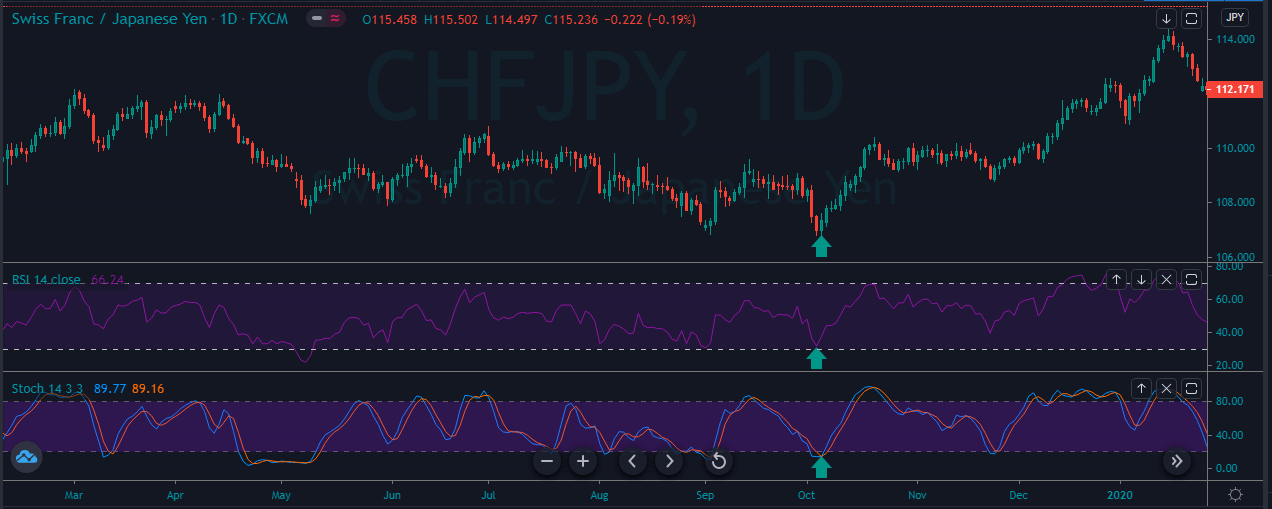
The image below represents the entry, exit and stop loss in the CHFJPY forex pair. As you can when the prices were turned sideways and when both of the indicators reached the oversold area and gave the sharp reversal, it means that the buyers are now back into the show and brand new higher high has very likely chance to happen.
FOR SELL.
- Look for the downtrend.
- Check both of the indicators if they both are saying the market is preparing to go short then take sell entry.
- Put the stops above the entry.
- Go for the brand new lower low.
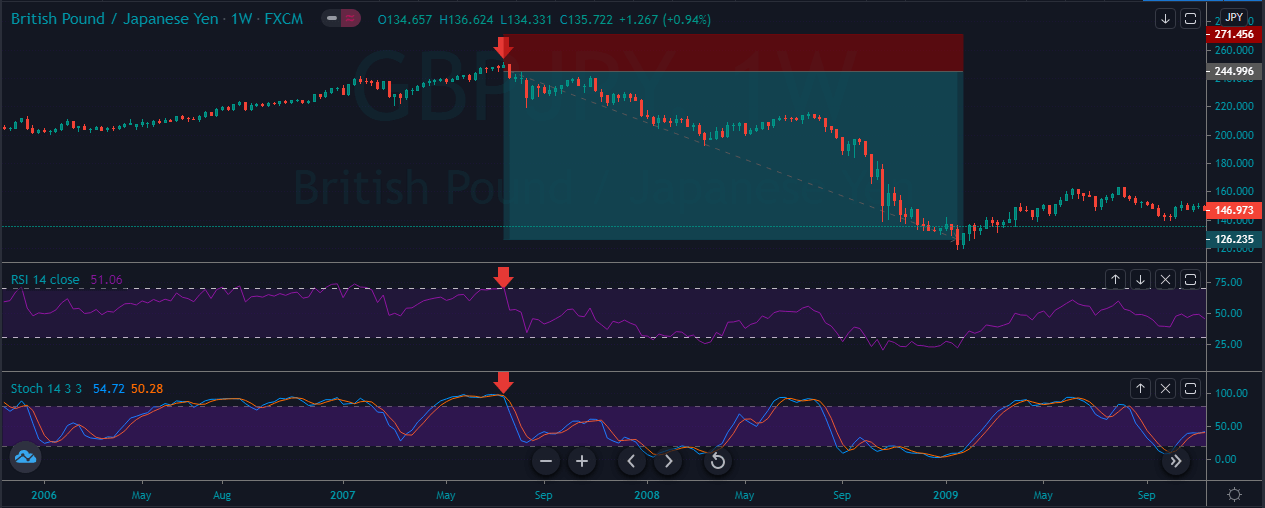
As you can see in the image below the pair represents the selling trade in the GBPJPY forex pair.
The image below represents the entry, exit and stop loss in the GBPJPY forex pair. On the weekly chart, the price action was in an uptrend, and when both of the oscillators reached the overbought area and the price action prints the strong red candle, it is a sign for us to expect the brand new lower low. As we took the sell entry price action immediately dropped, and we witnessed the drop of 12000+ pips within just nine months.
STOCHASTIC SWING REJECTIONS.
BUY TRADE.
- Make sure Stochastic is in overbought territory.
- Stochastic reverse below the 80 level.
- Stochastic forms another high without crossing back into the overbought territory.
- Stochastic breaks its most recent low.
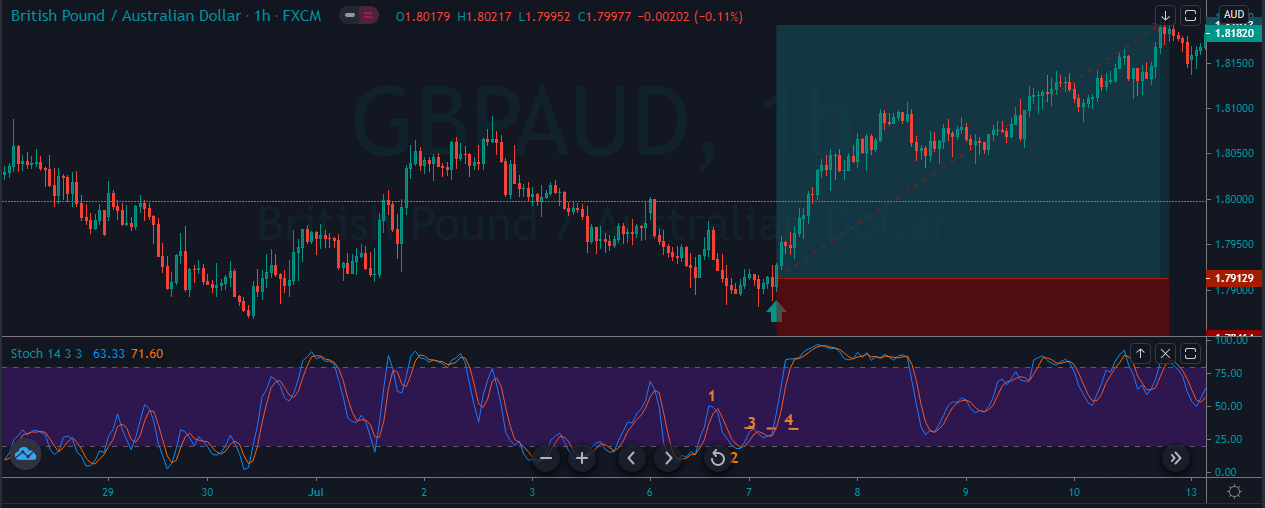
The image below represents the buying entry in the GBPAUD forex pair.
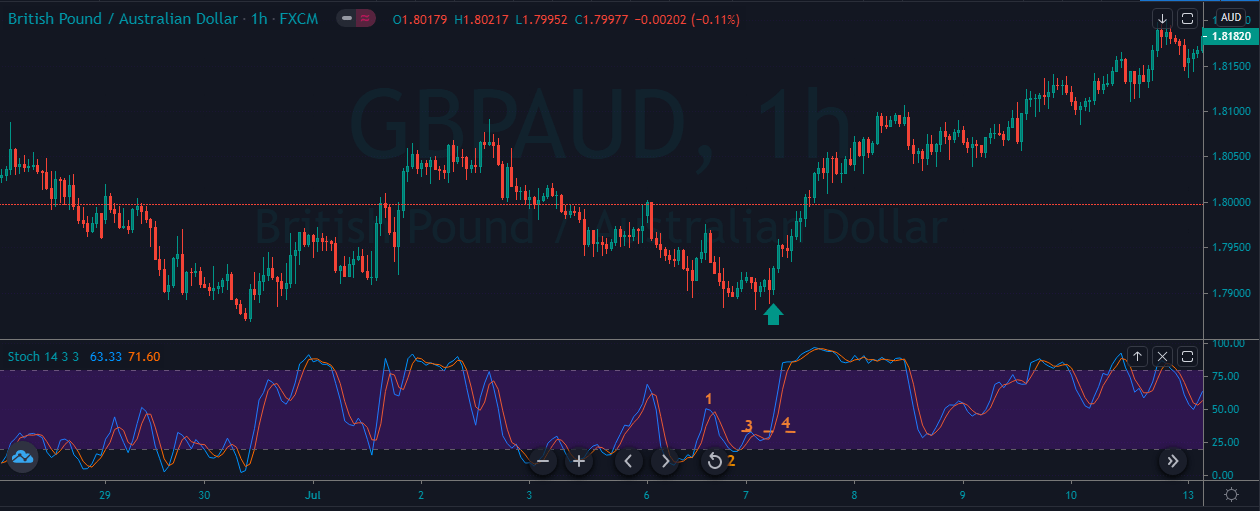
The image below represents the entry, exit and stop loss in the GBPAUD forex pair. As you can see, the sellers having a lot of struggle to go down and also at the same time, price approached the oversold area. So when all the 4 point instruction was followed the stochastic oscillator, we choose to go long in this pair, the stops was just below the entry, and for the take profit, we choose the brand new higher high.
SELL TRADE.
- Make sure Stochastic is in oversold territory.
- Stochastic reverse below the 20 level.
- Stochastic forms another low without crossing back into the oversold territory.
- Stochastic breaks its most recent high.
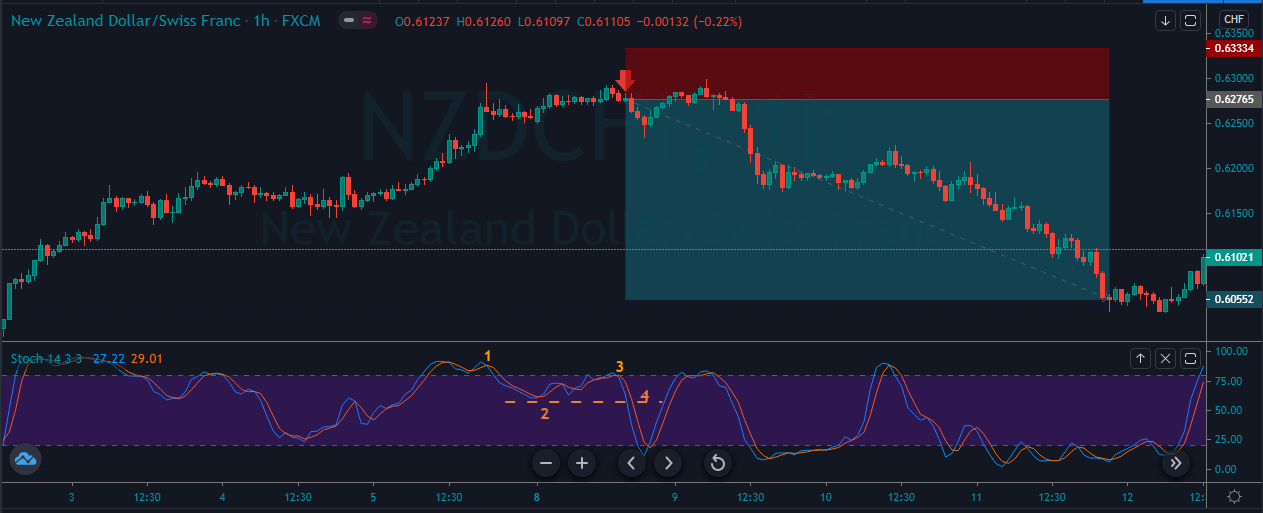
The image below represents the selling entry in the NZDCHF forex pair.
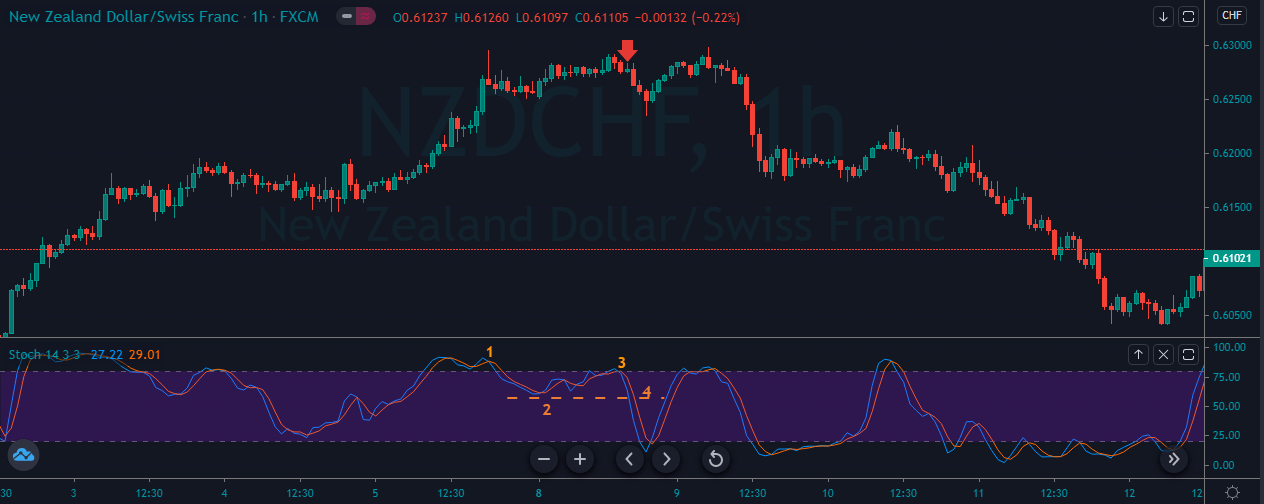
As you can see in the image below, it represents our entry, exit and stops loss in the NZDCHF forex pair. As you can see the pair was in an overall uptrend and the stochastic at overbought area means the reversal is about to happen. Still, we wait for the precision entry only when the indicator followed all the four steps of our strategy. This strategy is the new one in the market, and it often gives the excellent risk to reward ratio trades, and simply expect the fewer trades in the market. Whenever you find all the four points in the market, it’s a sign for you to go big in your trades and always expect the brand new higher high or lower low.
BOTTOM LINE.
Both of the indicators are the celebrity in the industry; both of them worked at different market conditions. RSI is designed to measure the speed of the price movements, and the stochastic oscillator works well in the choppy markets. The RSI consists of one single line which oscillates between the 70 to 30 level, and the stochastic oscillator consists of two lines which move between the 80 and 20 level. Overall, the RSI indicator is useful to trade the trends, whereas to trade the ranges and channels always go for the stochastic oscillator.