Introduction
Trading the forex market is a challenging thing for some traders, but it’s quite an easy game for other traders. The only difference between the successful and unsuccessful trader is the mindset and the ability to wait for the correct setup to pull the trigger. Most of the lower timeframe traders often miss these qualities; on the other hand, the higher timeframe trader possesses these qualities to trade the market successfully. In this trading strategy, we will share some tips and tricks to trade the higher timeframes successfully.

What is the Timeframe in Forex Trading?
Time frame means the unit of time that the price chart which you are viewing based on. The weekly timeframe of Japanese candlestick represents the one week, and the 5-minute chart of the Japanese candlestick represents the 5 minute time. The smaller the timeframes, the more candlestick chart prints, and the higher the timeframe, the lesser the candles you will see.
The weekly timeframe has so many trading advantages as compared to the lower timeframes. The higher timeframes move slowly, so there is no chance of any noise on the higher timeframe. Most of the technical indicators work very well on the higher timeframes because you are not going to see any fake or odd signals on a higher timeframe. On the lower timeframe, you are not going to have much countertrend trades, but on the weekly chart, you can easily find the countertrend trades. Weekly trading always produces better results because to trade the market successfully; you need trend or momentum. When you use the trending market with the momentum indicator, then you automatically end up at the top in your trading game. Another major problem we have with intraday trading is the Algorithms, which also known as high-frequency trading, where the robots or the trading systems placed hundreds of trades in a single day, which added considerable danger to the retail trading. These trading systems jamming price action higher and lower, and they creating the hell amount of volatility which prints the fake outs, spikes triggered the stop losses. Higher timeframes are far from these kinds of behaviors, which often provide an excellent risk to reward ratio trades.
Weekly charts move very less, so it is advisable to follow the risk management rules we explained below.
- Weekly timeframe provides fewer opportunities, so it doesn’t mean you use the higher-margin to trade it. A smaller number of lot sizes do the same work when you let the price action travel further.
- Be selective in position sizing, and always go for the good trades, ignore the bad or low profile trades.
- Always try to trade your edge only, focus on the moving average to successfully trade the weekly charts.
- Respect the power of the opportunity cost. The capital you set aside to trade the weekly chart can last for several months. So patience and having full faith in your analysis is the key to trade the weekly chart.
TRADING STRATEGIES BY USING THE WEEKLY CHART.
WEEKLY CHART SUPPORT AND RESISTANCE TRADING.
BUYING TRADE.
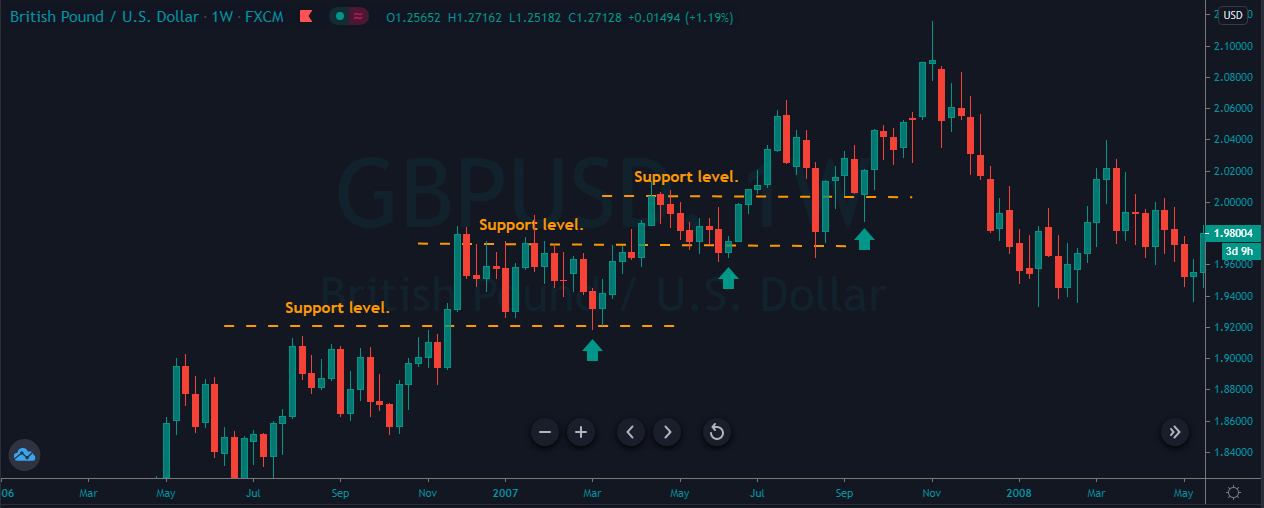
This one is the simplest yet most important trading strategy investor’s use. The idea is just finding out the trending market and take buy entries when price action approached the support level. Conversely, the idea is the same for the sell-side; look at the selling market on a weekly chart and take sell trades every time price action hits the resistance area.
The image below represents a couple of buying trades in the GBPUSD forex pair.
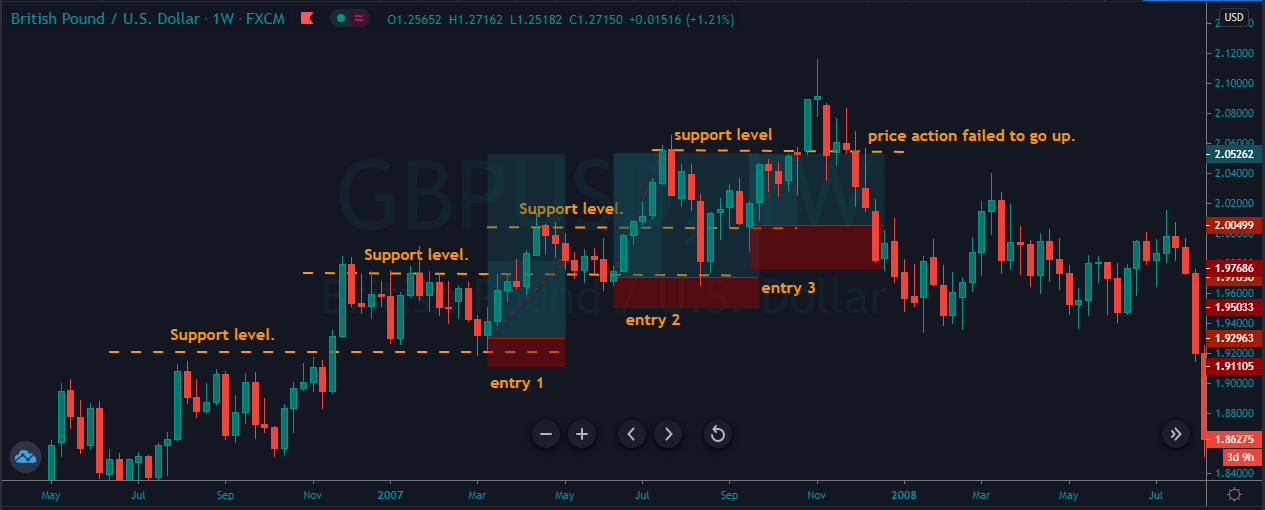
The image below represents a couple of selling trades in the GBPUSD forex chart. As you can see in an uptrend, whenever the price action approached the support area, we took buy entry, so price action thrice gave us the buying trades, and whenever we got the opportunity, we choose to scale our trade. So when the fourth time price gave another opportunity, we took the buy entry, but prices failed to hold at the support area, so we end up closing all the three buying trades. Weekly charts often took a couple of months, even years to perform. So most of the investors expect three to four trades on the weekly chart in a year.
SELL TRADE.
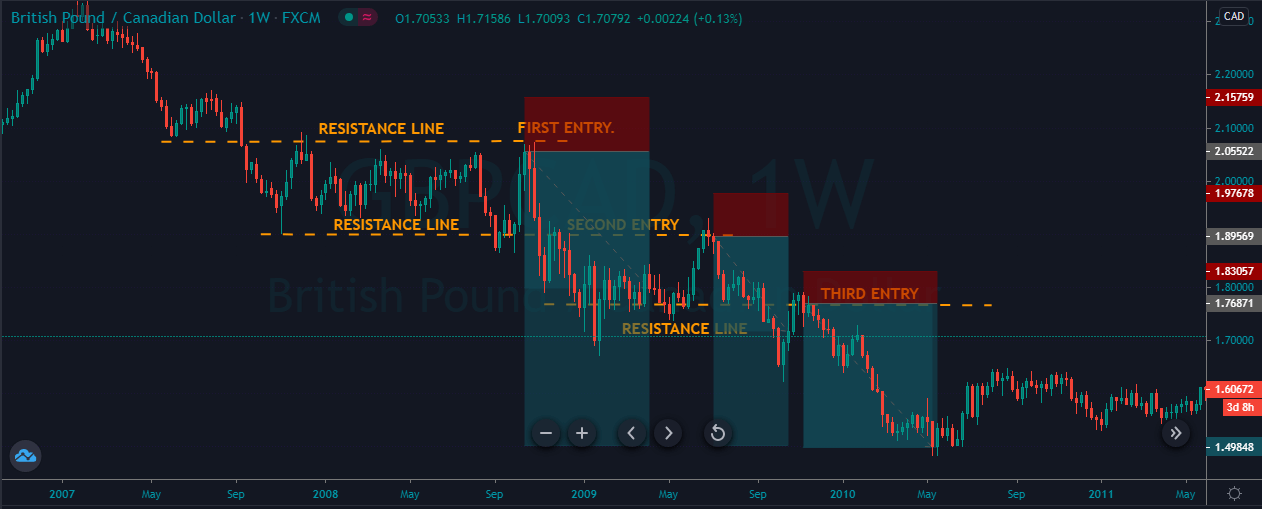
The image below represents a couple of selling trades in the GBPCAD forex pair.

The image below represents a couple of selling trades in the forex pair. As you can see, the pair was in a strong downtrend, and at every pullback, we choose to go short in the market. After the first trade price action printed the brand new lower low, then it pulled back again to the most recent resistance area. The price action respects the resistance area by printing the one red candle, and it was the clue for us to go short again. For the third time, prices again go to the most recent resistance area and the same story again, major level reject the price action and third time we end up taking a selling trade. On the weekly or even daily and monthly charts, do not expect the price action to stay at the major levels for a more extended time period. This is something not possible; most of the time, prices spent one to two weeks at the major level, and then it starts moving again.
TRADING THE ENGULFING PATTERN ON THE WEEKLY CHART.
BULLISH ENGLUFING
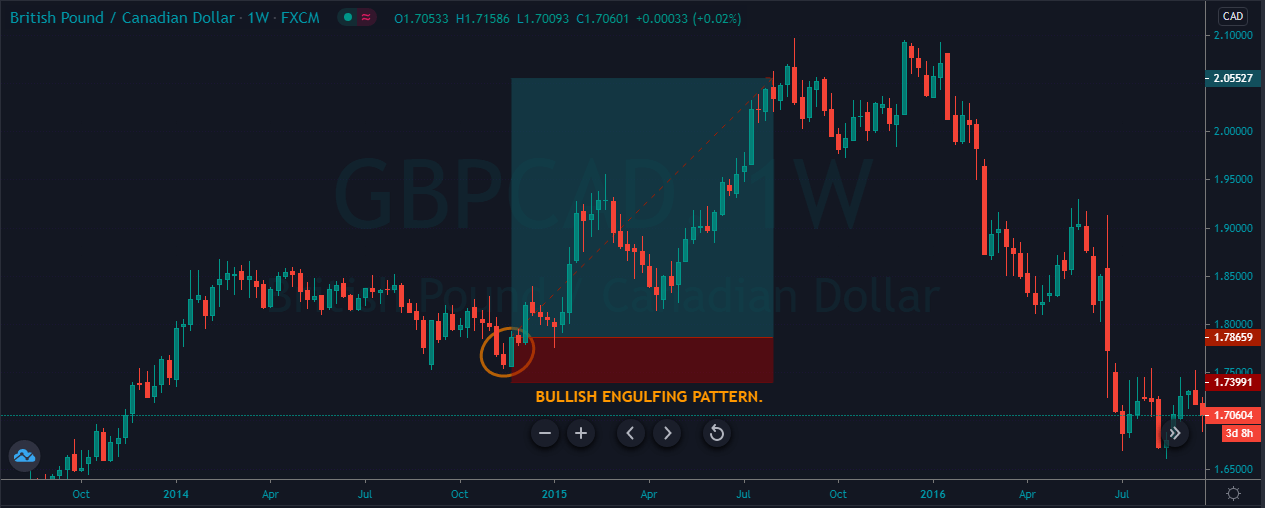
A bullish engulfing is a reversal pattern that forms when the larger green candle follows the small red candle. The body of the red candle completely engulfs the previous day candle. This pattern indicates the market hits bottom, and now the buyers are going for the brand new higher high.
The image below represents the bullish engulfing pattern in the GBPCAD forex pair.
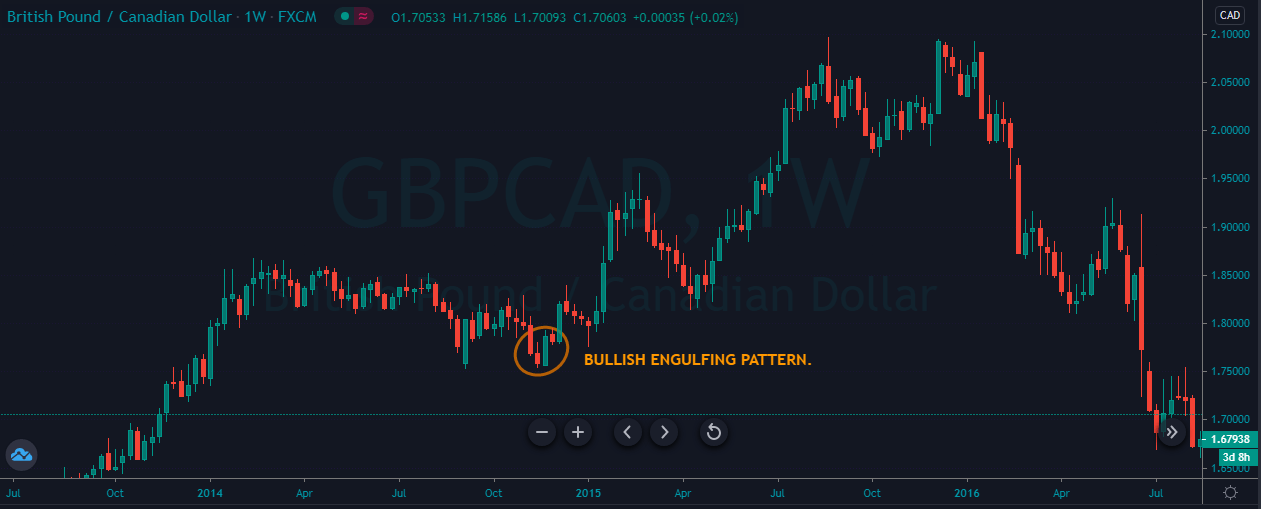
As you can see in the image below, the pair was in a strong uptrend, and during the pullback, it prints the bullish engulfing pattern, which was a sign for us to go long in this pair. As we took the buy entry, the price action goes up; it holds at the major resistance level and then blasts to the north. On the weekly chart, this trade ends up milking 200 pips within just four months. The higher timeframes perform very well for those traders or investors who have enough patience to hold their trades for a longer period.
BEARISH ENGULFING.
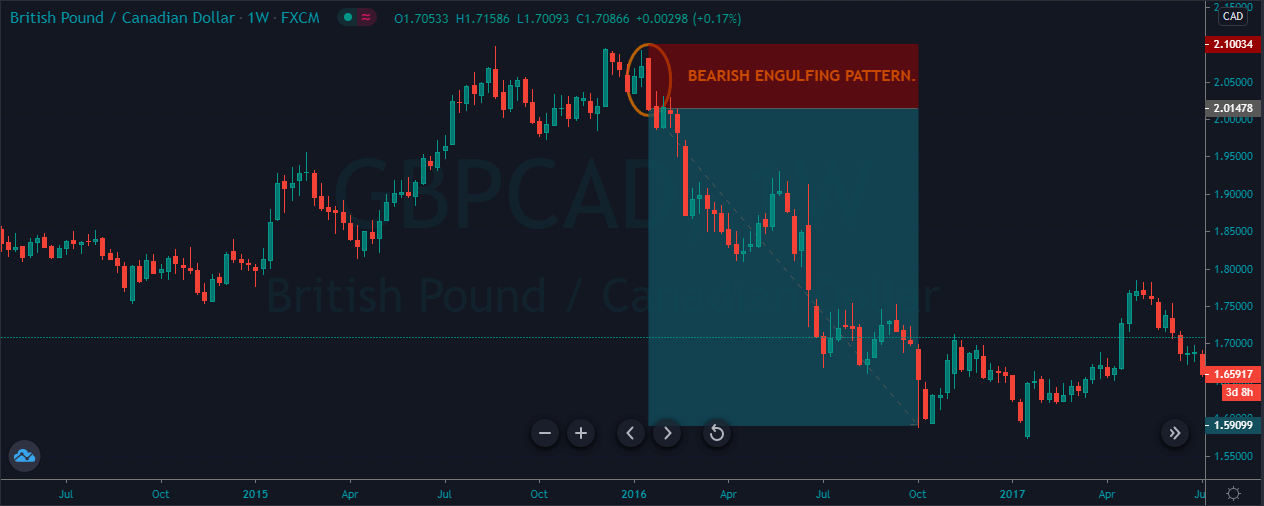
A bearish engulfing is a reversal pattern that forms when the larger red candle follows the small green candle. The body of the green candle completely engulfs the previous day candle. This pattern indicates the market hits the top, and now the sellers are going for the brand new lower low.
The image below represents the bearish engulfing pattern on the GBPCAD forex pair.
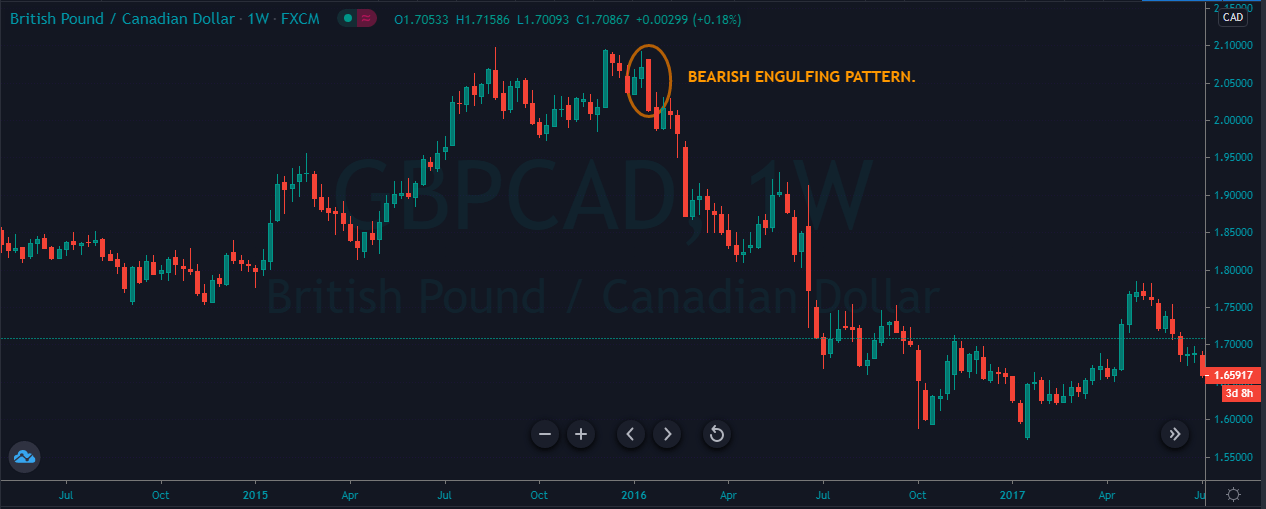
As you can see, the GBPCAD pair represents the bearish engulfing pattern on the weekly chart. In a strong uptrend, when we got the bearish engulfing pattern, the price action immediately blasts to the north, and it prints the brand new lower low. This trade ends up generating nearly four thousand pips within just four months. Imagine if you took this trade with a higher lot size, you could very easily make a six-figure income from one single trade. The higher timeframes provide less but accurate trading signals, so whenever you find the trade go big.
CONCLUSION.
Weekly charts are specially designed for investors who are not interested in sitting in front of the computer; instead, they desire to invest the cash for the longer term. Most of the investors inject large sums on money on the higher timeframes, making the market move. Overall, trading the higher timeframe is a lot safer than, the lower timeframes. Here you are not going to get any unnecessary spike of fake outs. Simply follow the rules of your strategy and trade the market. It is advisable not to use the technical indicators to trade the weekly chart because most of the indicators are the laggard indicators, so you will end up taking trades very late. Trend line trading, support and resistance trading, and candlestick pattern trading is best for the weekly charts.