Introduction
The RSI stands for the Relative Strength Index, and it is one of the most popular indicators in the market. The RSI indicator was developed by J Welles Wilder, and he explained this indicator in his book New Concepts in Technical Trading Systems in June of 1978. The RSI is a momentum indicator that measures the speed and the change of the price movements. The RSI measures how well the underlying asset is performing against itself by comparing the asset strength of the up days versus the down days. The RSI has a range between 0 to 100, and the reading above 70 indicates the overbought conditions, and the readings below 30 indicate the oversold conditions. The RSI indicator is featured in the number of articles, books, and interviews over the year. The RSI signals can be generated by the overbought and oversold conditions, bullish and bearish divergence, centerline crossovers and failure swings. By default, the RSI used the 14-period averages, but this can be lowered to increase the sensitivity of the asset. You can set the parameters according to the asset volatility; the higher the volatility, use the higher average and lower the volatility, use the lower average. The overbought signal at 70 and oversold signals at 30 are also the traditional levels; traders can adjust these setups to better fit the security or analytical requirements. Using the 80 and 20 levels automatically reduces the numbers of overbought and oversold readings.

DEFINING THE CURRENT TREND
RSI indicator provides so many advantages to the traders, which makes it the celebrity indicator. Most of the traders think RSI only provides the buy and sell signals, but it’s not true, the RSI also provides the ability to gauge the primary direction of the trend. So, first of all, we must define the range where the RSI can track the bull and bear markets. For the bull market, we suggest you look out for the 66.66 readings, and the bear market uses the 33.33 readings. I know this is slightly different from the traditional levels of 80/20 and 70/30. These readings of 66.66 and 33.33 provided by John Hayden in his book, titled “RSI: THE COMPLETE GUIDE.” According to the author, he suggests that these numbers measure the true bull and bear trends, not by default readings.
4 Simple RSI Trading Strategies
- RSI SWING REJECTION.
This trading approach is a very new RSI trading strategy, this one is not very popular among the traders, but it works very well on all the timeframes and in all types of market conditions. This Technique is called the RSI swing rejection.
FOR BUY
- RSI approached the oversold territory.
- RSI crosses above the 30 level.
- RSI prints another dip without going below into the oversold territory.
- RSI breaks its most recent high.
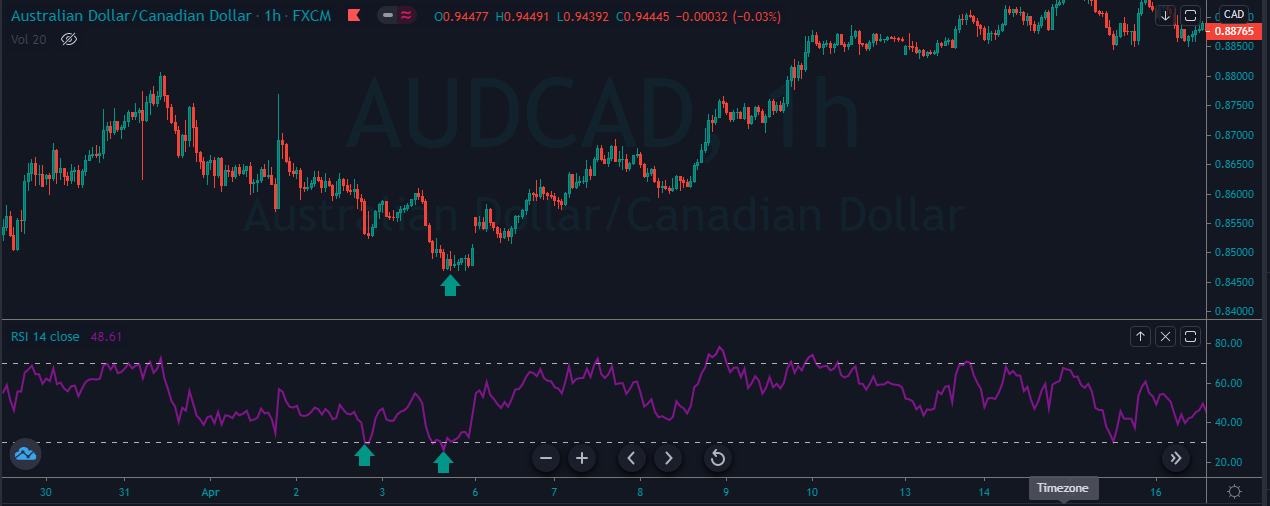
The image below represents the buying trade in the AUDCAD forex pair.
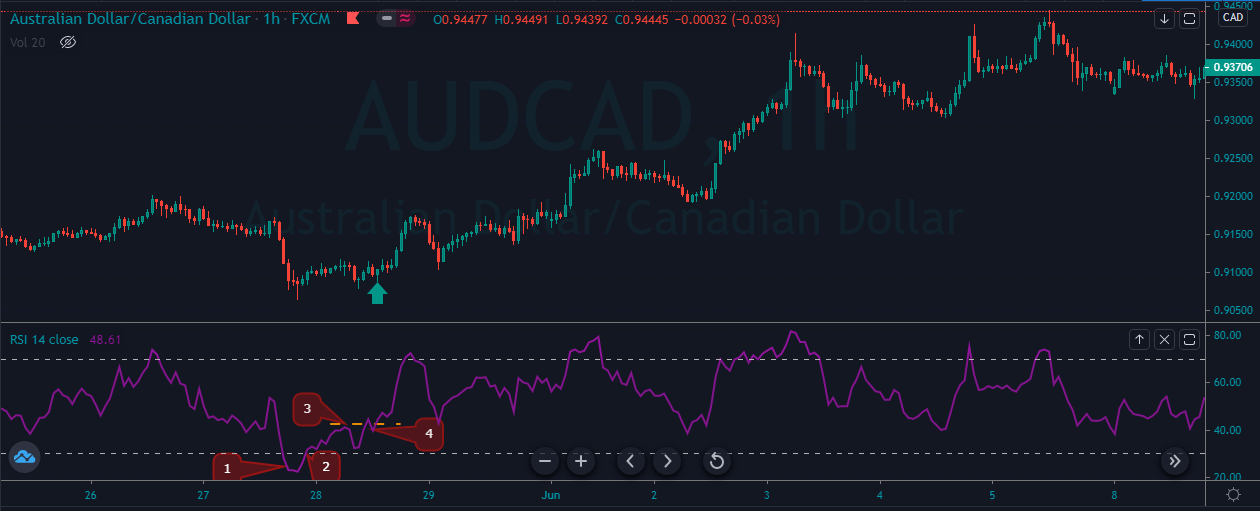
As you can see in the below image point, one shows the price action approached the oversold territory, which means the sellers are exhausted in this pair and soon expect the reversal. So point 2 represents the price action reversed from the oversold territory and the third point showing the sellers tried again but the immediate push from the buyers { point 4 } not accepting the sellers and are ready to go long from here. After our entry price action without any struggle goes higher, and it prints the brand new higher high.
FOR SELL
- RSI approached the overbought territory.
- RSI crosses below the 70 level.
- RSI tries to print another top, but it failed, and it stays below the overbought territory.
- RSI breaks its recent low.
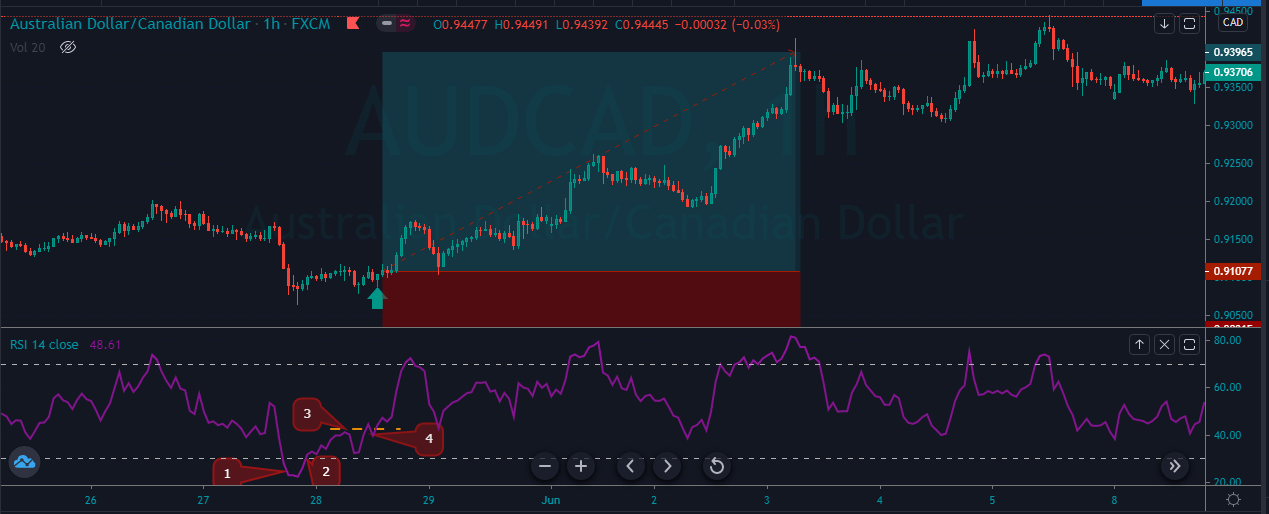
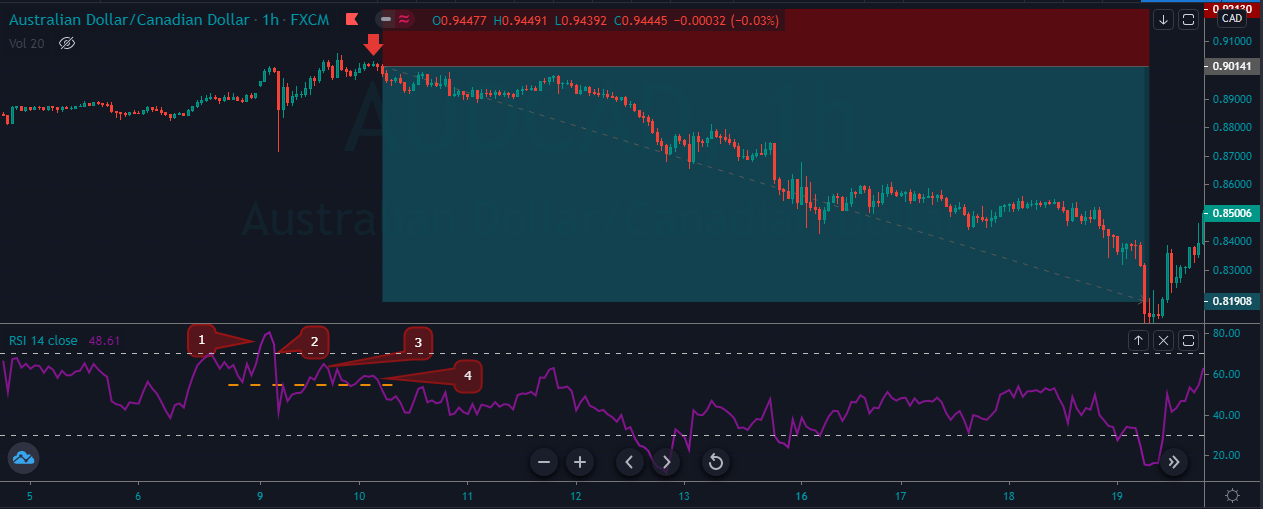
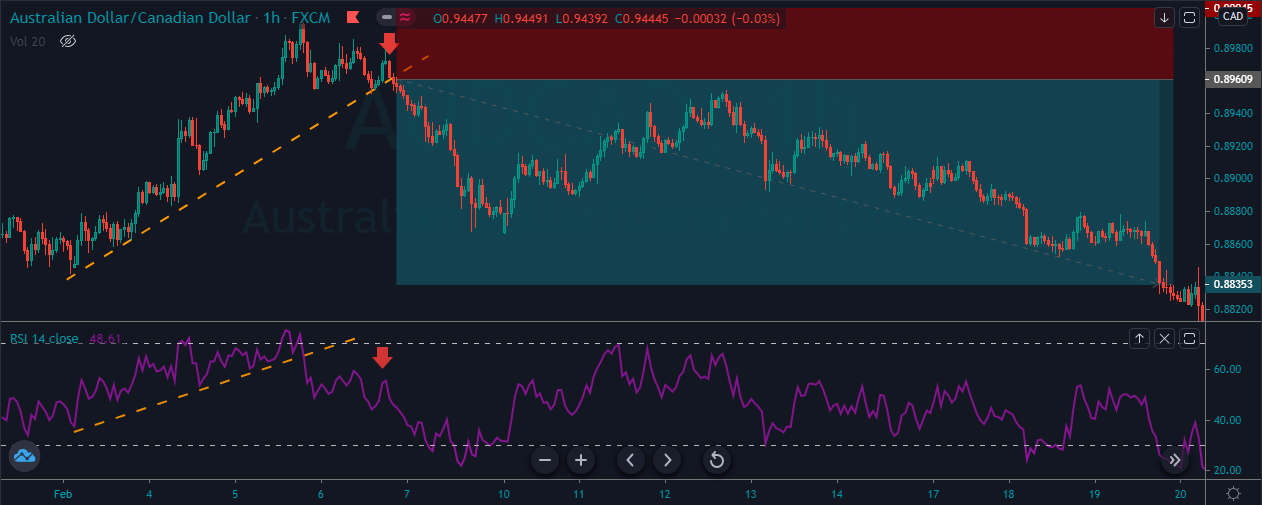
The image below represents the selling entry in the AUDCAD forex pair.
As you can see that the point 1 shows the buyers are now weakening and the strong push {point 2} represents how aggressively sellers came into the show and tries to print the brand new higher high, but they failed, and the buyers again try to dominate the game, but they also failed to reach the overbought levels, and the strong buyers at point 4 finally came aggressively, and they printed the brand new lower low. In this pair, we go for the smaller stops, and the take profit was down to the higher timeframe support area.
RSI SUPPORT AND RESISTANCE
The RSI indicator also represents the actual support and resistance levels on the indicator, and these lines come in the form of horizontal zones or as a sloping trend line. Most of the traders do not know this, but they can apply the trend lines on the indicator just the way they apply on the price chart.
BUY ENTRY
The image below represents the buying trade in the AUDCAD forex pair.
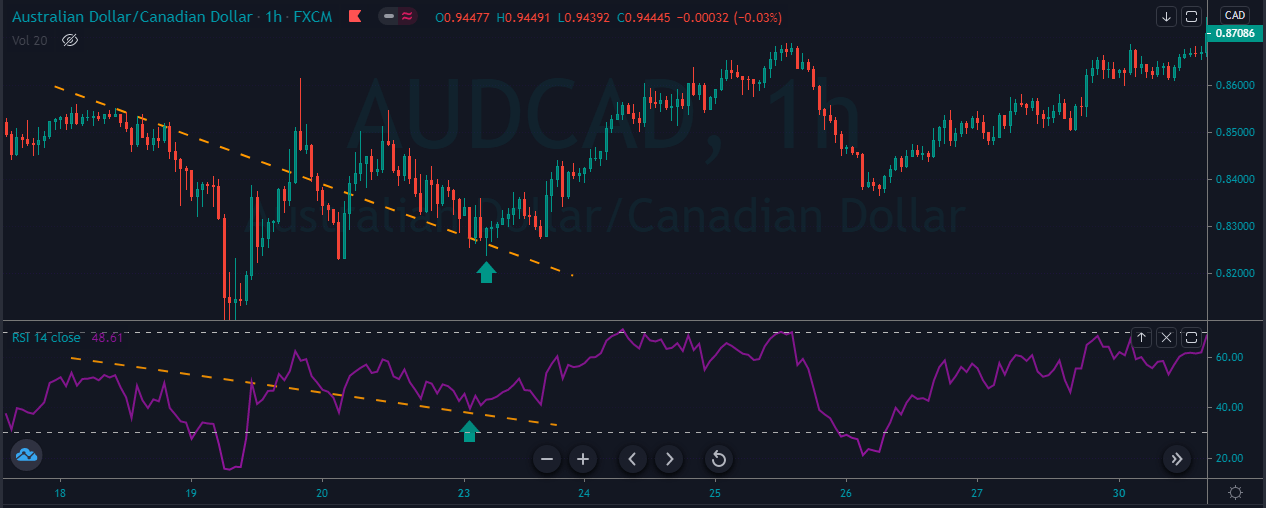
The image below the RSI indicator was holding above the trend line, which is an indication for us to go long in this currency. We took buy entry when RSI almost approached the oversold area, with smaller stops, and we choose to exit at the most recent higher high.
SELL ENTRY
The image below represents the selling trade in the AUDCAD forex pair.
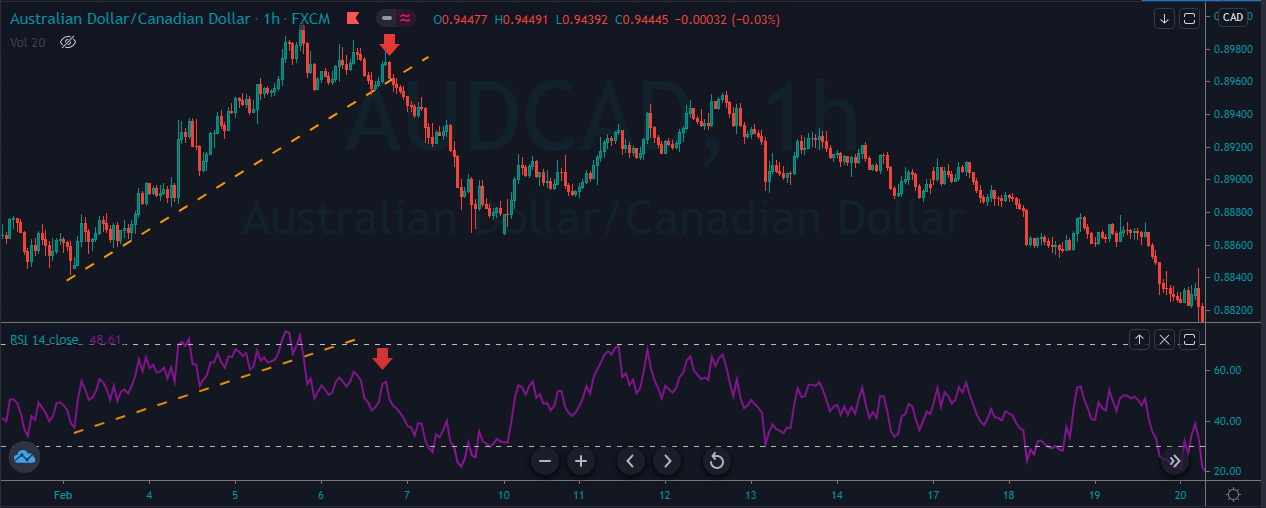
The image below shows the selling entry in this forex pair. You can see that the RSI indicator was respecting the trend line, and the price action was printing the brand new higher highs, so when the indicator approached the oversold area, it gave the breakout below the trend line. It was a sign of buyers weakening, and the sellers took control of the show. After entry, price action goes smoothly down and then a correction for sometimes and followed by the brand new lower low.
- RSI DOUBLE BOTTOM
BUY ENTRY
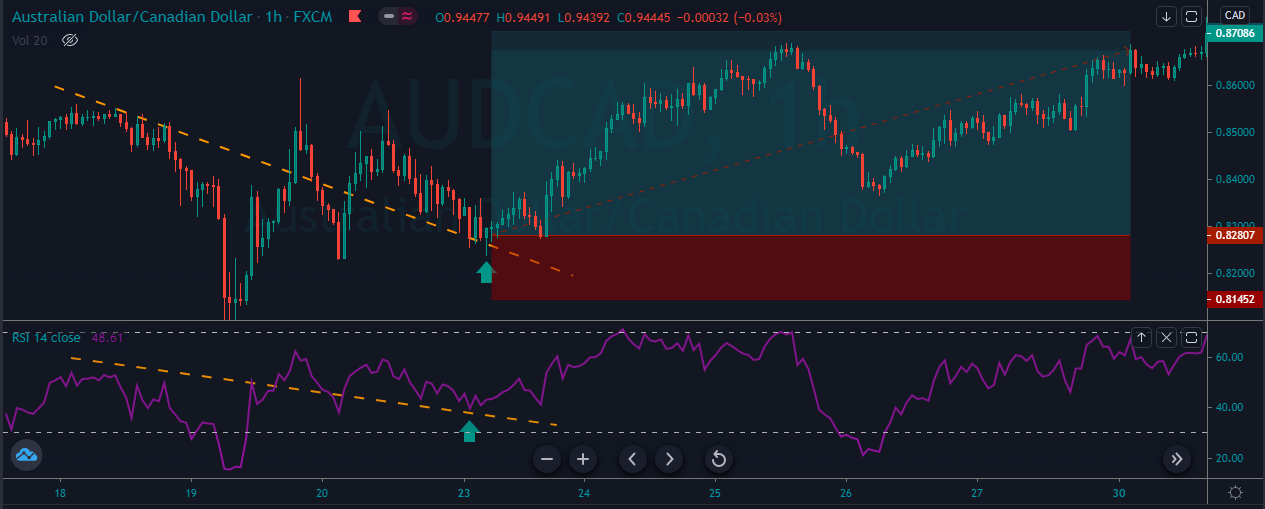
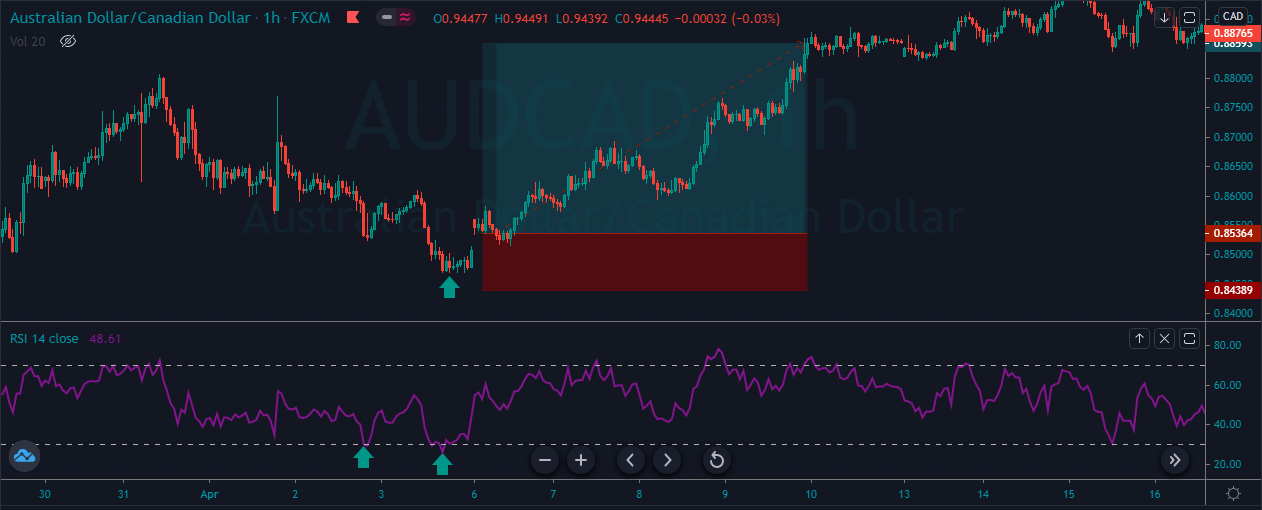
The image below represents the Double bottom pattern on the price chart.
The image below represents the double bottom pattern on the AUDCAD forex chart. The double bottom pattern represents the sellers tried twice to print the low, but both of the time, they failed to do so. The aggressive buyers were sits at the oversold areas to eat all the sell orders to print the new higher high. After the double bottom, we took buy entry, and price action smoothly goes north, and it prints the brand new higher high.
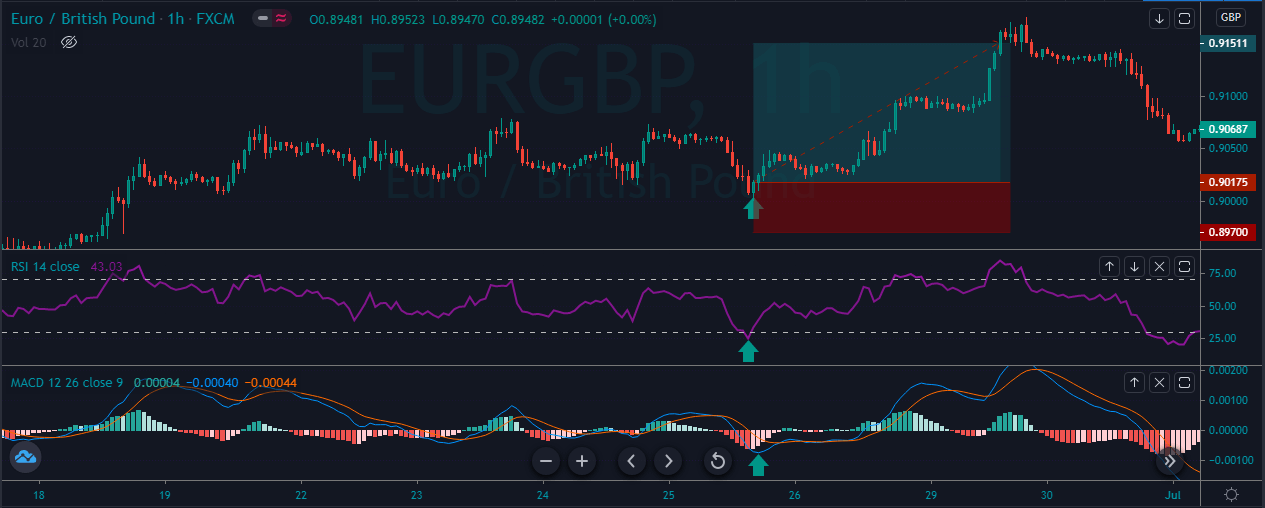
- RSI + MACD
In this strategy, we pair the RSI indicator with the MACD indicator to identify the trading signals. MACD is one of the simplest and most effective momentum indicators. The MACD fluctuates above and below the zero line, and it gives the trend line crossovers, centerline crossovers, and divergence to trade reliable opportunities. In this strategy, we paired the indicator with the RSI indicator to identify the significant trading opportunities.
The image below represents the buying opportunity in the EURGBP forex pair.
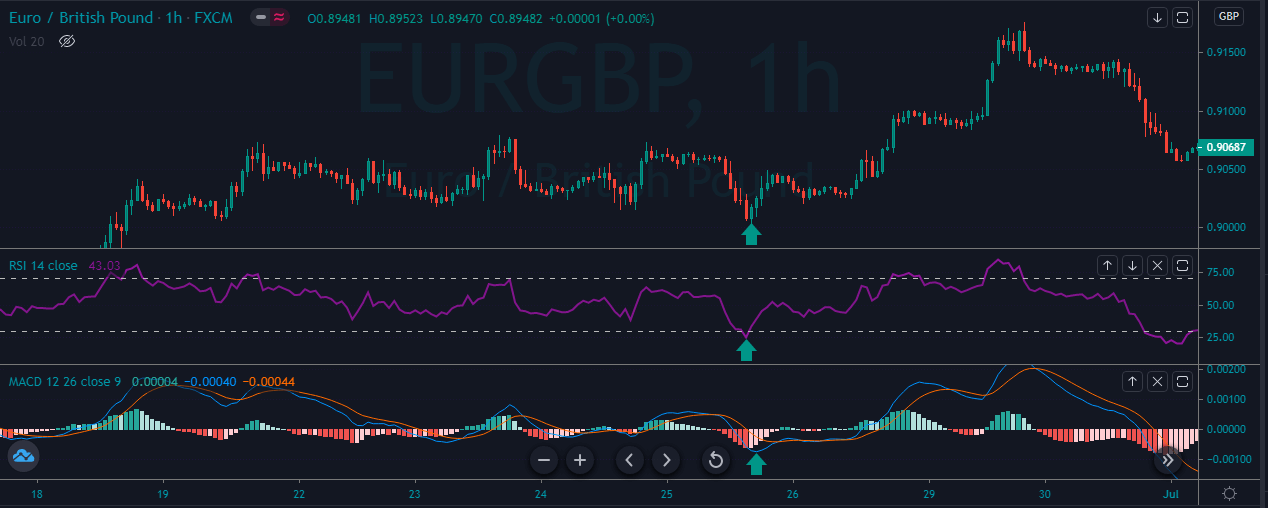
As you can see in the below image, when both of the indicators approached the oversold area, it’ a sign to go long in this forex pair. After our entry price action smoothly goes up, and it prints the brand new higher high. By pairing the one indicator with the other, we can easily filter out the low probability trades in the market.
CONCLUSION
True reversal signals are hard to identify on the price chart, but you can somehow got an idea of the reversals by checking the divergence on the chart. The RSI indicator displays the momentum so the asset can stay at an overbought and oversold area for quite a long time. So it is advisable to use the indicator in the oscillating market where the asset keeps alternating between the bullish and bearish movements. The traditional levels of 70 and 20 work very well in the market you can use them also you can use the John Hayden 66.66 and 33.33 levels to gauge the momentum better. Stop-loss is always recommended when using the RSI, and you can pair it with the other technical tools, or you can use the indicator as it is. The above we explain the four trading strategies which are mentioned below:
- RSI SWING REJECTION.
- RSI SUPPORT AND RESISTANCE.
- RSI DOUBLE BOTTOM.
- RSI + MACD.
These four are the best trading approaches we have ever discovered by using the RSI indicator.