On the news front, eyes will remain on the Manufacturing PMI and Services PMI figures from the Eurozone, U.K., and the United States. Almost all economic figures are expected to perform better than previous months, perhaps due to a lift of lockdown. Price action will depend upon any surprise changes in the PMI figures.
Economic Events to Watch Today
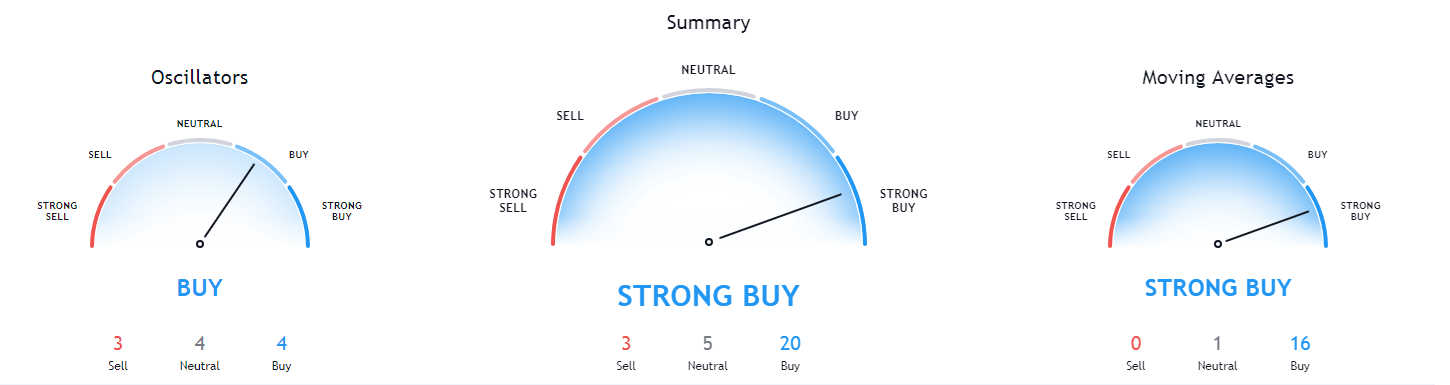
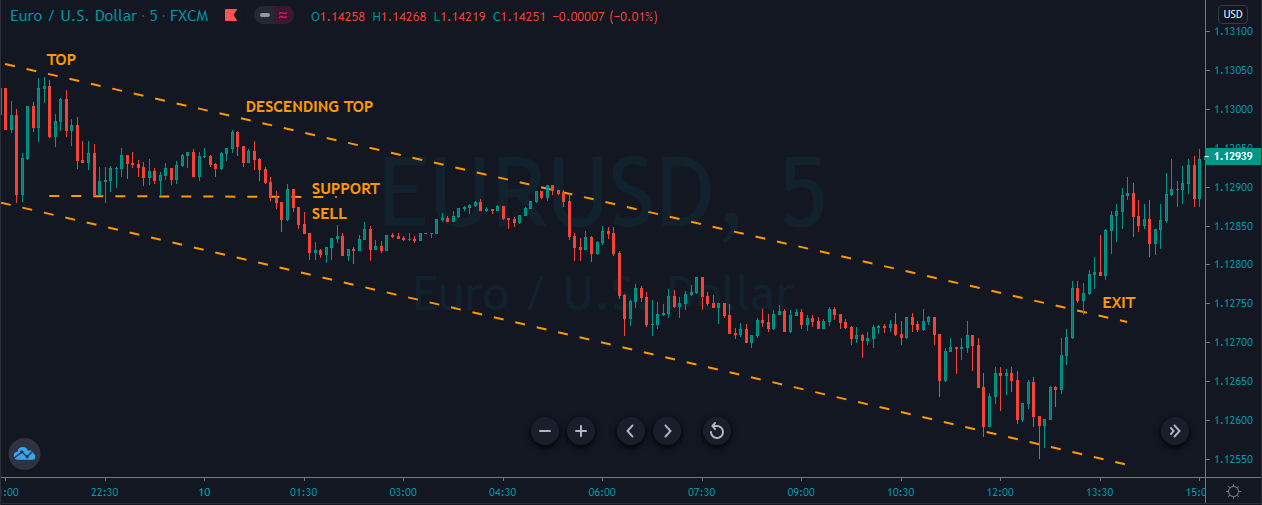
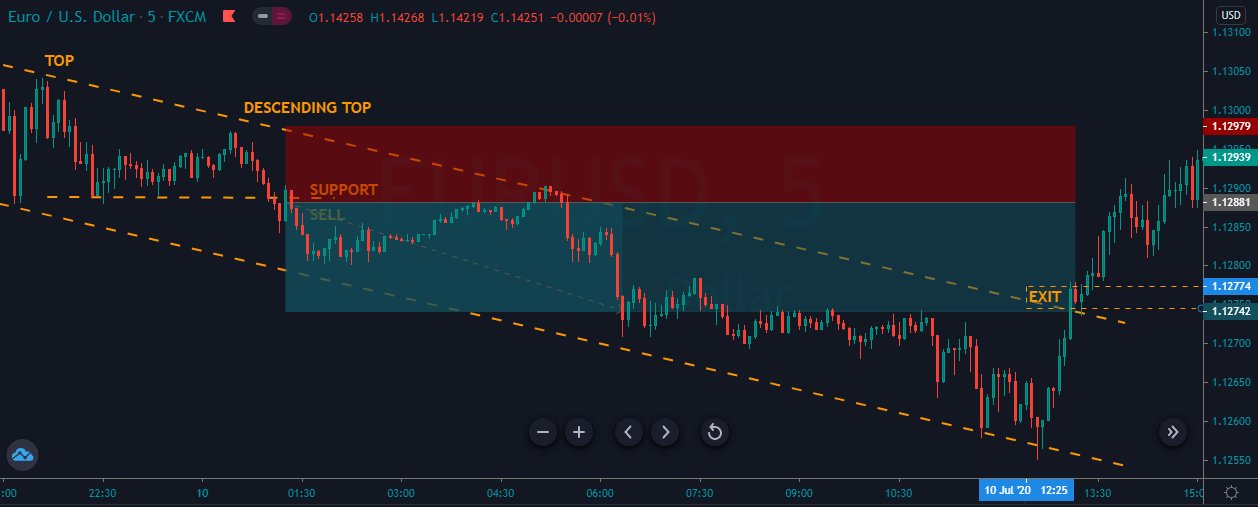
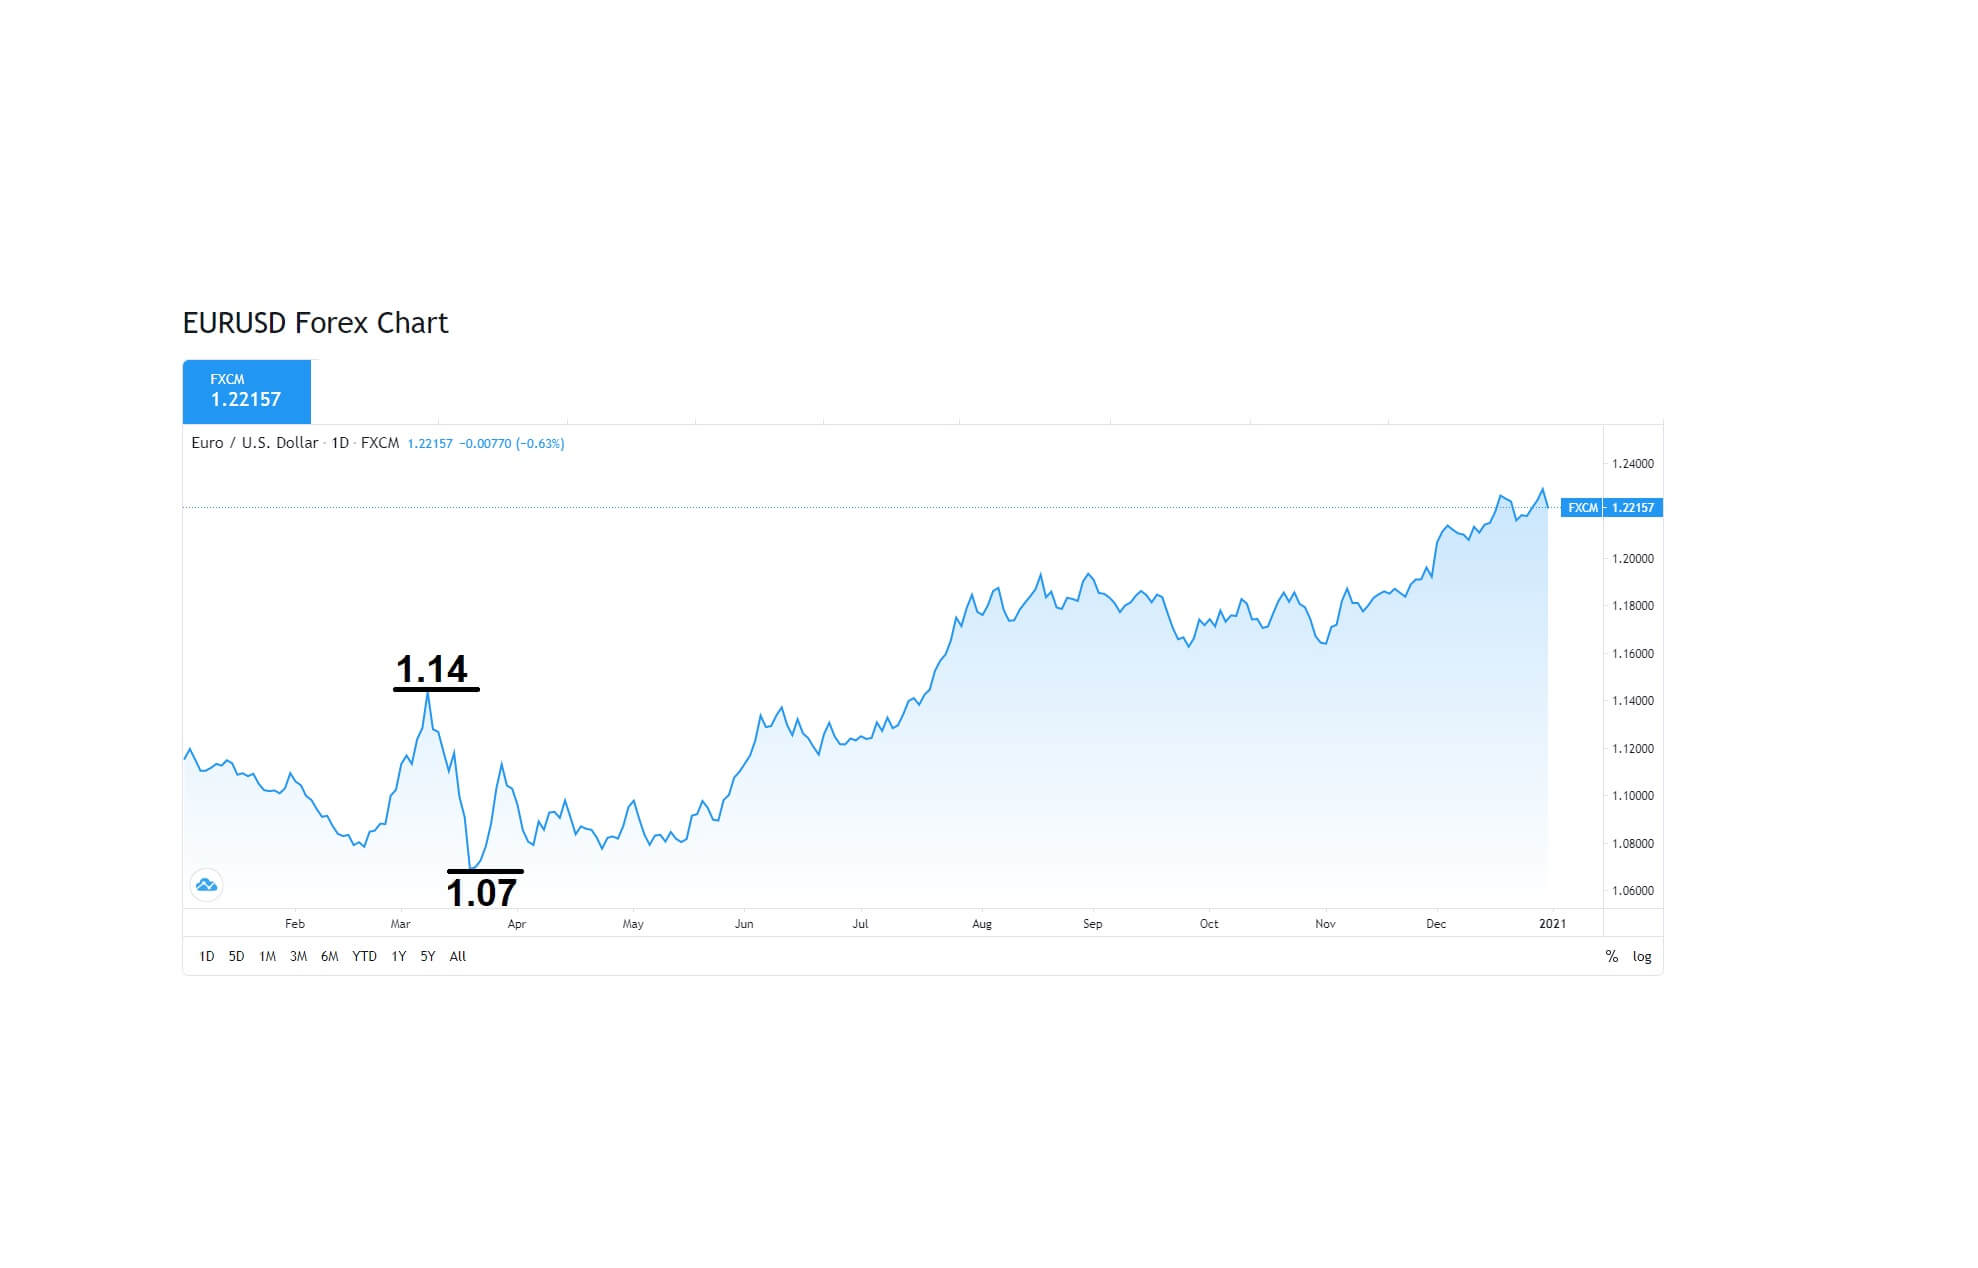
EUR/USD – Daily Analysis
The EUR/USD pair was opened at 1.22387, and it has placed a high of 1.22584 and a low of 1.22276 so far. The currency pair is currently moving at 1.25514 and has shown a consolidative move since the start of the day.
The U.S. dollar was weak across the board on Monday and the starting day of the week and pushed the currency pair EUR/USD higher on board. However, the EUR/USD pair’s gains remained consolidative ahead of the release of macroeconomic data from the European side.
At 13:15 GMT, the Spanish Manufacturing PMI for December is forecasted to come in as 52.6 compared to November’s 49.8, which, if met, will be supportive to the single currency Euro and will probably add gains in EUR/USD pair. At 13:45 GMT, the Italian manufacturing PMI for December is also expected to surpass the previous 51.5 and come in as 53.5 and support the single currency Euro to add further gains in EUR/USD pair. At 13:50 GMT, the French Final Manufacturing PMI is projected to remain flat at 51.1 for December. At 13:55 GMT, The German Final Manufacturing PMI for December is also projected to remain the same as November’s 58.6. At 14:00 GMT, the Final manufacturing PMI for December from the whole Eurozone is also expected to remain flat at 55.5.
From the U.S. side, at 19:45 GMT, the Final Manufacturing PMI from the U.S. for December is anticipated to release as 56.3 against the previous 56.5 and weigh on the U.S. dollar be beneficial for EUR/USD pair. At 20:00 GMT, the Construction Spending for November is estimated to decline to 1.1% compared to the previous 1.3%, and if the actual meet the expectations, then EUR/USD will gain more as the U.S. dollar will become weak.
Apart from macroeconomic data, the gains in EUR/USD pair were very limited at the start of the trading session as the rise in coronavirus cases in Europe urged the countries to get ready to extend lockdowns to control the spread of the virus. Not in Europe, but all countries across the world, including UK, Canada, India, the USA, Japan, and Mexico also have seen a rise in the number of infection cases that has prompted the need for safe-haven and resulted in the consolidative movement of EUR/USD pair on Monday.
The risk perceived EUR/USD pair faced pressure while moving upward as the risk sentiment in the market deteriorated after the rising number of coronavirus cases throughout the globe. However, the currency pair EUR/USD remained on the plus side as the European countries have started immunizing people against coronavirus in earnest, but huge discrepancies in vaccination pace exist.
Meanwhile, the U.S. dollar was also weak ahead of Tuesday’s Georgia runoff elections that will decide the control of the U.S. Senate and also the fate of President-elect Joe Biden’s legislative agenda. Whereas, Senate ended the demand for an increase in direct payments from $600 to $2000 by Donald Trump and supported by Democrats as Republicans did not approve it and weighed on the U.S. dollar that ultimately kept the EUR/USD pair higher.
Daily Technical Levels
Support Resistance
1.2179 1.2279
1.2144 1.2344
1.2078 1.2379
Pivot Point: 1.2244
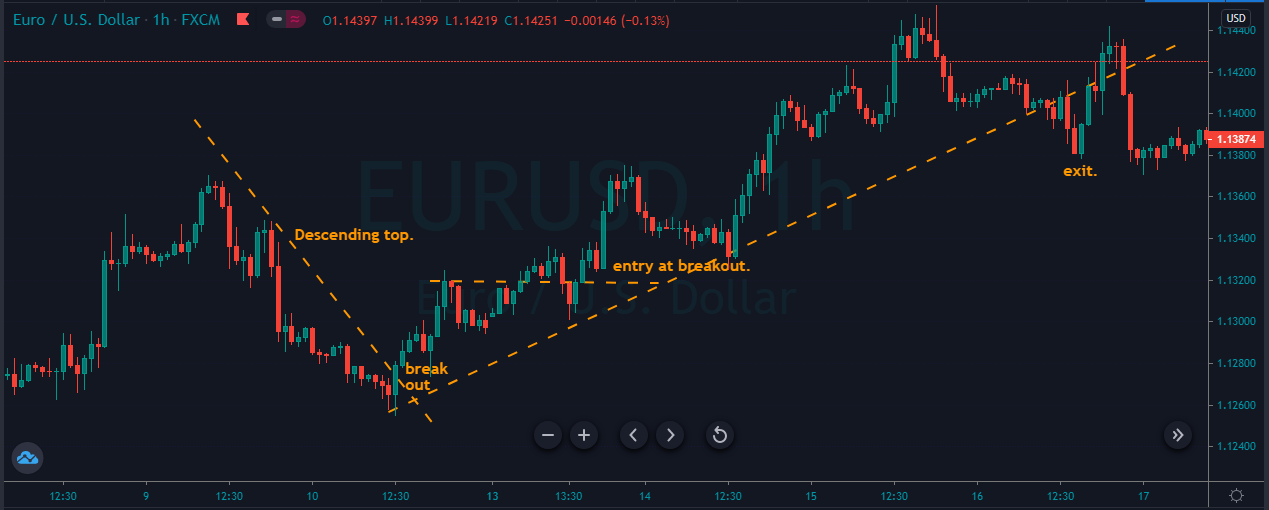
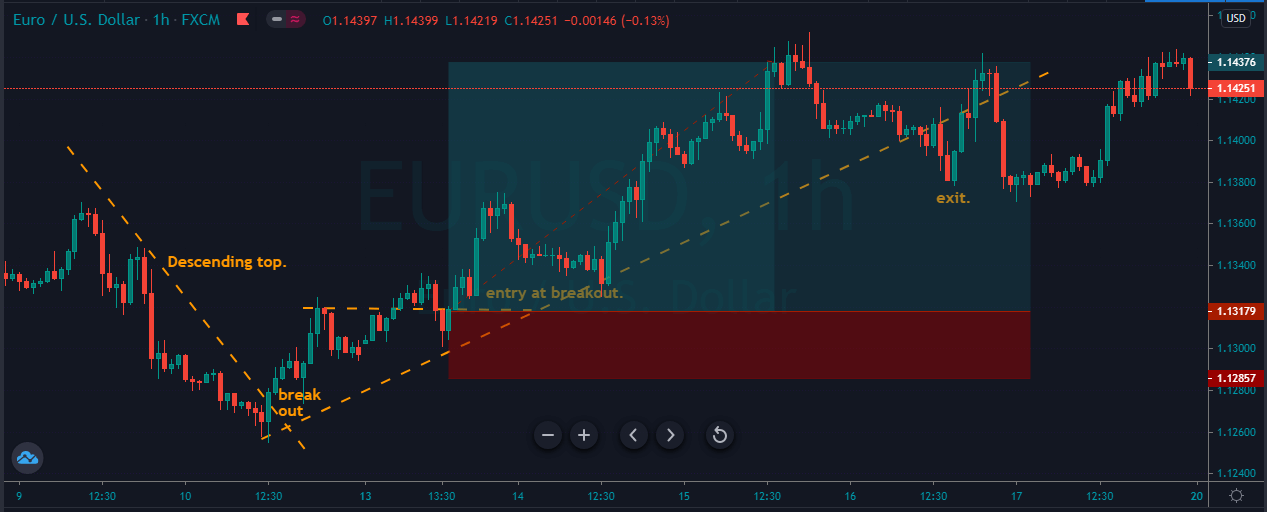
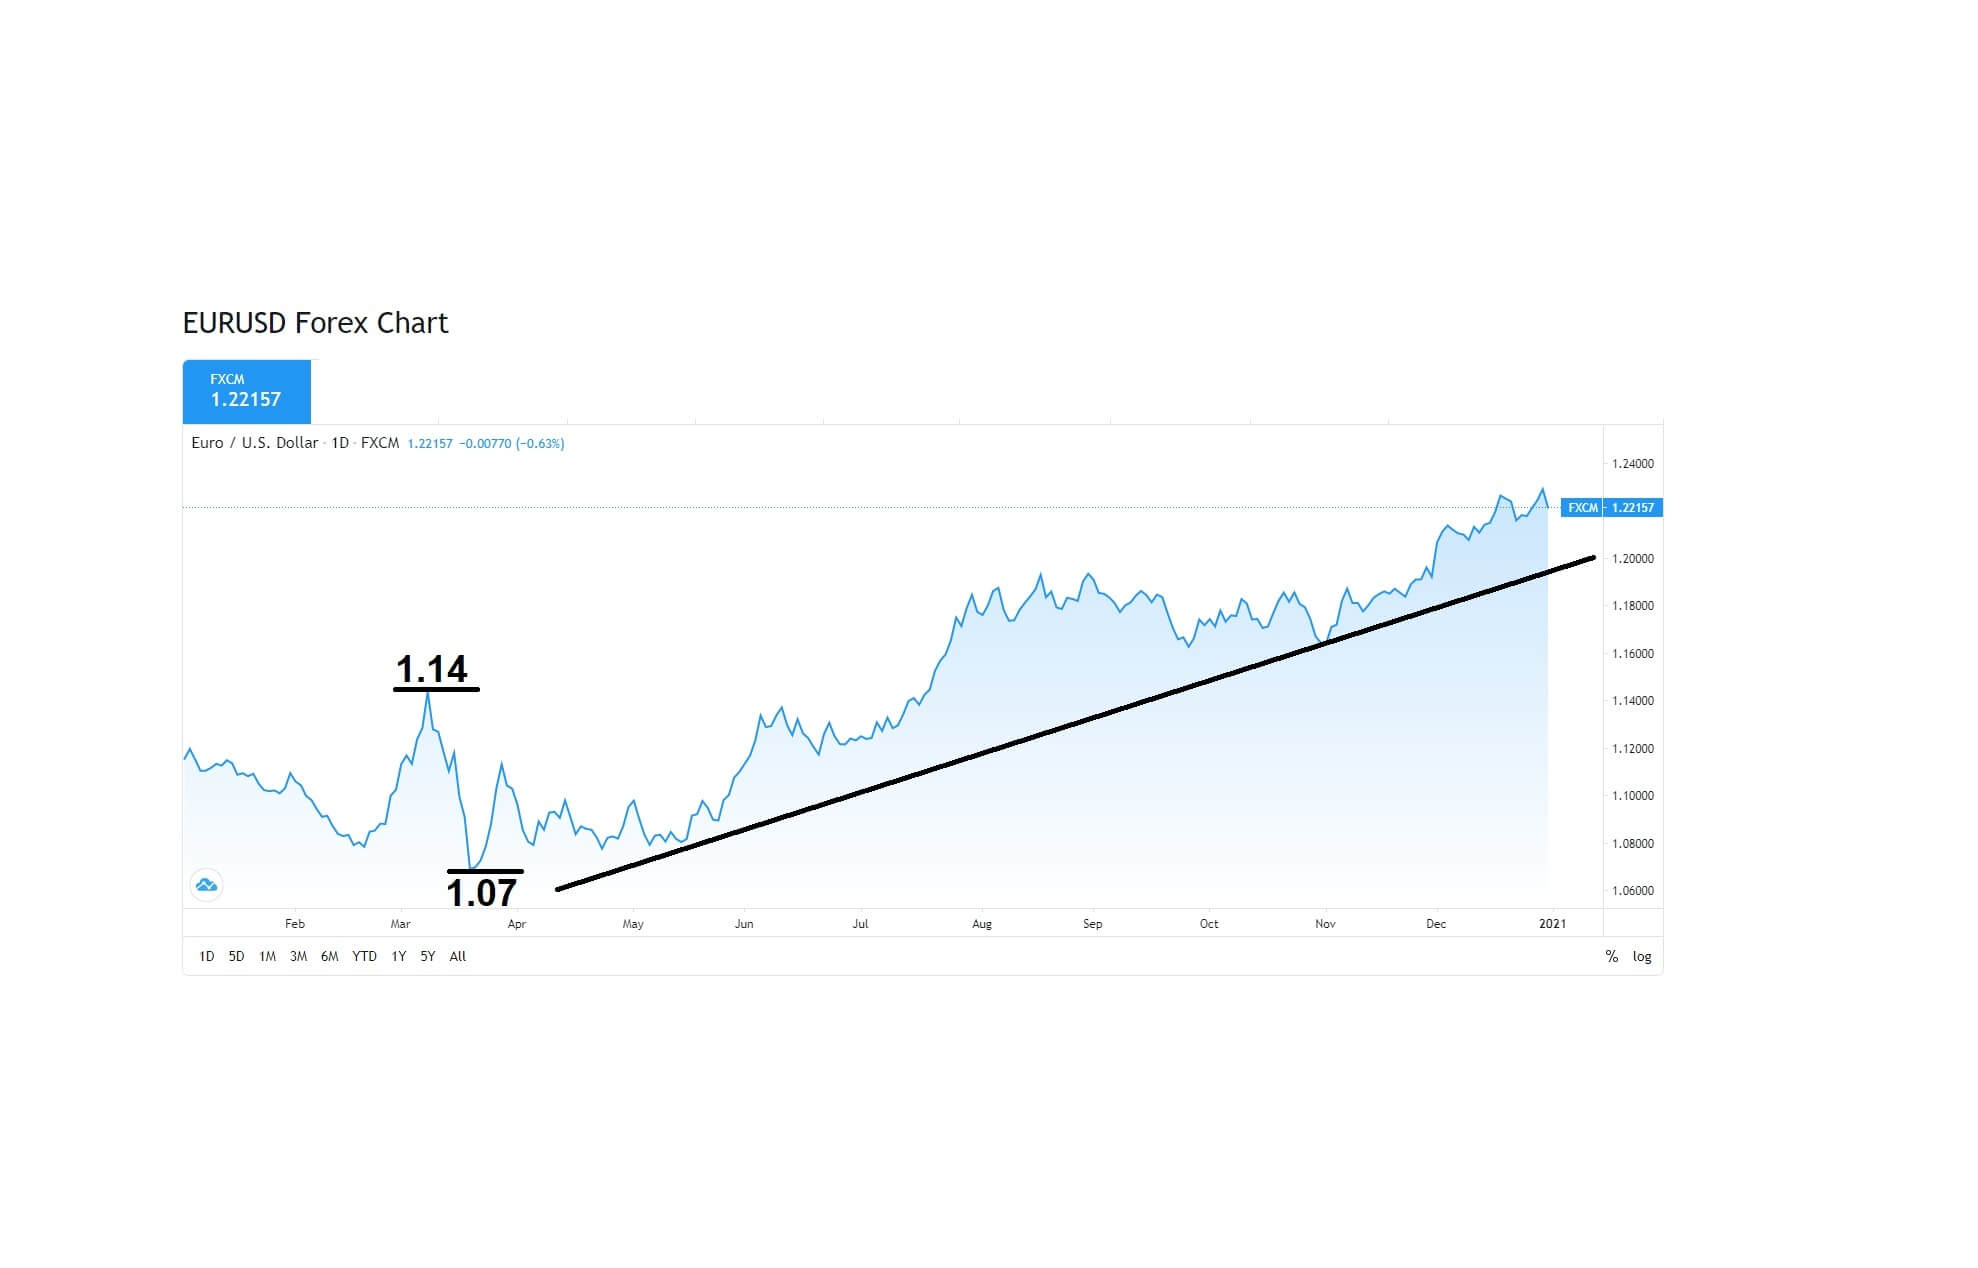
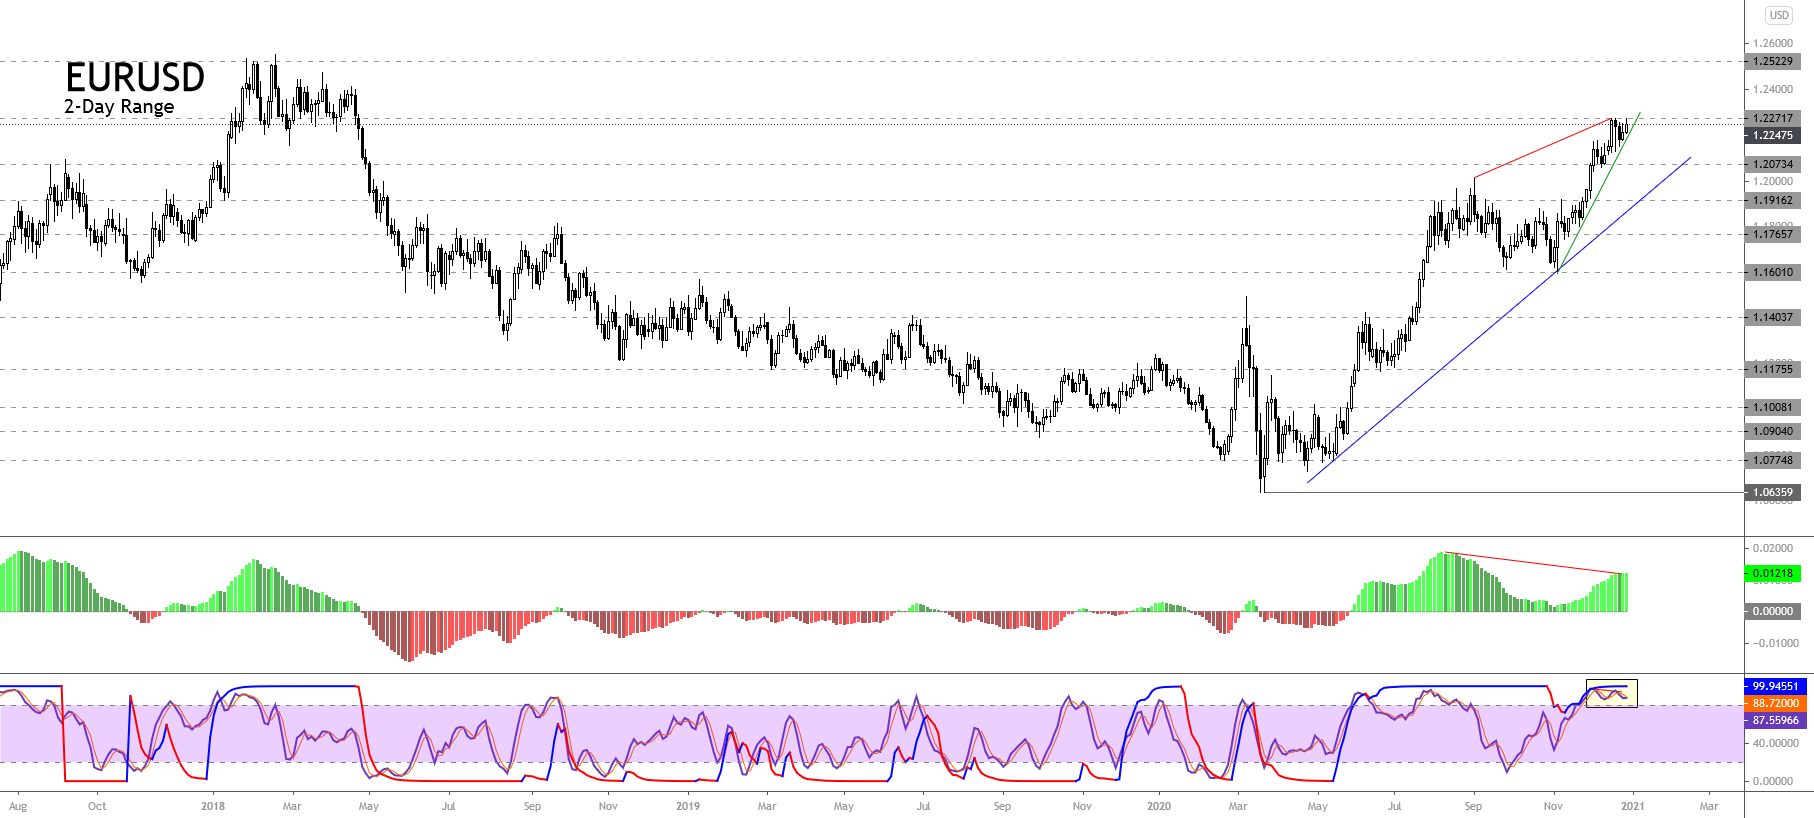
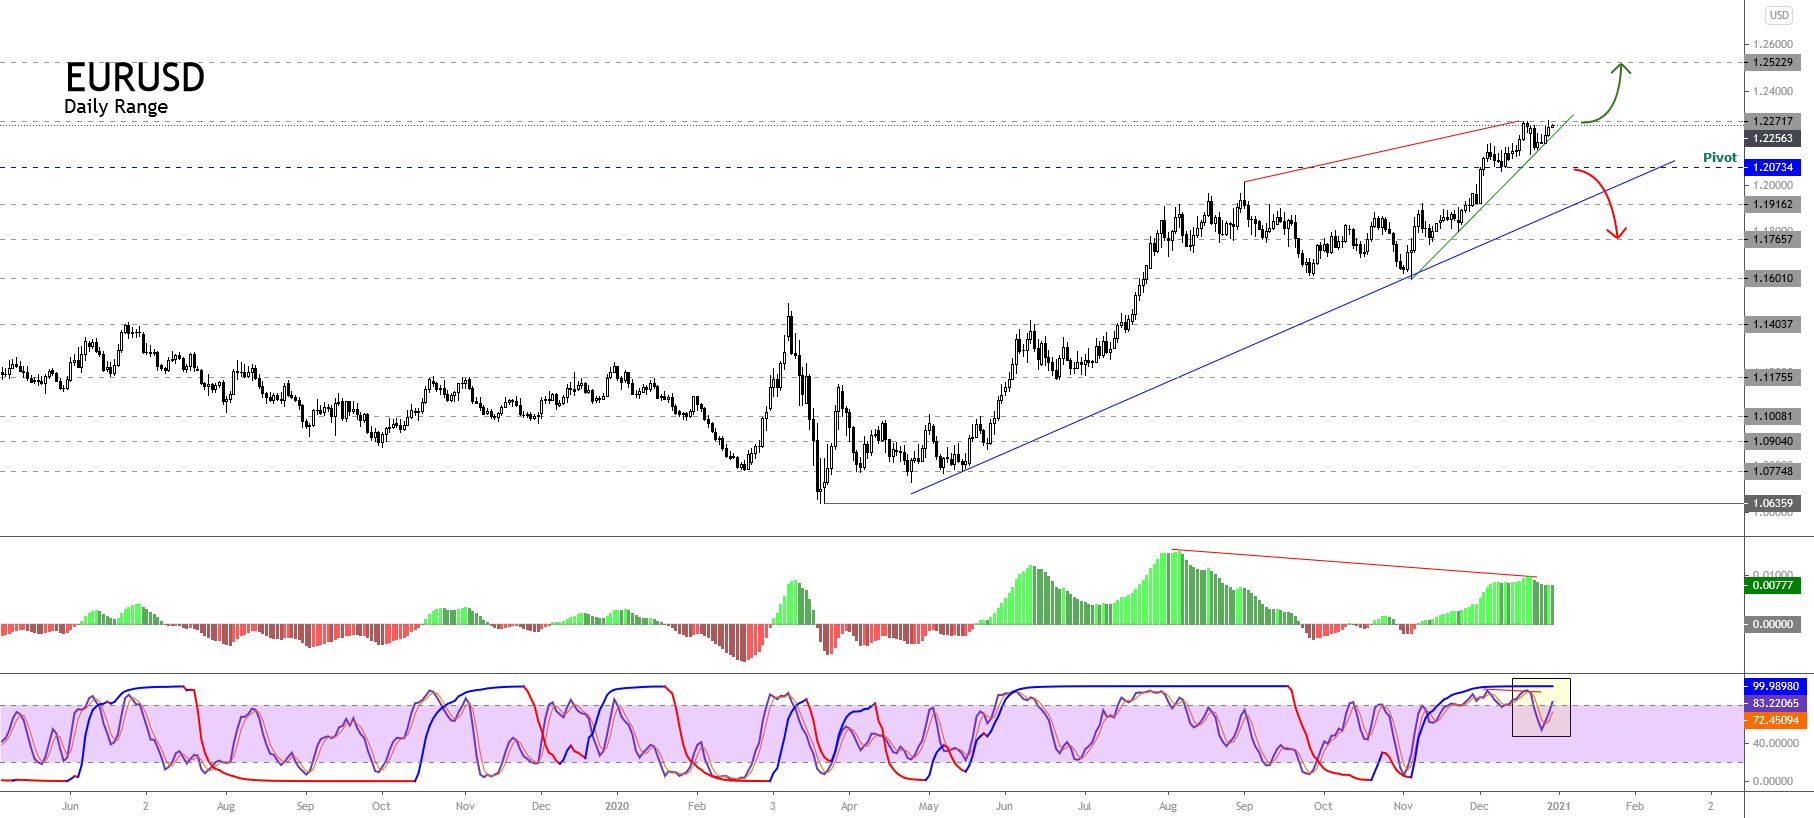
EUR/USD– Trading Tip
The EUR/USD is trading with a bearish bias today at the 1.2248 level, having violated the upward trendline at the 1.2252 level. Closing of candles below this trendline confirms a breakout, and there’s a strong odd of selling trend’s continuation until 1.2203. The next support may be found around the 1.2175 level below this, along with resistance at 1.2258 and 1.2313. The 50 periods EMA is likely to extend resistance at the 1.2262 level, and supporting selling trend in the EUR/USD today!
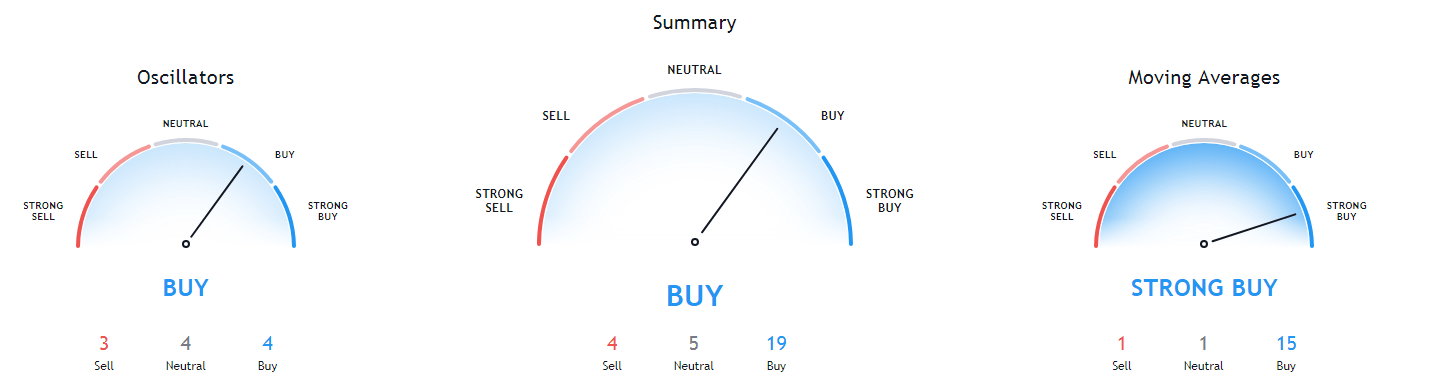
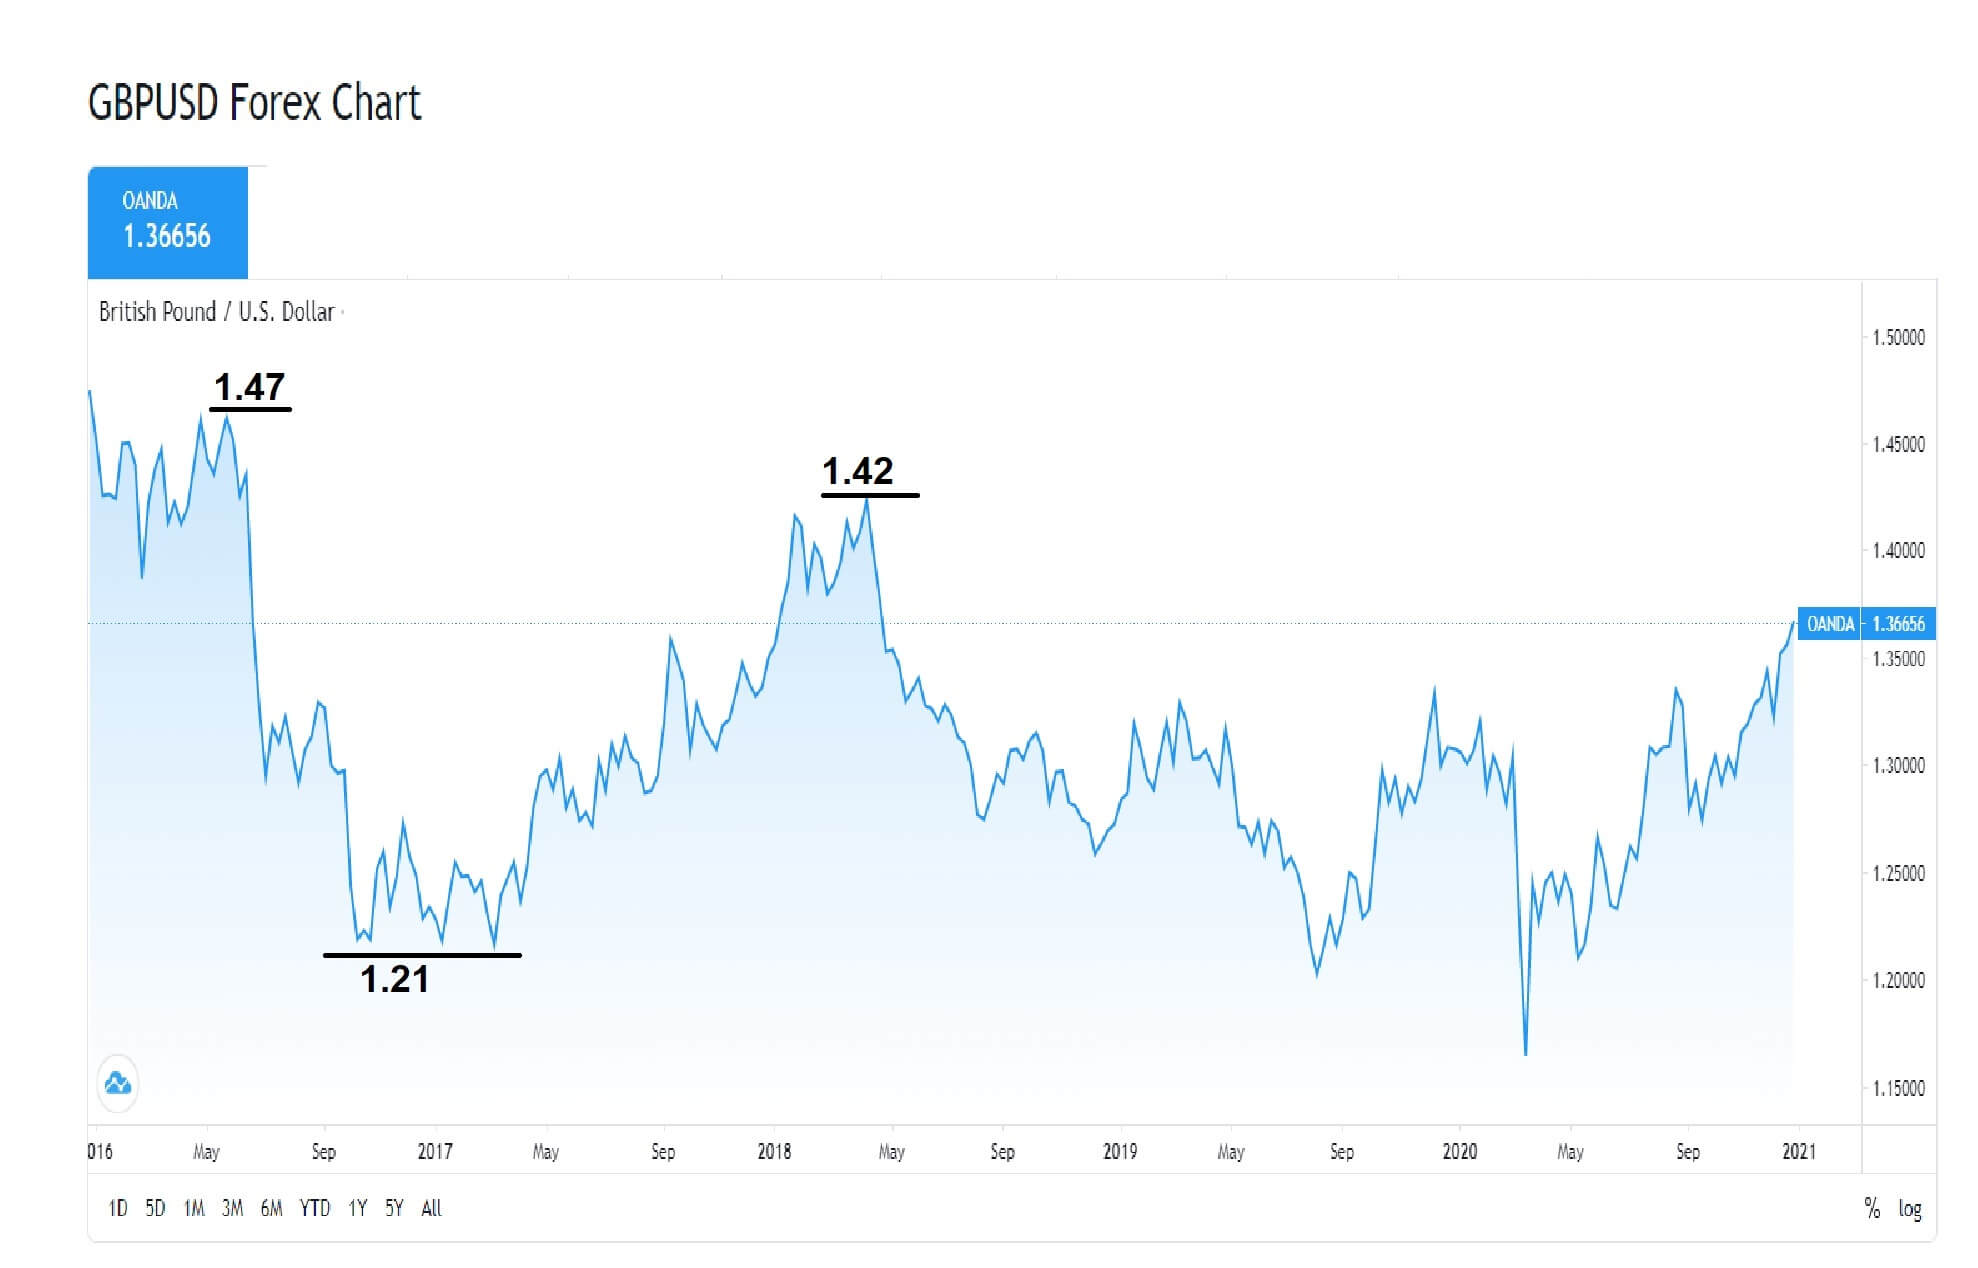
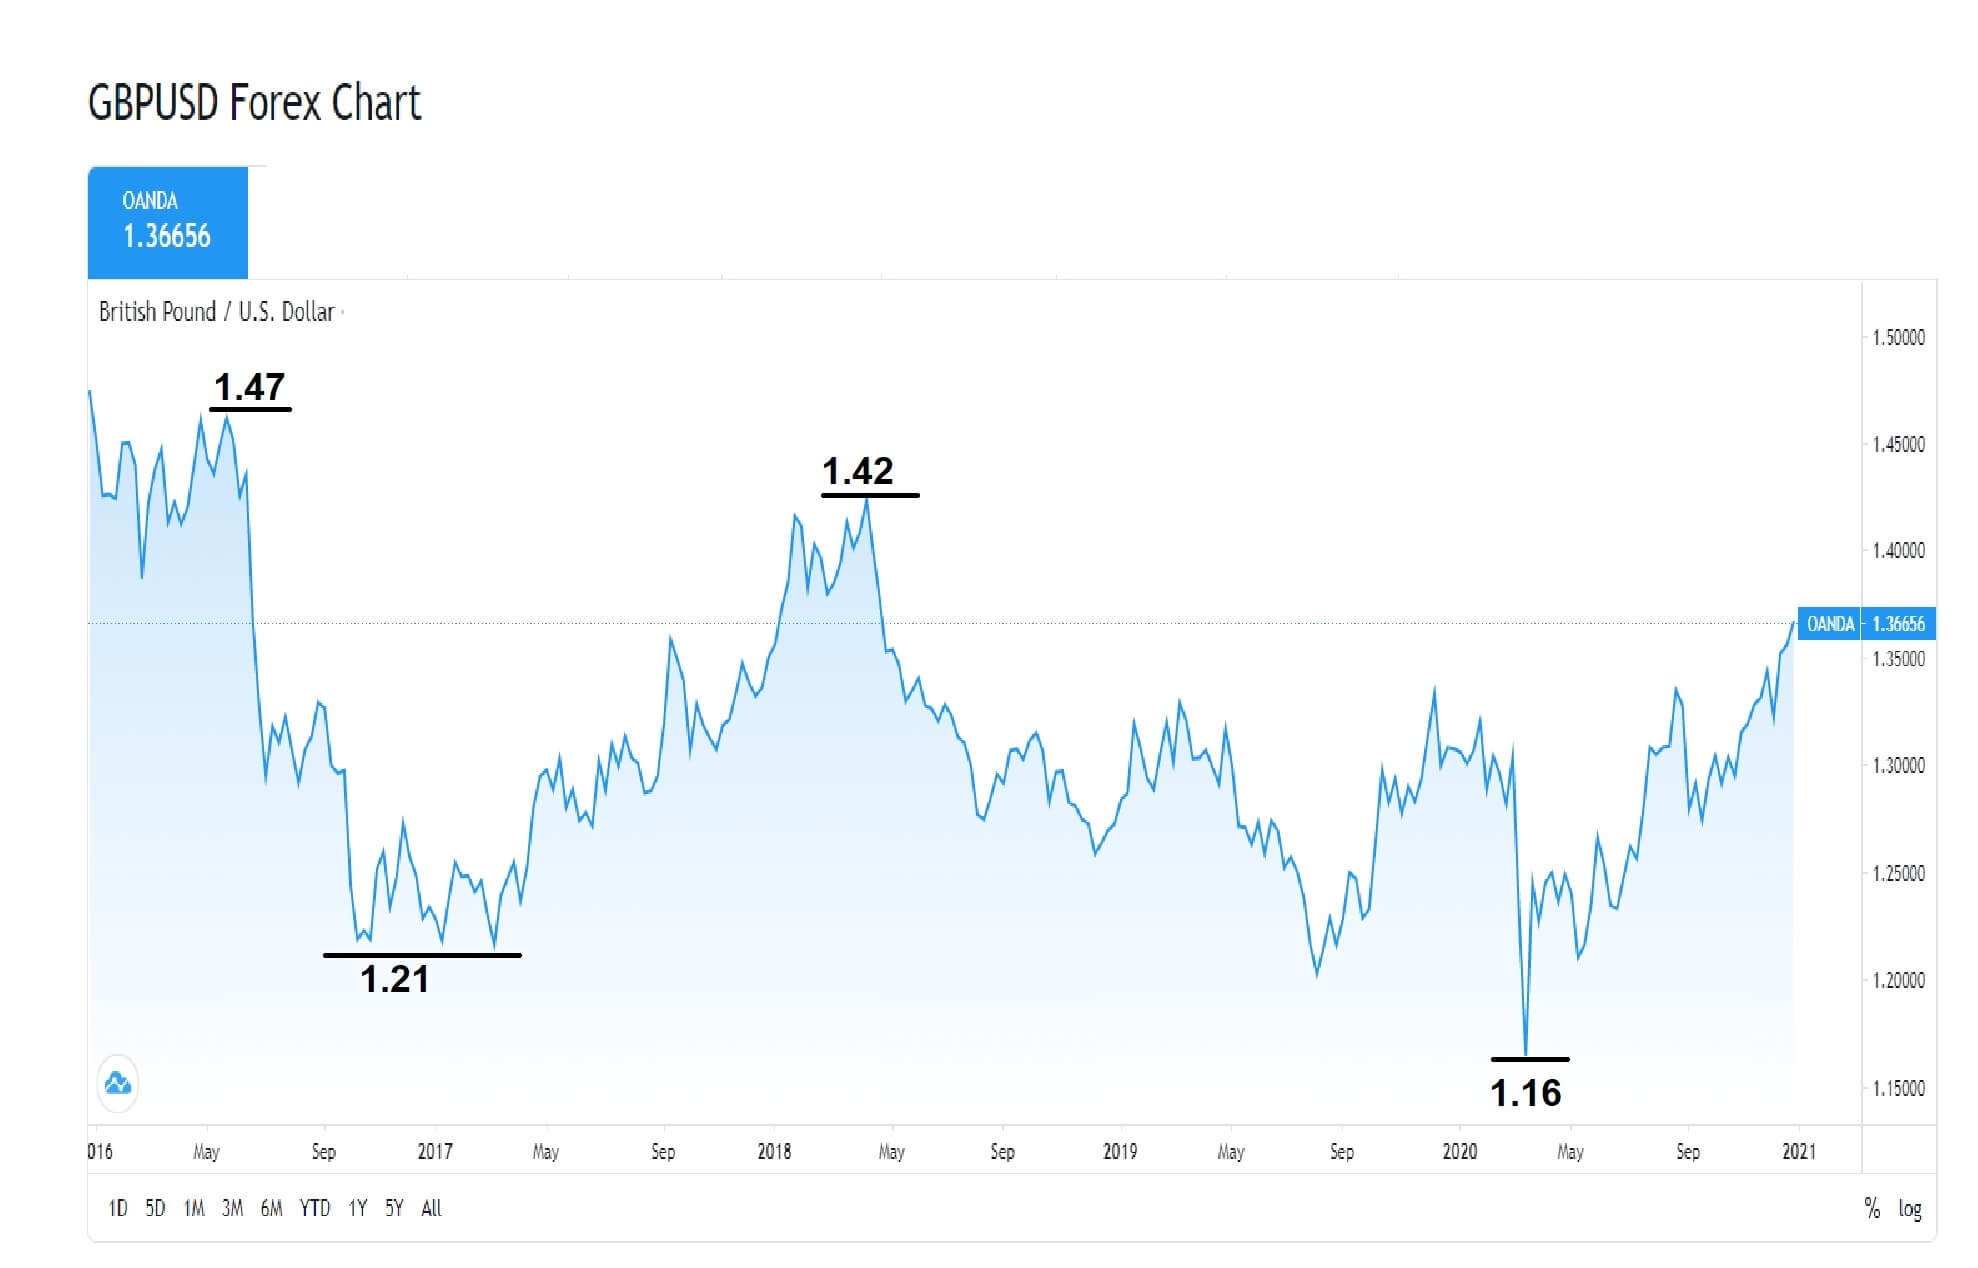
GBP/USD – Daily Analysis
On January 04, the currency pair was opened at 1.36471, and it has placed a high of 1.36982 and a low of 1.36436 so far. The pair is currently moving at 136884 and is rising to place gains for the 4th consecutive session on Monday. The U.K. was enjoying its first trading session as an independent nation on Monday as the transition period for Brexit ended on Thursday when the United Kingdom finally ended its ties with the European Union, almost a year after its formal departure from the 27-nation bloc.
After four and a half years, when the majority in the U.K. voted to leave the European Union, the end of the transition period was a significant moment in the history of the U.K. Great Britain will now forge a separate path after almost five decades as part of the bloc.
According to PM Boris Johnson, Britain will be an open, generous, outward-looking, internationalist, and free-trading country free to do things differently and, if necessary better than the E.U. On Sunday, the PM Boris Johnson said that he intended to carry on as a prime minister after Brexit.
Although the British Pound will see a selling pressure given the impact of Brexit sooner or later, the investors were favoring the currency in the beginning hours of the trading session ahead of the macroeconomic data or any major news as after a long fight between the E.U. & U.K.; the country has departure from the E.U. with a deal beneficial for both sides successfully.
At 14:30 GMT, the Final Manufacturing PMI for December is expected to remain flat at 57.3. The Mortgage Approvals from Britain in November are expected to decline to 82K from October’s 98K and weigh on British Pound that could drag the pair GBP/USD lower. The Net Lending to Individuals for November is also expected to decline to 3.0B from October’s 3.7B and weigh on British Pound and limit the GBP/USD pair’s upward trend. Furthermore, the pair was also supported in the Asian session due to the weakness of the U.S. dollar on Monday. The U.S. dollar was weak due to the broad market optimism and rallying equities. Some news from the U.S. Congress unveiled that Nancy Pelosi was re-elected as the U.S. House Speaker, which indicated an easy way for further stimulus.
Meanwhile, Georgia’s electoral runoff will also decide the Senate majority’s fate and will be crucial to watch on Tuesday. All these developments kept the greenback under pressure and supported GBP/USD’s rising prices on Monday during the early session.
Apart from Brexit and U.S. headlines, the currency pair came under pressure as the market’s risk sentiment was affected by the increase in the number of coronavirus cases throughout the globe.
The rising number of infections from COVID-19 raised fears that countries might extend the restrictions that would have a negative impact on global economic recovery. These fears kept the risk perceived GBP/USD pair under pressure and kept its gains limited during the Asian session on Monday.
Daily Technical Levels
Support Resistance
1.3623 1.3705
1.3573 1.3737
1.3540 1.3788
Pivot Point: 1.3655
GBP/USD– Trading Tip
The GBP/USD pair has also violated the resistance level of 1.3617 level, and on the higher side, the next target remains at the 1.3698 level. On the lower side, the GBP/USD pair may find support at the 1.3617 level for now. We can expect a continuation of an upward trend in the Sterling today. The 50 periods EMA is supporting bullish bias at the 1.3600 level, and at the same time, the upward channel is also likely to keep Sterling bullish on Monday. Let’s consider taking buying trades over 1.3609 and selling below the 1.3698 level today.
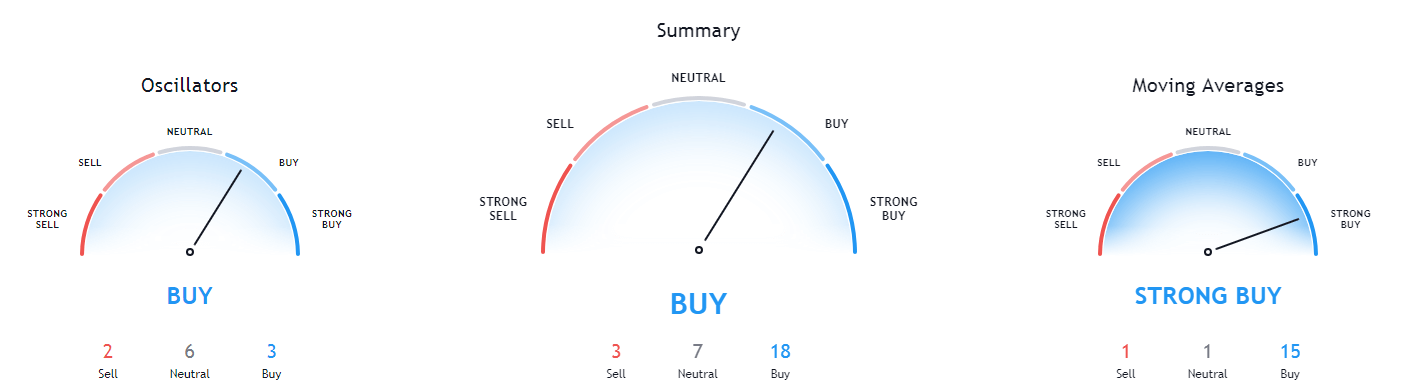
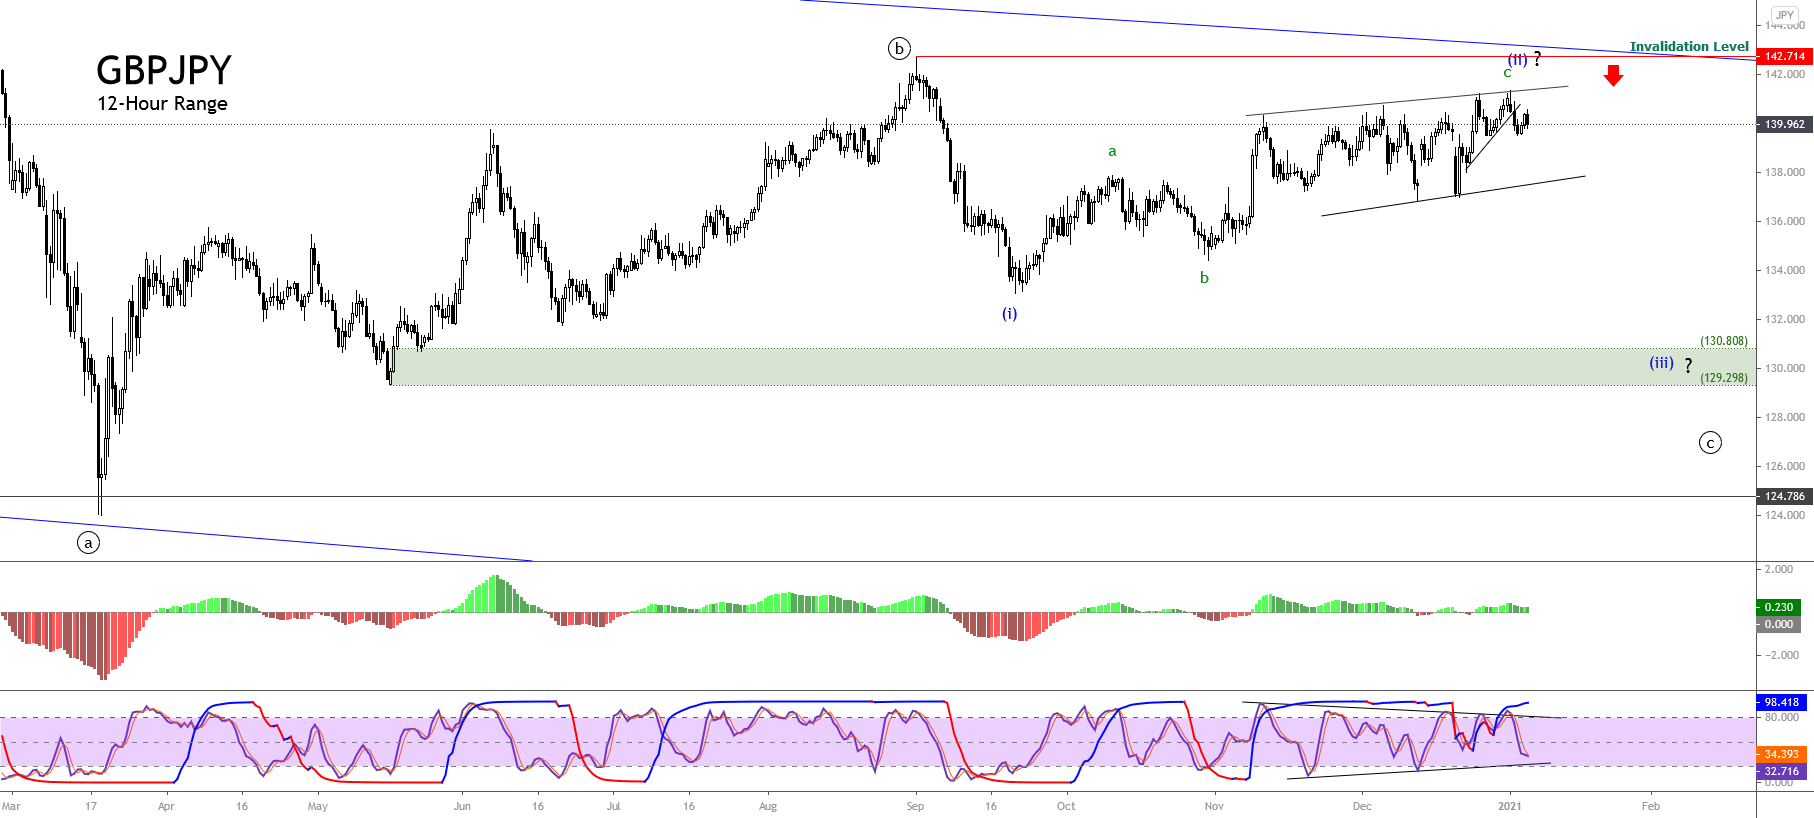
USD/JPY – Daily Analysis
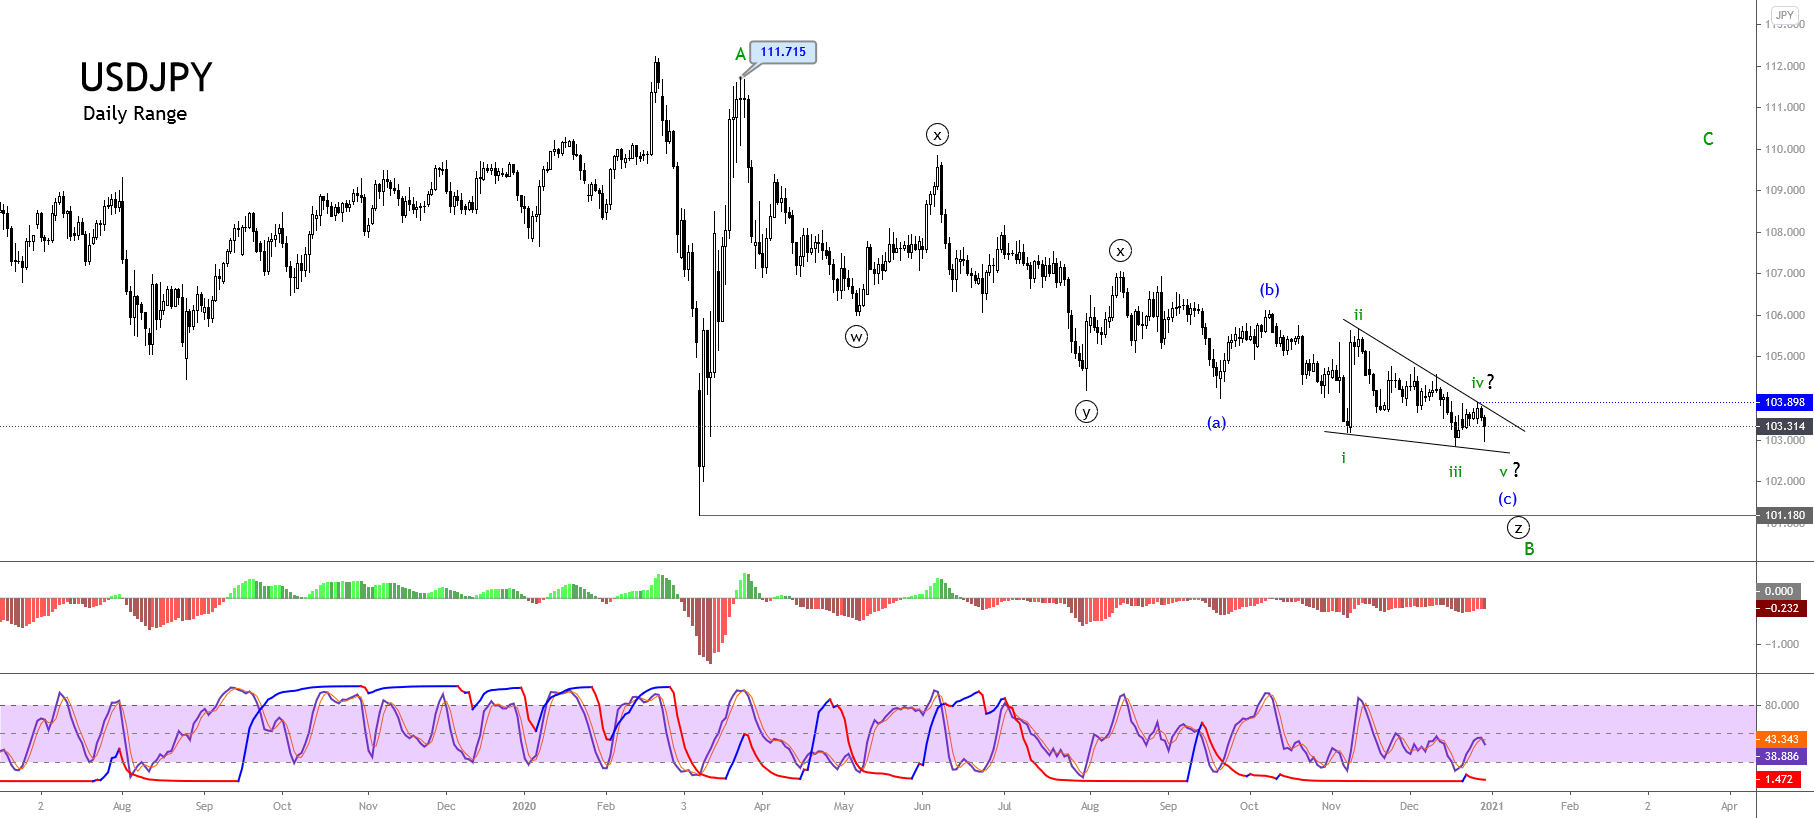
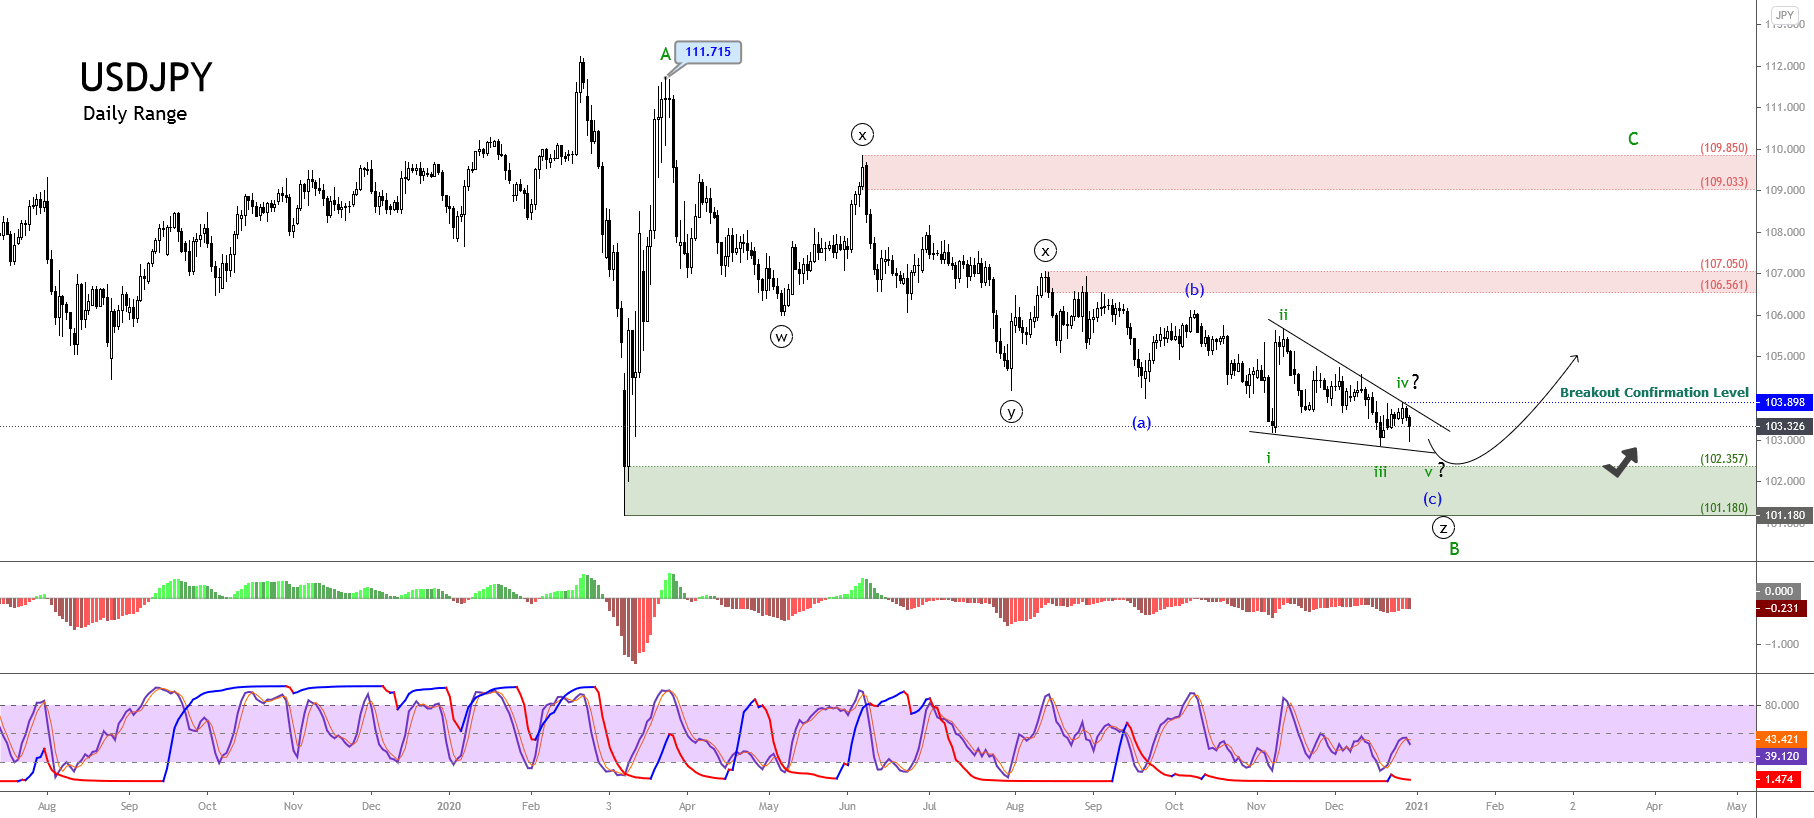
On January 04, the USD/JPY opened at 103.096, and it has placed a high of 103.314 and a low of 102.932 since then. The pair USD/JPY was currently moving at 103.023 and was placing losses for the day.
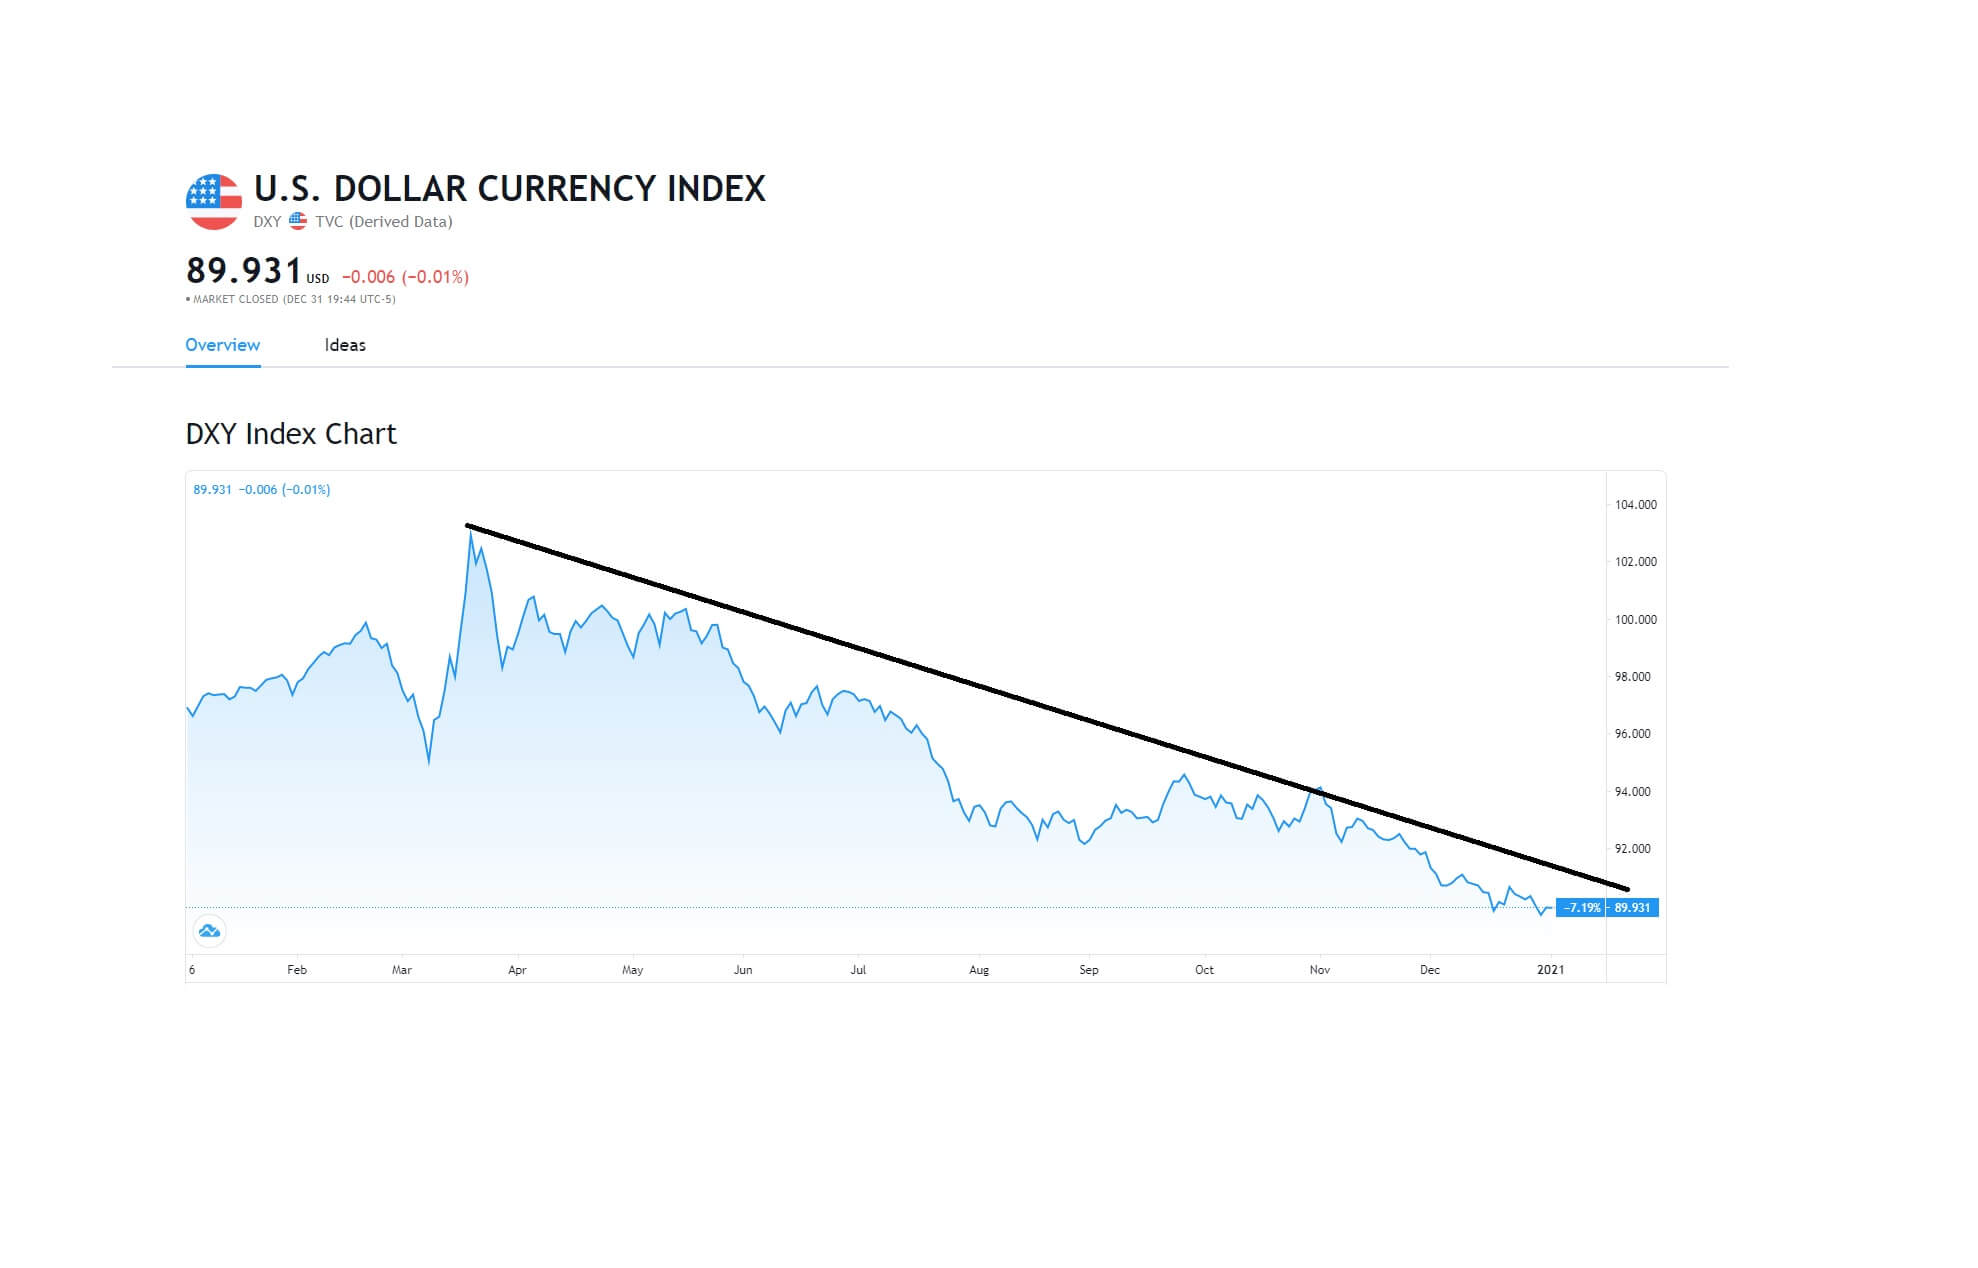
In the Asian trading session, the U.S. dollar was down on Monday, with investors continuing to put pressure on the safe-haven assets on the first trading day of 2021. The rising expectations that the U.S. interest rates will remain low and hopes for an eventual global economic recovery from coronavirus will likely continue to slow the dollar down against other major currencies.
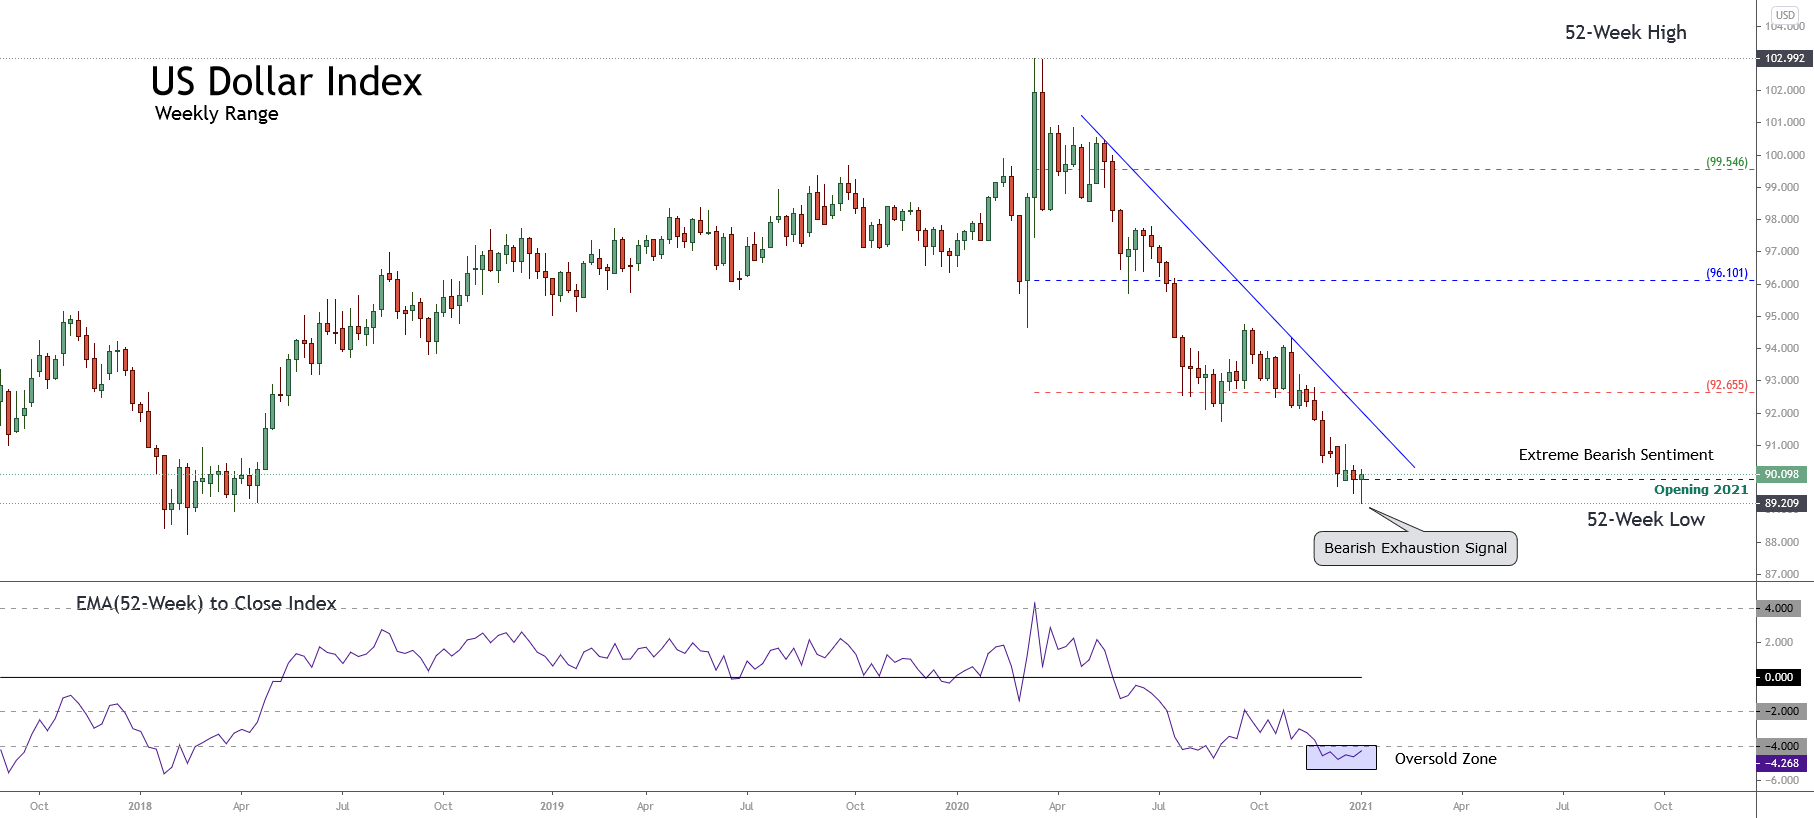
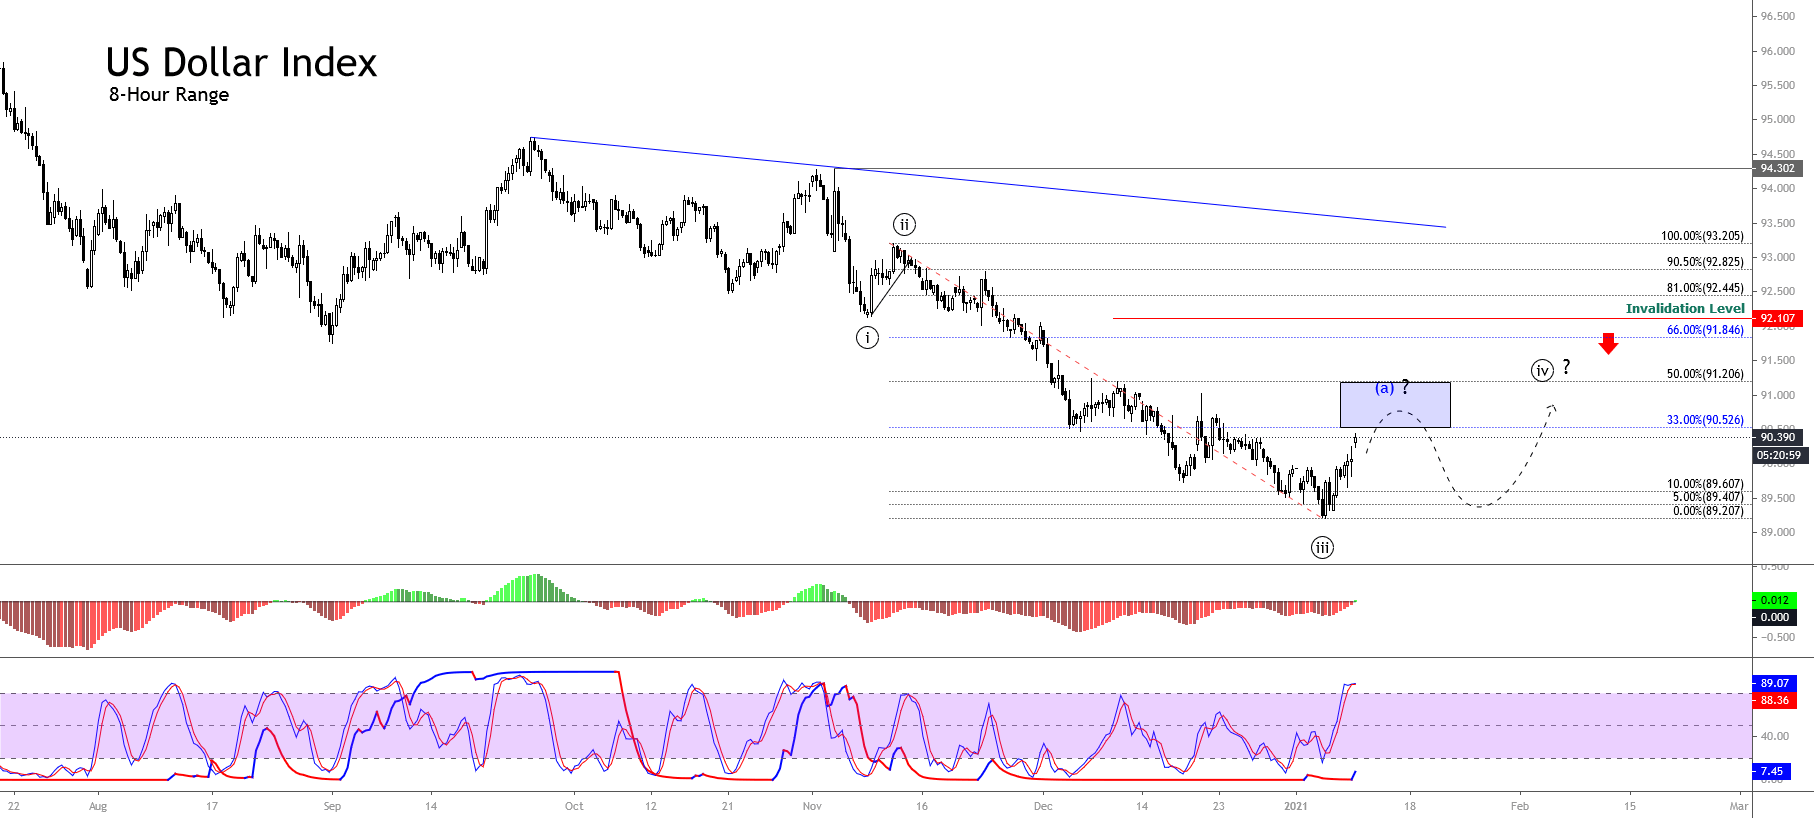
The U.S. Dollar Index that measures the value of the U.S. dollar against the basket of six major currencies was down by 0.25% to 89.67 on the day to slightly below the level it ended 2020 at 89.766. The U.S. dollar weakness added to the downward momentum of the USD/JPY pair on Monday.
The Federal Reserve is due to release the minutes from its December meeting on Wednesday. Investors will be looking for more detail on the discussions about making their forward policy guidance more explicit and the chance of a further increase in asset buying in 2021. Meanwhile, the USD/JPY pair was also down in early trading hours on Monday as the rising number of coronavirus cases throughout the world raised the safe-haven appeal in the market.
On Sunday, Prime Minister Boris Johnson warned that severe lockdown restrictions would be installed in England to fight against the new variant of coronavirus that has pushed the infection rates to their highest record levels. Whereas, School unions have raised called for the closure of all schools for a couple of weeks as the virus was spreading faster, but Johnson said to parents that they should send children to school as the threats to young kids from the deadly virus were very small.
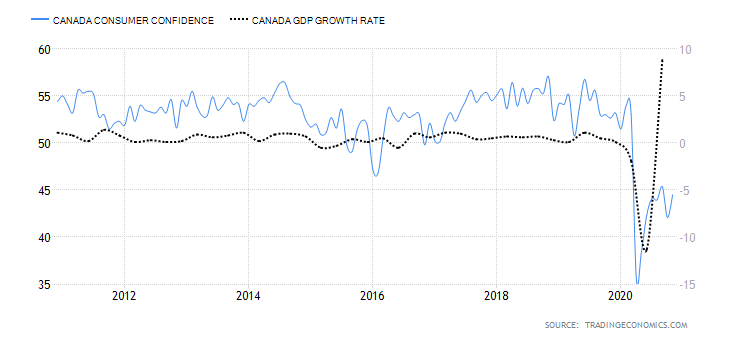
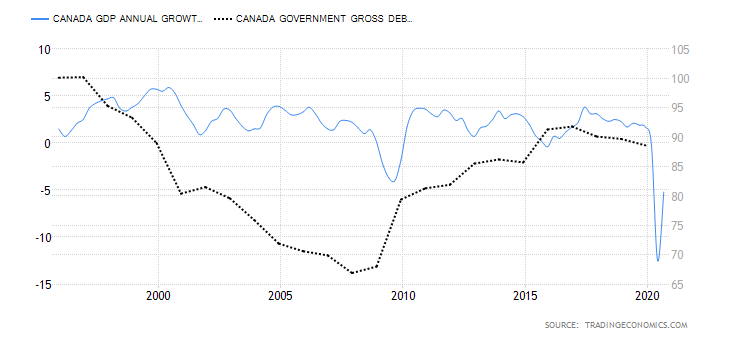
Meanwhile, on Saturday, Canada reported an estimated 4800 more cases of the deadly coronavirus that added to the country’s total caseload and made it 586,425. Canada said that the rise in the number of coronaviruses was seen after the holiday season. In India, 16,660 fresh cases were reported in a single day that sent the total number of infections to 10,341,291.
Americans have been reported to flee to Mexico to avoid the lockdown restrictions back at home. According to Times, about half a million Americans traveled to Mexico in November, whereas Mexico has reported an increase in the number of coronavirus cases in November and December.
The global sum of coronavirus cases reached 85,489,058, out of which 60,443,211 have recovered, and 1,850,202 have died so far. The U.S. cases reached a total of 21,110,917 number and remained the worst-hit county by the world’s coronavirus. Despite the vaccine rollout, the rising number of coronavirus cases throughout the globe added to the fears that countries will enter new lockdown restrictions and affect global economic recovery. These fears raised the market’s safe-haven appeal and supported the safe-haven Japanese Yen that ultimately weighed on the USD/JPY pair.
On the data front, at 05:30 GMT, the Final Manufacturing PMI in December came in as 50.0 against the expected 49.7 and supported the Japanese Yen that added in the losses of the USD/JPY pair on Monday. From the U.S. side, at 19:45 GMT, the Final Manufacturing PMI from the U.S. for December is projected to come as 56.3 against the previous 56.5 and weigh on the U.S. dollar add in the losses of USD/JPY pair. At 20:00 GMT, the Construction Spending for November is estimated to decrease to 1.1% against the previous 1.3% that could weigh on the U.S. dollar and USD/JPY pair as well.
Daily Technical Levels
Support Resistance
103.02 103.34
102.85 103.49
102.70 103.66
Pivot Point: 103.17
USD/JPY – Trading Tips
The USD/JPY is trading sharply bearish at 102.940, gaining support at the 102.940 level. The USD/JPY pair has formed a downward channel on the two-hourly timeframes, which may extend resistance at 103.300 as at the same level 50 periods EMA is also extending resistance. Today, we need to keep an eye on the 102.940 mark as a violation of this may offer us a sell trade until the 102.598 level. The MACD and RSI are suggesting selling bias in USD/JPY today. Good luck!


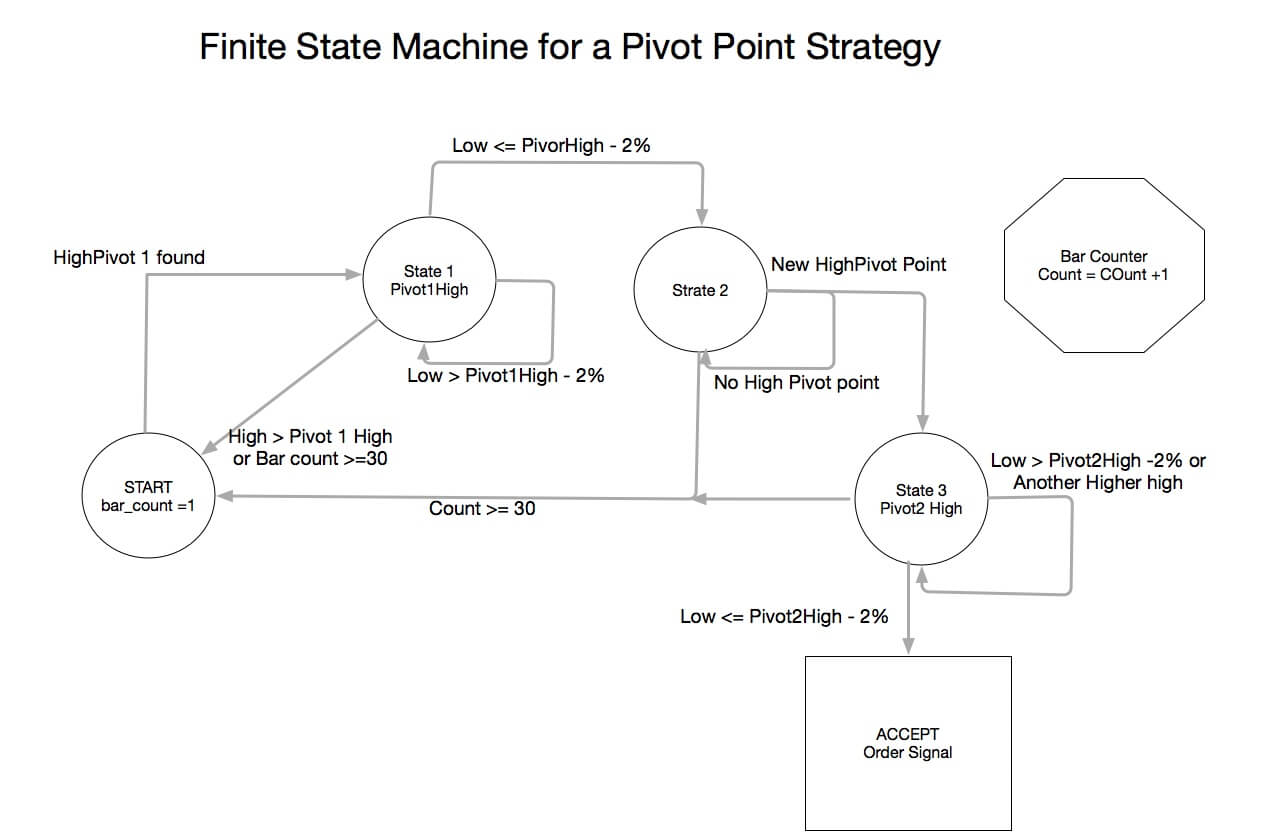
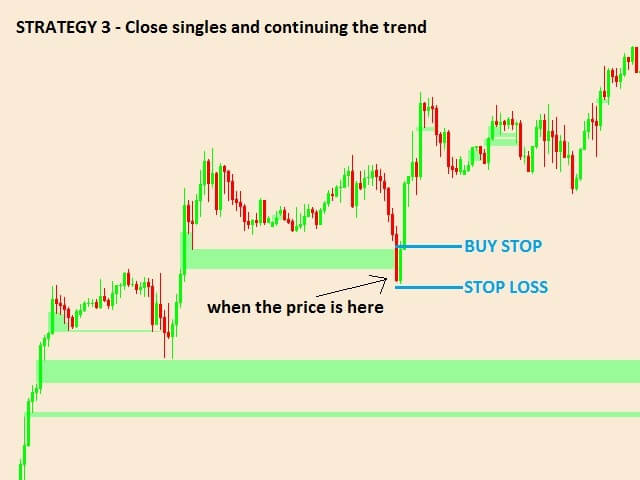
 As said in our previous video, financial markets are unbounded territories where each trader needs to set his own rules; otherwise, they will be influenced by his emotions and fail. A trading system is their set of rules that enable them a long-term success.
 The chosen timeframe should match the availability to trade. A trader with a day job would need to select a daily or a 12-hour timeframe, whereas a full-time trader could use shorter frames, such as 15-min, one, two, or four-hour timeframes.
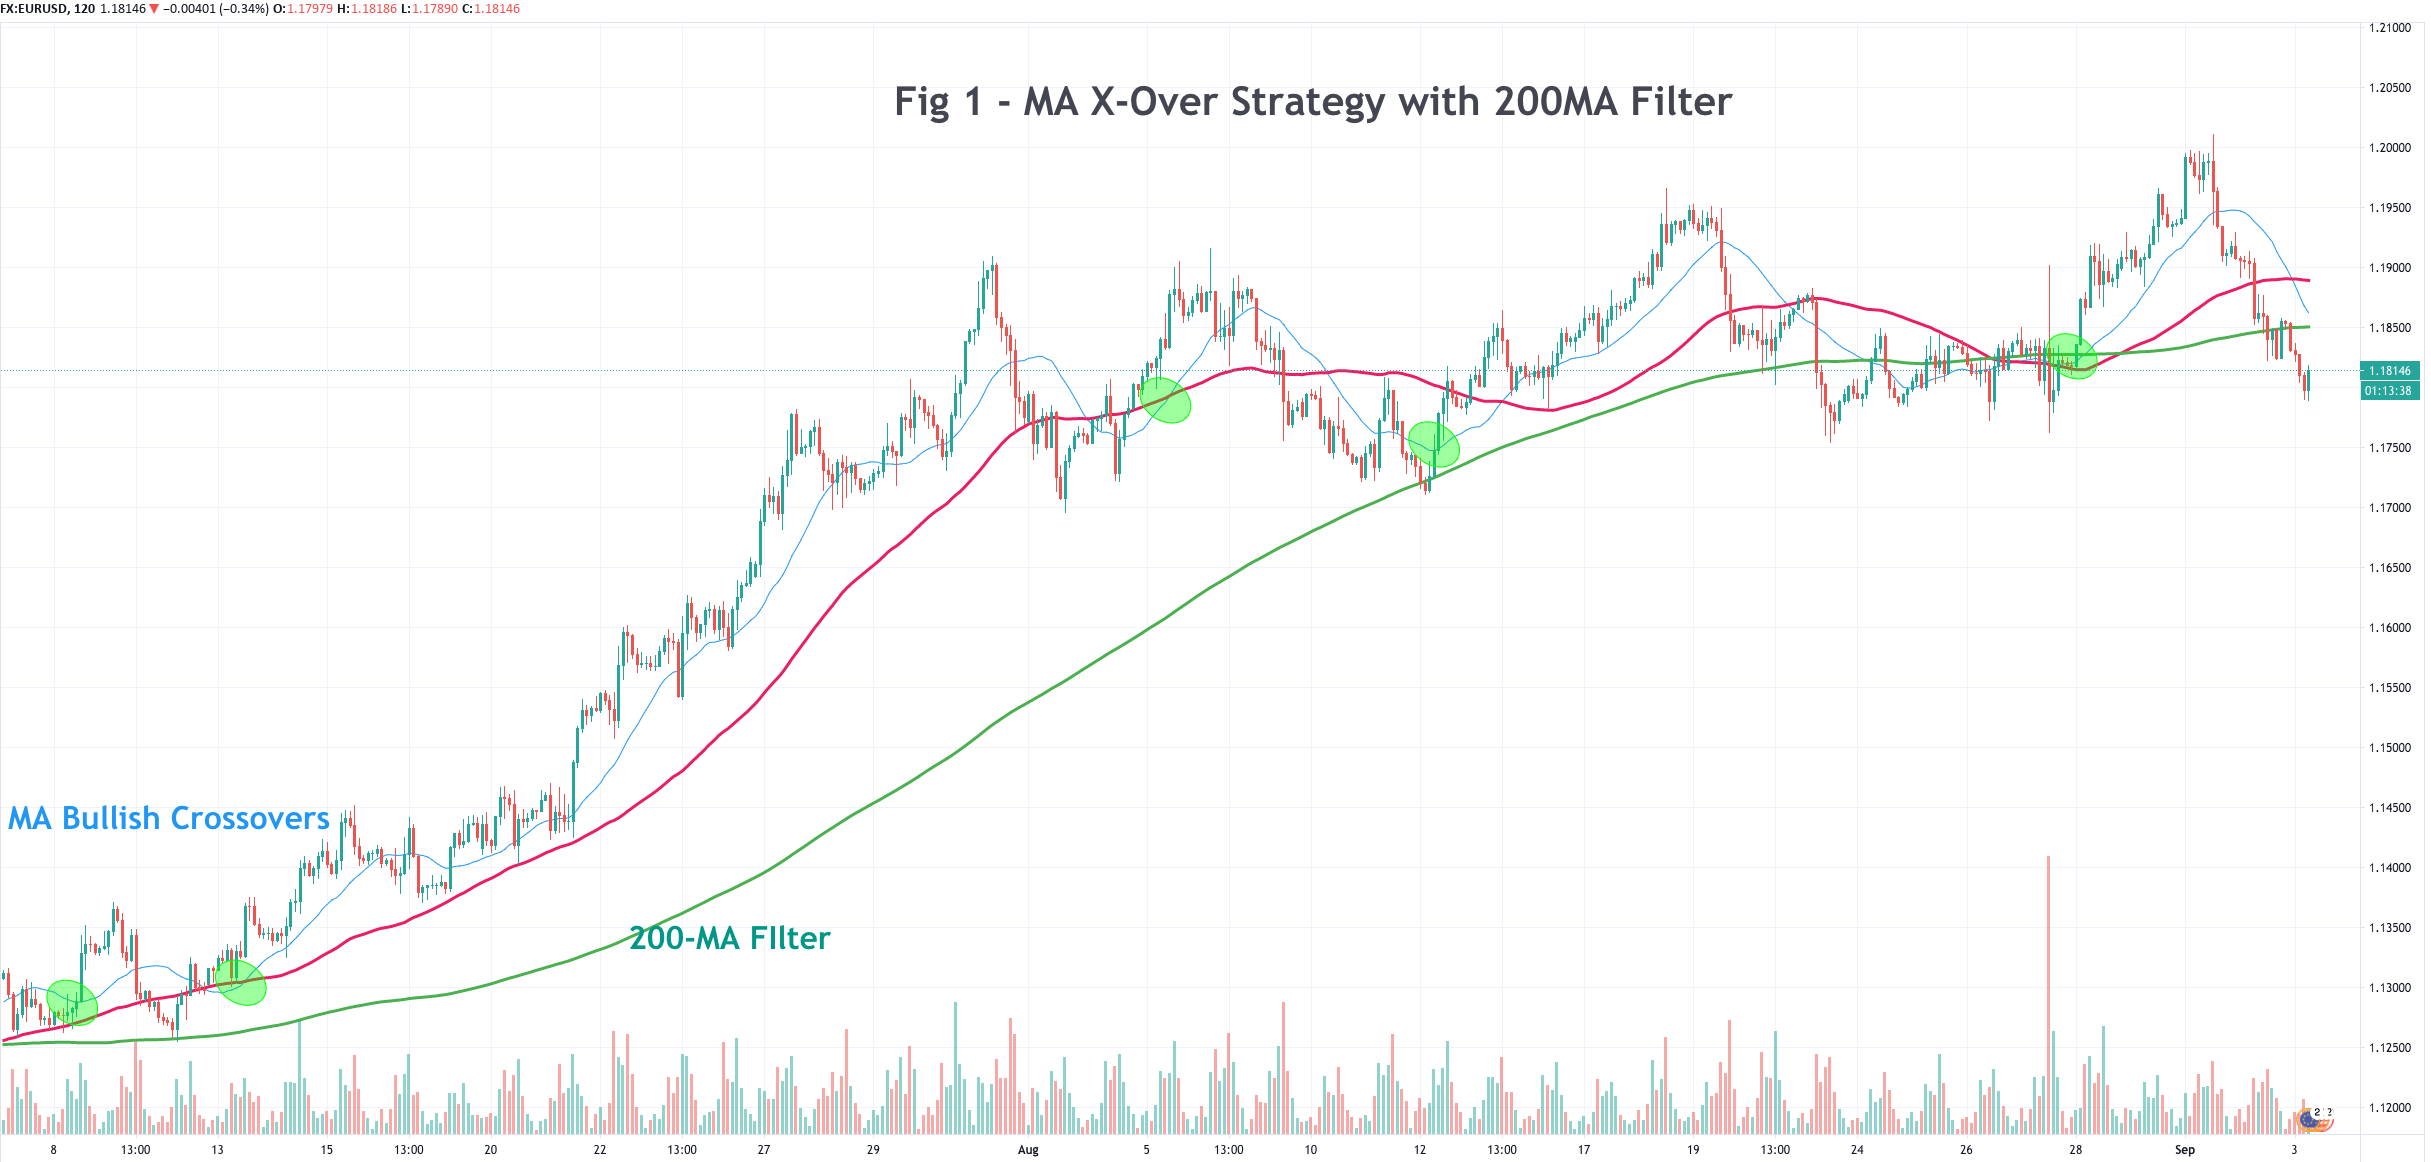
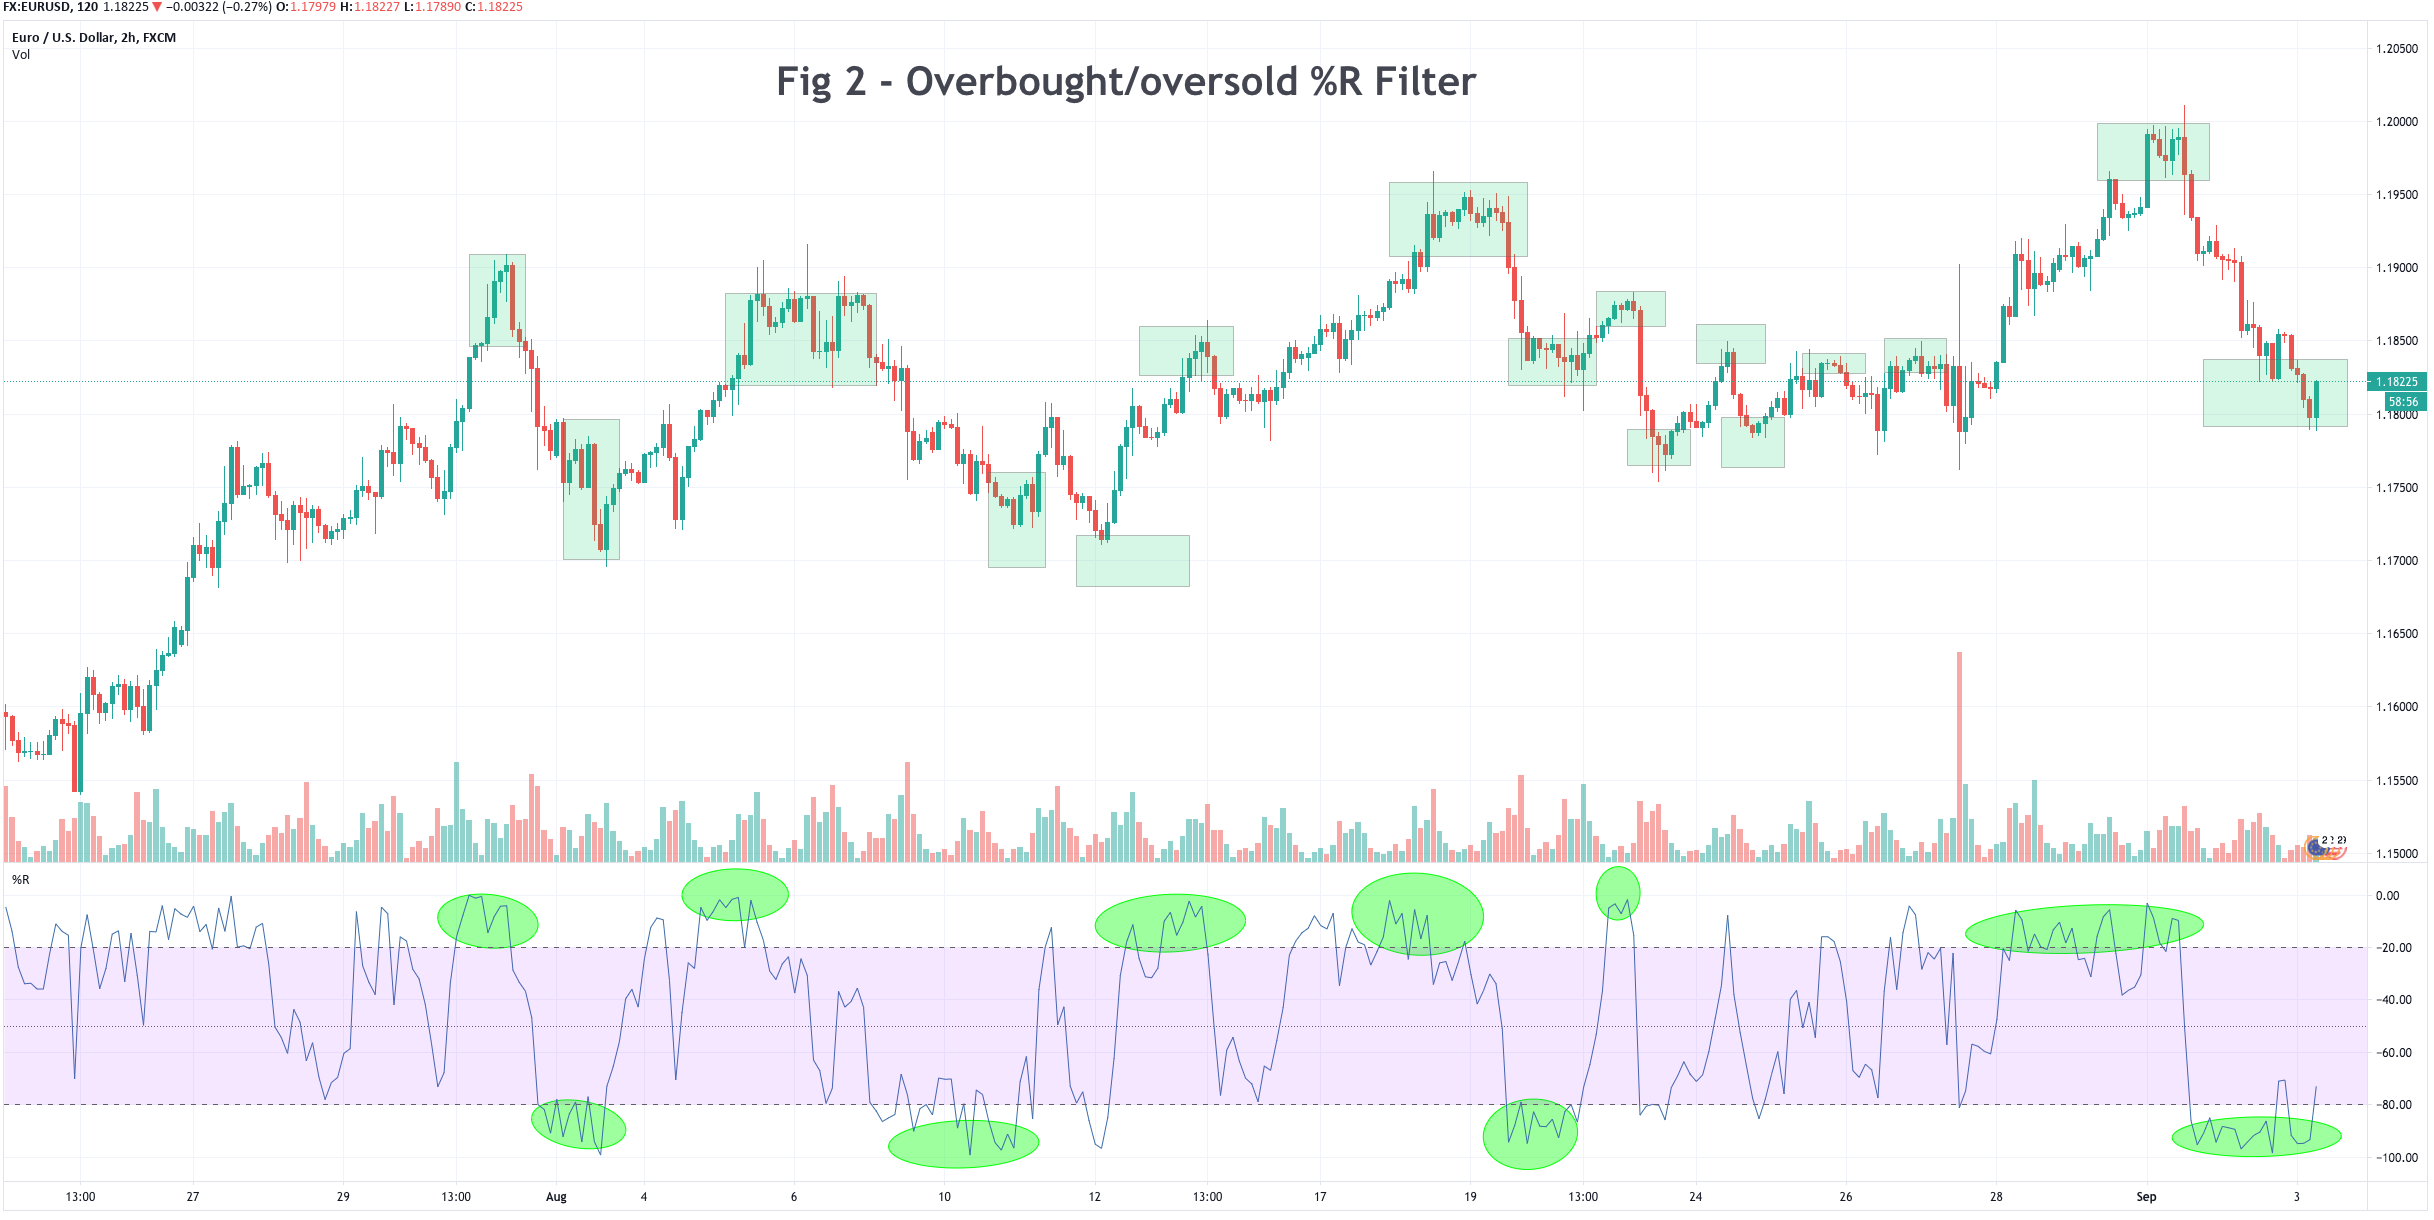
 A permisioning filter is a way to avoid trading under determined circumstances. It can be a filter that allows only trading in the direction of the primary trend or an overbought/oversold sign that should be on for a determined candlestick or pattern formation to be valid.

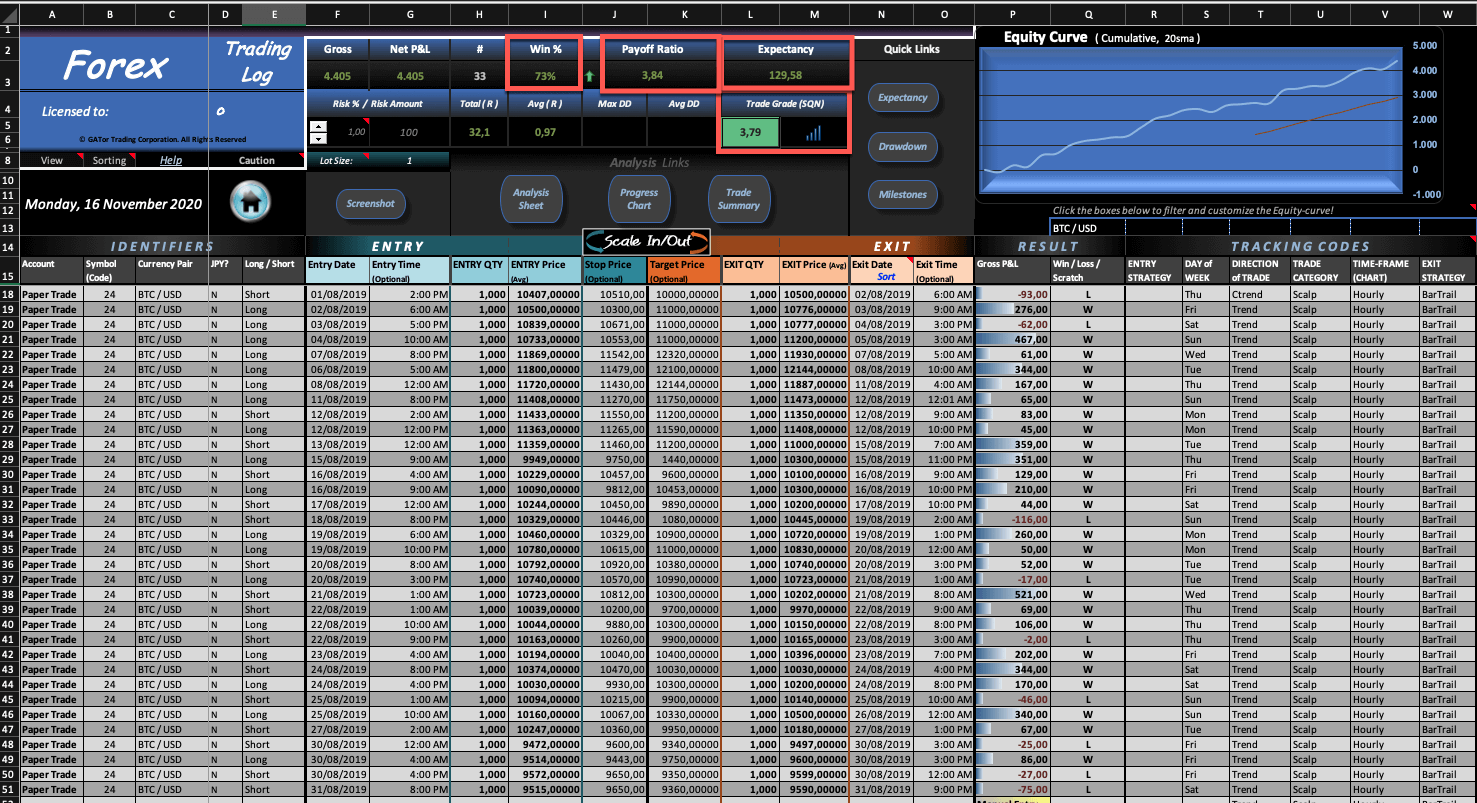
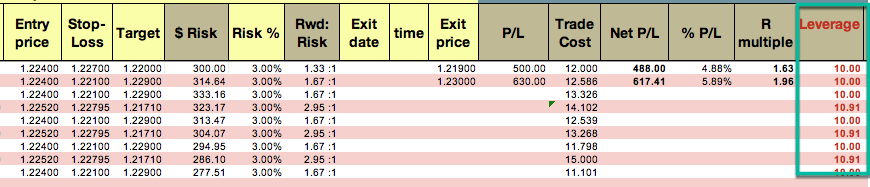
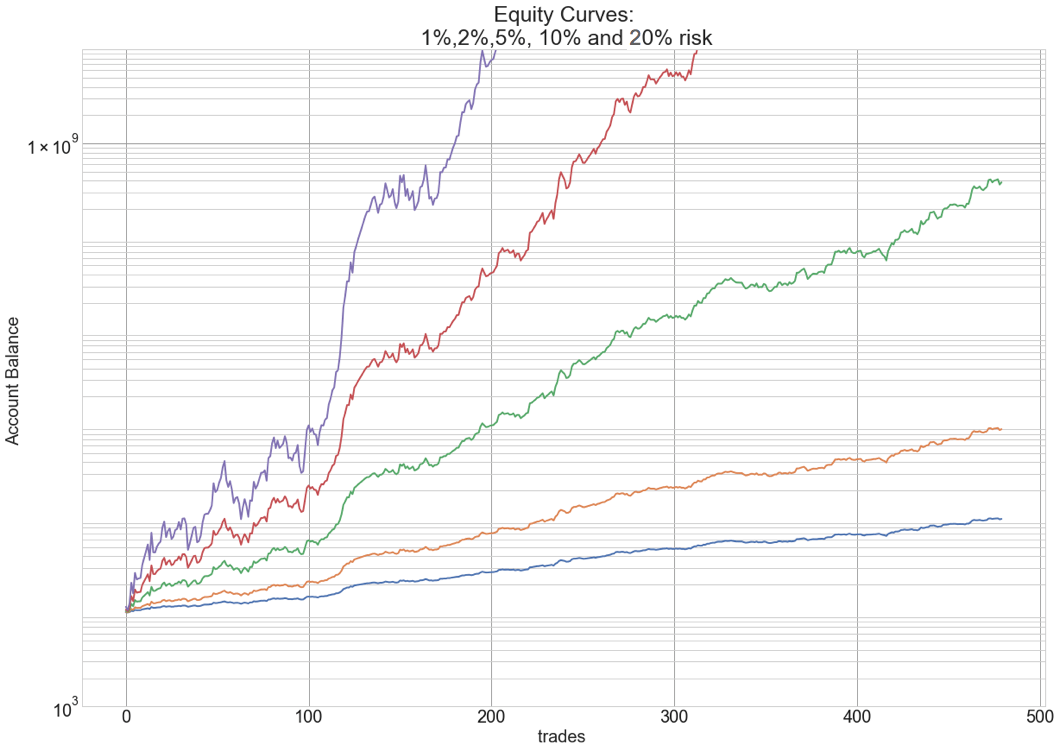
 Position sizing is the part of your plan that tells you how much risk you should take on a trade. We have had a