
How to sell at the top and buy at the bottom
Thank you for joining this Forex Academy educational video.
In this session, we will be looking at one of the oldest adages in trading: sell at the top and buy at the bottom. And how can this be implemented in your trading for maximum results?
20 years ago, financial markets, including foreign exchange, were driven by fundamental analysis over technical analysis. That is to say that professional traders and analysts would base their trading around fundamental economic data, including policy-making decisions, interest rates, GDP, inflation, and political events, including wars. Technical analysis was in its infancy. In these times, it was much easier to predict where the bottoms and tops of assets were likely to be based on fundamental reasons alone.
Today, things have completely flipped to the opposite side. Technical analysis is heavily dependent upon where chart patterns dominate price movement and where fundamental reasons for trading often lag behind technical and sometimes seem to defy logic.
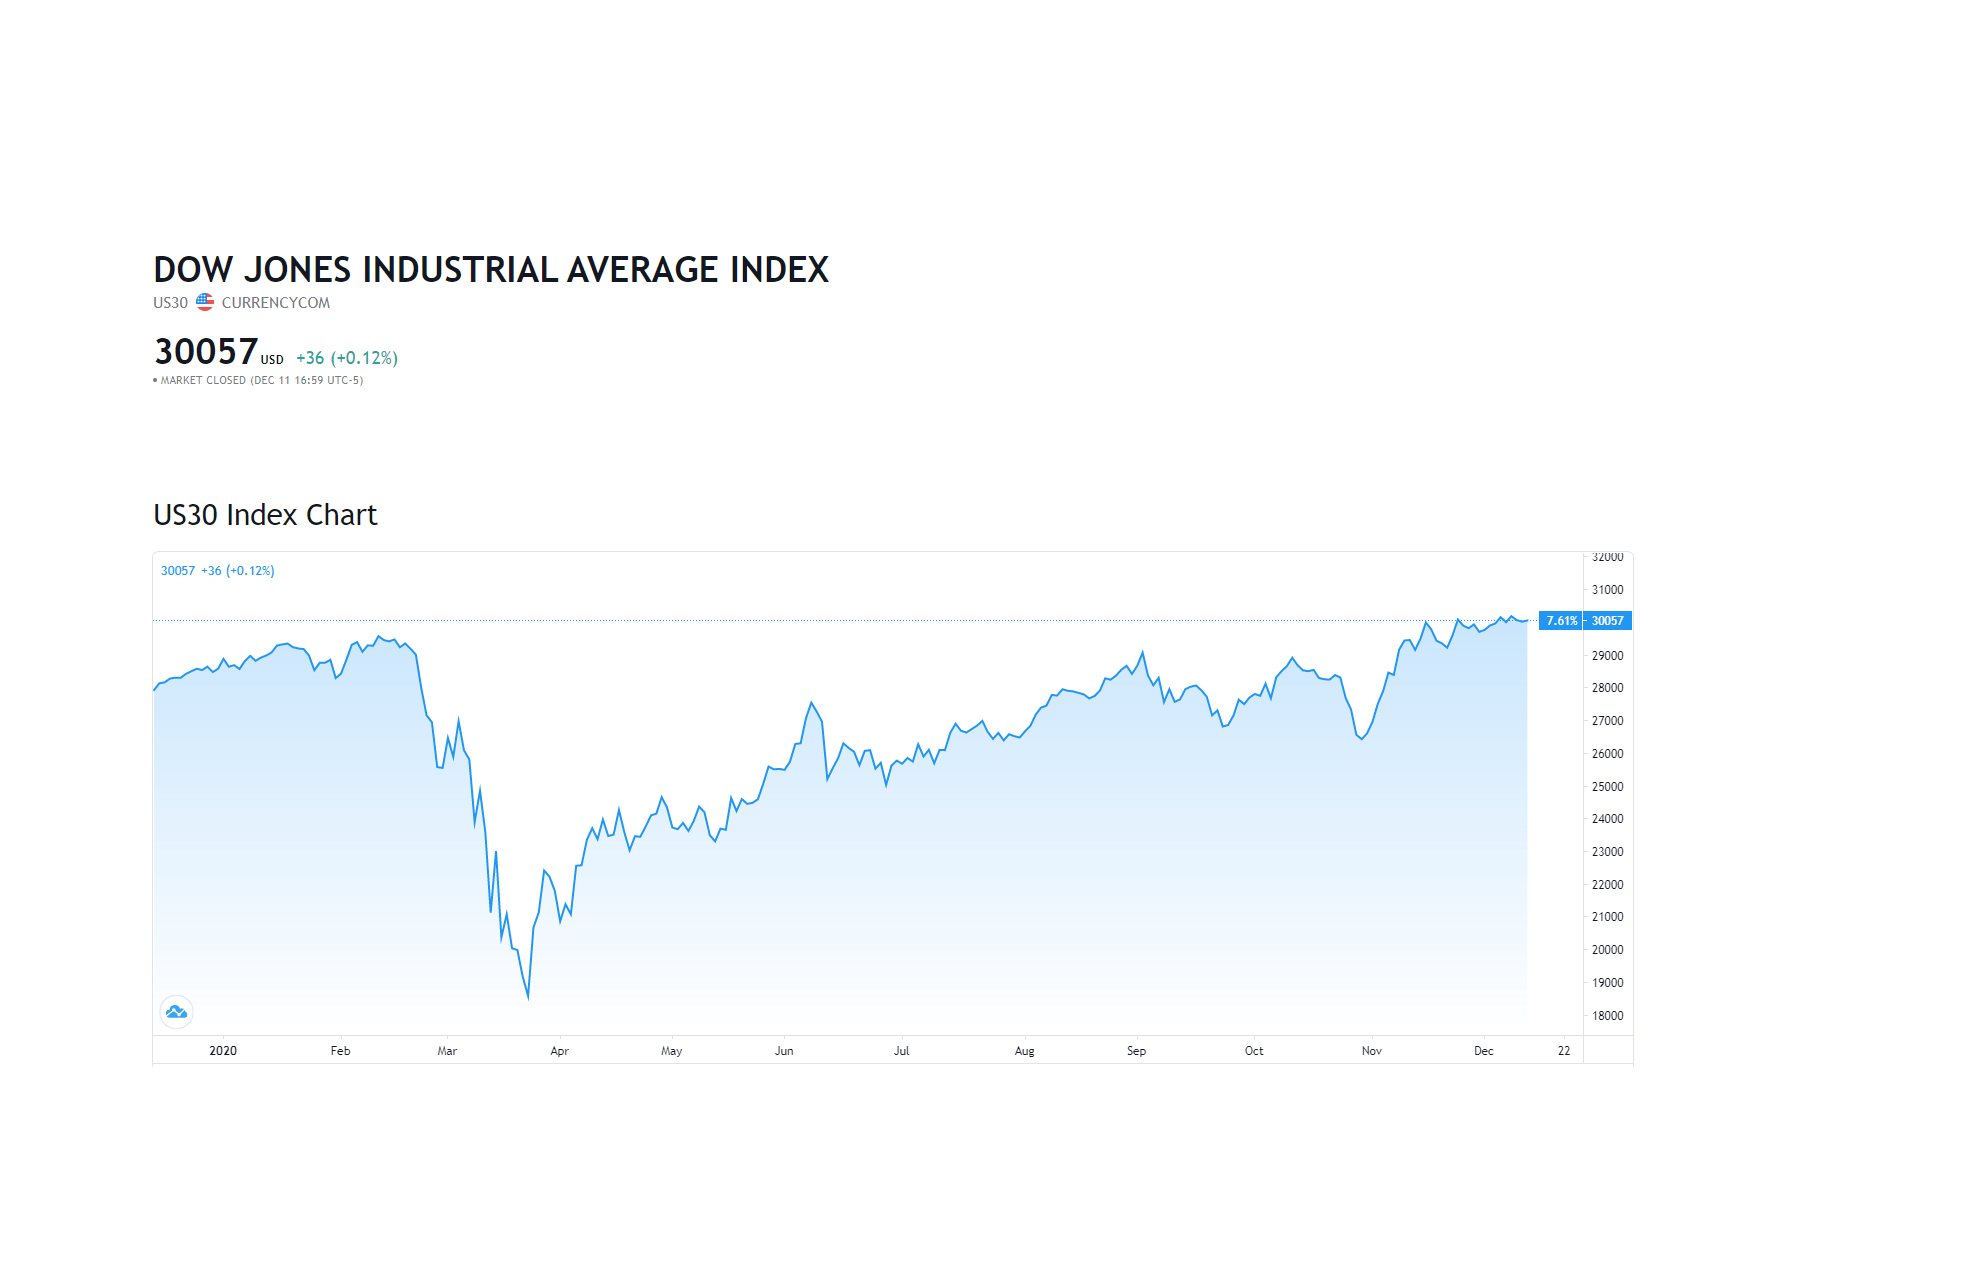
You only have to take a look at the Dow Jones 30 industrial average index, which is at an all-time record-breaking high of over 30,000 while the US economy is still struggling because the pandemic still has it in its grips. Fundamental analysis has gone out of the window on the basis that technical analysis is fuelling the US stock market to the upside, where hopes of a vaccine roll-out outweigh the fact that hospitals are currently at extremely high levels for covid patients, and where a new bleak record was passed this week of over 3000 deaths in a single day in the United States. Similar circumstances, albeit non-pandemic related, perhaps more to do with an overpriced stock market fuelled by the success of the 1920s where share trading on margin was rife probably caused the famous 1929 US stock market crash, which took years to recover from.
Currently, the US market is also buoyed by hopes of extra stimulus by the federal governments and where this money is finding its way into the stock market. Even so, the market is overbought, does not comply with earnings per share, and yet is still relentlessly bid.
Even so, where is the top? It is difficult to say in this hyped market, which is pulling back from every attempt to short it.
If the market reaction is so extreme and fundamental analysis is second to technical analysis, traders have to be on their guard and look for several signs that the market is topping or bottoming out to find a good entry point to trade in either direction.
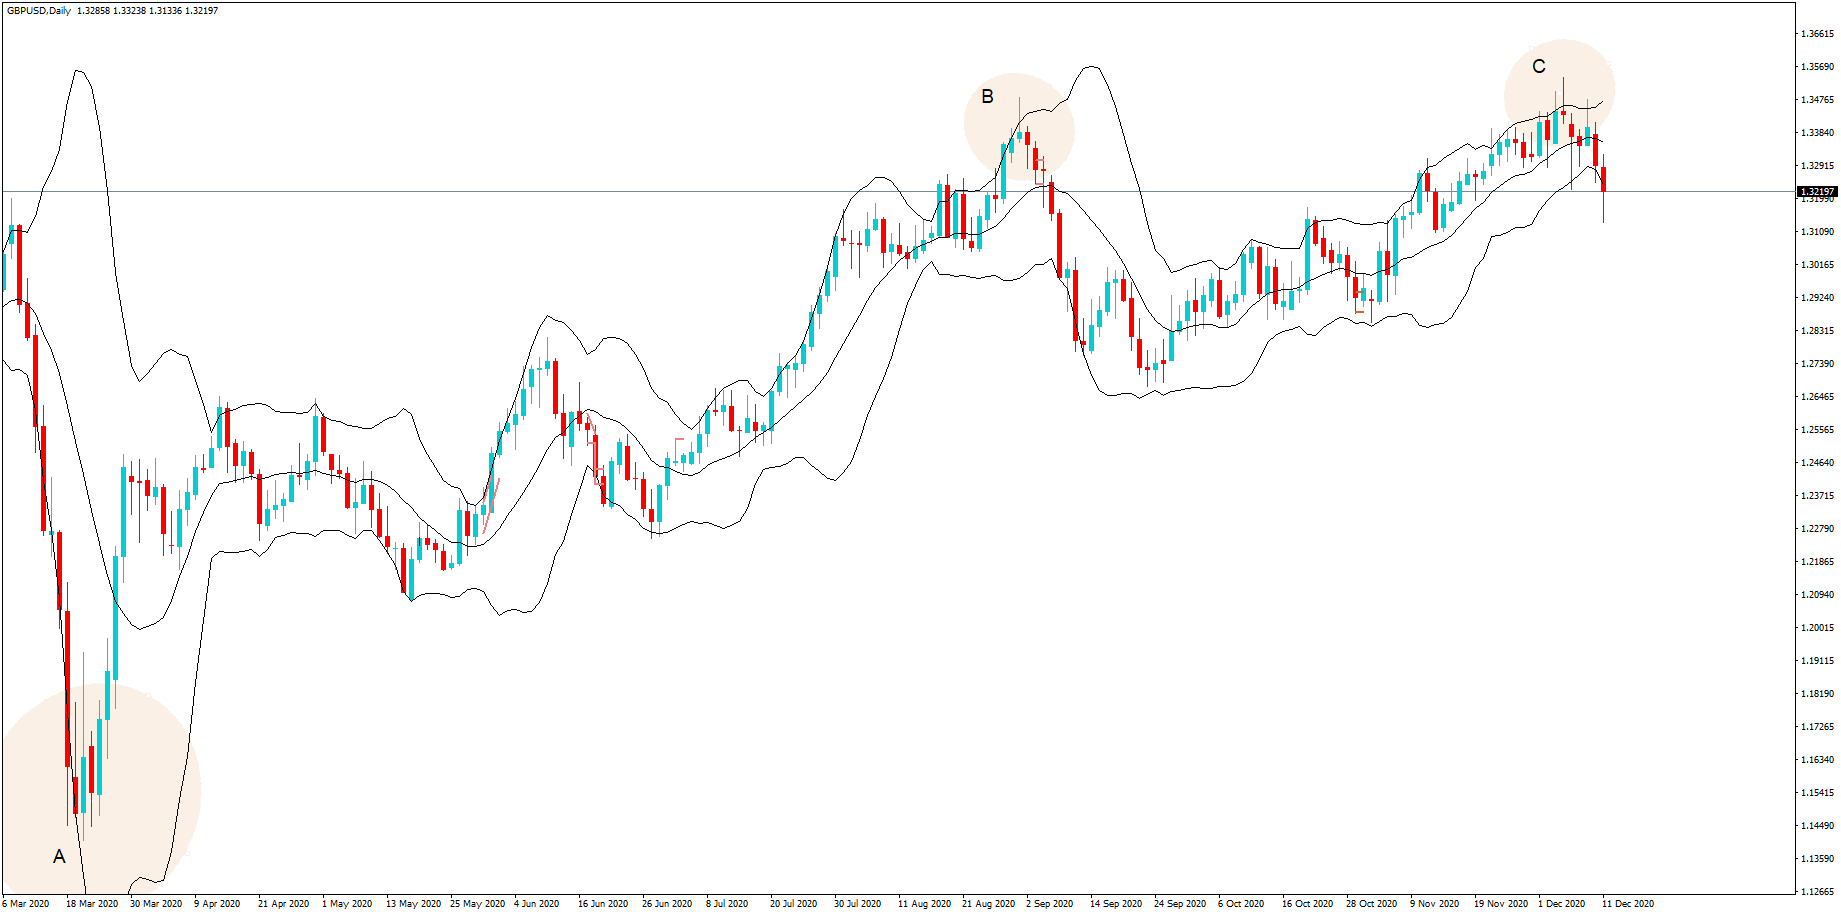
In this daily chart of the GBPUSD pair, we can see a huge push lower at position A during the middle of March 2020, where Britain began to fall into the grip of the coronavirus, which plunged the exchange rate to 1.1400. Buyers were looking for an opportunity to go long because this was seen as the bottom of the bear move.
We have a high in September at position B, where there is a spike outside of the Bollinger band, where the candlestick is an upturned bearish hammer, and where the subsequent candlesticks are bearish, providing the trader with the knowledge that this is potentially a top at 1.3485. A subsequent high at position C, with a bearish hammer spiking out of the bands, provides chartists with a potential top at 1.3535.
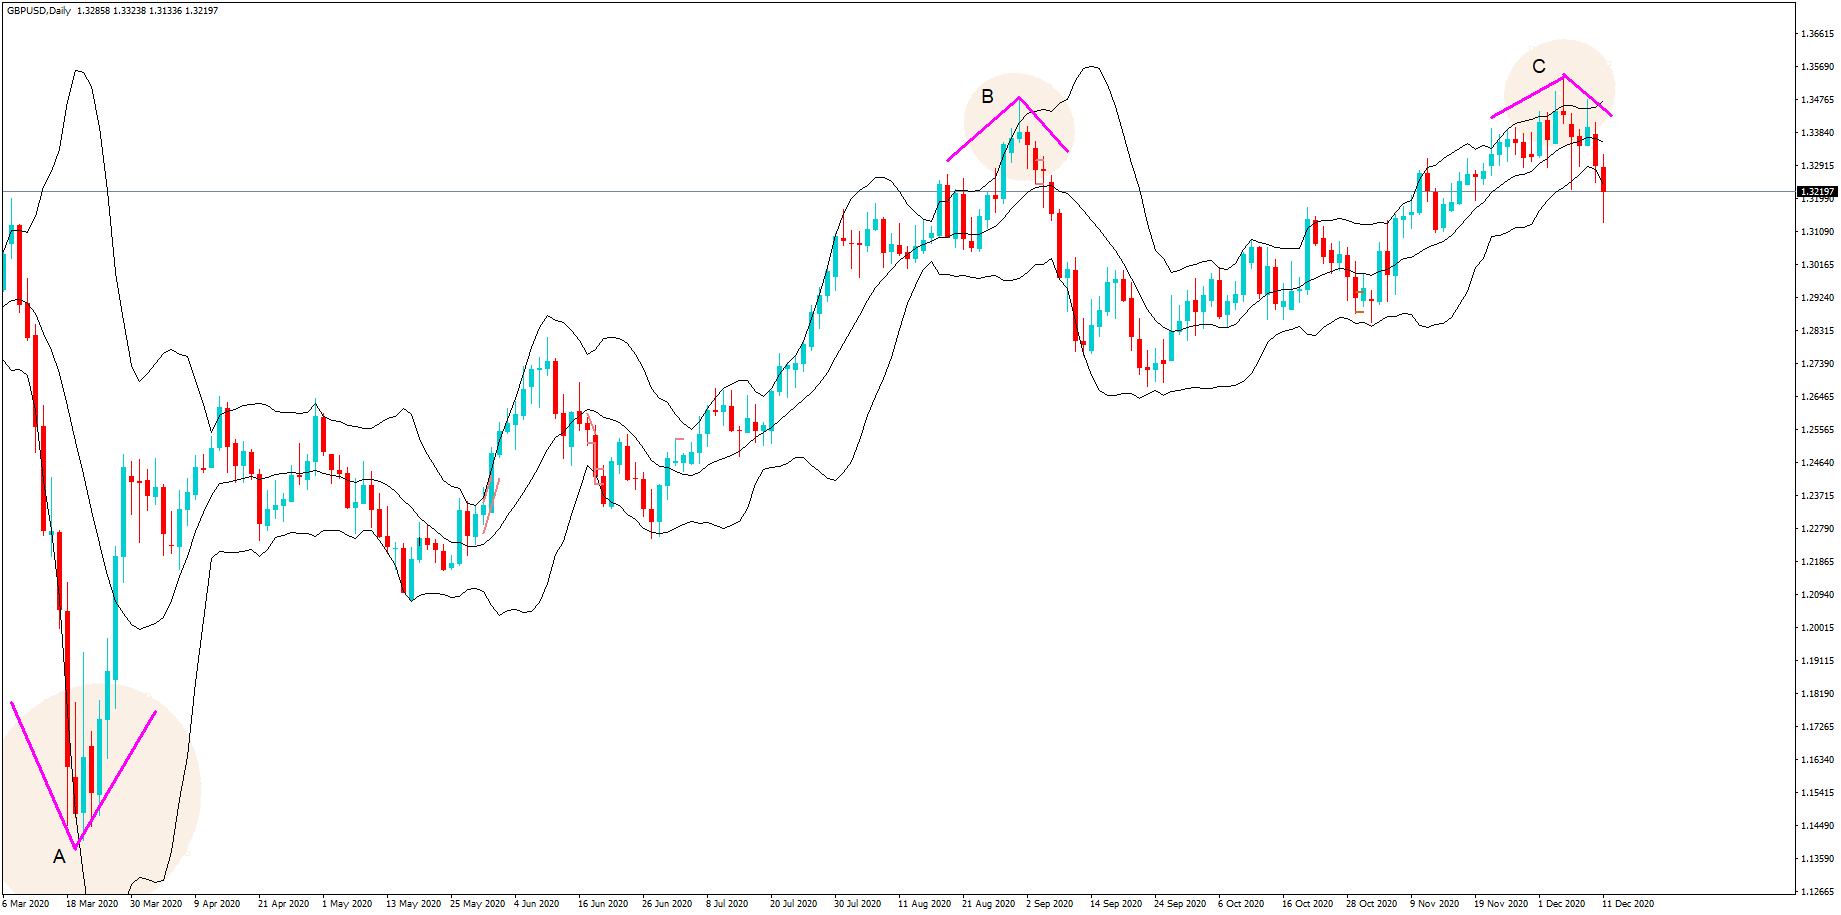
Incorporating these simple chart lines at positions, A B, and C helps us visualize trend reversals. Once we have one or two candlesticks on the daily chart confirming that there is indeed a trend reversal in progress, we can drill down into lower time frames, as intraday traders, to look for opportunities to go short or long. We must never ignore fundamental reasons for taking a trade on. However, based on what has been set out today, we must conclude that fundamental analysis often lags behind technical analysis and therefore, by looking at swings in price action forming tops and bottoms outside of periods of consolidation, traders give themselves a better edge while stacking the odds in their favor and trading in line with institutional size traders who typically trade in this manner.
In conclusion, we are in an age where fundamental analysis often has no bearing on an asset price and where technical analysis and fundamental analysis are often out of kilter, but where eventually with two will catch up with each other.
Traders best opportunities of bagging more pips must be centered around reversals in price action based on longer time-frames such as daily charts, before drilling down into lower time frames such as an hourly chart and trade in the direction of the daily chart trend, to stack the odds in their favor of a successful trades, while never forgetting the importance of the fundamental reasons why a currency pair exchange rate might potentially be changing direction.