This indicator was created in March 2018 by Jan Flodin. We speak of an indicator that identifies superior/ inferior double or triple formations or a next neckline (confirmed top/ bottom). It has RSI, pin bar, and MACD or RSI divergence filter options that allow filtering only the most robust configurations.
The prompt writes the signals to a text file that can also be used by an Expert Advisor (EA) for automatic trading. For example, Information in the text file: [symbol], [term], [price of first top], [price of neckline], [purchase or sale (0=purchase, 1=sale)], [time of first end], [time of neckline], [time of second end] + 3 additional parameters that are used only by this EA.
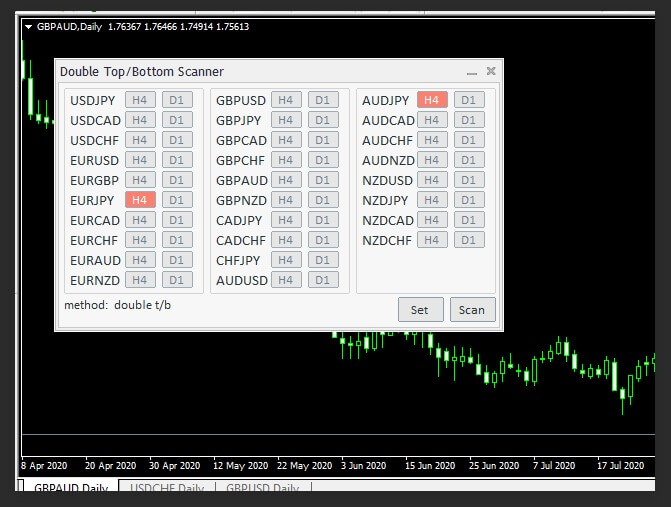
Double Top Bottom Scanner Features
This indicator can monitor all the symbols visible in your Market Watch window at the same time. You can apply the indicator in a single graph and instantly monitor the entire market.
You can monitor each time frame, from M1 to MN, and it will send you a real-time alert when identifying the top or bottom or neckline break.
You can use RSI as a trend and/or divergence filter to properly identify potential investments.
The indicator includes an interactive panel. Clicking on an element will open a new chart with the symbol and time frame in question.
Simply place the indicator on a chart, and you will receive an alert of any symbol and any time frame of your choice.
Input Parameters & General Settings
Panel Width: For example, if you are using a non-standard font size in windows, you can set a higher value for all text to be visible.
Template Name: The template selected here will be attached to the chart that will open when you click on one of the signals in the panel. The name has to include the file extension .tpl. The goal of this parameter is to make it easier for the quick decision to make a trade or not. Or if you wait for confirmation of the actual investment. Normally you would use your own template which, for example, could contain a support/resistance indicator.
Wait for the candle to close for warning (neckline only): If set to ‘false’ then the warning will come as soon as the conditions are met, without waiting for the candle to close. When set to False, this option is only used for cleavage breaks.
Note that because of the multifunctionality neither buy and sell tips nor lines and arrows are drawn on the indicator chart. A line between the ends as well as the neckline is drawn on the chart that can be opened from the panel.
The developer’s recommendation is to put the indicator on an M5 chart and on the EURUSD, preferably a clean chart without any other indicators or Expert Advisor on it.
A priori it seems that we are dealing with a rather useful indicator, as demonstrated by the positive criticisms of its users. Another point in favor is the service that the developer gives to the buyers of the indicator, he is always willing to answer your questions. This indicator is available on the MQL market at a price of 39 USD, or for rent at 12 USD per month. Additionally has a demo version to test it out for free.