
In the previous article, We talked about candles with long and white bodies and discovered how such a candle could provide us with very useful information about the hidden properties of the market situation and the psychology of its participants.
Actually, a black body in a currency pair is equivalent to a white body in the reciprocal pair. That is, the black body of the EUR/USD is the white body of the USD/EUR. In any case, in Forex, we can also operate with commodities, energy, or stock CFDs, therefore in this article, we will develop the properties and informative potential offered by the long-black candle bodies.
As we said in the article on long-white candles, the market can be described by two types of movement: impulsive movement and corrective movement. Large black-bodied candles (like the long-white candles) belong to the impulsive movement category, and as such, are indicators of a trend, in this case, a bearish one.
A black body in a topping area
As in the case of the white candle, a long black candle in a topping zone is a clear warning of the trend halt. For the warning to be stronger, the black candle must clearly be longer than the candles that preceded it. A black candle of this kind indicates that the bears have taken control.
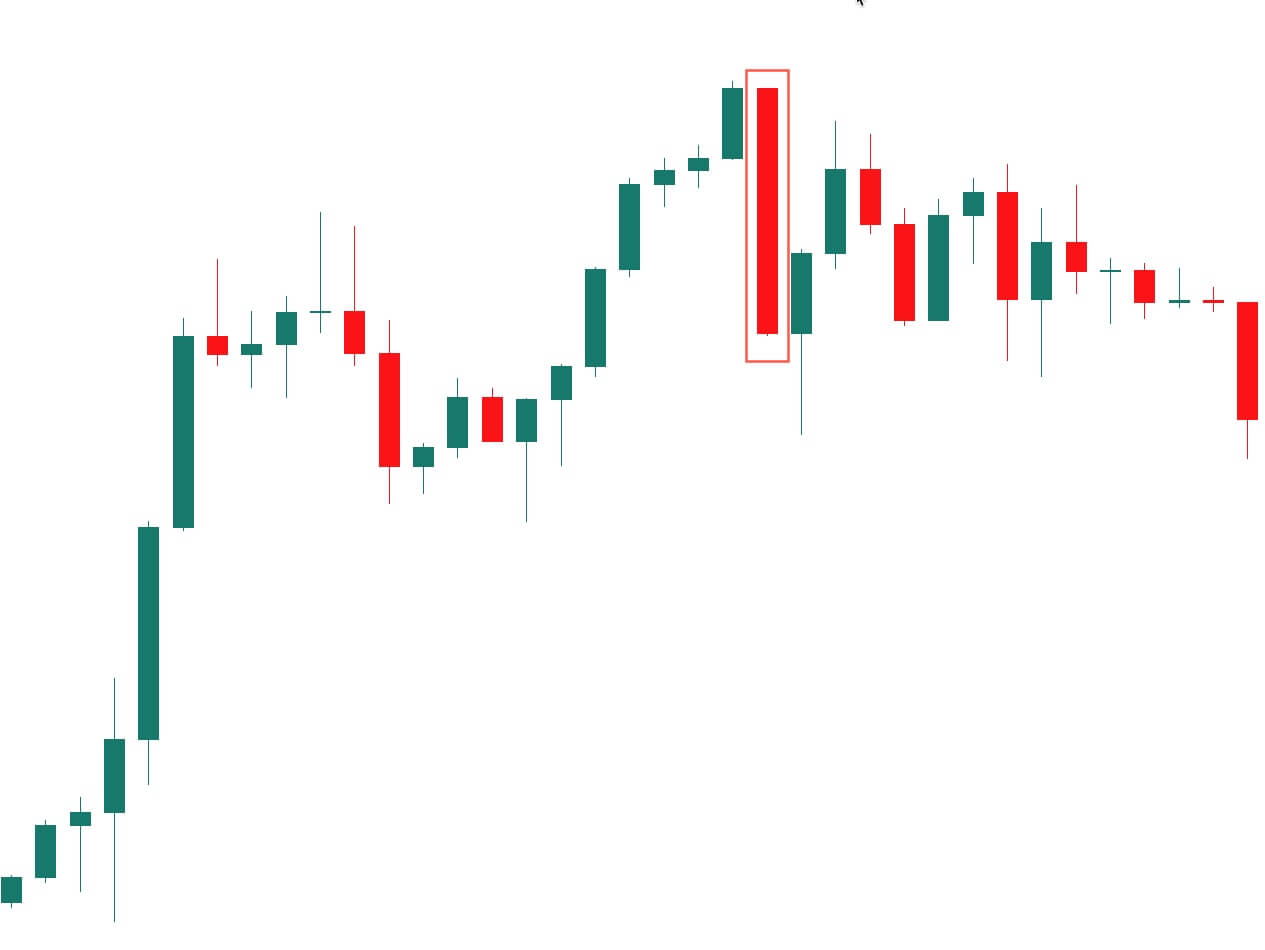
Image 1 – The long black-bodied candle appearing after an uptrend.
In the previous image, we can see that the black body erased the gains acquired by the preceding five candlesticks showing a rush of close orders. Then, after the initial selloff, a short recovery but buyers were not able to move the price to new highs.
A long Black-bodied candle confirms resistance
If a top consolidation area appears, and, then, a black body shows up, it is an extra confirmation that the resistance area will hold, and the trend is reversing.
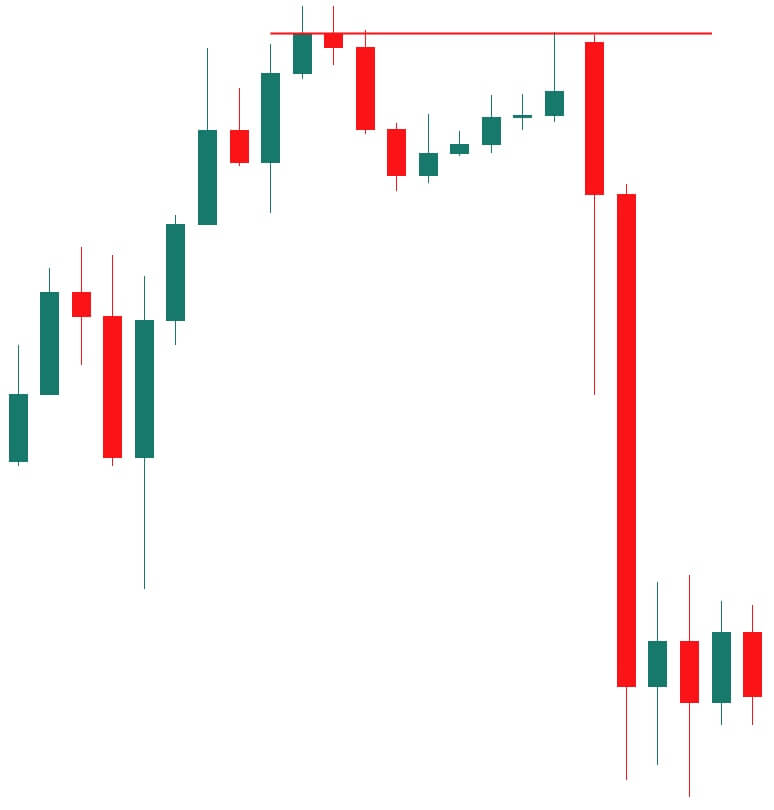
Image 2 – The long black-bodied candle appearing at a resistance level
On the picture above, the price topped and retraced, followed by a recovery touching but not exceeding the previous top close. Then the engulfing black body started up at the same level, but it created an exceedingly large body surpassing the previous retracement low and closing near it. That was the confirmation for bears to push the market down.
The Long Black-bodied candle breaks a support
The break of a support level by a long black candlestick is terrible news for bulls. This situation should be considered more bearish than other less evident breakouts.
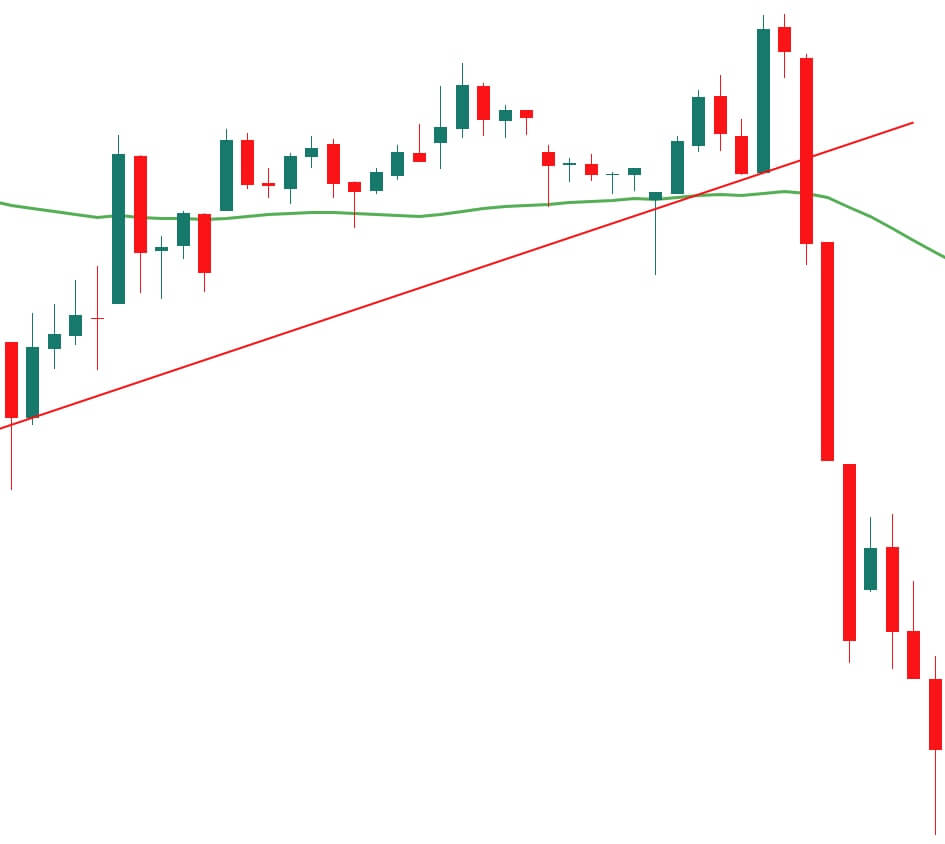
Image 3 – The long black-bodied candle breaking support trendline and SMA 50-SMA
In the case of the preceding image, which corresponds to a 2H Euro Stoxx 50 chart, the large-bodied candle not only broke the ascending trend line but, also, the 50-Period SMA. This confirmation is what bears needed to move down the price.
Long Black-bodied Candle as Resistance
The top and open of a long black-bodied candle will act as resistance levels. That situation happens when the price retraces the complete impulse. According to Mr. Nison, it is more typical the retracement to stop near 50% of the candle’s body. In consequence, a typical strategy following the trend is to place a sell-short position at that level with a stop-loss level over the top of the candle.
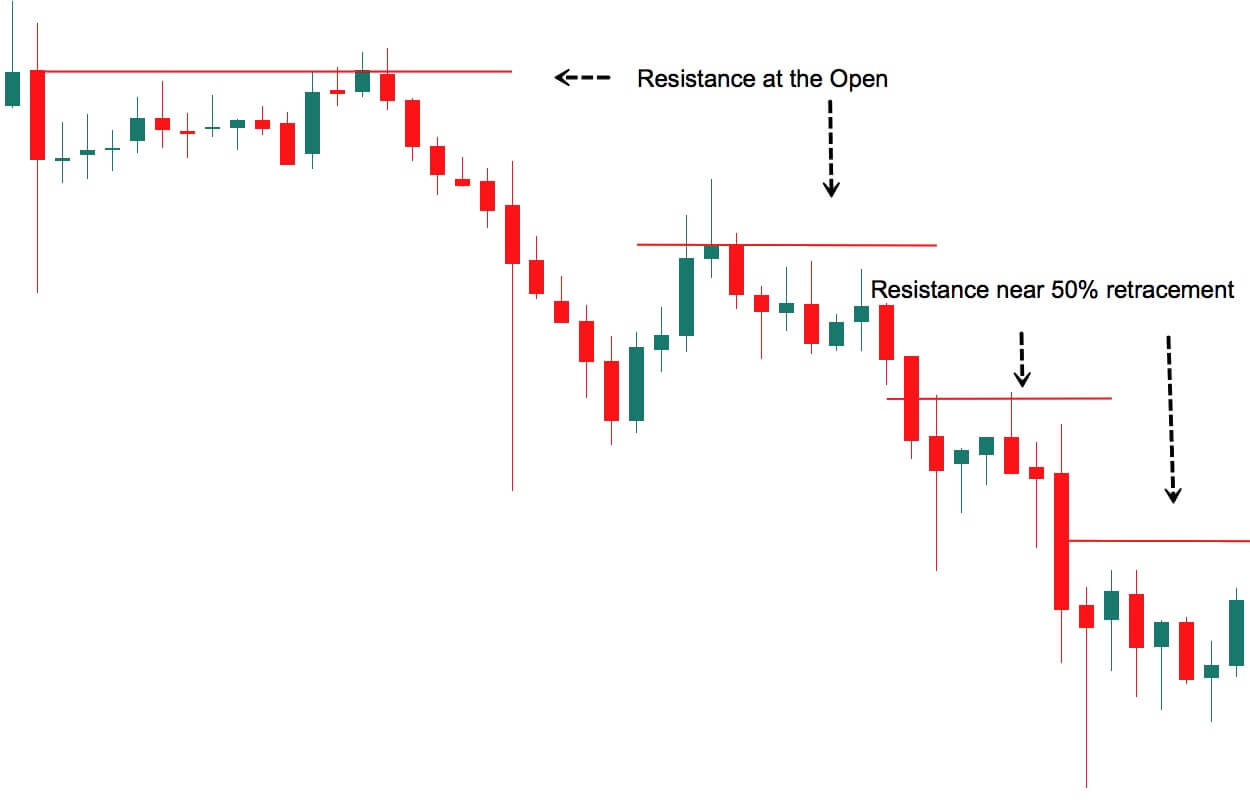
Image 4 – The top of a black-bodied candle as a resistance
Conclusions
A large black body is a clear indication of a bear trend, especially if it appears at previous tops or resistance areas. We should always pay attention to a black body and analyze the implications of it in terms of market sentiment, and also its meaning as a new resistance area. Finally, from the point of view of a price-action trader, large black bodies are an opportunity to open a position with the trend, after waiting for a pullback. Not always the pullback will happen, but when it does, it is a low-risk place to create a short entry.