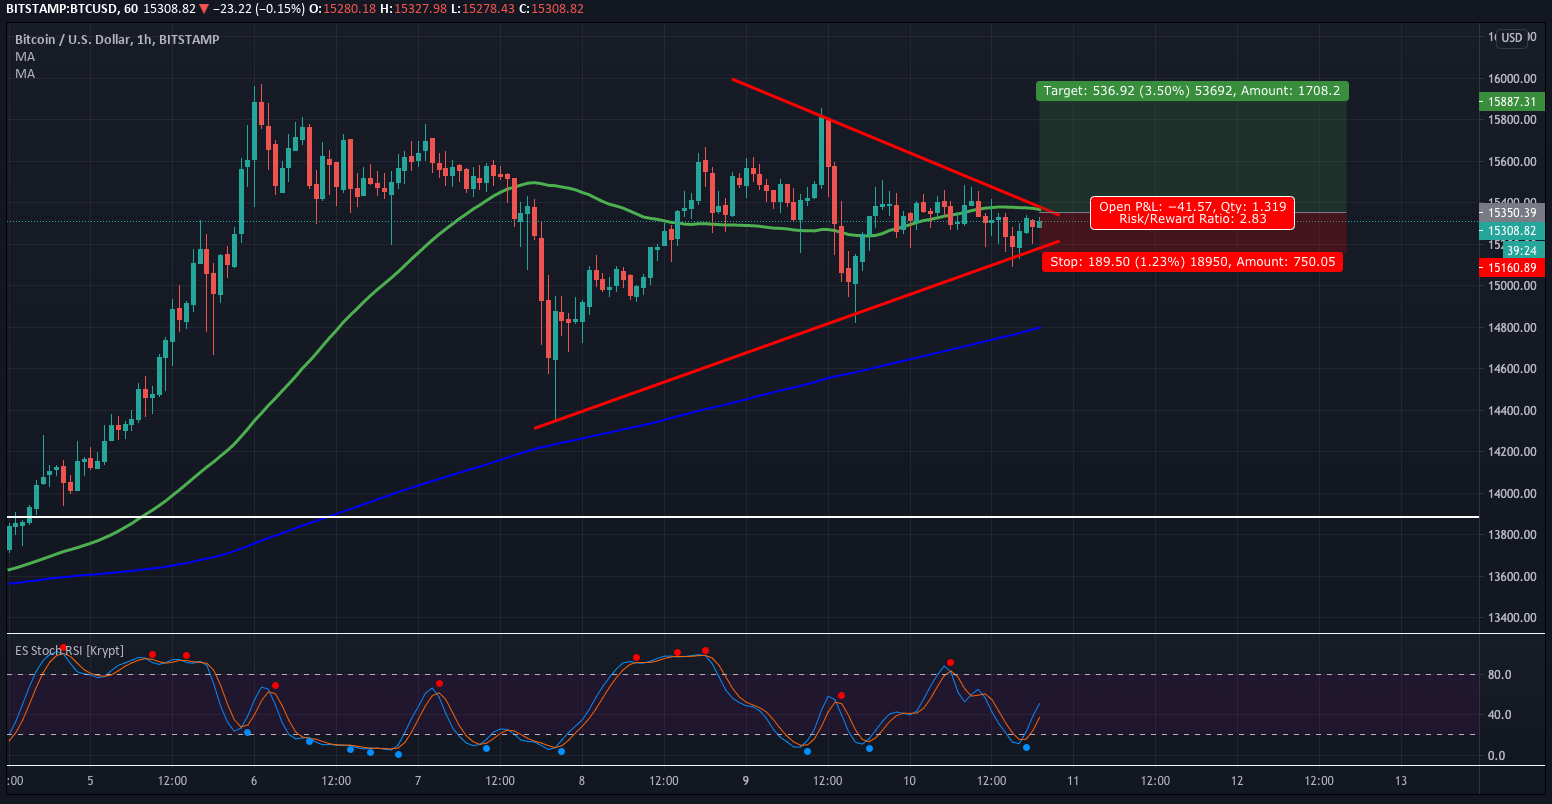
After climbing from 12,500 to $15800, Bitcoin has been making a consolidation structure shaping a triangular formation. The volatility has been declining as well, as is usual in a triangle.

The primary trend is still strong; therefore, we can expect a breakout of this triangle on good volume. We see also that the prices have been supported by the lower trendline.
As we see in the chart, we are using the Stochastic RSI indicator, which is the stochasticization of the RSI. That is, applying the Stochastic formula to the RSI values. This operation smoothes out the overall curve and shows evident overbought and oversold levels.
Oscillators work best on sideways markets. In this case, we see bitcoin is moving sideways, so the Stochastic RSI signal is likely to be right.
This sets up a potential trade to the long side. Bitcoin ranges are high; thus, this trade has $200 on a full coin. Thus, please, consider lowering your risk by trading a fraction of Bitcoin if your account doesn’t allow you to risk that much.
Its reward is also high ($530), making it a 2.8 reward/risk trade.
Trade Setup Levels
- Entry: Buy Stop 15,350
- Stop-Loss: 15,149
- Take Profit: 15,879