ouldThe precious metal gold traded bullish again since the inception of the trading day, topping the $1,576 level after the price dropped to the $1562 through the session. That has happened despite the words by the Chinese president that the corona situation is under control and that the disease is at its top; thus, the situation would be entirely contained by next April.
In addition to this, the U.S. Labor Department announced its U.S. Consumer Price Index increased 0.1% in January, following a 0.2% increase in December. The U.S. CPI figures were weaker than anticipated, as forecasts were for a growth rate of 0.2%.
The U.S. core CPI data increased in line with forecast, rising 0.2% during the previous month, following December’s surge of 0.1%. Annual core inflation climbed 2.3% last month, the report declared.
Support Resistance
1,561.75 1,570.37
1,557.54 1,574.77
1,548.92 1,583.38
Pivot Point 1,566.15
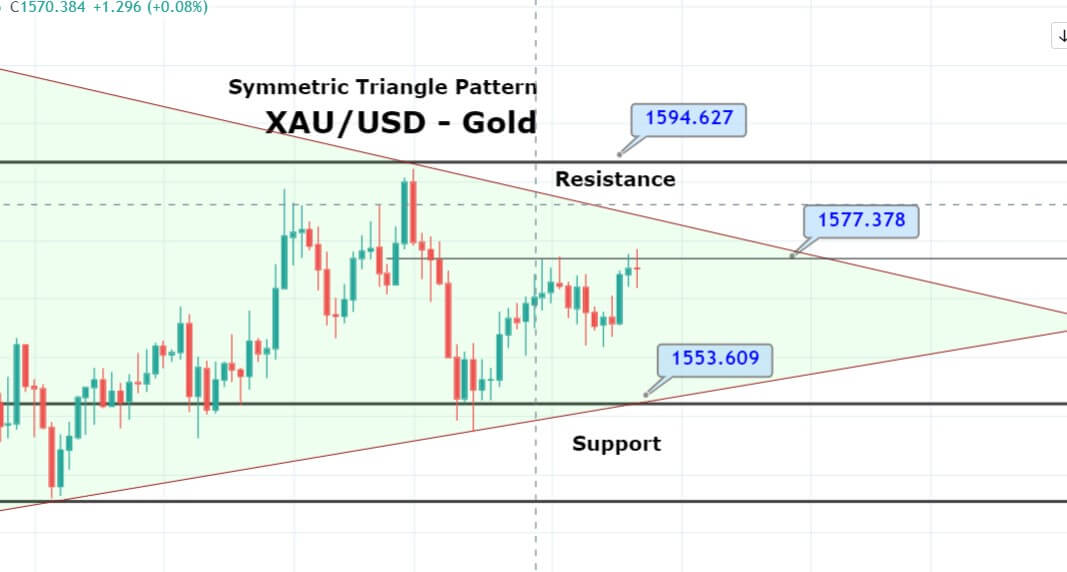
On the technical front, the precious metal gold is trading within a symmetric triangle pattern, which is keeping the yellow metal prices in a sideways range of 1,577 – 1,552. Typically, the symmetric triangle pattern signals the indecision among traders and demonstrates that the investors are looking for a solid reason to trigger a breakout while this breakout can be on either side. With that being said, we need to keep a close eye on the 1,577 level as the bullish breakout of this level can extend buying until 1,585 level. Good luck!