Categories
Crypto Market Analysis

RDD/BTC Lost The Bearish Momentum


ReddCoin (RDD)


Market Cap: $195.44M

Circulating Supply: 28.81B RDD

Max Supply: 0 RDD

Volume (24h) $3.62M

RDD/USD = 0.006804


Technical Analysis


RDD/BTC rallies right now and resumed yesterday’s bullish candle. The rate approaches a very strong dynamic resistance, so it remains to see how it will react. A valid breakout will confirm a further increase in the short term. The rate has shown some oversold signs after the failure to make new lows. It seems that the behaviour has changed, but we still need a confirmation that the rate will increase further.


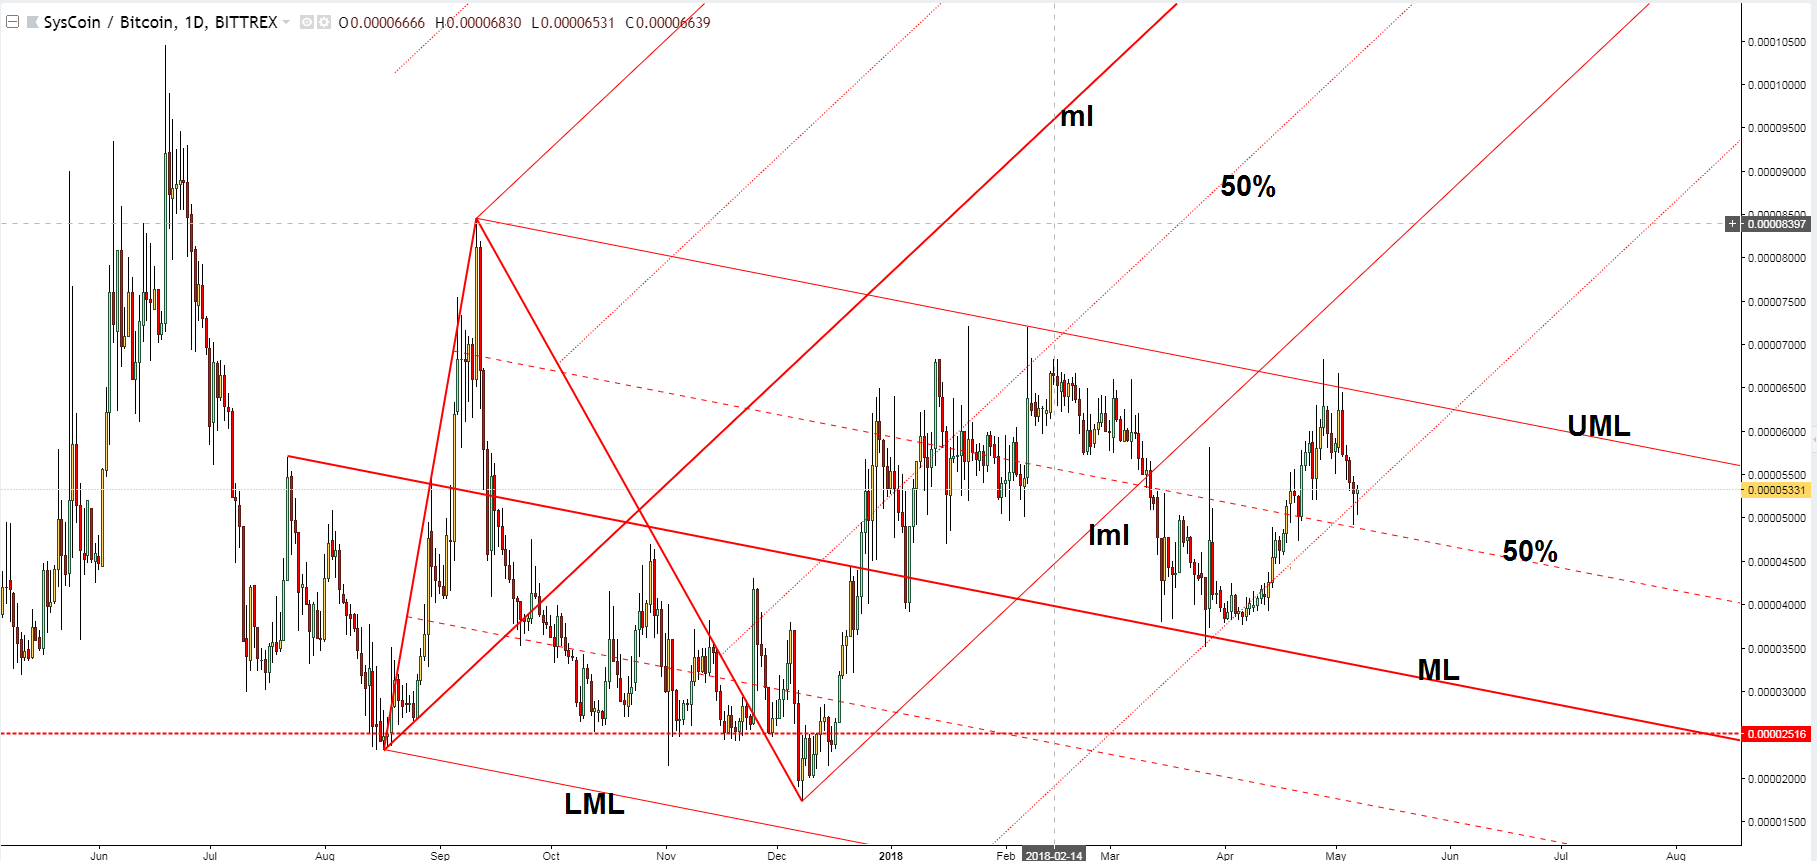
As you already know, it is very important for the major crypto to increase, and maybe we’ll have an important increase with this pair as well. The last drop was expected and it was natural after another failure to reach and retest the median line (ML) of the sideways pitchfork.

RDD/BTC has found strong support right above the 0.00000076 level and above the 61.8% retracement level. The failure to drop towards the 76.4% level and towards the LML of the sideways pitchfork has attracted the buyers again.

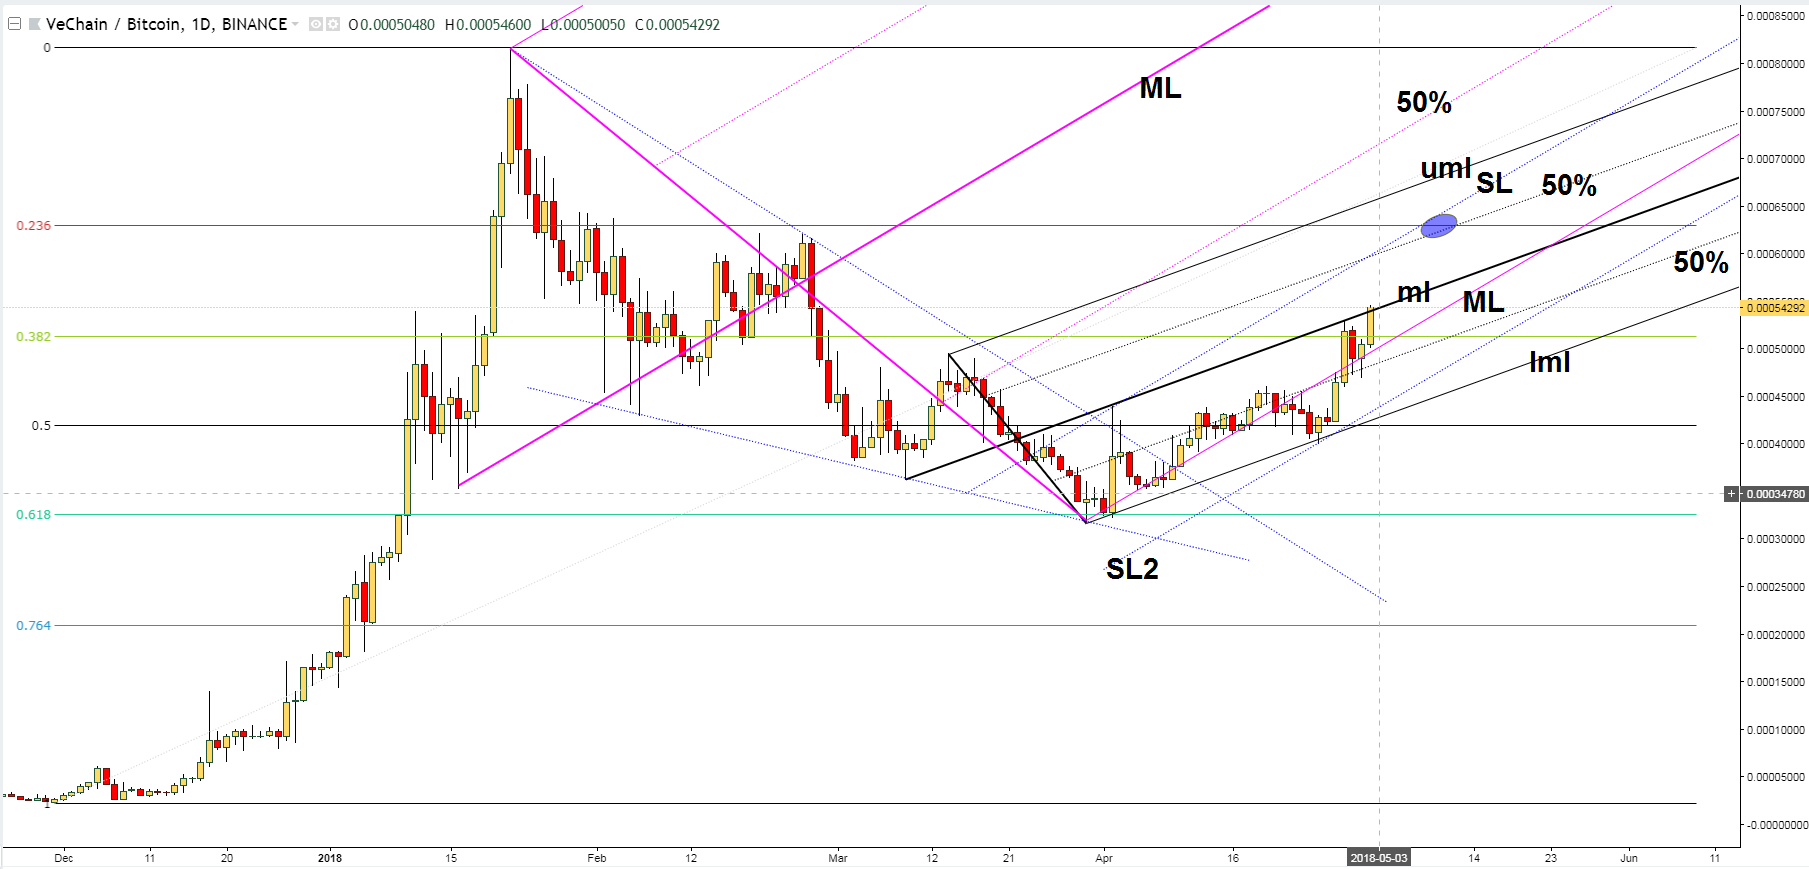
It has also failed to reach the median line (ml) of the minor descending pitchfork signalling a breakout from the descending pitchfork’s body. A valid breakout above the upper median line (uml) should send the rate towards the median line (ML) again.


Conclusion


We can go long after a valid breakout above the upper median line (uml). The first target it will be at the warning line (wl1) and at the ML of the sideways pitchfork. The Stop Loss can be placed below the 0.00000076 level.

Categories
Crypto Market Analysis

XRP/BTC Looks To Trade Higher


Ripple (XRP)


Market Cap: $26.18B

Circulating Supply 39.24B XRP

Max Supply: 100B XRP

Volume (24h) $397.67M


XRP/BTC Technical Analysis


XRP/BTC increased and maintains a bullish perspective in the short term. It remains to see what will really happen in the upcoming period because the crypto market is still weak. The rate dropped in yesterday’s trading session as the crypto market dropped further.

The price rebounded in the short term after the failure to reach the previous lows. The rate has managed to break out above some very important resistance levels and now is struggling to reach new highs.


The rate has made a false breakdown below the 150% line of the descending pitchfork signalling that we may have an oversold situation. It has moved sideways on the short term but now has started an upside movement after the breakout above the WL1 of the descending pitchfork.

The perspective will remain bullish in the short term as long as the rate stays above the 150% Fibonacci line of the minor ascending pitchfork. The next upside obstacle is at the 61.8% Fibonacci level, so we need a breakout above this level so we can think of a further increase.

It looks bullish in the short term, you can see that the price failed to retest the minor red uptrend line, signalling that the buyers are strong.


Conclusion


We can go long on this crypto pair if it will close above the 0.000091050 yesterday’s high and we can place a stop loss below the 0.000073170 low. A valid breakout above the 61.8% level will send the rate towards the 50% line and maybe towards the median line (ml) of the ascending pitchfork.

Categories
Crypto Market Analysis

PARTICL Can Buyers Take Control Again?


 Particl (PART)


Market Cap: $87.60M

Circulating Supply: 8.98M PART

Max Supply: 0 PART

Volume (24h) $1.26M


Technical Analysis


Particl price resumes the downside movement and could reach lows soon as the pressure is very high. PART/USD approaches a very strong support area, so you can keep an eye on this to see how it will react in the upcoming days.

The current drop is natural as the crypto market has turned to the downside again and because the rate has failed to stay above a very strong dynamic support.


It was expected to drop further after the breakdown below the lower median line (lml) of the ascending pitchfork. The breakdown below the 150% line has attracted more sellers.

Technically, it is expected to drop towards the first warning line (wl1) of the ascending pitchfork and towards the downside line of the Falling Wedge pattern after the failure to approach and retest the downtrend line.

The rate has signalled that it is losing the bearish momentum in the last days when it has failed to reach and retest the upside 50% Fibonacci line of the descending pitchfork.  However, the bearish bias remains intact as long as the rate continues to stay below the sliding parallel line (SL) of the descending pitchfork.


Conclusion


We may have a buying opportunity if the rate will be rejected by the 8.21276496 static support, if it will stay above the warning line (wl1) and if it will make a valid breakout above the SL of the descending pitchfork. A drop below the mentioned levels will invalidate the bullish scenario.

Categories
Crypto Market Analysis

EOS/USD Is The Corrective Phase Completed?


EOS (EOS)


Market Cap: $11.33B

Circulating Supply: 872.87M EOS

Max Supply: 1B EOS

Volume (24h)  $927.61M


Technical Analysis


EOS/USD dropped sharply in the last weeks after making new highs. Price increased as much as 23.0290 on April 29, 2018, but the buyers weren’t strong enough to keep the rate near this historic high. The rate is trading in the red today and resumed the yesterday’s bearish candle. It remains under high selling pressure on the Daily chart, that’s why it is premature to talk about another leg higher.

EOS was one of the best performers in April as it has increased from 5.1000 to 23.0290, but now it is trading at only 12.8080. It remains to see if the crypto will recapture enough directional energy to be able to approach the 23.0290 high. Personally, I want to show you a bullish scenario, if the rate will make a valid breakout in the upcoming period.


EOS/USD has found temporary support at the upside 50% Fibonacci line (ascending dotted line) of the ascending pitchfork. It has come higher to retest the upper median line (uml) and now drops again. It seems like it has only made a false breakout above the 50% level, which could announce a further drop towards the 61.8% retracement level and toward the median line (ml).

Right now you should stay away from this crypto because we don’t have a reversal sign. Personally, I want to see a consolidation or another signal that the corrective phase has ended before I’ll go long again.


Conclusion


It remains to be seen where it will find a strong support area. Personally, I believe that only a valid breakout above the 250% Fibonacci line will bring us the chance to go long again on this amazing crypto. The first major upside target will be at the 23.0290 highest high.

Categories
Crypto Market Analysis

INCNT Further Increase Needs Validation


Incent (INCNT)


Market Cap: $17.36M

Circulating Supply: 46.02M INCNT

Max Supply: 0 INCNT

Volume (24h)


Technical Analysis


INCNT/USD continues to stay above some very important dynamic support levels and maintains a bullish perspective in the short term. The price could increase significantly in the upcoming period if it will make a valid breakout above some very important upside targets.

The rate is trapped below some very important resistance levels, that’s why we have to stay away until a further increase will be confirmed by the price action.


You can see that the rate was into a corrective phase, but it has found a bottom and a strong support right below the lower median line (lml) of the ascending pitchfork. I’ve drawn an outside sliding parallel line to show you where the crucial support line is. A further increase will be invalidated by a valid breakdown below this line.

You can see that the rate has failed to reach and retest the sliding line (sl) of the ascending pitchfork signalling that the bulls are still present in the game. However, only a valid breakout will be above the 150% Fibonacci line and above the 0.4226


Conclusion


You can go long on INCNT if the rate will jump and will stabilise above the 150% line and above the 0.42260400. The next upside targets will be at the WL1 and at the 50% line. You can place your Stop Loss somewhere below the outside sliding parallel line (SL). A drop below this line will really signal a further drop in the short term.

Categories
Crypto Market Analysis

PAY/USD Inverse Head and Shoulders?

TenX (PAY)

Market Cap: $153.75M

Circulating Supply: 109M PAY

Max Supply: 0 PAY

Volume (24h) $53.58M


PAY/USD rallied aggressively today and has reached new highs, but unfortunately, the buyers weren’t strong enough to hold the rate near 1.97956344 today’s high. Price is trading at 1.41913765 right now but is trapped below a crucial dynamic resistance.

The crypto moves somehow sideways on the short term, so we’ll have a significant move after a breakout from this minor range.


It is premature to talk about a larger upside movement as long as the rate is trapped below the minor downtrend line. You can see that the rate has found support at the lower median line (LML). The previous retreat was natural after the failure to reach and retest the median line (ML) of the ascending pitchfork.

It remains to see what will happen in the upcoming period because the current rebound could be only temporary after the today’s failure to stay higher. A  further increase could be validated after a valid breakout above the downtrend line, but a major upside movement will be confirmed only after a valid breakout above the median line (ML).

Technically, we could say that the rate has developed an Inverse Head and Shoulders pattern, this could be confirmed only after a valid breakout above the downtrend line which could be considered to be the neckline.

Conclusion

We could go long on PAY/USD if it will make a valid breakout above the downtrend line and if the LML will remain intact. A breakdown below the LML will invalidate a potentially significant increase.

Categories
Crypto Market Analysis

Basic Attention Token Remains Bullish

Basic Attention Token (BAT)

Market Cap: $377.29M

Circulating Supply: 1B BAT

Max Supply: 0 BAT

Volume (24h) $5.03M


BAT/USD plunged in the last hours and could invalidate a further increase. However, I want to show you a great buying opportunity only if this will be a false breakdown below the lower median line (LML) of the ascending pitchfork.

The rate has it into a corrective phase on the short term after the impressive upside movement. Price has found a strong demand right above an important support area. Right now you should stay away because this could be only a temporary rebound and the rate could drop and could take out the support area.

Basic Attention Token Price Prediction


BAT/USD has made a false breakdown below the 50% and below the 61.8% retracement levels. It has increased and has closed above the 38.2% retracement level and above the lower median line (LML) of the ascending pitchfork. A false breakdown below the LML followed by a retest will signal a further increase in the short term.

However, you should know that the rate could take out the support from the outside sliding line (SL) if it will close on it, and will invalidate a further increase.

Conclusion

The perspective will remain bullish as long as the rate stays above the SL of the ascending pitchfork. We may have a buying opportunity only if the rate will stabilise above the 38.2% retracement level and above the LML. The first major upside target will remain at the median line (ML).

Categories
Crypto Market Analysis

Internet Of People – Another Leg Higher?

Internet of People (IOP)

Market Cap: $6.36M

Circulating Supply: 3.53M IOP

Max Supply: 21M IOP

Volume ($199.96K)

1 IOP=$1.81209


Internet Of People Price Prediction: IOP/BTC seems undecided right now and maybe you should be very careful because it could start an aggressive move very soon. The direction remains to be seen, that’s why you should keep an eye on this only to see a confirmation.

Price is somehow expected to increase in the upcoming period after the breakout above the downtrend line and above a very important dynamic resistance. Personally, I would like to see a minor consolidation here before I will make a decision.


The pair is located right above a major support area and above the lower median line (LML) of the red ascending pitchfork, that’s why it should climb higher as long as it will stay within the ascending pitchfork’s body.

The false breakdown below the lower median line (LML) could attract more buyers, which will drive the rate towards fresh new highs. You can see that the rate has failed to retest the broken downtrend line, signalling that the bulls can take the lead again.

It has also failed to reach and retest the 0.00016832 static support, that’s why we could think of another bullish movement. The next upside target will be at the second warning line (wl2) of the descending pitchfork, it could also be attracted by the 50% Fibonacci line and by the median line (ML).

Conclusion

We may have a great buying opportunity after a retest of the LML or after a failure to retest this dynamic support. You can place your Stop Loss somewhere below the LML and below the 0.00016832 static support.


Categories
Crypto Market Analysis

WAVES into a Corrective Phase

Waves (WAVES)

Market Cap: $647.89M

Circulating Supply: 100M WAVES

Max Supply: 0 WAVES

Volume (24h) $29.10M


The WAVES drops like a rock on the short term after another false breakout above a very strong dynamic resistance. Price approaches a strong support right now. It remains to see how it will react when it touches and retests the near-term support levels.

It is premature to talk about a larger drop in the short term as long as the rate is located above some crucial support levels. I said in last weeks report that the crypto marker rebound could be only temporary and it could come back down trying to capture more bullish energy.

We have important corrective movements on all major cryptocurrencies. This retreat is natural and it was expected after the impressive rally. I’ve told you in one of my editorials (Is the crypto market sell-off natural?) that the cryptocurrencies have reached important upside targets and could turn to the downside on the short term.

WAVES/USD dropped sharply in the last days

The WAVES/USD dropped sharply in the last days and now is pressuring the 6.28330036 static support. It should reach and retest the lower median line (LML) as well. A further increase on the Daily chart will be invalidated by a valid breakdown below the outside sliding line (SL) of the ascending pitchfork.


Conclusion

We could go long on this after a false breakdown below the mentioned support levels and after a retest. The first upside target will be at the 50% Fibonacci line. Only a valid breakout above the 50% line will signal a further increase towards the median line (ML).

©Forex.Academy

Categories
Crypto Market Analysis

SYS/BTC is this a temporary drop?

Syscoin (SYS)

Market Cap: $265.04M

Circulating Supply: 533.32M SYS

Max Supply: 888M SYS

Volume (24h) $3.45M


The SYS/BTC dropped aggressively in the last days and has reached an important support level. The bearish momentum was paused for the moment and is premature to talk about a significant rebound at this moment. Right now will be better to stay away because we don’t have a clear direction, but I really hope that we’ll have a great trading opportunity very soon.

Syscoin Price Prediction

The SYS/BTC has made two false breakouts above the upper median line (UML) of the descending pitchfork. The current drop is natural but remains to see how long this could be. We may have a perfect buying opportunity from above the upper median line (UML) of the descending pitchfork.

So, a rebound from here and a valid breakout from the descending pitchfork’s body will signal a further increase in the upcoming period. You can see that the 150% Fibonacci line represents a very strong dynamic support and could stop the retreat.

A drop below the 150% Fibonacci line will signal a further drop, and it could slip much below the 50% Fibonacci line as well, and it could be attracted by the median line (ML) again.

Price moves in range on the daily chart, that’s why only a valid breakout from the descending pitchfork’s body will signal a further increase and a breakout from the extended sideways movement.

Conclusion

The Syscoin dropped significantly after the false breakouts above the UML. Technically, it was somehow expected to climb much higher after the several failures to reach and retest the median line (ML) of the descending pitchfork. We’ll have an important upside target at the lower median line (lml) of the ascending pitchfork.

©Forex.Academy

Categories
Crypto Market Analysis

Could AION shine again?

AION (AION)

Market Cap. $540.93M

Circulating Supply: 133.07M AION

Max Supply: 0 AION

Volume (24h) $13.15M


AION/USD rose and seems determined to climb much higher in the short term after the last minor drop. The failure to retest its dynamic support (resistance has turned into support) it has shown that the bulls are strong in the short term.

However, we still need a confirmation that the rate could increase significantly in the upcoming period. Price is ready to escape from an extended sideways movement so a valid breakout will confirm a further increase.

AION/USD

The AION/USD has finally managed to breakout above the downtrend line. It has come back to test and retest the broken dynamic resistance and now is struggling to climb towards fresh new highs. It seems like we have a valid breakout and the rate should make new highs soon.

AION/USD has jumped above the 3.8274271 static resistance, but we need a valid breakout to be sure that the rate will climb much higher in the upcoming period.

You can see that we had a false breakout above the 3.8274 level and above the 23.6% retracement level on April 24, that’s why the breakout needs confirmation. The failure to approach and test the first warning line (WL1) of the ascending pitchfork has signalled another bullish momentum.

The rate will become strongly bullish only after a valid breakout above the lower median line (LML) of the ascending pitchfork.

Conclusion

You can go long on this crypto if the rate will close above the 23.6% retracement level and you could place your Stop Loss somewhere below the 3.3446578 former low. A breakdown below the WL1 could invalidate a potential upside movement. We have an important upside target at the 38.2% retracement level and higher at the median line (ML).

©Forex.Academy

Categories
Crypto Market Analysis

Crypto Picks Review: EOS and VEN

EOS/USD

Crypto Picks Review: EOS/USD increased significantly after the breakout above the sliding line (SL1) of the minor ascending Pitchfork as expected (EOS Bullish Perspective), (EOS reached a major target, now what?). It has increased as much as 23.0290 level where it has found a very strong resistance.

EOS/USD chart - forex academy

The price dropped significantly and failed to stay above the second warning line WL2 and above the 250% Fibonacci line. The rate decreased today, signalling a selling pressure after the failure to retest the 250% Fibonacci line. EOS/USD failed to stay above the 18.6850 former high and now could drop further in the short term.

It could increase and approach the previous high only if it makes a valid breakout above the 250% Fibonacci line. The minor drop is natural and was somehow expected after the impressive rally. A valid breakdown below the first warning line (wl1) will confirm a further drop.

VEN/USD

The VEN/USD has increased as expected (VeChain broader increase validated) and has reached an important upside target. The rate is bullish and is targeting other major upside levels.

VEN/USD crart - forex.academy

The next upside targets will be at the first warning line (WL1) of the descending Pitchfork and higher at the first warning line (wl1) of the minor ascending pitchfork. This scenario will happen as long as the rate will stabilize above the broken upper median line (uml) of the minor ascending pitchfork. Only a breakout above the next targets will signal a larger upside movement.

©Forex.Academy

Categories
Crypto Market Analysis

VEN/BTC Further Increase Could Be Confirmed

VEN/BTC pair is strongly bullish right now, but only a valid breakout will validate a further increase.

VeChain (VEN)

Market Cap. $2.57B

Circulating Supply:525.78M VEN

Max Supply: 0 VEN

Volume (24h) $120.84M

VEN/USD = $4.8790


VEN/BTC could resume its bullish movement if it really manages to make a valid breakout. Price is trading in the green and resumed the yesterday’s bullish candle. The rate goes up after the breakout from the Falling Wedge pattern. VEN/BTC is trading at 0.00054630 level and seems determined to approach and reach some very important resistance levels soon.

VEN/BTC Further Increase Could Be Confirmed

Price increased sharply after the retest of the 50% Fibonacci level and now is trading well above the 38.2% retracement level. The upside movement is natural after it has escaped from the Falling Wedge and retested the 61.8% retracement level.

I’ve drawn a minor black ascending pitchfork to catch the upside movement. The rate has finally managed to make a valid breakout above the 50% Fibonacci line (ascending dotted line) of the minor pitchfork. It should take out the resistance from the median line (ml) as well.

VEN/BTC retested the lower median line (lml) and failed to close below it or on it signaling a significant upside movement.

You should know that a valid breakout above the median line (ml) will confirm a further increase towards the upper median line (uml). Resistance can be found at the 50% Fibonacci line of the minor ascending pitchfork, at the sliding line (SL) of the major ascending Pitchfork and higher, at the 23.6% retracement level.

Conclusion

The VEN/USD should increase further if it makes a valid breakout above the median line (ml). A further increase will be invalidated only by a valid breakdown below the outside sliding line (sl2) of the major ascending pitchfork. Price could approach the 0.00081678 swing high if it makes a valid breakout above the sliding line  (SL).

©Forex.Acedemy

Categories
Crypto Market Analysis

Verge – is this a buy or a sell?

Verge (XVG)

Market Cap. $1.02B

Circulating Supply: 14.94B XVG

Max Supply: 16.56B XVG

Volume (24h) $51.78M


Verge (XVG) Price Prediction:

XVG/USD moves sideways in the short term and seems undecided. Verge price is trading in the red right now and resumed the yesterday’s bearish candle. It is pressuring a dynamic support so that a valid breakdown will bring us a selling opportunity.

However, we may have a buying opportunity if the rate will have enough bullish energy to jump and stabilize above a dynamic resistance. I will show you two potential scenarios, a selling one, and a buying opportunity.

Verge (XVG) Price Prediction:

The rate could drop significantly if will close below the lower median line (LML) of the ascending pitchfork and if will come higher to retest it and the sliding line (sl) or the 505 Fibonacci line (descending dotted line).

So, it could drop at least till the median line (ml), a valid breakdown will send the rate towards the 0.02331280 former low and towards the lower median line (lml).


I’ve added another Daily chart to show you what could happen if the rate will remain within the ascending pitchfork’s body. XVG/USD it should climb much higher in the upcoming period if it will jump and will close above the sliding line (sl) and the 50% Fibonacci line (descending dotted line).

The last corrective phase could be completed, and the rate could approach and reach fresh new highs if the LML will hold and will keep the rate within the ascending pitchfork’s body.

Conclusion

The corrective phase was natural after the false breakout above the ML of the ascending Pitchfork and after the failure to close near this line. You can go short on this crypto if it makes a valid breakdown below the LML of the ascending pitchfork.

We may have a buying opportunity if the rate will climb above the sliding line (sl). The upside targets will be at the upper median line (uml), at the median line (ML) and much higher at the UML.

©Forex.Academy

Categories
Crypto Market Analysis

Is The NEO/BTC Poised To Climb Higher?

NEO (NEO)

Market Cap. $4.95B

Circulating Supply: 65M NEO

Max Supply: 100M NEO

Volume (24h) $144.05M


NEO/BTC decreased a little today and failed to resume the yesterday’s minor increase. Right now is premature to talk about the next move because is located between two crucial obstacles. It remains to see the breakout direction.

The crypto pair is trading at 0.008192 level after the failure to stabilize above the 0.009000 psychological level. Price has shown an overbought signal, but we still need a confirmation that the rate will turn to the upside and will reach new highs.

 NEO/BTC Forex Academy

The NEO/BTC has found strong support at the 61.8% retracement level. It has retested it showing that the buyers could take the lead again in the short term. Price has managed to breakout from the descending pitchfork’s body and above the first warning line (WL1).

Unfortunately, the crypto pair failed to stabilize above the downside 50% Fibonacci line (ascending dotted line) and above the 50% Fibonacci level signaling a minor exhaustion.

The rate has tested and retested the broken warning line (WL1), and now he’s moving away. NEO/BTC could come down to retest the sliding line (SL) before will try another breakout above the 50% level and above the 50% Fibonacci line. A breakdown from the red ascending pitchfork’s body will confirm a further drop.

Conclusion

You could go long on this crypto pair after a valid breakout above the 50% Fibonacci line (ascending dotted line). The near-term target will be at the median line (ML), while the major upside target will be at the upper median line (UML) and the 0.015200 highest high.

©Forex.Academy

Categories
Crypto Market Analysis

STEEM_Further_Increase_Awaits_Confirmation

Steem (STEEM)

Market Cap. $909.33M

Circulating Supply: 254.27M STEEM

Max Supply: 0 STEEM

Volume (24h) $96.44M


We had very high volatility on the STEEM/USD today. The crypto dropped aggressively in the morning, but the bulls have stepped in and have forced the rate to increase again. Price is trading in the green right now and has managed to increase by 2.47%  and by 21.82% in the last 7-days.

As you already know, the crypto market crashed today after the last period rebound. Steem maintains a bullish perspective on the Daily chart despite the today’s drop.


You can see that the rate was close to reach and retest the 50% Fibonacci line (ascending dotted line). Price has rallied and erased the morning losses, but it has failed to close and stabilize above the median line (ML) of the major ascending pitchfork and the 3.63158182 static resistance.

STEEM/USD it was expected to increase after the failure to test and retest the lower median line (LML) of the ascending pitchfork. It will move towards the 6.00000000 psychological level if will make a valid breakout above the median line (ml) of the ascending pitchfork.

The cryptocurrency will resume the upside movement and could be attracted by the upper median line (UML) if will close and will stabilize above the median line (ML).

Conclusion

Price squeezed in the second part of the day and now is trading in the green again. You can go long on this crypto after a valid breakout above the median line (ML). The next major upside target will be at the upper median line (UML), while the Stop Loss could be placed below the 2.52287131 level.

©Forex.Academy

Categories
Forex Market Analysis

April 25 – Global Stocks Slips as Bond Yields Rises above 3%


S&P 500 – Daily Outlook

The U.S. stock market index SPX is trading at 2,631.25, down -4.25 points and -0.17%. Recalling our previous update, the index was trading in an overbought zone below 2,680 before falling down. It has already completed 61.8% retracement, and it’s likely to face support above 2,616.


Support     Resistance
2619.84     2670.44
2604.21     2686.07
2578.91     2711.37
Key Trading Level: 2645.14


Nikkei – Daily Outlook

Japan’s Nikkei dipped -62.80 points to trade at 22,215.32 on Wednesday. Most of the selling trend began in response to a weakness in the Wall Street soured risk sentiment. While the investors focused remained on rising bond yields.

Technically, the index has formed a double top pattern up at 22,350 which is likely to hold Nikkei below 22,350. The 50 periods moving average is suggesting a bullish bias with a significant support at 21,850.


Support     Resistance
22184.88      22303.38
22148.28      22339.98
22089.03     22399.23
Key Trading Level: 22244.13

That’s pretty much it for now. I hope you are ready for some action tomorrow in the wake of ECB policy decision. European Central Bank is due to release the monetary policy with wide expectations of no change in minimum bid rate. However, the press conference will be a key market mover. Don’t forget to watch it.

©Forex.Academy