Syscoin (SYS)
Market Cap: $265.04M
Circulating Supply: 533.32M SYS
Max Supply: 888M SYS
Volume (24h) $3.45M
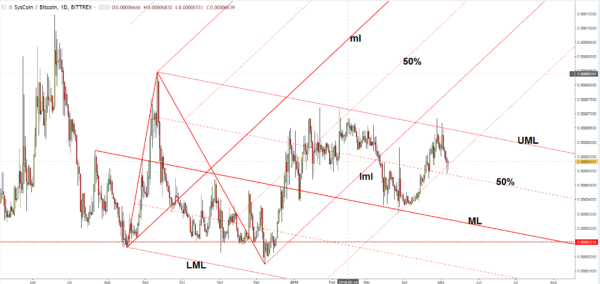
The SYS/BTC dropped aggressively in the last days and has reached an important support level. The bearish momentum was paused for the moment and is premature to talk about a significant rebound at this moment. Right now will be better to stay away because we don’t have a clear direction, but I really hope that we’ll have a great trading opportunity very soon.
The SYS/BTC has made two false breakouts above the upper median line (UML) of the descending pitchfork. The current drop is natural but remains to see how long this could be. We may have a perfect buying opportunity from above the upper median line (UML) of the descending pitchfork.
So, a rebound from here and a valid breakout from the descending pitchfork’s body will signal a further increase in the upcoming period. You can see that the 150% Fibonacci line represents a very strong dynamic support and could stop the retreat.
A drop below the 150% Fibonacci line will signal a further drop, and it could slip much below the 50% Fibonacci line as well, and it could be attracted by the median line (ML) again.
Price moves in range on the daily chart, that’s why only a valid breakout from the descending pitchfork’s body will signal a further increase and a breakout from the extended sideways movement.
Conclusion
The Syscoin dropped significantly after the false breakouts above the UML. Technically, it was somehow expected to climb much higher after the several failures to reach and retest the median line (ML) of the descending pitchfork. We’ll have an important upside target at the lower median line (lml) of the ascending pitchfork.
©Forex.Academy


