PIVX (PIVX)
Market Cap. $317.45M
Circulating Supply 56.12M PIVX
Max Supply: 0 PIVX
Volume (24h) $4.65M
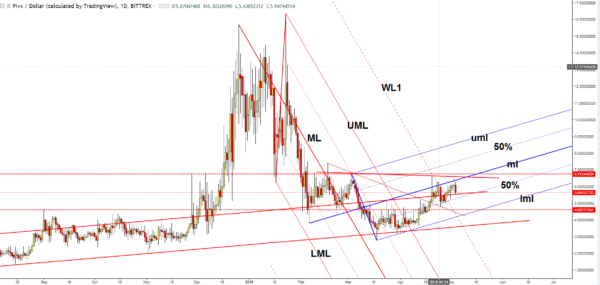
PIVX/USD dropped sharply today and failed to make a resumption of the bullish movement. The current drop could invalidate a further increase even if the perspective remains bullish on the short term.
Today’s drop has invalidated the latest day’s gains, but it could be stopped by the near-term support levels. We may have a great buying opportunity only if the rate makes a valid breakout above the near-term resistance levels.
You can see that the rate made another false breakout above the median line (ml) of the minor ascending Pitchfork. Technically, it was expected to climb much higher after the breakout above the first warning line (WL1) of the descending Pitchfork.
It could come back down to test and retest the 50% Fibonacci line (ascending dotted line) of the ascending pitchfork. Only a drop below this dynamic support will send the rate much lower in the short term.
The perspective will remain bullish as long as the rate is trading within the ascending pitchfork’s body. Only a breakdown will signal a further drop in the upcoming weeks and months.
Conclusion
You should buy it only after a valid breakout above the minor red line, above the median line (ml) and above the 6.75144524 static resistance level. The next upside target will be at the upper median line (UML). However, it will increase much more if the Inverse Head and Shoulders will be validated.
©Forex.Academy


