Introduction
Until now, we discussed a bunch of trading strategies that were based on numerous technical indicators. In today’s article, we discuss a strategy that is based on a candlestick pattern. Flags and Pennants are short-term continuation patterns where the market tends to continue moving in the same direction after the formation of the pattern on the chart. These patterns are found on both short-term and long-term charts.
In the case of Flag, the initial move is a sudden, sharp directional move. It is doesn’t matter where the move is formed on the chart; what matters here is the velocity of the move. If the movement is not sharp and large, the reliability of the pattern will be under question. However, it will also use the volume indicator to confirm the strength of the Flag and pattern. Let us understand all the specifications of the strategy in detail.
Time Frame
As mentioned earlier, the Pennant-Flag strategy can be traded on time frames varying from 15 min to ‘Daily.’
Indicators
The only indicator we will be is the ‘Volume’ indicator. The rest of all is based on candlestick and price action patterns.
Currency Pairs
The strategy can only be used on major currency pairs listed on the broker’s platform. Few preferred pairs are EUR/USD, USD/JPY, GBP/USD, GBP/JPY, EUR/JPY, etc.
Strategy Concept
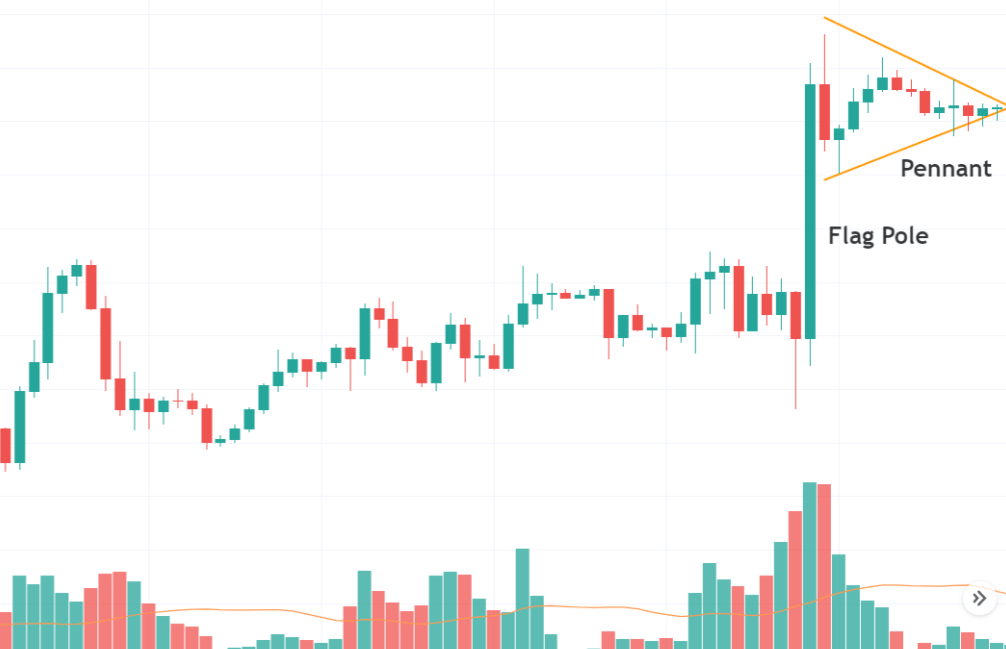
The strategy is based on the concept of the Pennant Candlestick Pattern. A sharp thrust creates a flagpole, and then when the market begins to consolidate into an asymmetric triangle, we wait for a breakout or breakdown. The consolidation is a brief pause before a potential break on either side. If the price clears the top of the ‘Pennant,’ we look for ‘long’ trades, and if breaks below the bottom of the ‘Pennant,’ we look for ‘short’ trades.
After a large vertical flagpole and a triangular consolidation, the market might be getting ready for a further continuation. The odds of a breakout increase when this pattern is accompanied by high volume. In a bullish flagpole, we place our ‘entry’ order above the ‘high’ of the flagpole, and in a bearish flagpole, we place our order below the ‘low’ of the Flag. Of course, when we enter, we’ll need to place a stop.
The stop is calculated by measuring the number of pips that is equivalent to 35-40 percent of the flagpole. For example, if the height of the flagpole is 100 pips, the stop will be placed 25 beneath the entry point.
Finally, we will need to define exits for our trade. Our first target will be equal to the number of pips that we are risking on the trade. Another strategy is to trail the stop-loss trade and exit when the market shows signs of reversal. Let us look at the specifics of the pattern and technique to make winning trades.
Trade Setup
In order to explain the strategy, we have considered the 4-hour chart of EUR/USD, where we will be illustrating a ‘long’ trade. Here are the steps to execute the strategy.
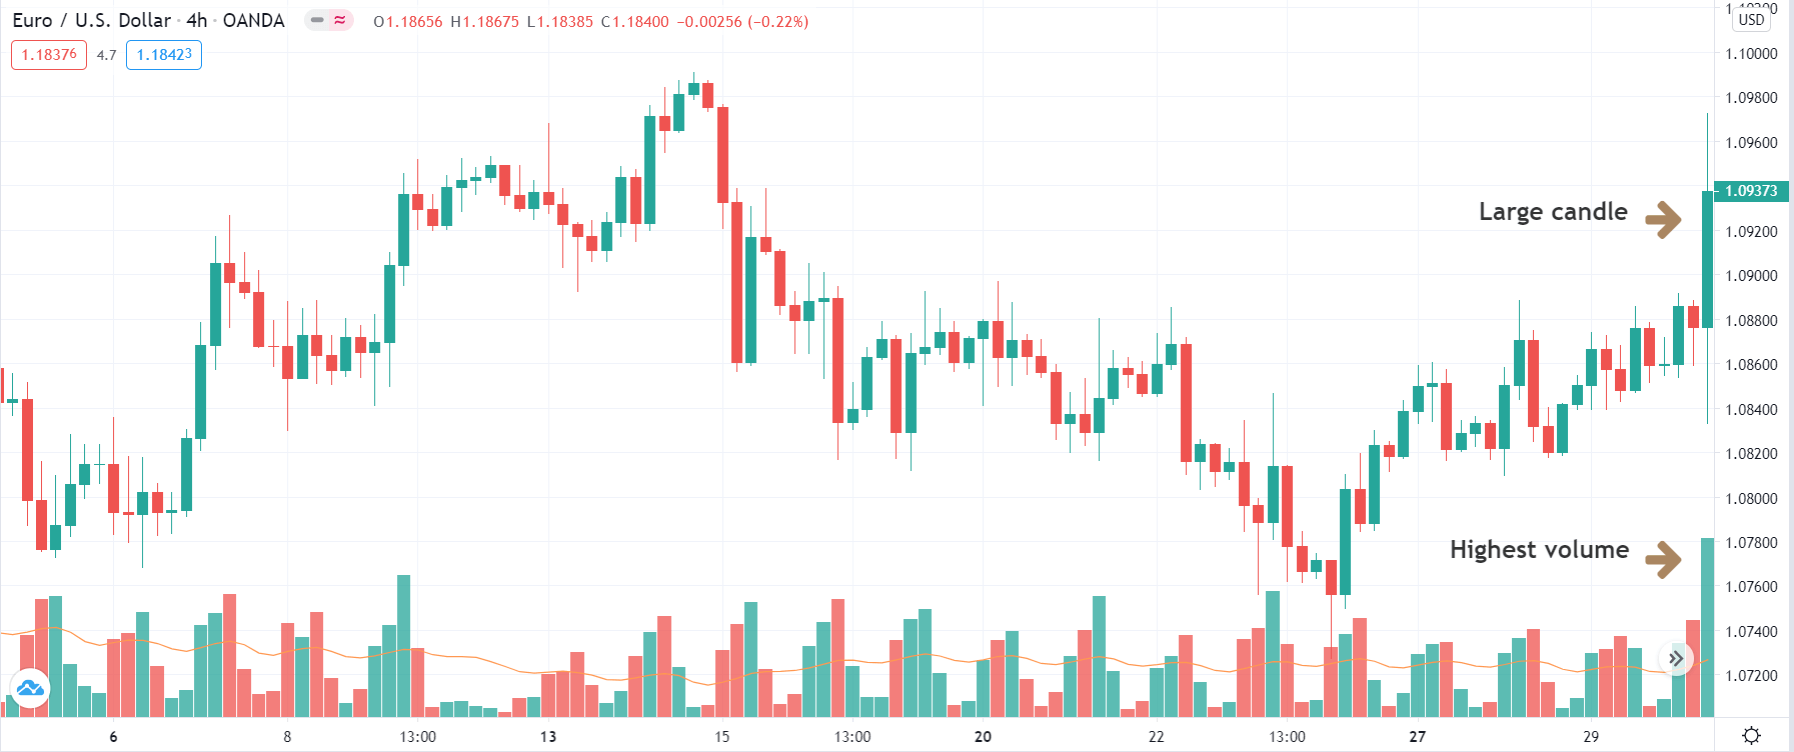
Step 1: The first step of the strategy is to wait for a sharp, sudden, and strong candle to show up on the chart. This usually happens after a major news announcement or after the release of economic data. This candle should compulsorily be with high volume as it indicates that big players of the market created this move. If the candle is not with high volume, the move cannot be trusted upon. We could use the economic calendar to find out the exact time of news release and the event.
In the below image, we can see a large candle that popped up after a news announcement that took the prices sharply higher.
Step 2: After the sudden move, prices should necessarily move in a triangular pattern, which is shrinking in nature. Few traders also refer to this as ‘squeeze.’ This pattern should be formed on the lower time frame. Market moving in this ‘squeeze’ pattern is very important for the strategy to work at its best. This leads to the formation of a Pennant candlestick pattern. Pennants involve two parts – a vertical flagpole and a triangular consolidation. The consolidation is usually for a shorter duration of time. Once the pattern has been formed along with the necessary conditions, let us see how to enter a trade.
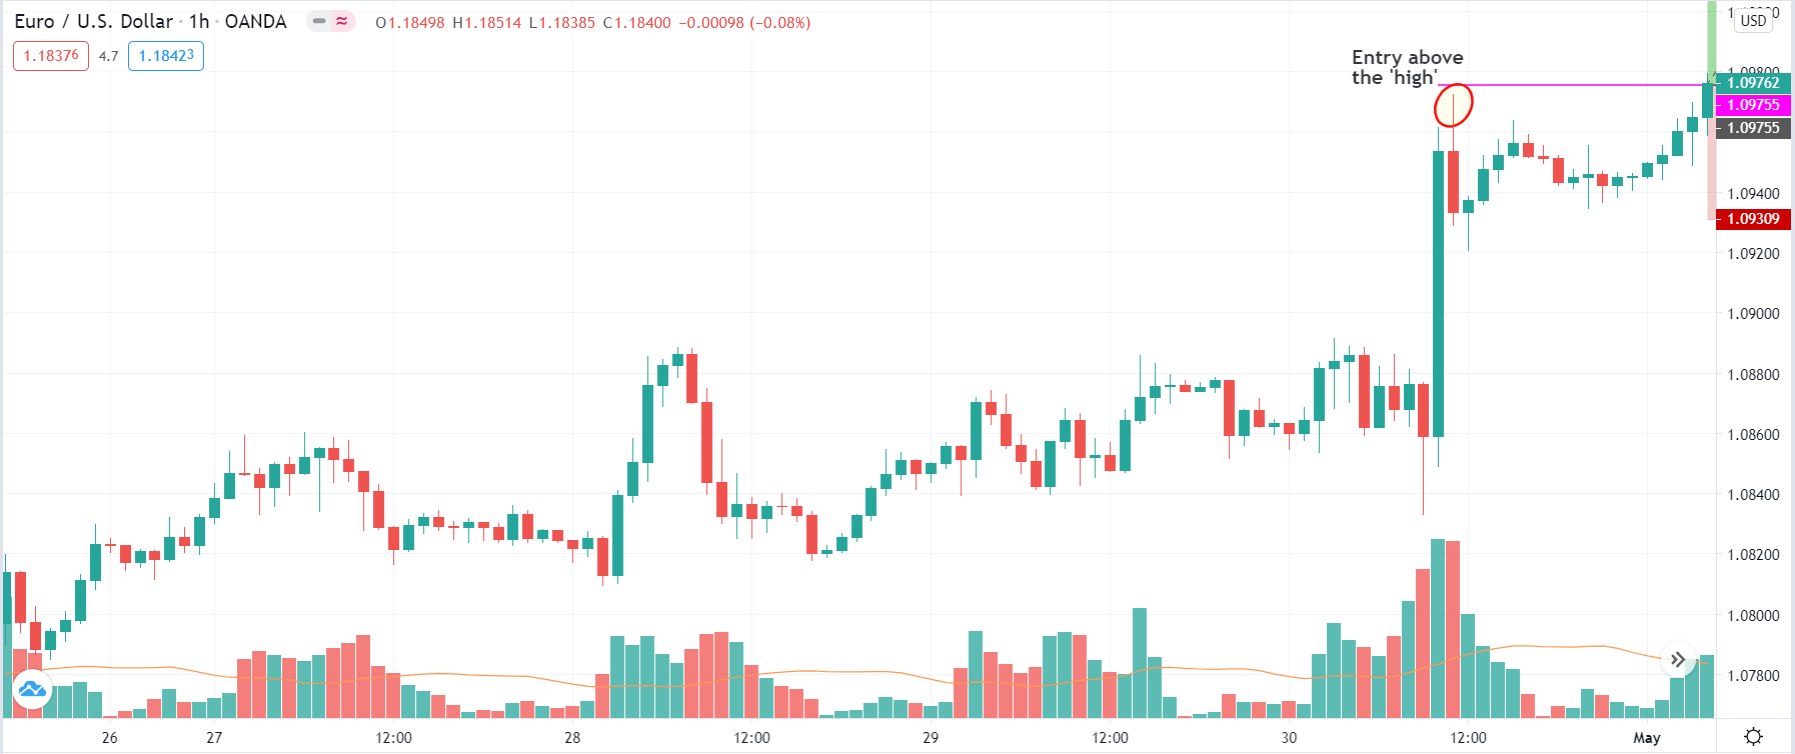
The below image shows the formation of a Pennant candlestick pattern on the 1-hour chart.
Step 3: The rules of ‘entry’ are pretty simple. In a bullish setup, we place a ‘long’ entry order just above the ‘high’ of the ‘flagpole’ candle formed on the higher time frame. In a bearish setup, we place a ‘short’ entry order just below the ‘low’ of the ‘flagpole’ candle. As and when the market continues to move in the direction of the ‘flagpole,’ the order will automatically be executed.
In the case of our EUR/USD example, our ‘buy’ order gets executed as soon as prices start moving higher.
Step 4: Now, let us define the exit rules for the strategy. The stop-loss is calculated by the number of pips equal to 35-40 percent of the ‘flagpole.’ Stop-loss is placed below the entry price equivalent to the pips obtained by calculation. The ‘take-profit’ is set a price where the resultant risk to reward of the trade is 1:1. Therefore, the take-profit is determined by the stop-loss. Another exit strategy is to trail the stop loss and exit after we witness a reversal pattern in the market.
Strategy Concept
The idea behind this technique is not to place most trades but to place the best trades. The most crucial aspect of the trade is the ‘Flagpole’ candle. We need to ensure that this candle is a consequence of a major news announcement and not just a normal candle. Many traders become impatient and enter even though all criteria have not been met. Patience and discipline will help us to avoid falling into this trap and keep us on the course.


