
Introduction
A trading strategy is a systematic methodology of investment that can be applied in any financial market, for example, bonds, stocks, futures, commodities, forex, and so on. In this context, a profitable trading strategy is more than a system that provides an entry signal on the long or short side with a stop-loss and a profit target.
Big traders make money to take their investment decisions systematically, reducing their risk with the diversification of the assets that make up their portfolio.
In this educational article, we’ll present a set of elements that can be part of a trading strategy.
The Elements of a Trading Strategy
A systematic trading strategy should be tested and validated with historical data, and its execution in the real-market should be done with the same accuracy as when using paper money.
The strategy should provide a setups series that allow us to recognize where to locate the market entry and in which direction. Finally, the trading strategy should allow market positioning in the long and short sides. This positioning should require identifiable stop-loss and profit target levels.
In particular, in this article, we’ll present the use of Fibonacci, candlesticks formations, chart patterns, trend lines, and trend channels.
Fibonacci Analysis
Likely, Fibonacci retracements and extensions are the most used tools in the world of retail and institutional trading. The Fibonacci series has its origin from the mathematical problem of the rabbits’ population solved by Leonardo da Pisa “Fibonacci” in his work “Liber Abaci” published in 1202.
The sequence discovered by Fibonacci not only can be applied in the rabbits’ population growth, but this series also solves other growth problems in nature and also on the financial markets.
Fibonacci and Corrections
One application of the Fibonacci tools in financial markets is the measurement of a retracement size that an impulsive wave may experience in its corrective move.
The rationale of this strategy considers that when the initial impulsive movement ends and following the subsequent corrective move, the market will develop a second impulsive move in the same direction of the first move.
The selection of the asset is linked to the timeframe under analysis; for example, the structure developed in a weekly chart will require more time than an hourly chart formation.
The following figure illustrates two potential entry setups using the Fibonacci retracement tool. The first scenario considers a retracement of 38.2% of the first move. The second scenario will occur when the price experiences a retracement of 61.8% from the top of the first impulse.
The stop-loss will be placed at the origin of the previous impulsive movement.

Setting Targets with Fibonacci Extensions
Prices extensions are movements that resume the progress of a previous trend. Generally, the extensions occur in the third wave, and the correction corresponding to the second wave does not move beyond the origin of the first impulsive movement. The next figure exposes the extension of a regular three-wave pattern. Consider that the wave identification does not correspond to an Elliott wave labeling.
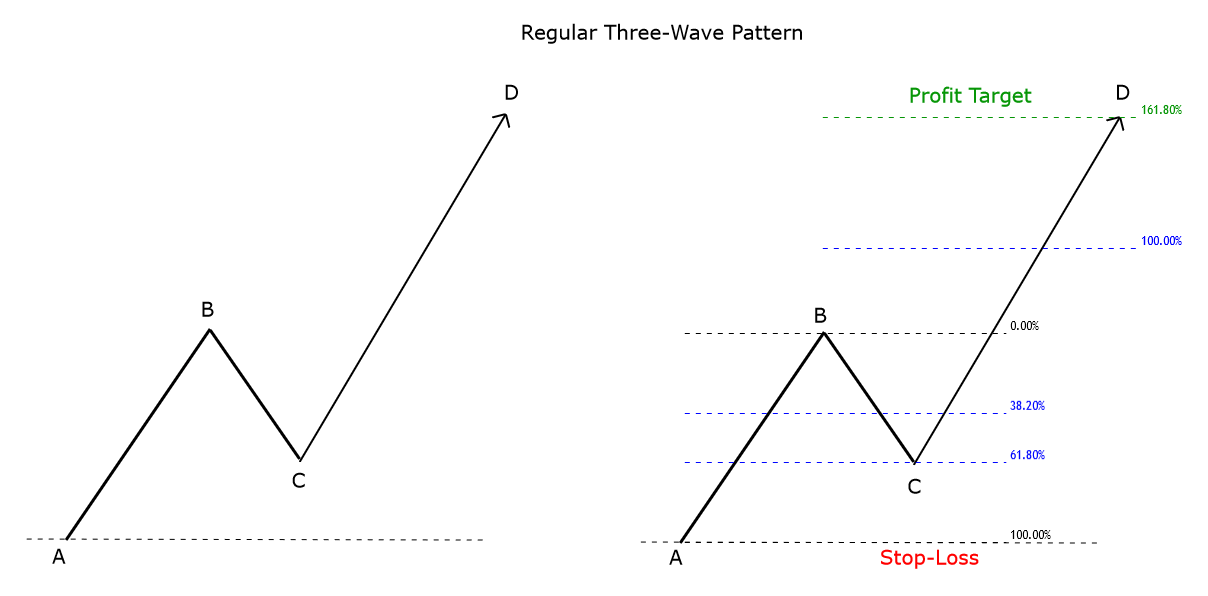
The analytic process follows the next steps:
- After an impulsive move, the price action must develop a minimum retracement of the first move.
- The size of the swing must be multiplied by the Fibonacci ratio of 1.618.
- The resulting level will correspond to the price target of the third wave.
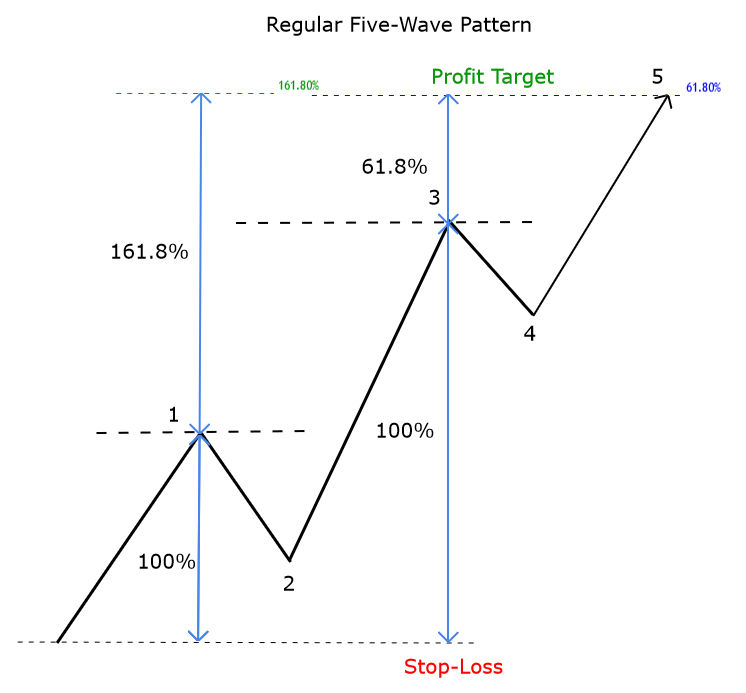
The analysis in a five-wave pattern is similar to the three-wave case. The difference in this pattern is the seek the length of an additional impulsive move.
The five-wave pattern includes three impulsive movements and two corrective moves. The following figure illustrates the Fibonacci measures of this formation.
The Phi-Ellipse
The Phi-Ellipse is a countertrend trading method based on the oscillation of price with time. Its goal is to reduce the noise of falses breakouts and increase the stability of the investment strategy. The drawing process of a Phi-Ellipse requires to identify three points, as shown in the next figure.
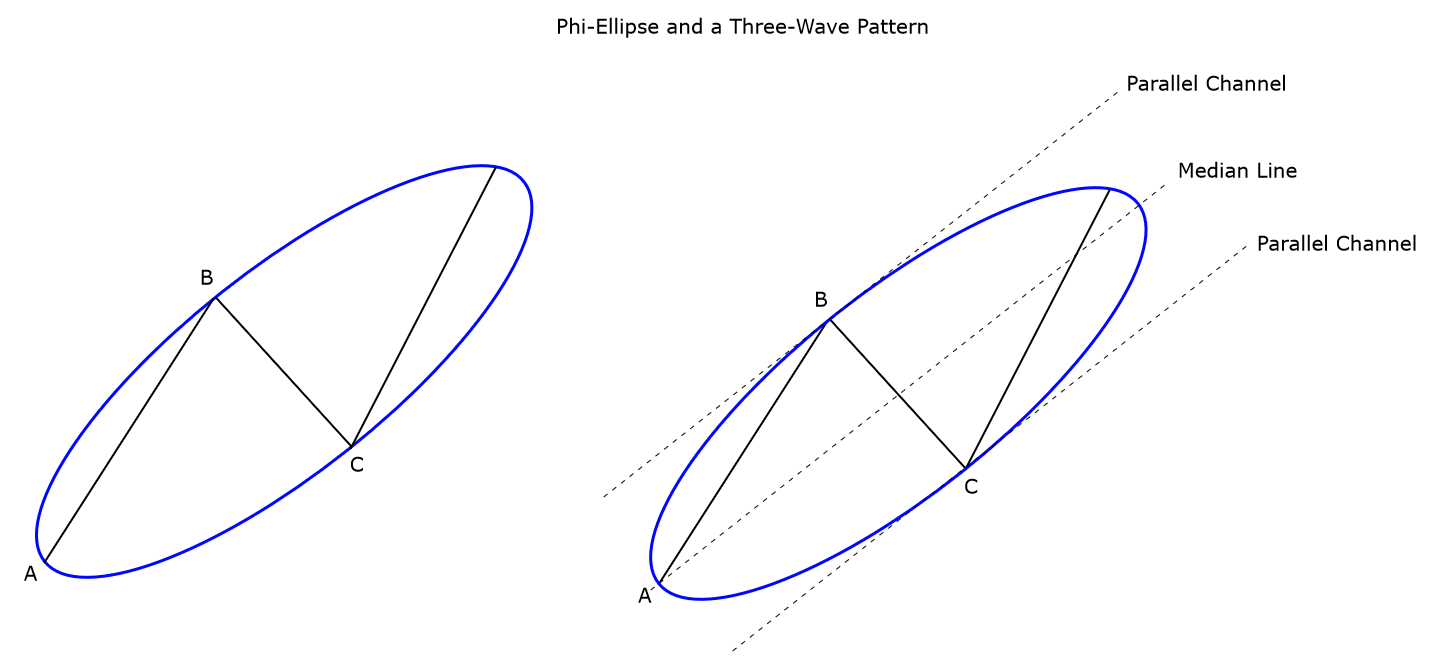
After identifying the points A, B, and C, in a regular three-wave pattern, there should place the Phi-Ellipse in these points. We should expect a new impulsive move as the first impulse. There are three ways to trade against the trend at the end of the Phi-Ellipse, which are:
- Enter in a position when the price breaks outside the perimeter of the Phi-Ellipse.
- Entry based on a chart pattern at the end of the Phi-Ellipse.
- Place an order when the price action when the price moves outside a parallel line to the median line of the Phi-Ellipse.
- A buy position is recommended at the end of the Phi-Ellipse when it has a descending slope, and a sell position is recommended when the Phi-Ellipse has an upward slope.
Conclusions
In this educational article, we discussed the elements that should contain a trading strategy. The application of a systematic trading strategy or a combination with a strategy across time in a diversified portfolio could help the investor reduce the risk in its investment decisions.
On the other hand, the strategy’s analysis methodology should provide entry-setups for both long and short-side positions. In this context, in this article, we presented the use of Fibonacci retracements and extensions to offer entry setups inlcuding its stop loss and profit target level. Finally, we introduced the Phi-Ellipse method, which allows the investor to reduce the risk of falses breakouts in its investment portfolio.
In the next educational article, we will review the use of candlesticks formations, chart patterns, trend lines, and trend channels.
Suggested Readings
– Fischer, R., Fischer J.; Candlesticks, Fibonacci, and Chart Patterns Trading Tools; John Wiley & Sons; 1st Edition (2003).