
The German index DAX 30 contains the 30 biggest German public companies traded in the Deutsche Böerse. In this article, we will review what to expect from the German index for the coming weeks.

The Big Picture
DAX 30, in its two-week chart, shows the price action progress of the index from the lowest level it touched in early March 2009. Once the DAX found buyers at the 3,585.8 points, the price rallied until 13,602 points when the German index completed the wave III labeled in black.
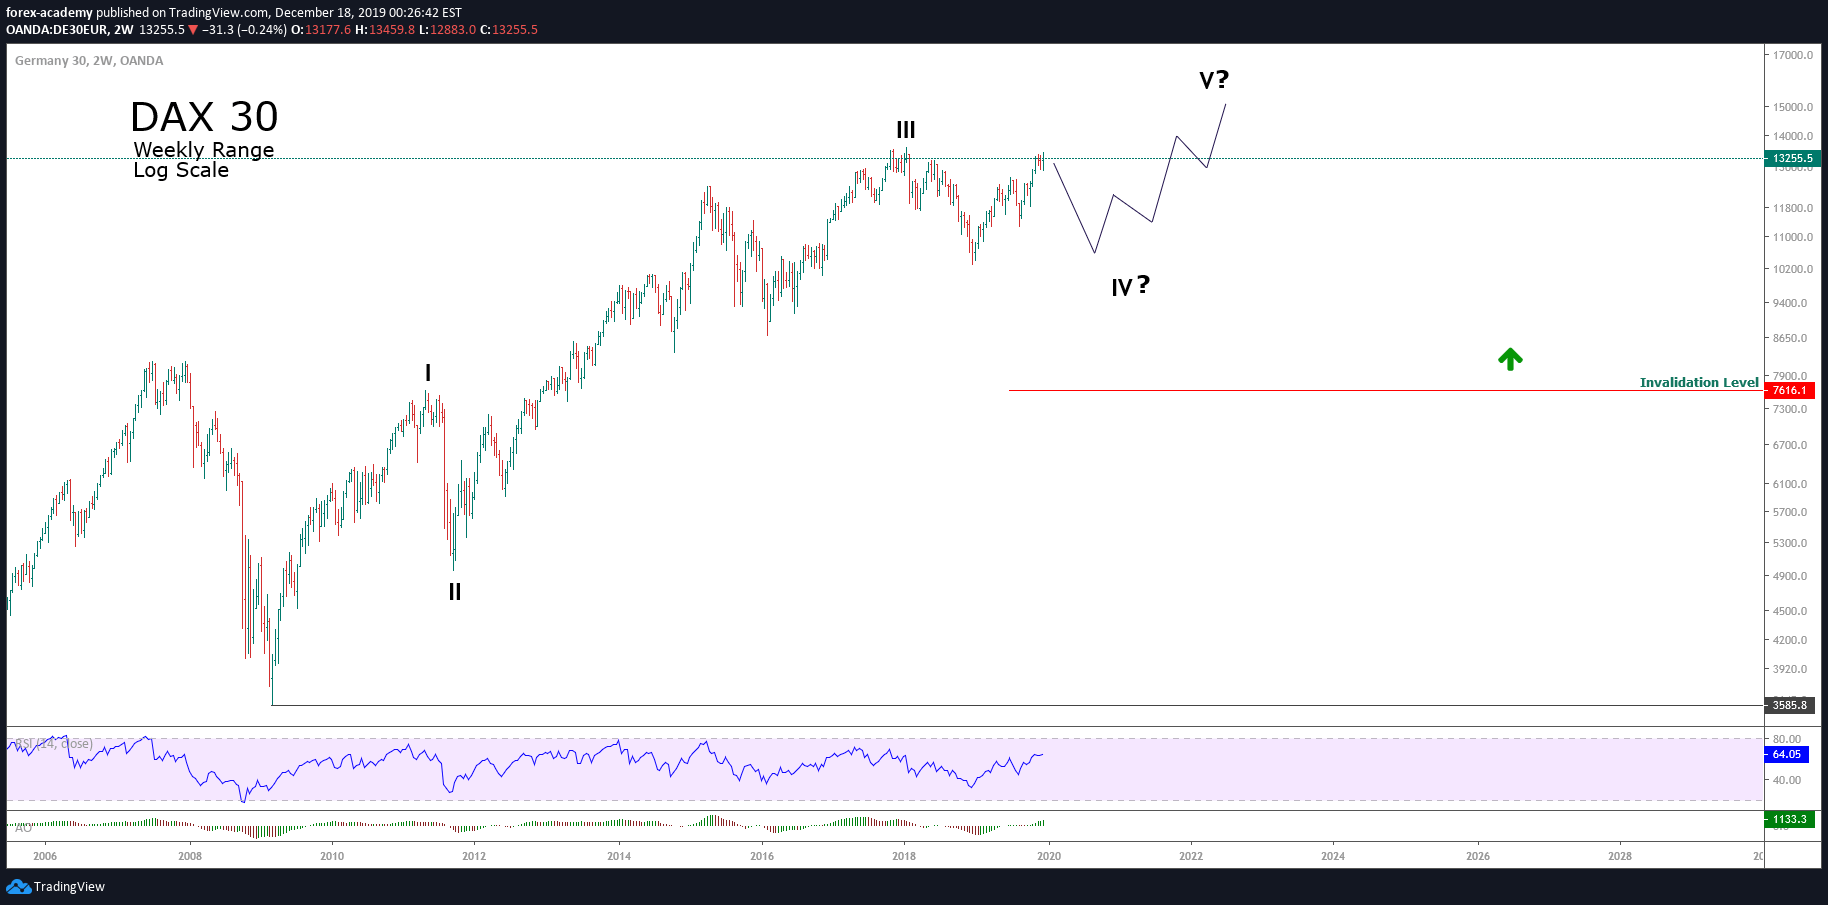
Since the March 2009’s low, the price moved in a bullish impulsive sequence that is still incomplete. The German index has already completed three waves of Primary degree, labeled in black. Currently, the price is running in its wave IV, also labeled in black.
The First Scenario
As we discussed in a previous article, scenarios allow us to analyze the likelihood of different “what if?” viewpoints.
The first possible scenario showed on the daily chart consists if wave IV is complete with the corrective move as an (A)-(B)-(C) sequence ended at 10,279.1 points.
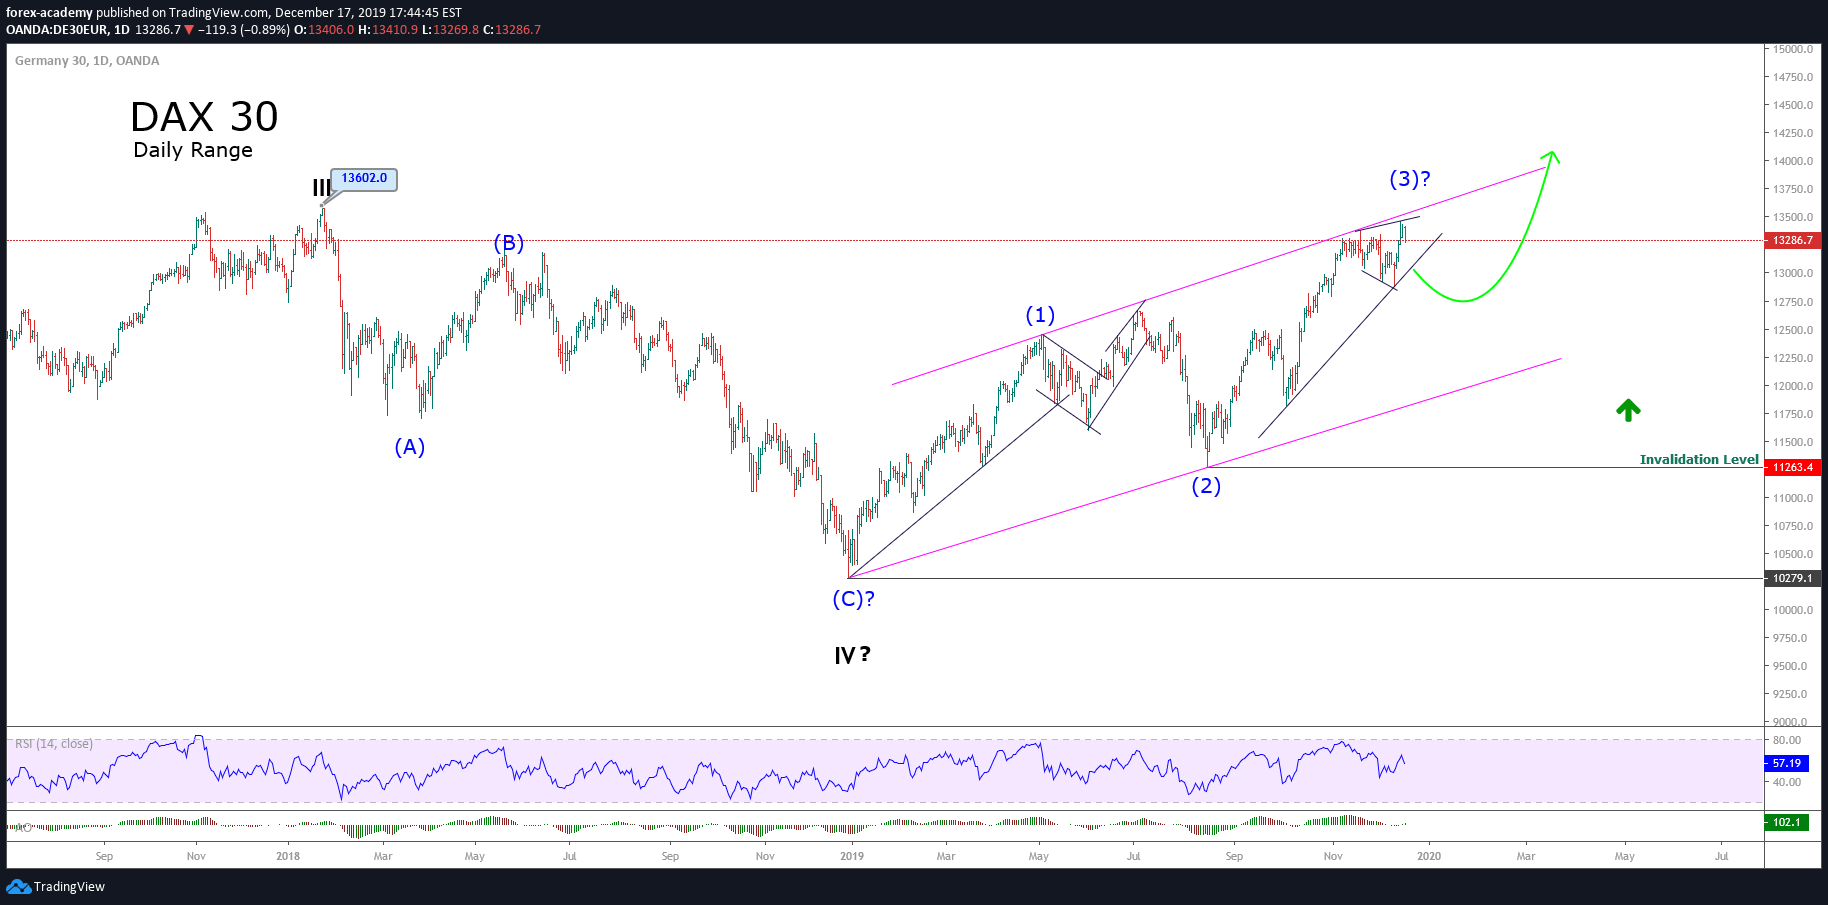
Thus, a first approximation to the current path could be a possible ending diagonal pattern in progress. If this scenario is valid, the DAX should be moving in a wave (3) (labeled in blue), and we must assume that this wave is incomplete.
Consequently, the next leg should have a limited decline, and bringing the way for a new bullish movement as a wave (5).
The Alternative Count
The second scenario proposes an alternative count. In this case, the daily chart shows the price action moving in an incomplete wave (B), labeled in blue.
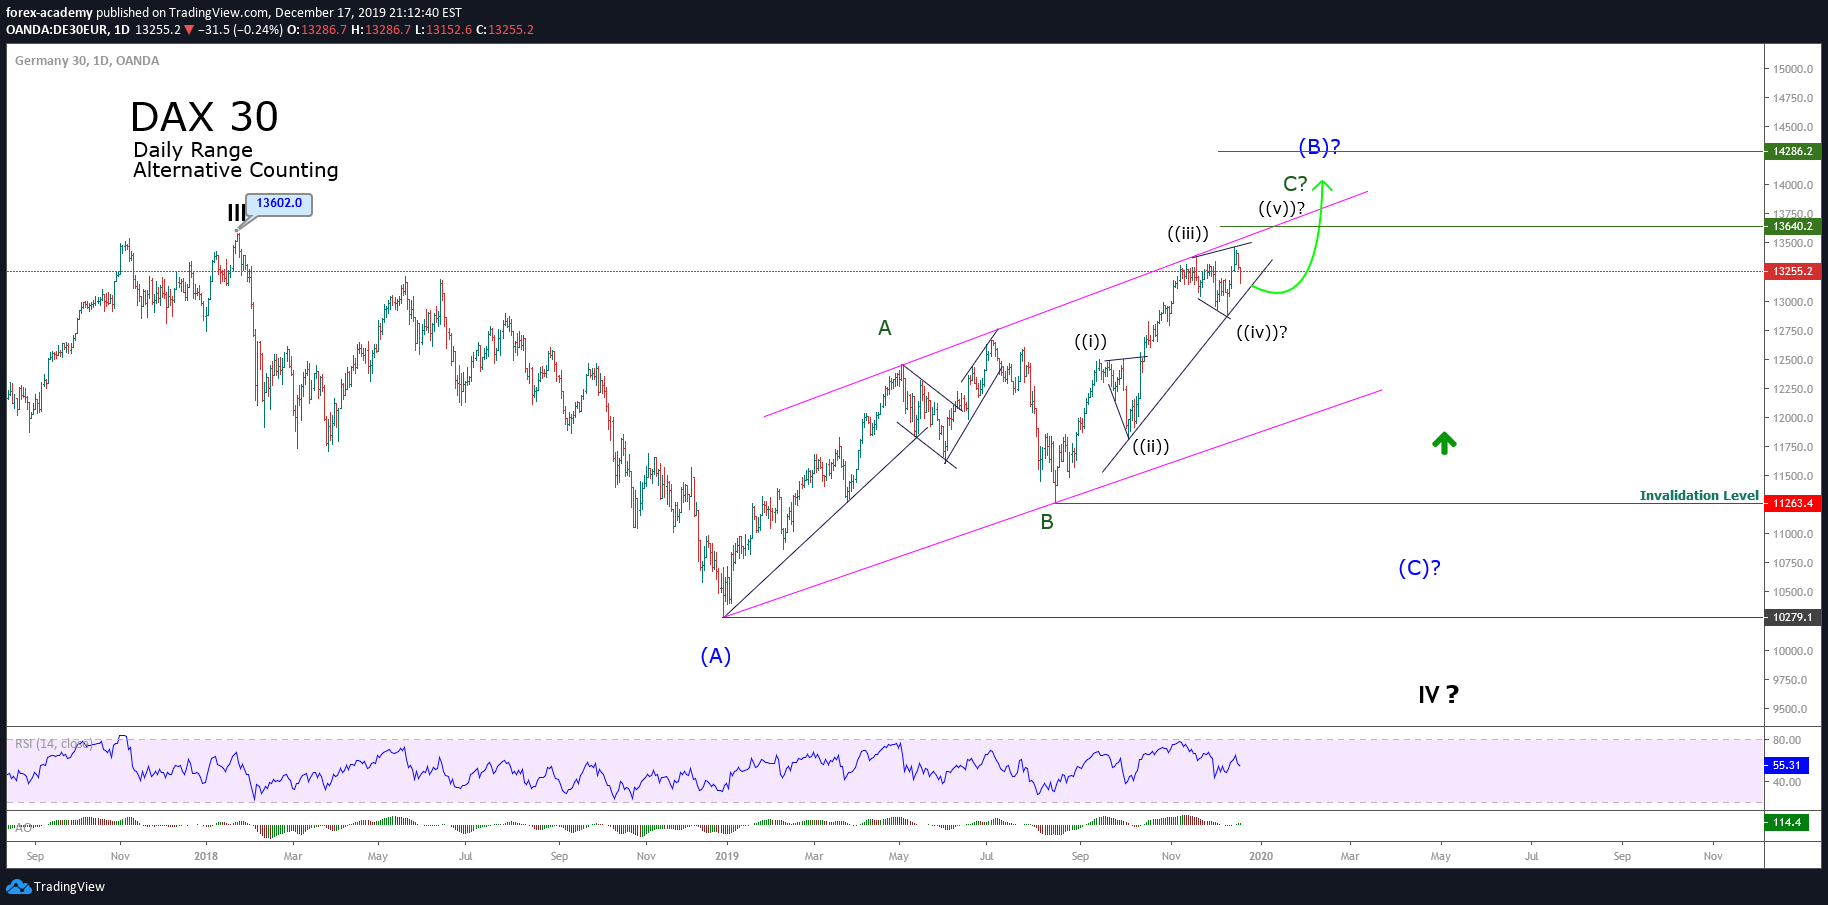
In this context, as the wave (B) is incomplete, the price action is running in an internal leg identified as wave C labeled in green. At the same time, wave C is incomplete and should finish the waves ((iv)) and ((v)) of Minute degree labeled in black.
According to the Elliott Wave Principle, under this scenario, DAX could be developing an irregular flat formation. This structure is characterized by following an internal sequence divided into 3-3-5, and the price tends to surpass the previous relevant high, in this case, located at 13,602 points.
If this scenario is valid, the price should develop a downward wave (C), which could drive to DAX to re-test the zone of the last Christmas low at 10,279 points.
The Conclusion
Both scenarios proposed to grant us the likelihood of a marginal upside and, then, a corrective move. However, the extension of the next path will confirm the Elliott wave structure that corresponds.
Probably, DAX will extend its gains over the 14,000 points, reaching a new all-time high before starting a deeper corrective move. This movement to the upside could emerge as a three or five wave structure, depending on which scenario is right, as stated above.