
Before defining what multiple timeframe analysis is, we first need to understand what timeframe in forex means.
What is Timeframe in Forex?
In the forex market, the timeframe shows the change in a currency pair’s price over a given period. For example, a 1-minute timeframe shows how the price of a given currency pair changes minute by minute, while a 1-month timeframe shows monthly changes in the pair’s price.
No matter which trading platform you use when trading forex, there are several timeframes provided. For example, the screengrab below of an MT5 platform shows the different timeframes provided to forex traders.
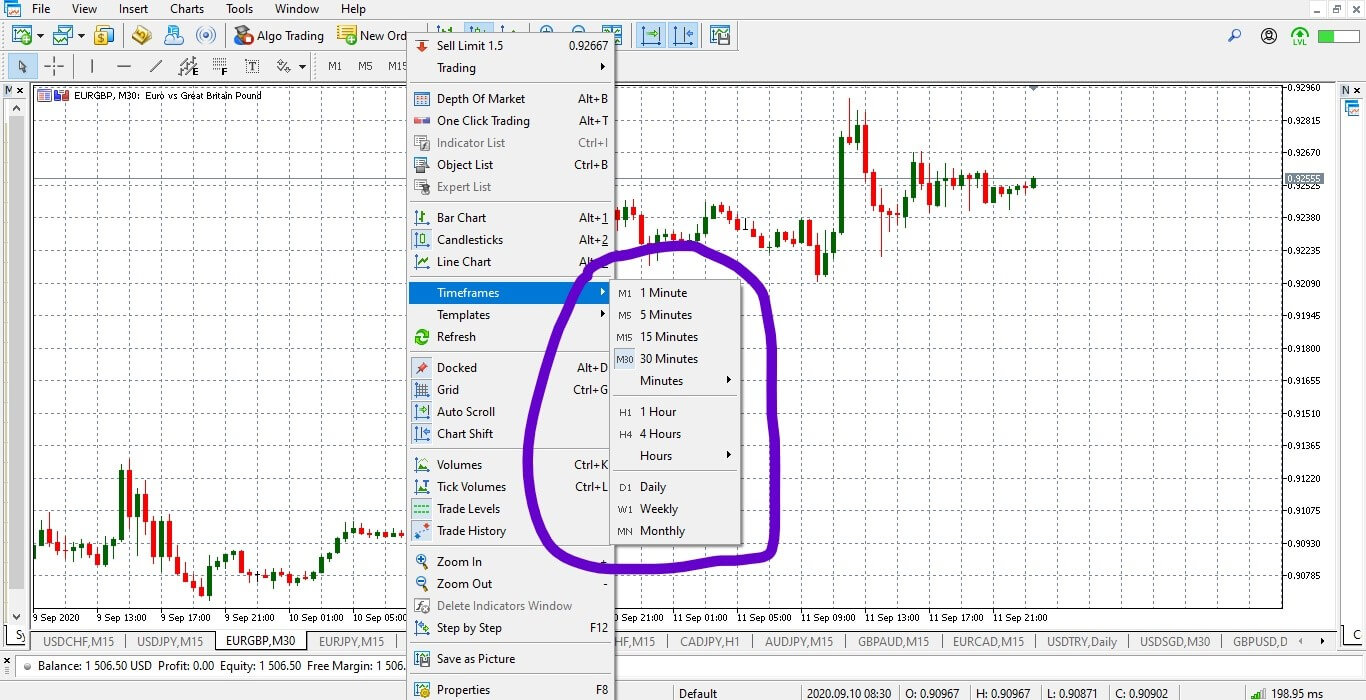
Therefore, in the forex market, multiple timeframe analysis is a chart analysis technique that involves observing a currency pair’s trend under different timeframes.
Importance of Multiple Timeframe Analysis in Forex
Another type of forex trader would employ a different timeframe analysis to determine their trade entry and exit positions. Any forex trader knows that the price of a currency fluctuates continuously. Thus, the trend observed in a 1-minute timeframe will be different from the 5-minute timeframe and so forth. The table below shows different timeframes for different types of forex traders.
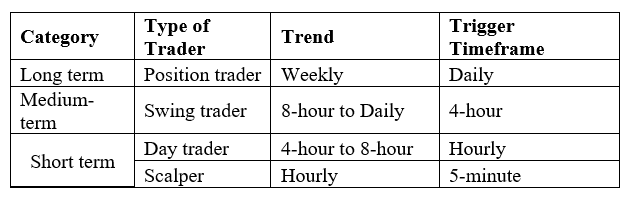
In timeframe analysis for forex markets, it is advisable to adopt a top-down technique. This technique involves beginning your analysis with a larger timeframe, depending on your trading style, to establish the overall price trend. Subsequent smaller timeframes then follow to show how the observed trend can be broken down to find preferable entry points.
Let’s take a forex day trader, for example. Such traders do not hold an open position overnight. Thus, for their timeframe analysis, they would start with the 8-hour timeframe, then to 4-hour the 1-hour timeframe.
With multiple timeframe analysis in forex, the larger timeframes, like the 1-month timeframes, are used to show a longer-term trend of a currency pair. In a single glance, you can see how the pair has been trading for years.
GBP/USD 1-Month Timeframe Analysis
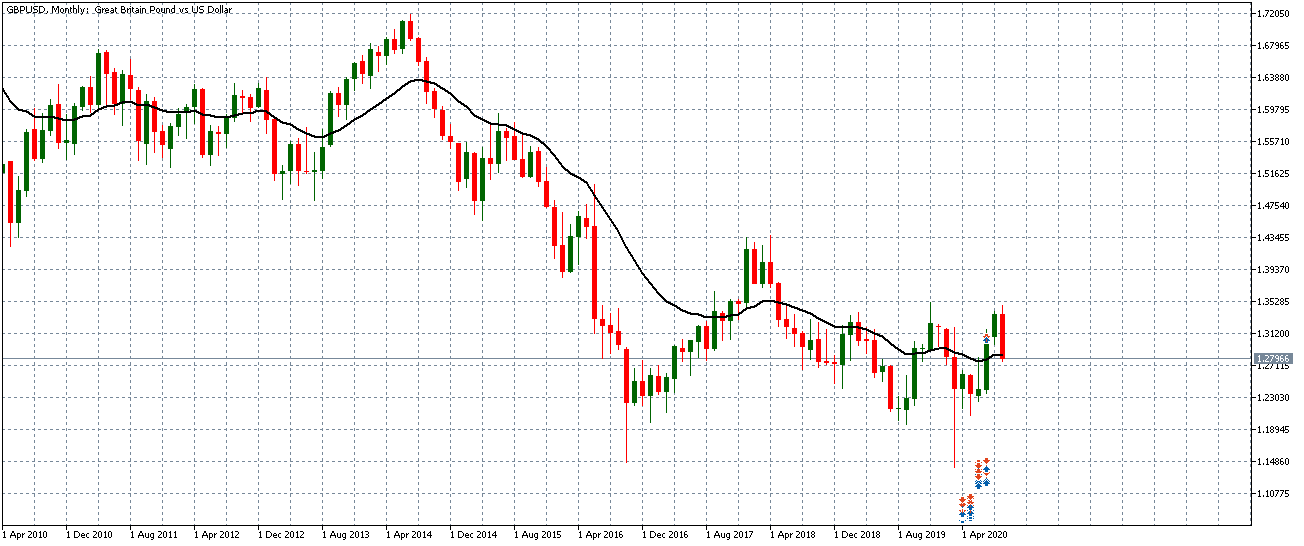
From the above 1-month chart of the GBP/USD, you can notice the pair’s longer-term downtrend from August 2014 to August 2020. Short timeframes are ideal for showing the more recent changes in the price of a pair. Most forex traders use shorter timeframes to find opportunities to enter a trade and identify ideal exit points.
[wp_quiz id=”89128″]