
The cryptocurrency market has had more of a steady day as cryptos were trying to find a level to consolidate at. Bitcoin is currently trading for $9,300, which represents an increase of 0.37% on the day. Meanwhile, Ethereum gained 1.61% on the day, while XRP gained 2.43%.

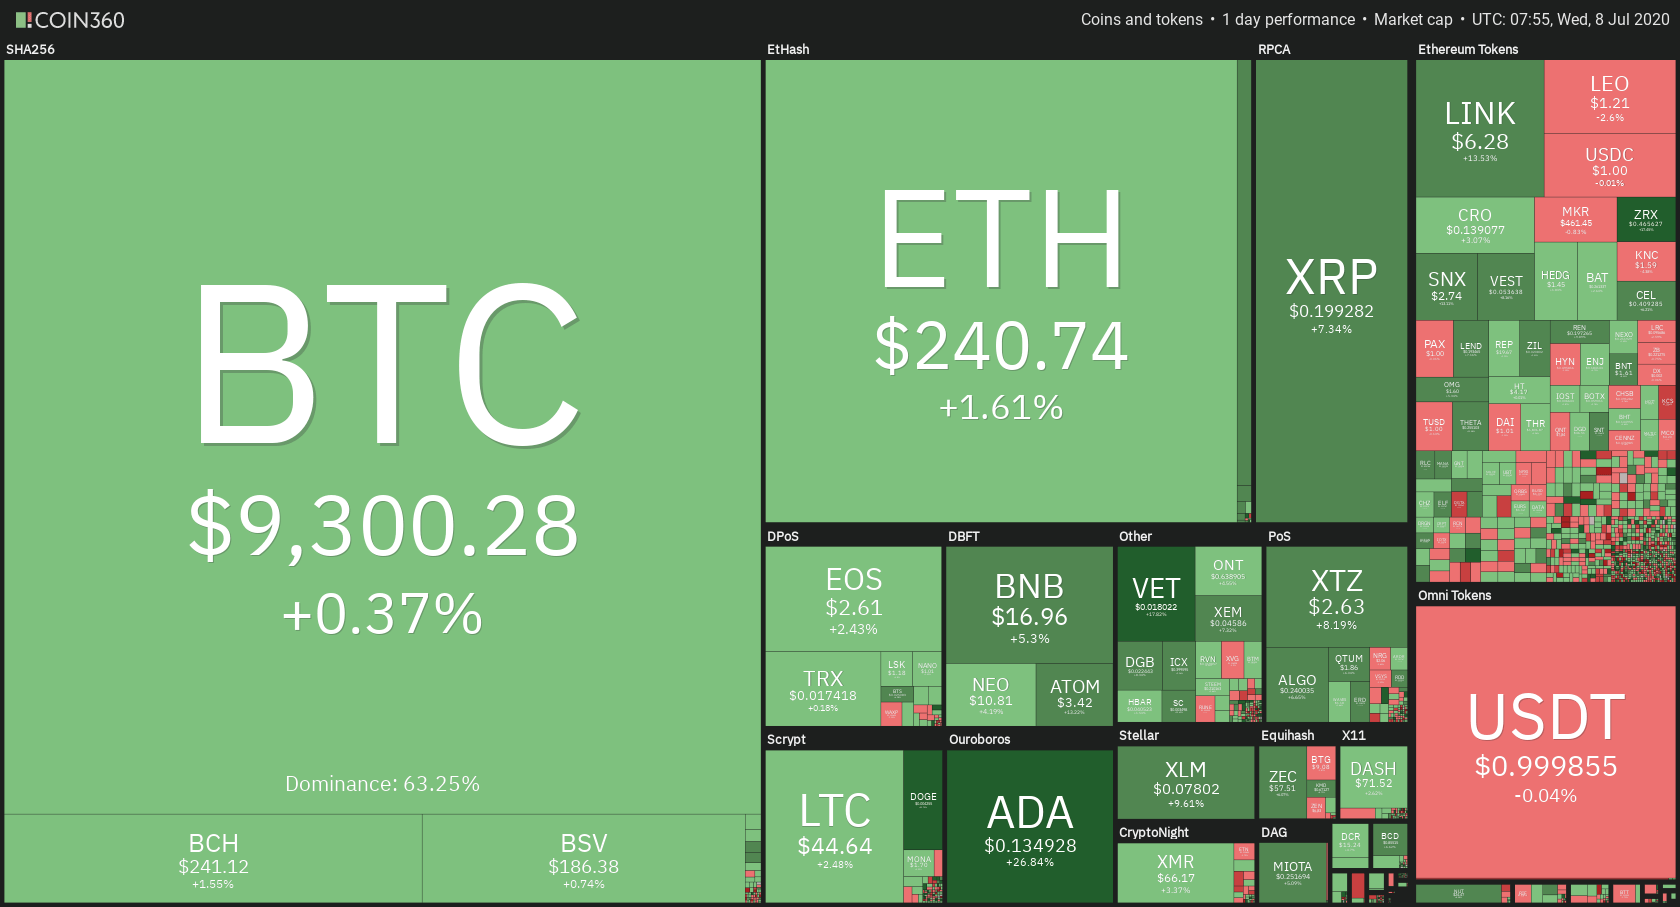
Daily Crypto Sector Heat Map
When talking about top100 cryptocurrencies, Dogecoin gained 54.43% on the day, making it by far the most prominent daily gainer. Cardano (27.36%) and VeChain (18.52%) also did great. On the other hand, SwissBorg has lost 6.68%, making it the most prominent daily loser. It is followed by KuCoin Shares’s loss of 5.48% and Verge’s loss of 4.84%.
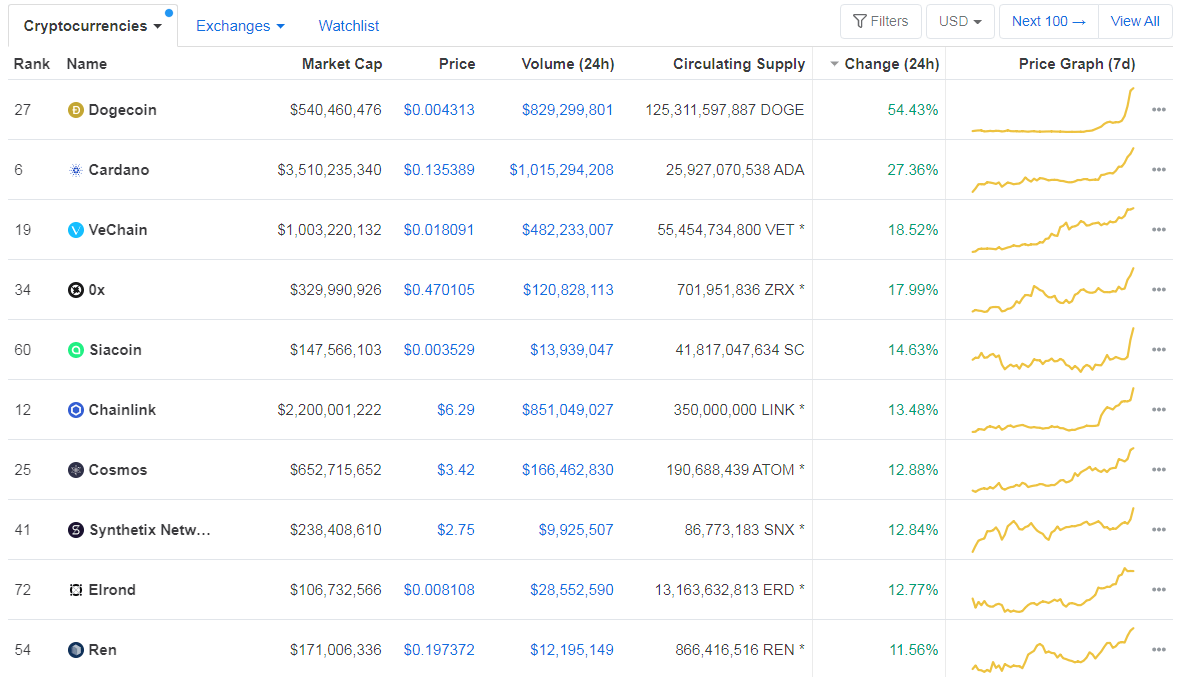
Top 10 24-hour Performers (Click to enlarge)
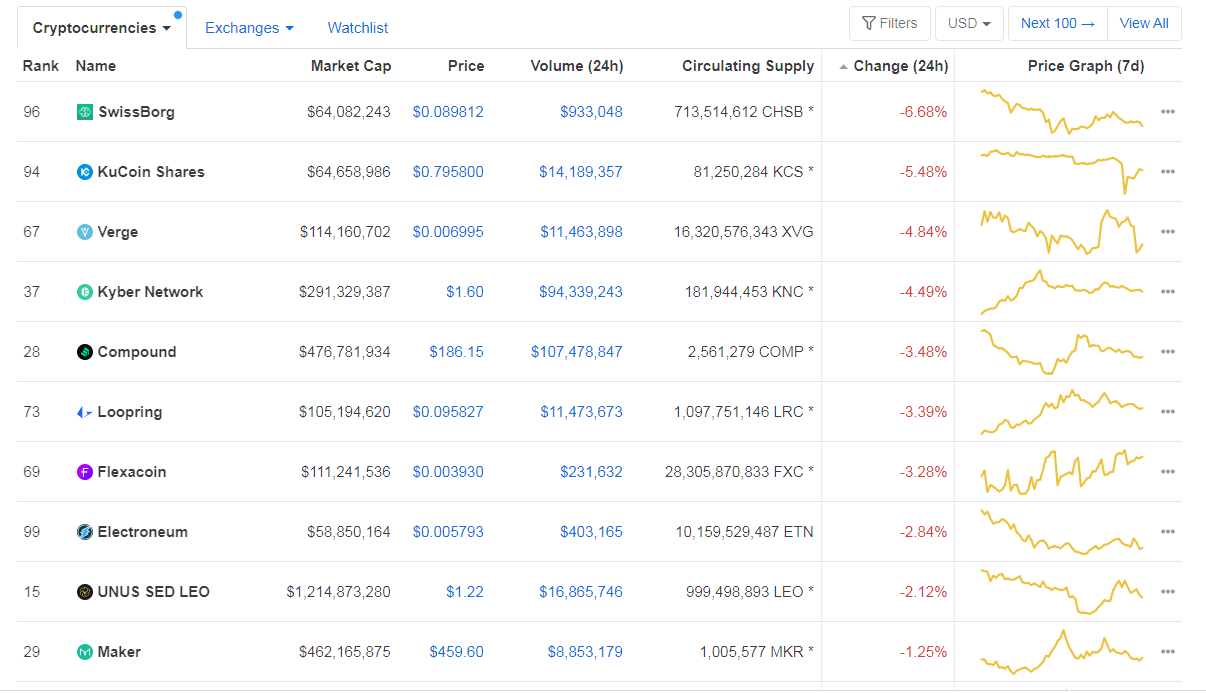
Bottom 10 24-hour Performers (Click to enlarge)
Bitcoin’s dominance level decreased since we last reported, with its value currently at 63.25%. This value represents a 0.88% difference to the downside when compared to yesterday’s value.
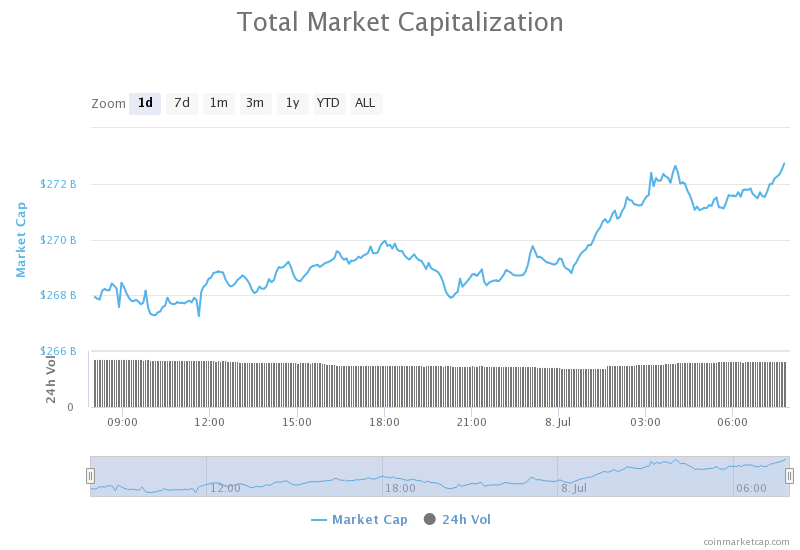
Daily Crypto Market Cap Chart
The cryptocurrency market capitalization increased slightly when compared to when we last reported, with the market’s current value being $272.15 68.74 billion. This value represents an increase of $3.41 billion when compared to the value it had yesterday.
_______________________________________________________________________
What happened in the past 24 hours?
_______________________________________________________________________
- Bitcoin Will Never Be Truly Private Says Andreas Antonopoulos (Cointelegraph)
- Bitcoin and Ethereum futures volume fell dramatically in June (The Block)
- South Korea Considers Blockchain-Run Free Trade Zone (Cointelegraph)
- Nearly $60M in Bitcoin Moved to Ethereum in June (Coindesk)
- Crypto Exchanges See Big Drop in Volumes as Bitcoin Volatility Approaches 2020 Low (Coindesk)
- Coinbase Exec Says Capital Will Flee US Due to Crypto Tax Laws (Cointelegraph)
- Zoomers Push Dogecoin Up 20% in Viral TikTok Pump (Cryptobriefing)
- DeFi Hits $2 Billion for First Time, Yield Farming Platforms Pave the Way (Cryptobriefing)
- Rising stablecoin supply sets the stage for the crypto market to see a strong Q3 (Cryptoslate)
- Could a Cardano & Litecoin Team Up Be in the Works? (Cointelegraph)
_______________________________________________________________________
Technical analysis
_______________________________________________________________________
Bitcoin
The largest cryptocurrency by market capitalization has spent the day trying to find a place to consolidate at, as it seems like the move towards the upside ended as soon as BTC approached the descending line). While Bitcoin found support at $9,251, its support level and resistance level will soon clash, and Bitcoin will have to make a move.
Traders should look for what happens with Bitcoin’s price when the descending line forces a move on BTC.
BTC/USD 4-hour Chart
Technical factors:
- Price is above its 50-period EMA and its 21-period EMA
- Price is between the upper B.B. and middle line (20-period SMA)
- RSI at the upper levels (61)
- Average Volume
Key levels to the upside Key levels to the downside
1: $9,251 1: $9,120
2: $9,580 2: $8,980
3: $9,735 3: $8,820
Ethereum
Ethereum’s is in a slightly different spot when compared to Bitcoin. While its price advances have been stopped by the non-horizontal resistance level, Ethereum’s resistance line is going towards the upside. That opens up a lot of possibilities as ETH isn’t forced to make a move, but might rather choose to follow the line up.
Ethereum traders should look for an opportunity in range trading between the immediate support and resistance levels.
ETH/USD 4-hour Chart
Technical Factors:
- Price above the 50-period EMA and the 21-period EMA
- Price slightly below the upper B.B.
- RSI almost in the overbought territory (67)
- Increased volume
Key levels to the upside Key levels to the downside
1: $240 1: $228
2: $251.4 2: $225.4
3: $260 3: $217.7
Ripple
The third-largest cryptocurrency by market cap had an extremely volatile day. XRP managed to skyrocket from $0.183 all the way to $0.2 in one 4-hour candle. The move got stopped by the $0.2 resistance, under which XRP is currently consolidating. While it is highly likely that the move will end here, we might see an attempt of breaking $0.2 yet again.
XRP traders should wait and see what XRP does and look for retracements.
XRP/USD 4-hour Chart
Technical factors:
- XRP in a mid-term descending trend (though it broke the trend in the short-term)
- XRP lacks strong support levels below $0.178
- Price is above the 21 and 50-period EMA
- Price at the upper B.B.
- RSI is in the overbought territory (79)
- Increased volume
Key levels to the upside Key levels to the downside
1: $0.19 1: $0.178
2: $0.2 2: $0.147
3: $0.205
Related posts
 Daily Crypto Review, Mar 18 – Bitcoin will save the world from crisis, Tim Draper announces
 Daily Crypto Review, Apr 8 – BCH and BSV halving countdown; Cryptos consolidating after a move up
 Daily Crypto Review, Apr 15 – Libra vs Bitcoin again? Cryptos preparing for a move
 Daily Crypto Review, Apr 28 – Ethereum up 50% in 2020; Crypto market a safe haven?