Introduction
Previously, we discussed a strategy that was based on a single candlestick pattern that uses the concept of ‘rejection’ in the market. However, the pattern may not provide a great amount of success as does not take into consideration the various factors of the market such as trend, momentum, volume etc. In today’s article, we try to formulate a strategy that addresses some of the issues and increase the probability of success. To increase the probability of successful trades, we combine two candlestick patterns and a technical indicator to find trades.

The first candlestick pattern we will watch for is the ‘Rising Wedge Pattern’ that occurs in an uptrend. The same pattern, when observed in a downtrend, is called a ‘Falling Wedge Pattern.’ The second candlestick pattern that is of importance to us is the ‘Descending Triangle’ pattern which essentially confirms the commencement of a new trend in the market. Let us look into the specifications of the strategy.
Time Frame
The strategy is specially designed for trading on very short-term price charts such as the 5 minutes or 1 minute. That means this is a hardcore intraday trading strategy.
Indicators
We make use of just one technical indicator in the strategy, and that is the 20-period Exponential Moving Average (EMA).
Currency Pairs
As we are trading extremely on small time-frames, the strategy can be traded on major currency pairs only. Few preferred ones are EUR/USD, GBP/USD, USD/CAD, GBP/JPY, EUR/CAD, EUR/JPY, NZD/USD, and EUR/GBP.
Strategy Concept
The ‘Dual Candlestick Pattern’ strategy is a simple yet powerful strategy that can be used very often in the market. The strategy revolved around the concept of ‘momentum’, which is extremely crucial in the market. When we gauge the momentum of the market, we get an understanding of the shift in market sentiment. Nothing can be as superior as this when it comes to analysing the market sentiment. The first candlestick pattern gives us an indication that the market is losing the momentum of its current trend and that it could reverse any moment. The price action suggests that the market is unable to move higher, and the price is getting more and more expensive for buyers to take the market higher. Once this becomes evident after a reversal, the second candlestick pattern confirms that the reversal is ‘real’ and there could be further ‘legs’ in the trend.
Since we are waiting for many events to occur in the market, we will end up entering late, i.e. when the majority of the move has happened. Due to this, the risk-to-reward of trades executed using this strategy will not exceed more than 1:1. Even though the probability of occurrences of trades is less, they have a greater degree of accuracy.
Trade Setup
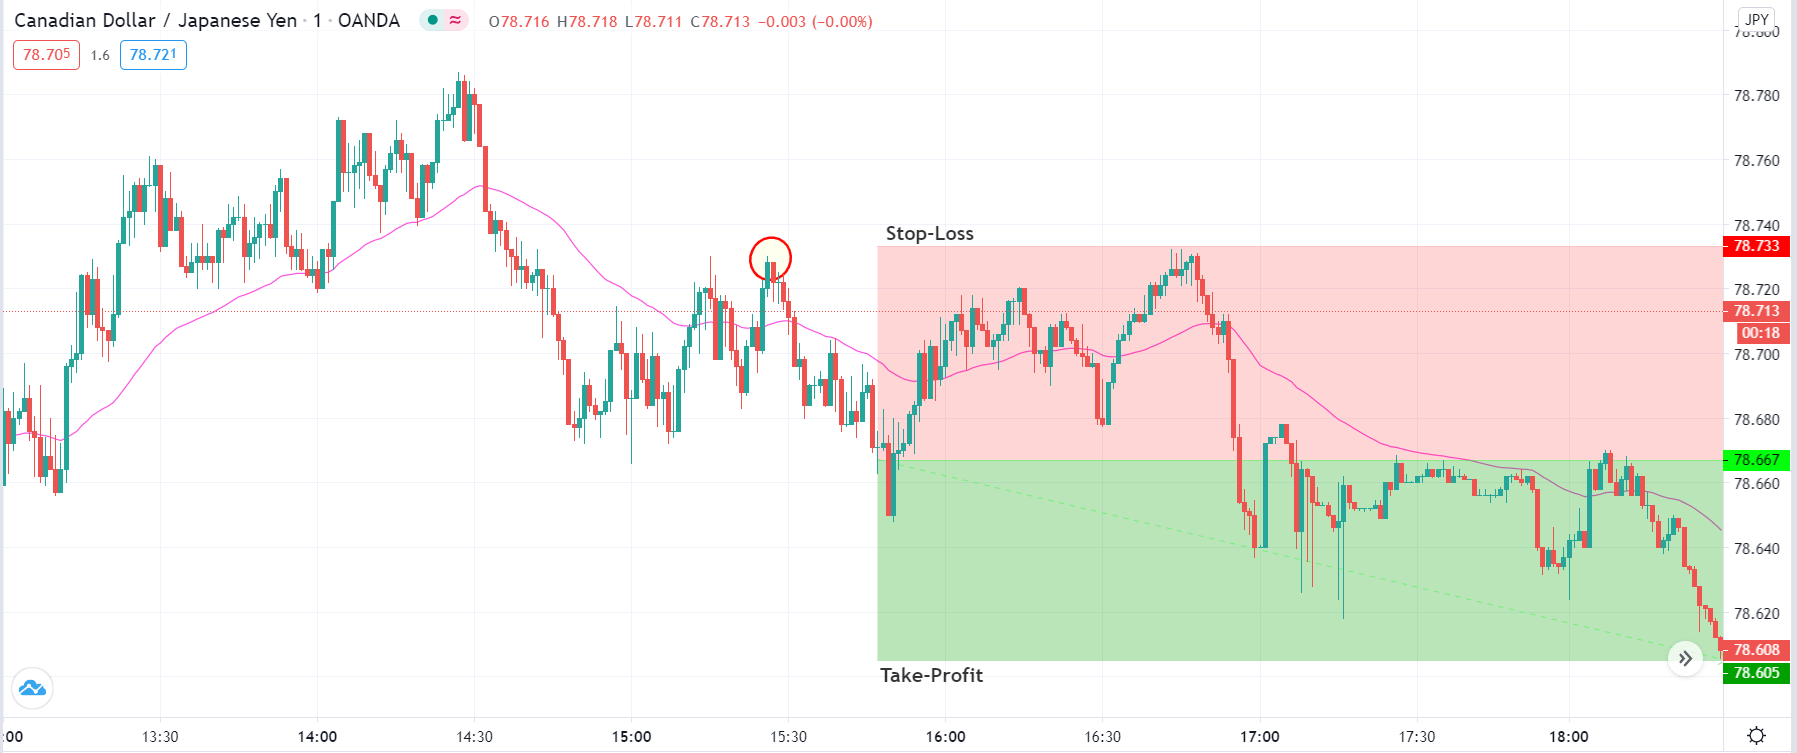
In order to execute the strategy, we have considered the 1-minute chart of CAD/JPY where we will be illustrating a ‘short’ trade. Here are the steps to execute the strategy.
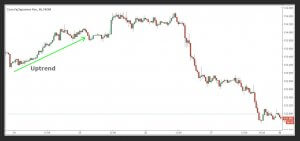
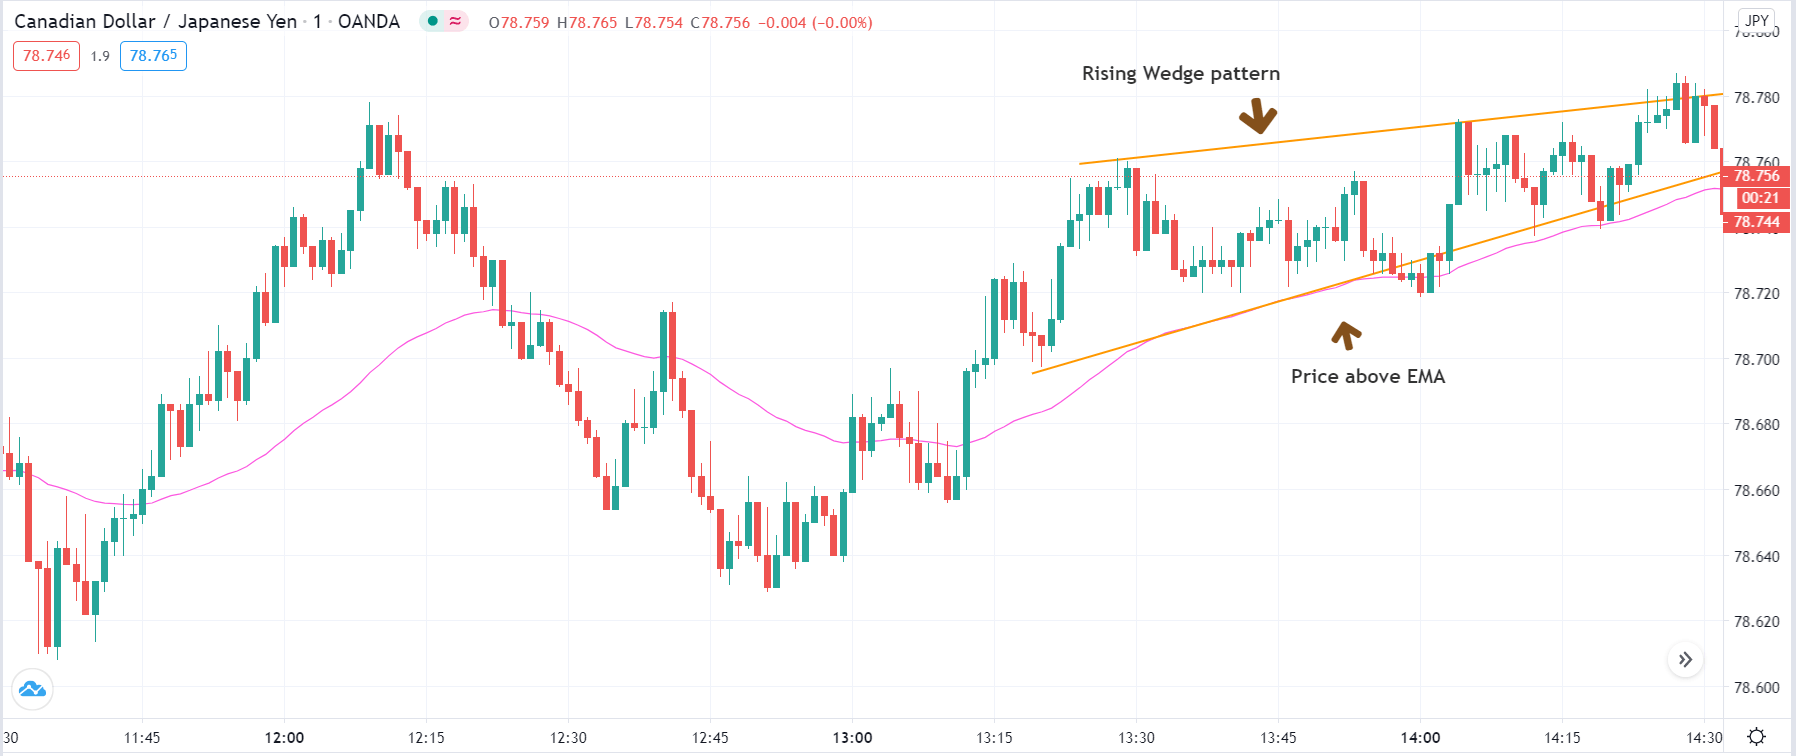
Step 1: Firstly, we spot the ‘rising wedge’ pattern in the market where the pattern must be formed above the exponential moving average. What this indicates is that the market has moved into an intermediary uptrend but might be weakening due to the loss in momentum. Our job is to take a trade in the direction of the reversal. Similarly, when a ‘falling wedge’ pattern is formed in the market, it indicates that the sellers are losing momentum and buyers will take over the market. This pattern has to form below the EMA for an upward reversal.
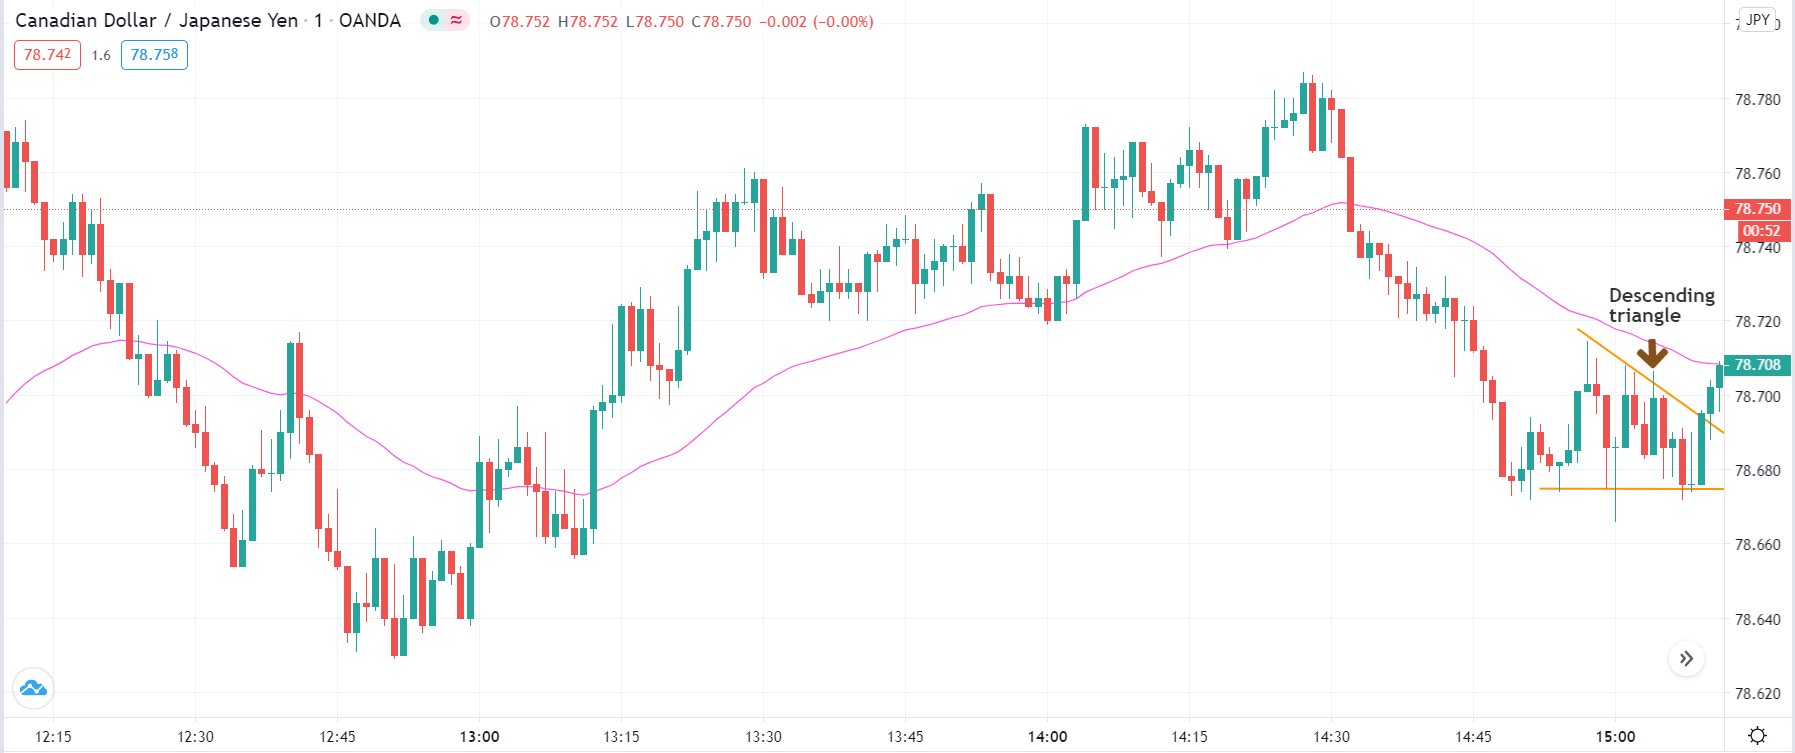
Step 2: Next, we wait for the market to turn on the other side and reverse in direction. After the reversal takes place, the price should form a ‘descending triangle’ pattern below the EMA. The ‘descending triangle’ pattern confirms two things. First, the market has put a ‘lower high’ and ‘lower low’ which are the essentials of a trend and second, the buyers are not strong enough to take the price higher. In a downtrend, the market should form an ‘ascending triangle’ pattern above the EMA that would confirm the reversal. Here the pattern signifies that the market has put a ‘higher high’ and ‘higher low’ along with the inability of the sellers to take the price lower.
Now, let us see the rules for ‘entering’ a trade.
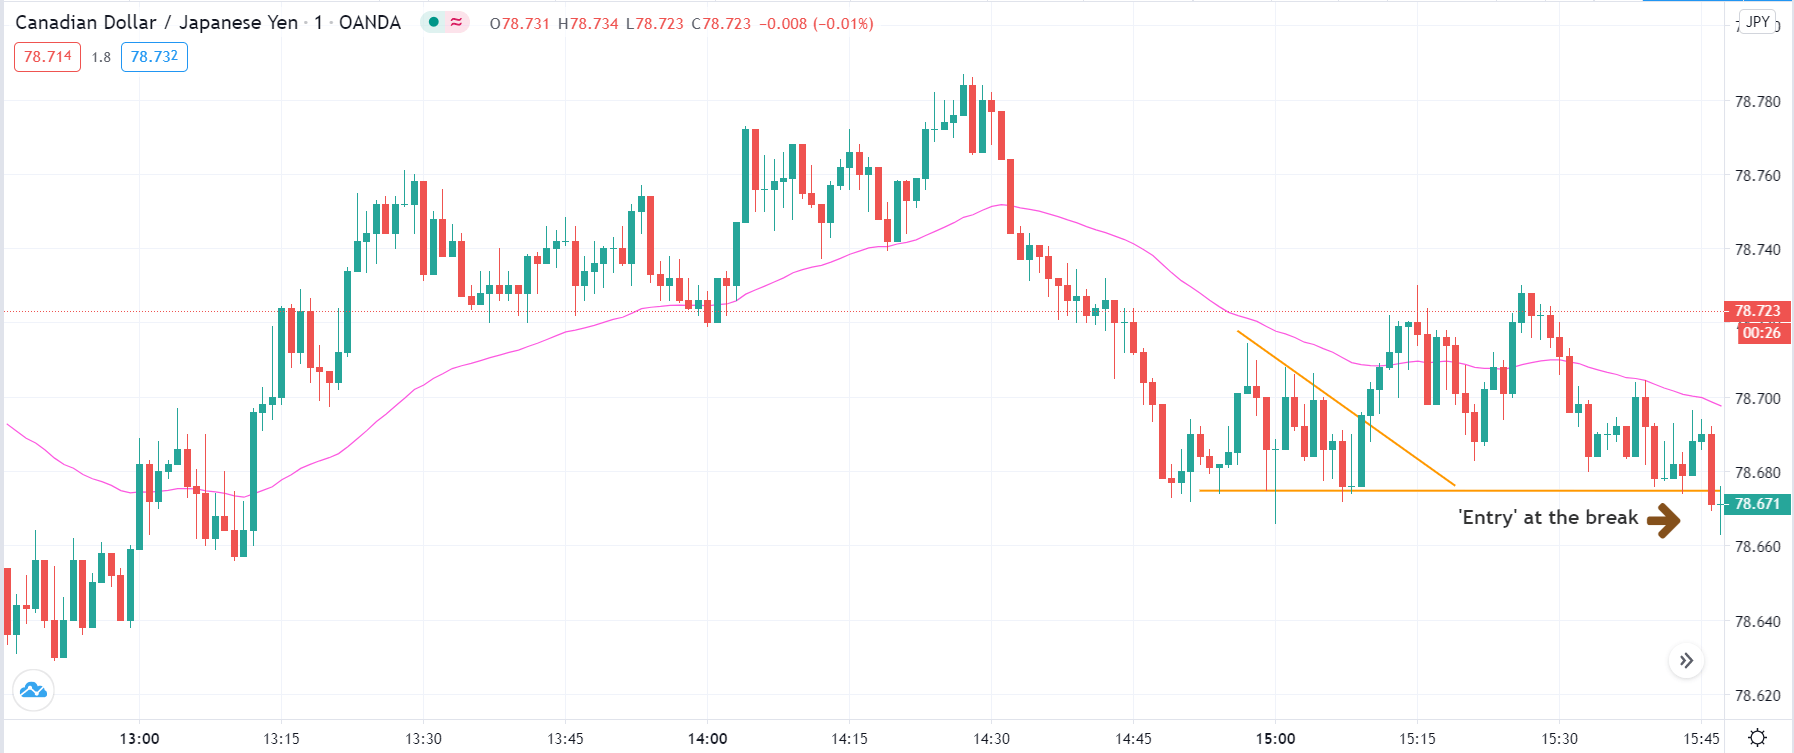
Step 3: In a ‘short’ trade setup, we enter the market when price breaks the ‘support’ line that was created by the ‘descending triangle’ pattern. In simple words, we ‘short’ the currency pair right when the price starts moving below the previous ‘low’ and creates a situation of breakdown. This type of ‘entry’ is shown in below image where we enter right at the break of the ‘support.’ In a ‘long’ trade setup, things are reversed. This means we enter the market when price breaks above the resistance of ‘ascending triangle’ pattern and starts moving higher than the previous ‘high.’
Step 4: Once entered, it is important to determine the stop-loss and take-profit levels for the trade. In a ‘long’ trade, stop-Loss will be set above the first ‘lower high’ that was laid in by the market after reversal. Whereas, in a ‘short’ trade, the stop-loss will be placed below the first ‘higher low’ that was laid in by the market after reversal. Depending on the number of pips of the stop-loss, take-profit will be set by an equal number of pips. This is done to ensure that the risk-to-reward of the trade is at least 1:1. But since we are trading against the trend, we will move our stop-loss to breakeven as soon price moves 80% of the take-profit
Strategy Roundup
The two patterns needed for the strategy might appear several times in the market but are observed separately. It is difficult to spot both the patterns together, which reduces the frequency of trades. One way to increase the frequency of trades is by watching for these patterns during the market opening, as volatility is high. But the focus here should be on taking successful and high probability trades.