Introduction
The moving average is one of the most popular and widely used indicator in the industry. There are different types of moving averages that exist based on the calculation and the duration. Here we will discuss one of the most popular moving averages, which is a 200-day moving average.
A 200-day moving average is a significant tool for the traders and market analysts for determining overall long term market trend. The indicator appears as a line on the price chart, you can change it to even dotted line, and it meanders above and below the price action. The indicator also serves as dynamic support and resistance to the price action. When the 200 SMA is above the price, it indicates as a resistance line to the price, and when it goes below the price action, it acts as a support level to the price action.
The SMA takes the average price movement over a given number of periods which used to smooth the price action of an underlying asset. Instead of tracking the highs and lows of every candlestick, this way moving average simply calculates its value based on the closing price. So visually, this provides the trader with a straightforward view of where the price action has been and where it likely to headed in the short term. There are an infinite number of averages exists; you can change the settings of the moving average. If you desire to measure the price movements over a shorter duration, then simply use the shorter average and if you desire to measure the price movements over a more extended period of time simply use the longer average. In this article, we will discuss some tips and tricks and strategies to use the 200-period simple moving averages.
TRADING STRATEGIES BY USING THE 200 PERIOD SMA.
SIMPLE SMA STRATEGY.
This is one of the most straightforward 200 period SMA strategy that widely used by the traders. Most of the traders think to make money from the market they must follow the complicated strategies because making money from the market is super hard. This is not true; you can make money by using simple trading strategies.
FOR BUY.
- Look for an uptrend.
- When the SMA goes below the price action take buy.
- Stops below the entry.
- Go for the brand new higher high.
The below image represents the Buying trade in the EURUSD pair.
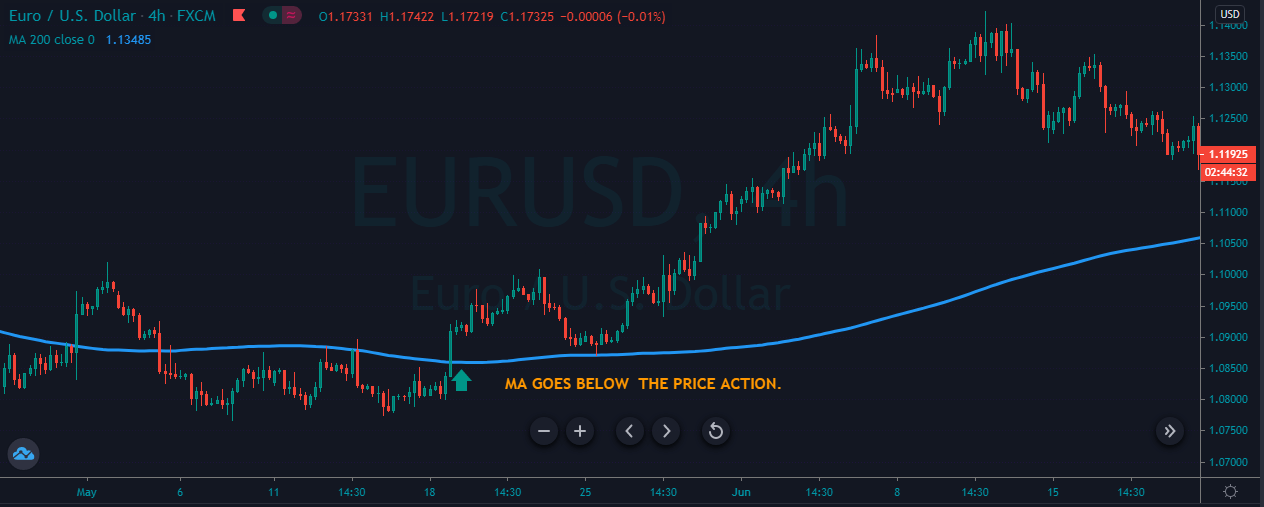
The image below represents the entry, exit and take profit in this forex pair. As you can see when the SMA goes below the price action, it means now the trend is up or the buyers started gaining momentum, and any buy entry from here will be a good idea. As we took the buy entry price action smoothly goes to the north, and the stops were just below the entry.
FOR SELL.
- Look for a downtrend.
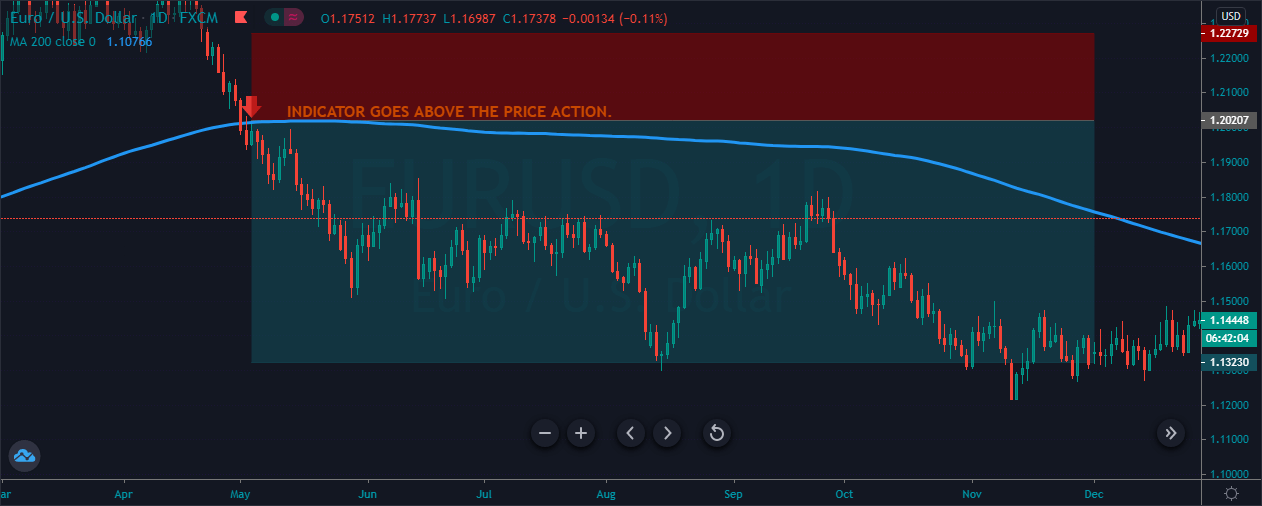
- When the SMA goes above the price action take sell.
- Stops above the entry.
- Go for the brand new lower low.
The image below represents the selling trade in the EURUSD forex pair.
As you can, the below image represents our entry, exit and take profit in this forex pair. So when the SM goes below the price action, it was a clue to go short for the brand new lower low. Soon after our entry price goes down and it prints the brand new lower low. This one is the basic 200-period strategy, but it is super effective on all the trading timeframes.
BREAKOUT TRADING.
In a trending market, when the price action breaks the major level and holds above the significant level that’s something is breakout trading. Breakout trading is a leading way to trade the market, and by using this method, you will always anticipate the market ahead of the time.
FOR BUY.
- Look for the buying market.
- If the SMA is below the price, it means the trend is up.
- Wait for the price action to pullback.
- Let the price action to break the most recent higher high.
- Take buy entry.
- Put the stops below the entry.
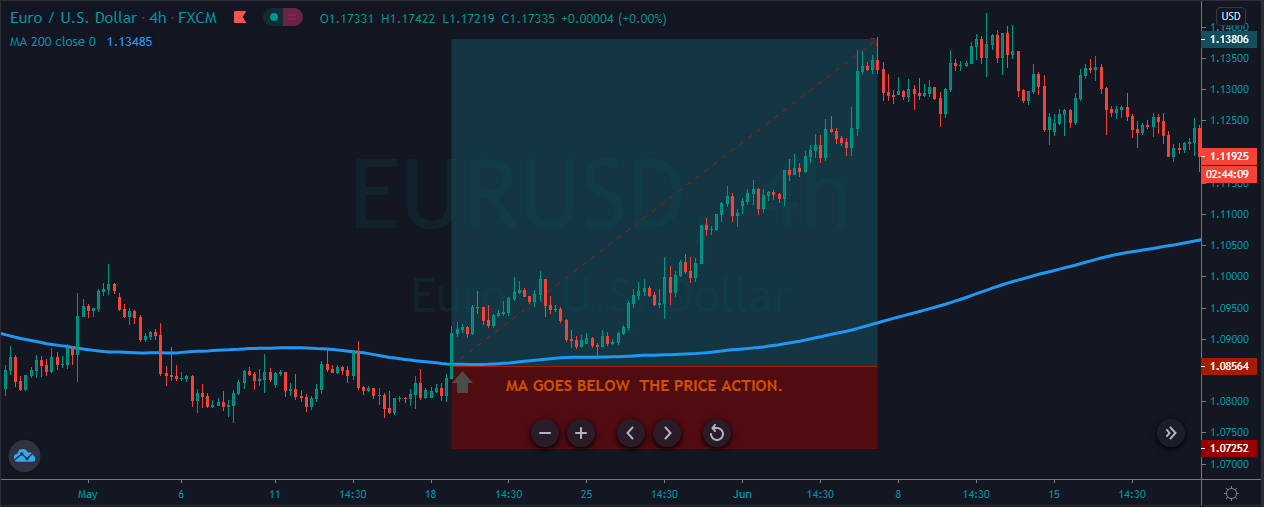
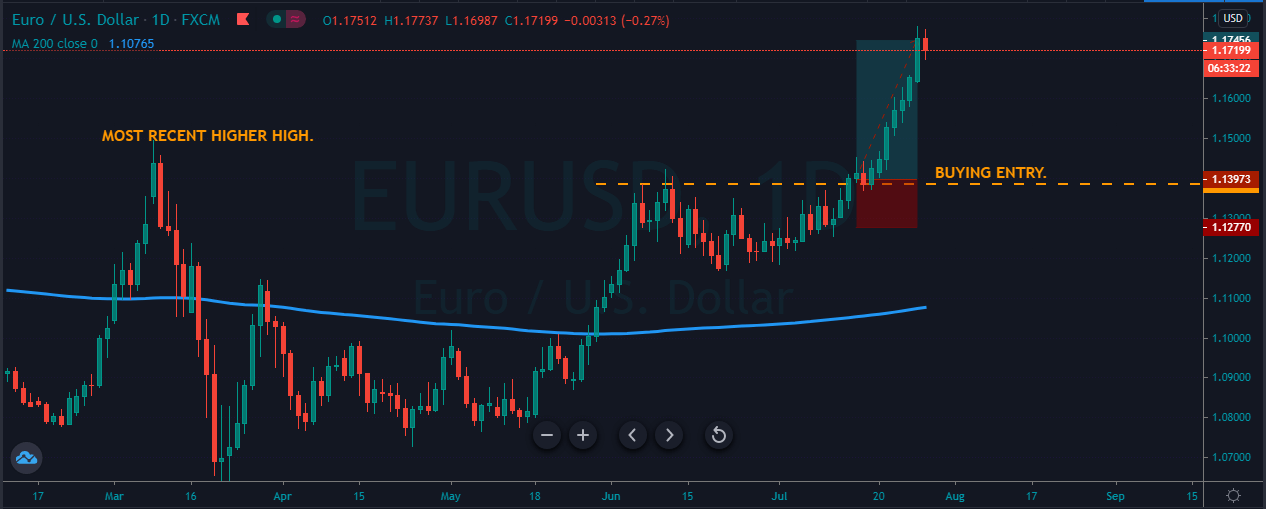
The image below represents the buying trade in the EURUSD forex pair.
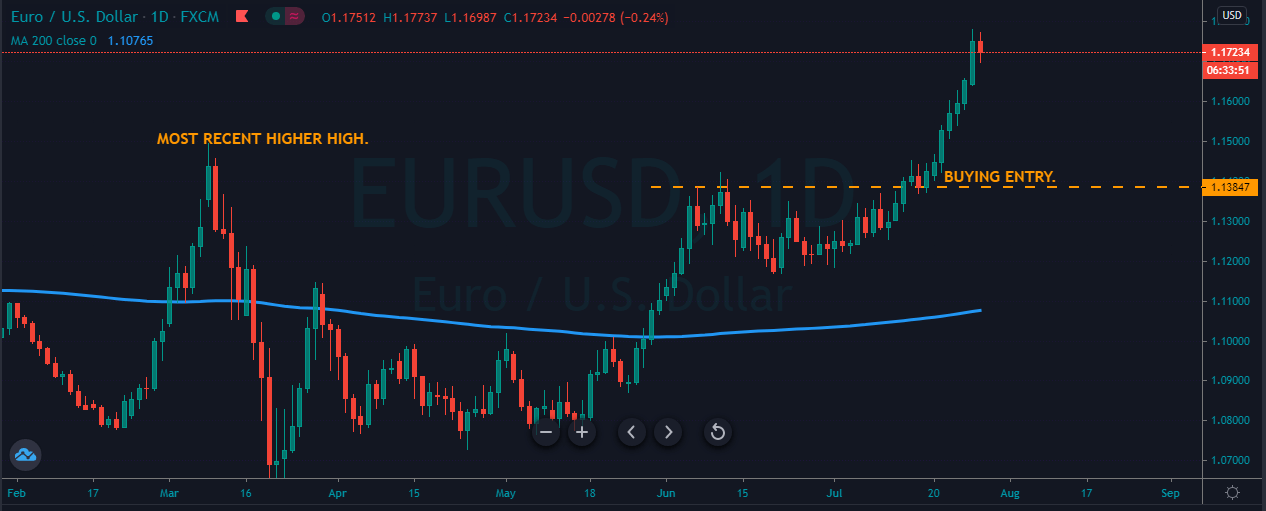
The image below represents the entry, exit and stop loss in the EURUSD forex pair. The pair was in an overall uptrend, and it took a couple of days to pull back and when we got enough pullback, the price action break above the most recent higher high which is a sign to go long. As we took the buy entry, the price action smoothly goes north, and it prints the brand new higher high. So this trade belongs to the daily chart, so in this, we end up making nearly 300+ pips.
FOR SELL.
- Look for the selling market.
- If the SMA is above the price, it means the trend is down.
- Wait for the price to pullback.
- Let the price action to break below the most recent lower low.
- Take the sell entry.
- Put the stops above the entry.
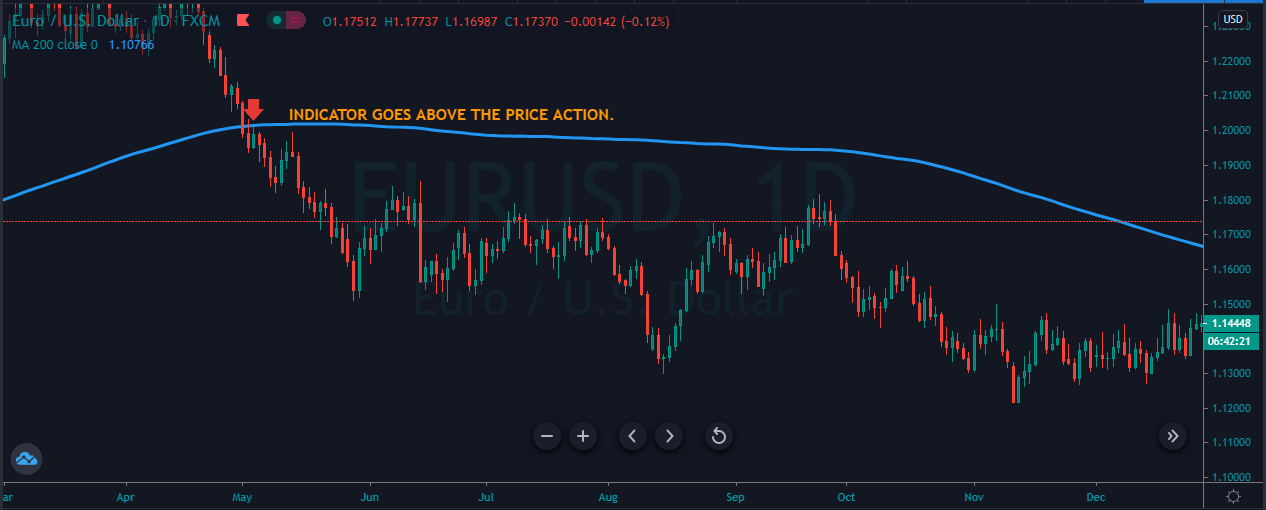
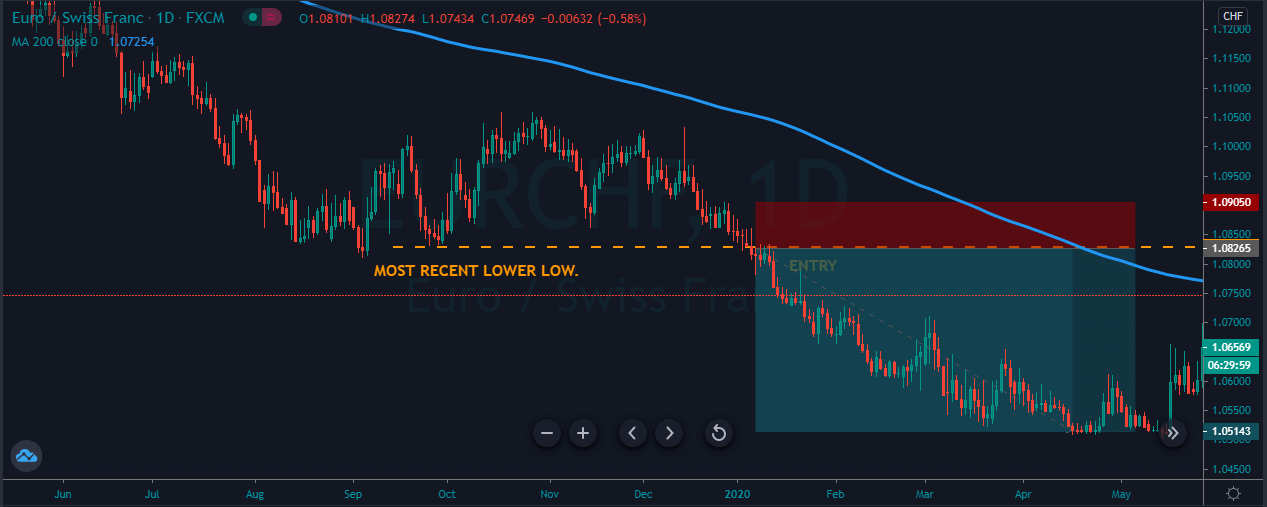
The image below represents the downtrend in the EURCHF forex pair.
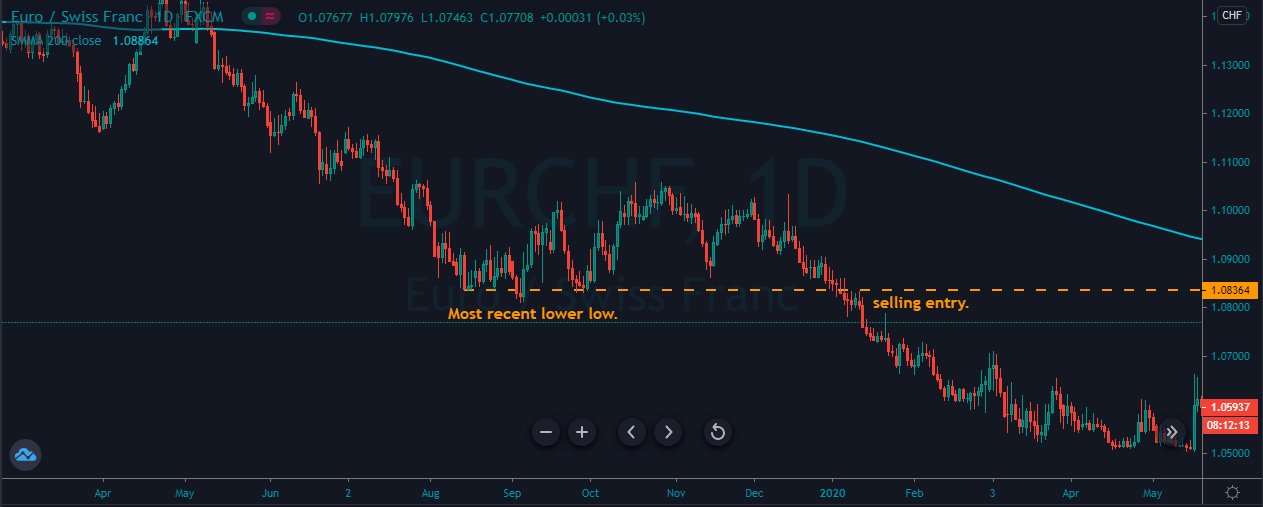
As you can see in the image below, the pair was in an overall downtrend, and when it breaks the most recent lower low, it was a sign for us to go short in this one. As we took the sell entry, it prints the brand new lower low, and the stops were just above our entry point.
TRENDLINE TRADING.
FOR BUY.
- Look for the buying market.
- If the SMA is below the price, it means the trend is up.
- Wait for the price action to pull back to the support area.
- Draw down trend line.
- Wait for the price action to break the trend line.
- Take buy entry.
- Go for brand new higher high.
- Put the stops below the support area.
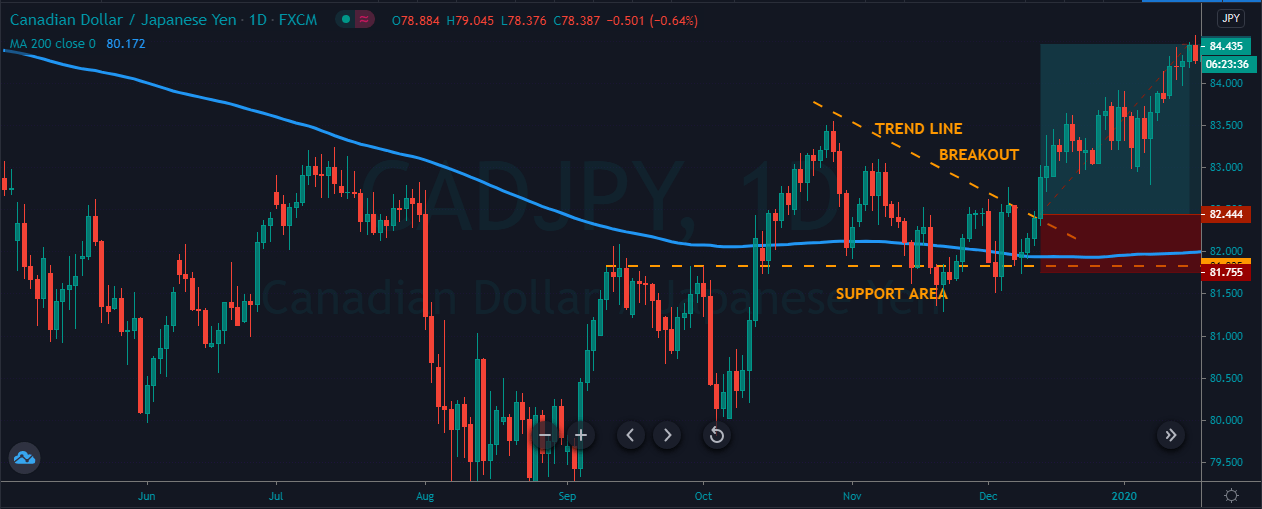
The image below represents the uptrend in the CADJPY forex pair.
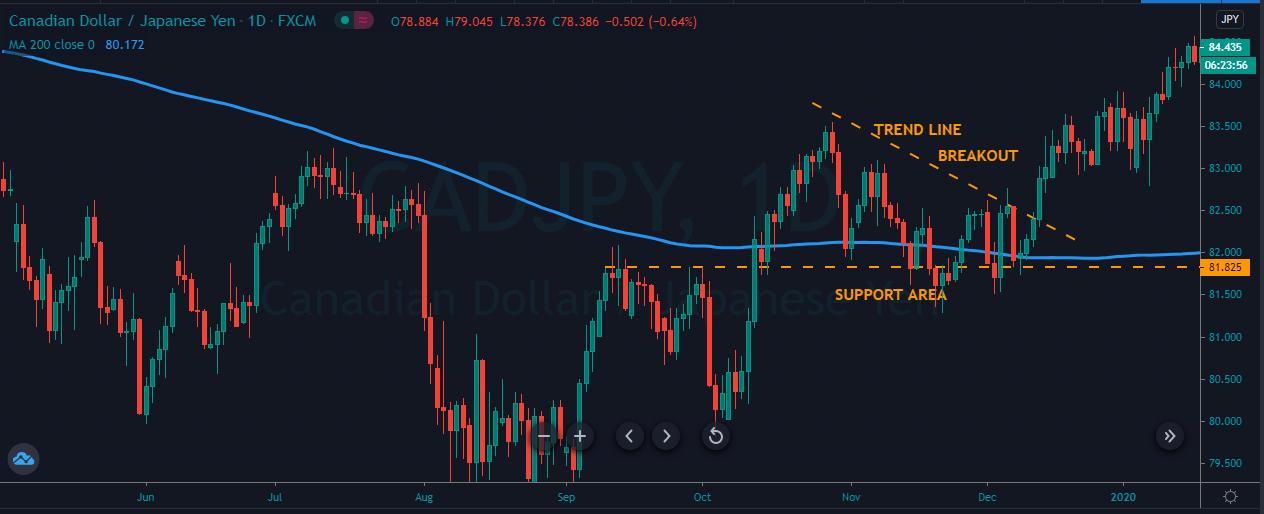
As you can see in the image below, it represents the buying trade in the CADJPY forex pair. So at first, the price action was in a downtrend, and when the SMA goes below the price, it was the first sign of an uptrend. When the price action holds at the support area, and the SMA was below the price, these are clues to soon prepare for the buying trade. So when the price action breaks the trend line, we choose to go long in that one. As we took the buy entry, the prices blast to the north, and it prints the brand new higher high.
FOR SELL.
- Look for the selling market.
- If the SMA is above the price, it means the trend is down.
- Wait for the price action to pull back to the resistance area.
- Draw the uptrend line.
- Wait for the price action to break below the trend line.
- Take sell entry.
- Go for a brand new lower low.
- Put the stops below the resistance area.
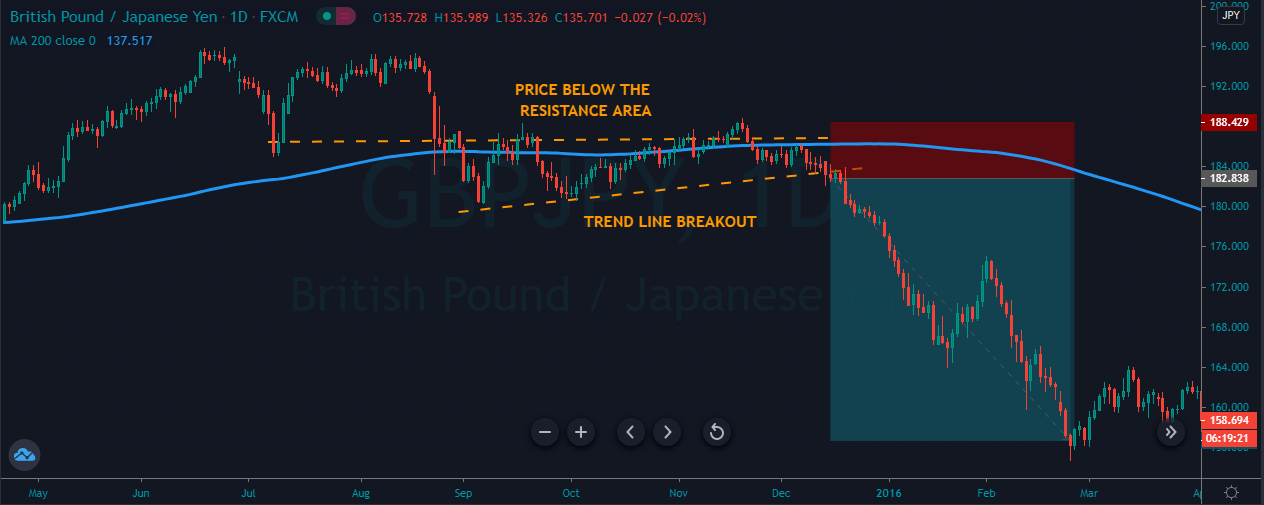
The image below represents the selling trade in the GBPJPY forex pair.
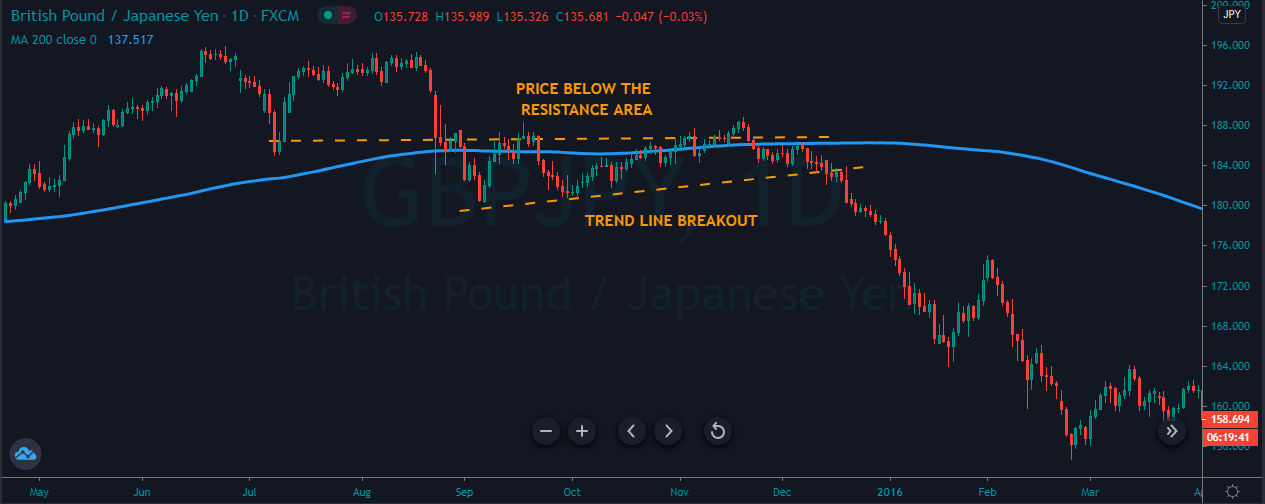
As you can see the image below represents the selling trade in the GBPJPY daily chart. So when the price action breaks the most recent lower high, it started holding below that level which means buyers are trying very hard, but they failed to take the prices higher. Furthermore, sellers took advantage of the significant resistance level and also they broke the trend line, which was a sure sign for the brand new lower low after our entry price action dropped 2400+ pips within just two months of period.
CONCLUSION.
The 200 days SMA represented as a line on the price chart, which represents the average price over the last 40 weeks. SMA helps the traders to find the trend of the market, and it also acts as dynamic support and resistance to the price action. There are infinite numbers of averages, and the traders use the average according to their trading style, but the 200 period is the most common and widely used average by the investors, traders and market technicians.
There are two basic rules of the SMA.
- When the price is above the SMA, You should go long.
- When the price is below the SMA, You should go short.
There are two groups of SMA signals.
- BREAKOUT TRADING.
- TRENDLINE BREAKOUT.