Introduction
Most of the trader always desire to trade with the multiple indicators on the price chart. Multiple indicators provide more information, and it also enhances your results dramatically. The major problem with the traders is they don’t know which two indicators they need to pair to improve their game. For solving this problem, we write this article. In this article, we paired the Stochastic with the MACD indicator; this team worked well because the stochastic is comparing the asset closing price to its price range over a certain period of time, and the MACD is the formation of the two moving averages diverging from and converging with each other. This dynamic combination is a highly effective way to deal with the markets.
STOCHASTIC.

Developed by George C. Lane in the 1950s, the stochastic is a momentum indicator that shows the location of the close relative to the high low range over a set number of periods. The stochastic doesn’t follow the price or volume or anything like that instead, it follows the speed and momentum of the price, which makes it the leading indicator in the market. The bullish and bearish divergence on the stochastic indicator is the major signal identified by the Lane on the indicator. The indicator consists of two lines; the first one is K% and D%. K% is the main line of the indicator, which indicates the number of time periods, and D% is the moving average of the K%.
- The stochastic is a range-bound indicator which oscillates between the 0 to 100 level.
- The 80 and 20 are the major level which considered to be overbought and oversold levels.
- When the K% drops below 20, the asset is considered to be oversold, and it signals the buying reversal.
- When the indicator reaches the 80 level, it is a sign of asset. It is considered to be overbought and expects the downside reversal.
MACD.
The MACD stands for the Moving Average Convergence and Divergence. Developed by Gerald Appel, it is one of the simplest and most effective momentum trading tools. The MACD turns the two moving averages into a momentum oscillator by subtracting a longer period average to the shorter one. As a result, the MACD is a trend-following and a momentum indicator. If a trader needs to determine the strength of the trend or the direction of the asset, for that overlying the moving average line onto the MACD histogram is very useful.
- Look for the divergence, or a crossover of the centerline of the indicator is an essential trading signal.
- The bullish and bearish crossovers at the 80 and 20 levels are another major trading signal of the MACD.
CROSSOVER STRATEGY.
BULLISH CROSSOVER.
- Look for an uptrend.
- Let the price action pull back.
- Wait for both of the indicators to reach an oversold area.
- Look for a crossover at an oversold area.
- Hit the buy.
- Place the stops just below the entry.
- If the trend is healthy, then go for brand new higher high, if not then exit at most recent higher high.
The image below represents the buying entry in the GBPCAD
forex pair.
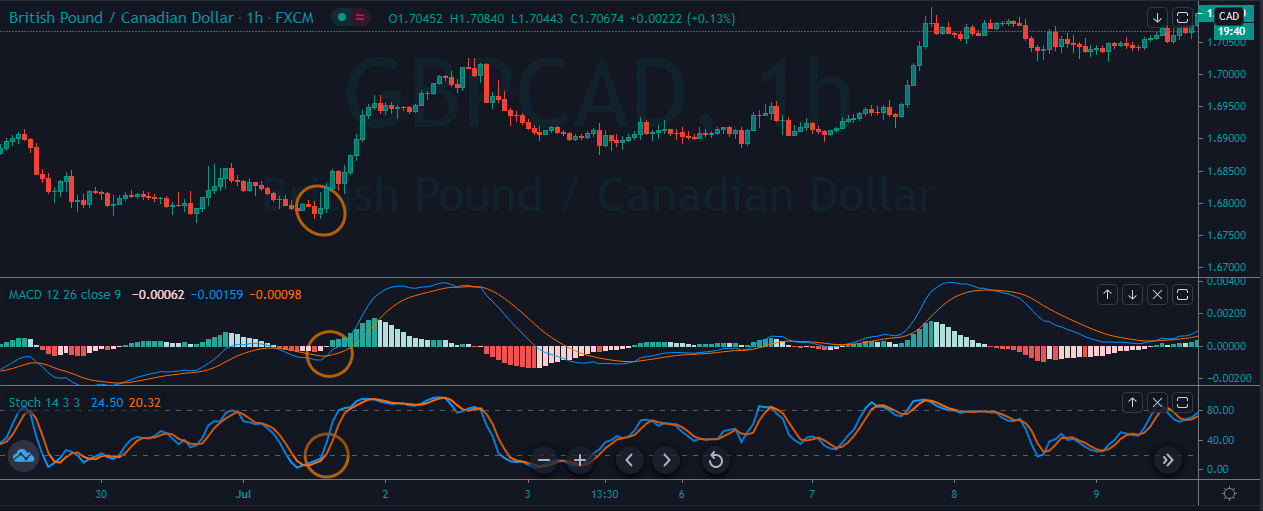
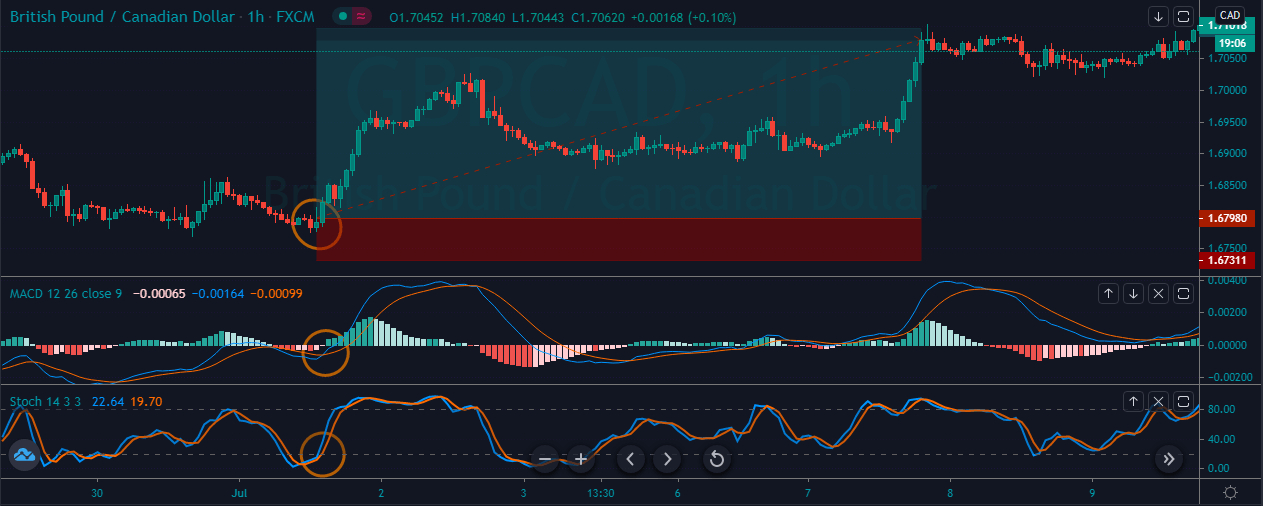
As you can see in the image below, it represents the entry, exit, and take profit in the GBPCAD forex pair. The price action was in a correction phase, and the strong reversal at the oversold area was a sign to go long in this forex pair. After our entry price action blasts to the north, and we witnessed the brand new higher high. This one is the most basic and simplest trading strategy, which works very well in all the type of trading conditions. Both of the indicators filter out all the bad trading signals, and they only give the signals which have a very high probability to perform.
BEARISH CROSSOVER.
- Look for a downtrend.
- Let the price action to pull back.
- Wait for both of the indicators to reach the overbought area.
- Look for a crossover at the overbought area.
- Hit the sell.
- Place the stops just above the entry.
- If the trend is healthy, then go for brand new lower low, if not then exit at a most recent lower low.
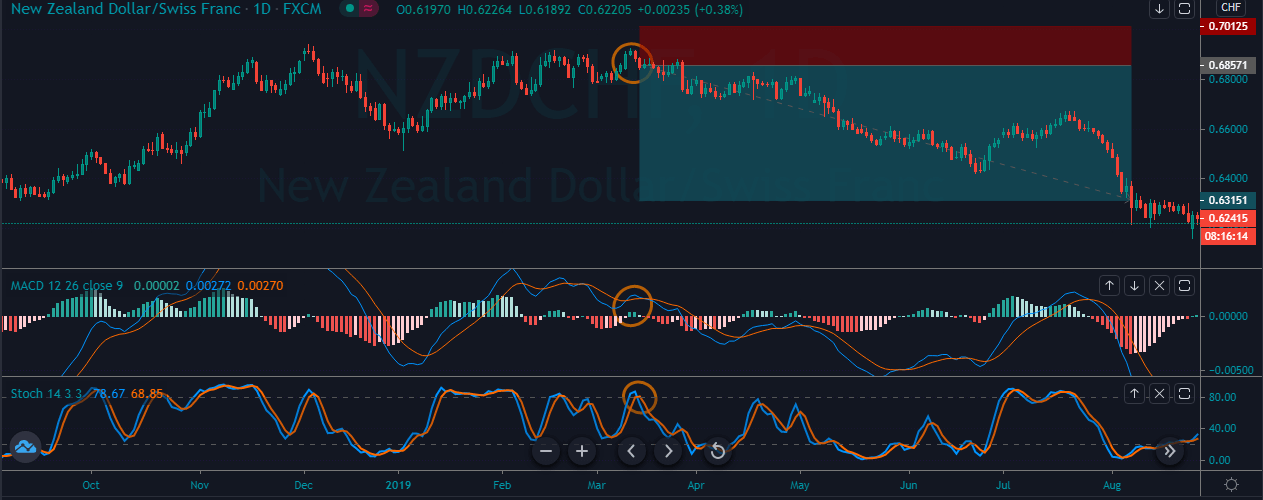
As you can see in the image below, it represents the selling
signal in the NZDCHF forex pair.
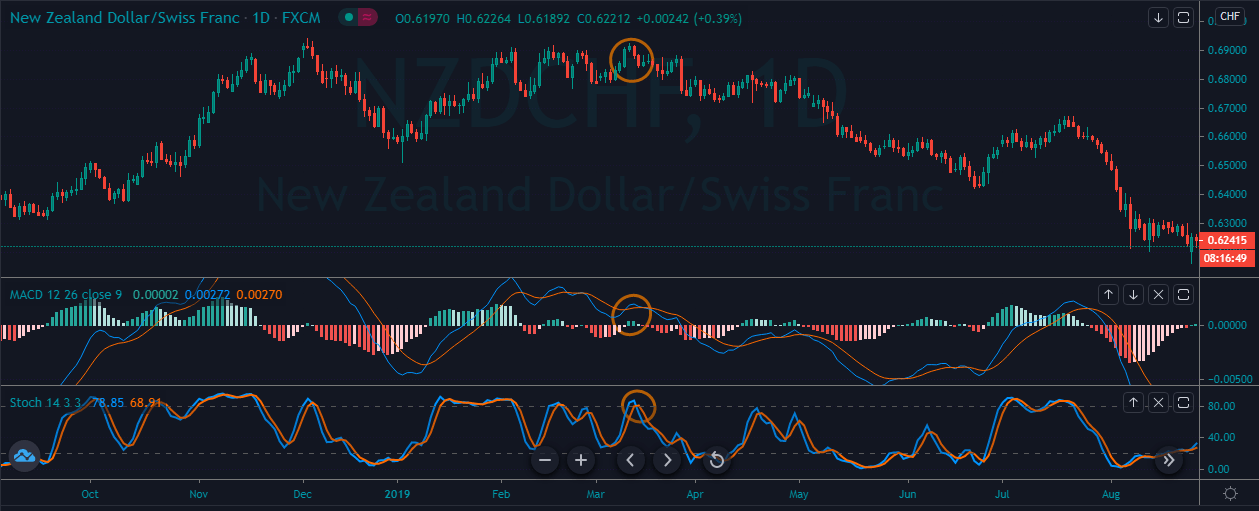
The image below represents the entry, exit, and take profit in the NZDCHF forex pair. Overall the currency was in an uptrend, and after the most recent correction, price action struggled to print the new higher high. At the same time, both of the indicators indicating the crossover signal at the overbought area, which is a sign to go short. As we took sell entry, prices go sideways for a little time, and then it goes down and prints the brand new higher high.
CENTRE LINE CROSSOVER.
FOR BUY.
- Look for a healthy uptrend.
- Let both of the indicators to go above the centerline.
- Go long.
- Put the stops below the entry.
- Go for brand new higher high.
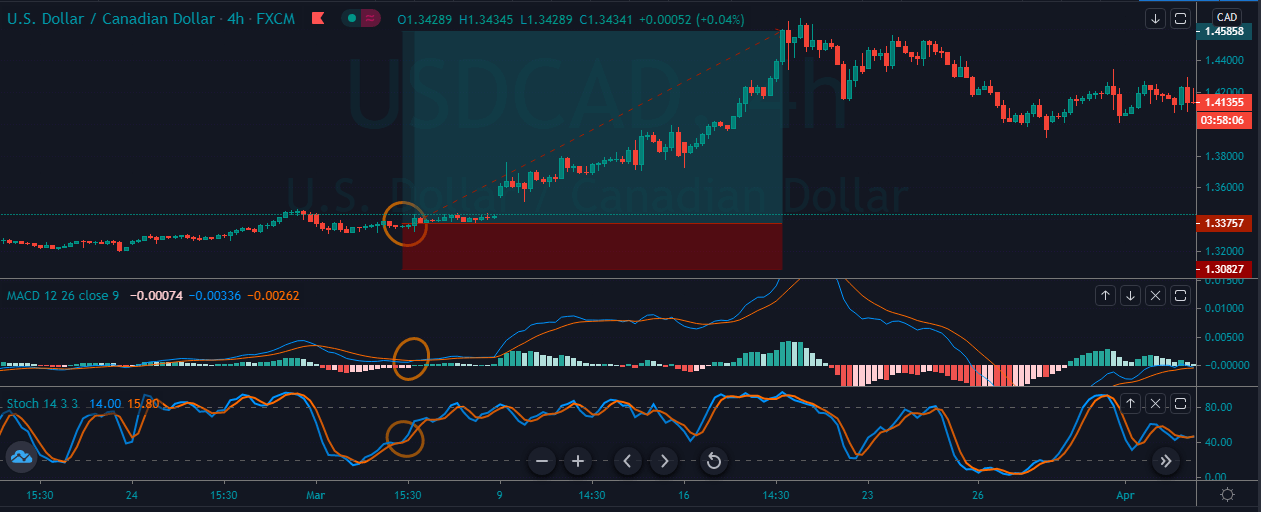
The image below represents the buying signal in the USDCAD
forex pair.
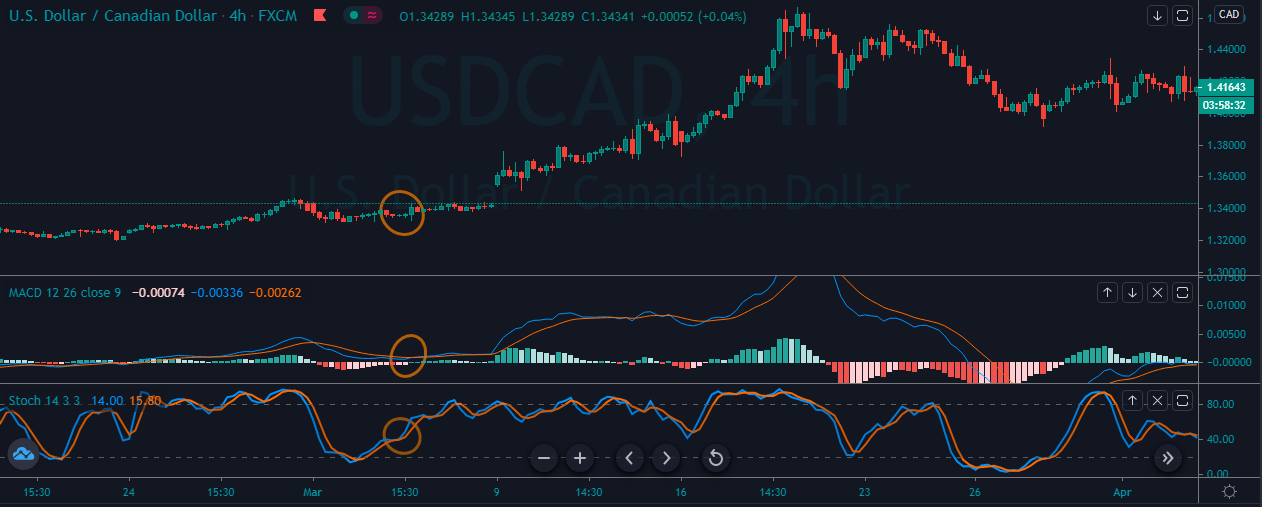
The image below represents the entry, exit, and stop-loss in the forex pair. As you can see, the trend was not strong enough, and when the MACD indicator gave reversal at the oversold area at that stage, stochastic was also approached the middle of the trend, which means that the market started gaining the momentum. Soon the probability of the brand new higher high is very high. After our entry price action smoothly goes higher, and it printed the brand new higher high.
FOR SELL.
- Look for a healthy downtrend.
- Let both of the indicators to go below the centerline.
- Go short.
- Put the stops above the entry.
- Go for a brand new lower low.
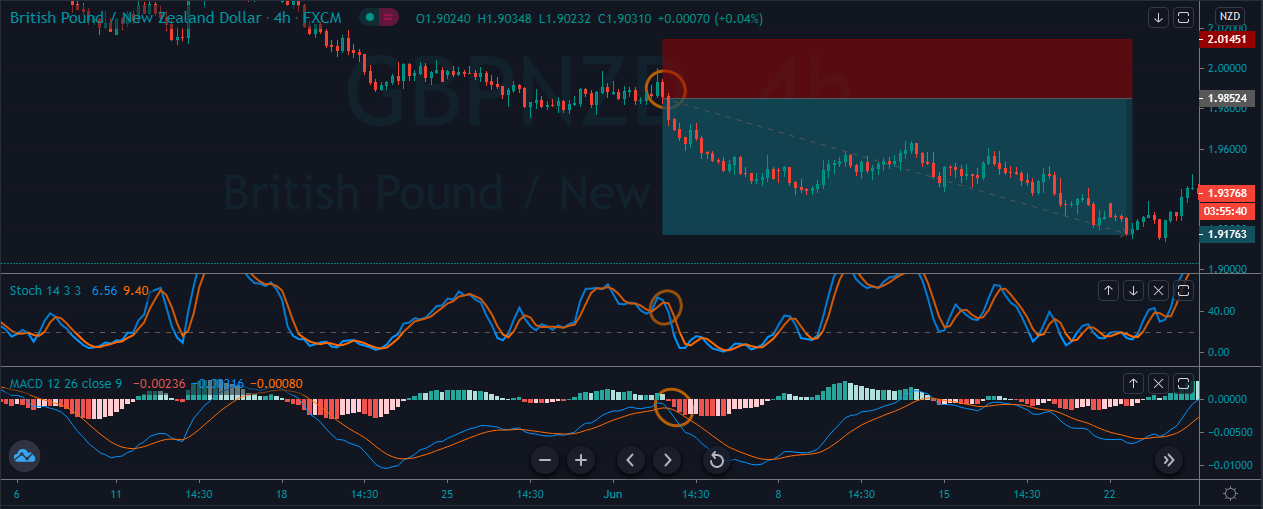
The image below represents the selling trade-in the GBPNZD
forex pair.
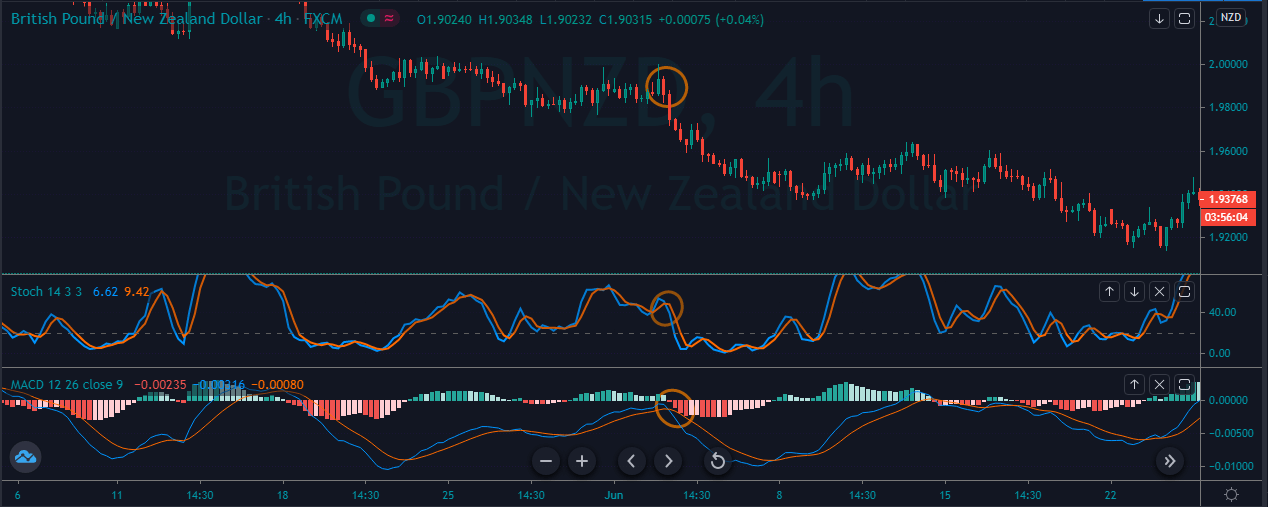
The image below represents the entry, exit, and stop-loss in the GBPNZD forex pair. The pair was in an overall downtrend, and the price action was held at the resistance area. When the MACD indicator gave reversal below the zero line at that stage, the crossover happened on the stochastic oscillator, which was an indication to go short.
CONCLUSION.
This strategy works very well on all the trading timeframes and in all the types of markets. Keep in mind that both of these indicators are momentum indicators, so always use them in trending conditions only. Do not apply this indicator in the consolidation phase. Both of the indicators allow the traders to change the intervals, which is useful to find the optimal and consistent entries. This way, the indicators are helpful for day traders, swing traders, and investors. Both of the indicators enhanced the probabilities of your trades, separately both of the indicators work on different premises; if you ever desired to use only one indicator, then the MACD is a reliable option.