
Introduction
JPYINR is a currency pair where JPY is the currency of Japan. On the other hand, the Indian Rupee (INR) is the currency of India. It is an exotic currency pair where the JPY is the first currency, and the INR is the second currency
Understanding JPYINR
In this currency pair, we can determine the value of INR, which is equivalent to one JPY. It is quoted as 1 JPY per X INR. For example, if the value of JPYINR is at 2.4458, then about 2.4 INR is required to purchase one JPY.
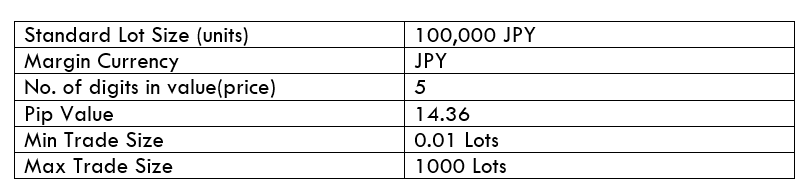
JPYINR Specification
Spread
The subtraction of Bid price and the Ask price is the spread. It is a charge that the broker takes from a trader when they open a trade. Therefore, the spread is controlled by the broker. This value changes with the execution model used for executing the trades.
Spread on ECN: 12 pips
Spread on STP: 17 pips
Fees
Fees is the charge that broker takes from traders. Fees in the currency market works almost the same of other financial market. Note that, STP accounts does not have any fee, but a few pips is applicable on ECN accounts.
Slippage
Slippage is the difference between the execution price and the entry market price. Slippage occurs due to the market volatility and the broker’s execution.
Trading Range in JPYINR
The trading range is the representation of the minimum, average, and the maximum volatility of this pair on the 1H, 4H, 1D, 1W, and 1M timeframe. Using these values, we can assess our profit/loss margin of trade. Hence, this proves to be a helpful risk management tool for all types of traders.
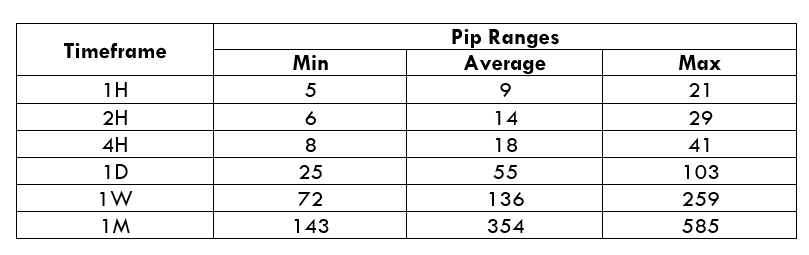
Procedure to assess Pip Ranges
- Add the ATR indicator to your chart
- Set the period to 1
- Add a 200-period SMA to this indicator
- Shrink the chart so you can assess a large time period
- Select your desired timeframe
- Measure the floor level and set this value as the min
- Measure the level of the 200-period SMA and set this as the average
- Measure the peak levels and set this as Max.
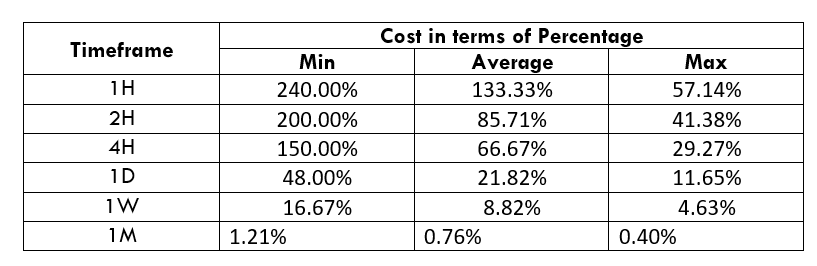
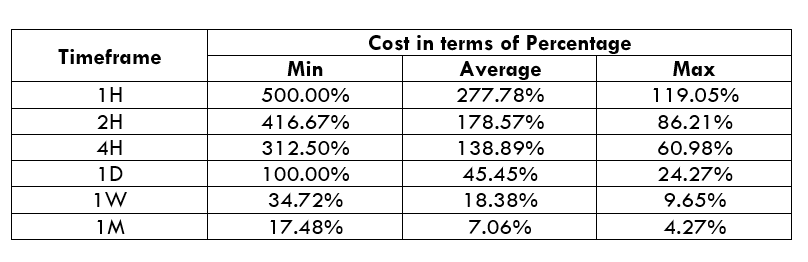
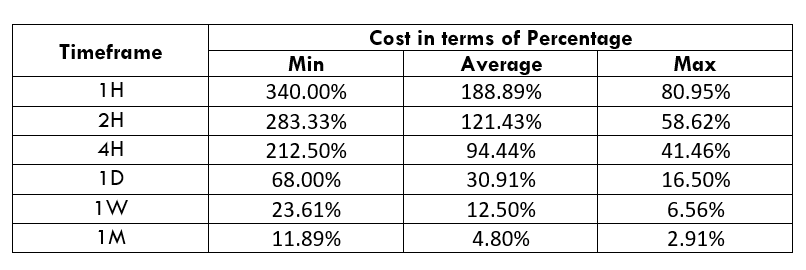
JPYINR Cost as a Percent of the Trading Range
With the volatility values from the above table, we can determine the chance of cost with the change of volatility. We have got the ratio between the total cost and the volatility values and converted into percentages.
ECN Model Account
Spread = 12 | Slippage = 5 | Trading fee = 8
Total cost = Spread + Slippage + Trading Fee
= 12 + 5 + 8
Total cost = 25
STP Model Account
Spread = 12 | Slippage = 5 | Trading fee = 0
Total cost = Spread + Slippage + Trading Fee
= 12 + 5 + 0
Total cost = 17
The Ideal way to trade the JPYINR
As per the above data, we can say that the JPYINR is very liquid and volatile currency pair. Hence, it is very easy to trade in this exotic-cross currency.
If we look at the timeframe, we can see that the volatility in the lower timeframe is higher compared to the higher timeframe. However, in the higher timeframe it is often hard for traders to trade as it requires a lot of trading equity. Based on the structure, we can say that it is better to follow the average cost of this currency pair
Another way to reduce the cost is to place orders as ‘limit’ and ‘stop’ instead of ‘market.’ In that case, there will be no cost for slippage on the total cost calculation. Therfore, the total cost will reduce by three pips.
Limit Model Account
Spread = 12 | Slippage = 0 | Trading fee = 0
Total cost = Spread + Slippage + Trading Fee
= 12 + 0 + 0
Total cost = 12