NZD/AED is a currency pair where NZD is the currency of New Zealand. On the other hand, the AED is the currency of the United Arab Emirates (UAE). It is an exotic currency pair where the NZD is the first currency, and the AED is the second currency.
Understanding NZD/AED
The price of NZDAED represents the value of AED, which is equivalent to one NZD. It is quoted as 1 NZD per X AED. For example, this pair is at 2.4458, then about 2.4458 AED is required to purchase one NZD.
NZD/AED Specification
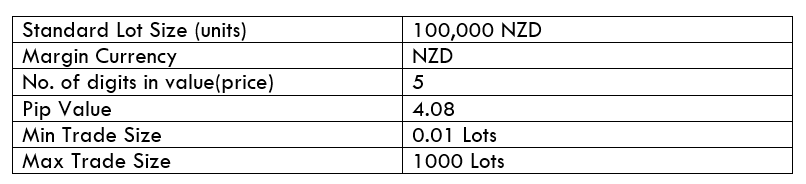
Spread
If we subtract the Bid price and the Ask price, we will find the spread. The spread is usually a charge that the broker takes from a trader when they open a trade. Therefore, the spread is controlled by the broker. This value depends on the execution model used for executing trades.
Spread on ECN: 9 pips | Spread on STP: 14 pips
Fees
The fees in the currency pair trading are almost similar to the other financial market. Note that, STP accounts do not take charges, but a few pips are charged on ECN accounts.
Slippage
Slippage is the difference between the instant execution price and the open market price. The market volatility and the broker’s execution speed are the reasons for slippage to occur.
Trading Range in NZD/AED
The trading range is the representation of the minimum, average, and the maximum volatility of this pair on the 1H, 4H, 1D, 1W, and 1M timeframe. Using these values, we can assess our profit/loss margin of trade. Hence, this proves to be a helpful risk management tool for all types of traders.
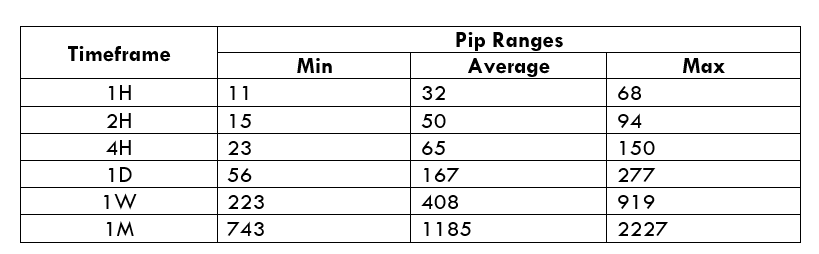
Procedure to Assess Pip Ranges
- Add the ATR indicator to your chart
- Set the period to 1
- Add a 200-period SMA to this indicator
- Shrink the chart so you can assess a large time period
- Select your desired timeframe
- Measure the floor level and set this value as the min
- Measure the level of the 200-period SMA and set this as the average
- Measure the peak levels and set this as Max.
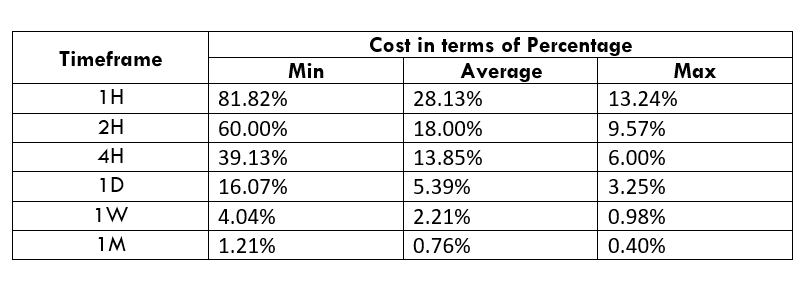
NZD/AED Cost as a Percent of the Trading Range
With the volatility values from the above table, we can see how the cost changes with the change in volatility of the market. We have got the ratio between the total cost and the volatility values; therefore, converted these into percentages.
ECN Model Account
Spread = 9 | Slippage = 5 | Trading fee = 8
Total cost = Spread + Slippage + Trading Fee
= 9 + 5 + 8 = 22
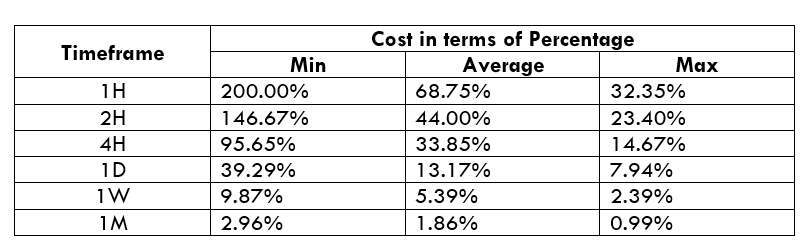
STP Model Account
Spread = 14 | Slippage = 5 | Trading fee = 0
Total cost = Spread + Slippage + Trading Fee
= 14 + 5 + 0 = 19

The Ideal Way to Trade the NZD/AED
The exotic NZDAED pair is a liquid and volatile currency pair. Therefore, it is very easy to trade this exotic-cross currency pair. From the above table, we can see that the percentage values are 200% in the ECN model and within 128% in the STP model. It means the cost is comparatively low, and if we trade in the STP model, the cost will be further low.
In the lower timeframe, the volatility is comparatively higher, but the Percentage of volatility is not much higher to indicate that it is not tradeable. However, in a higher timeframe, the volatility is lower, but it is often hard for traders to trade in a higher timeframe as it requires a lot of patience and balance.
Furthermore, another way to reduce the cost is to place orders as ‘limit’ and ‘stop’ instead of ‘market.’ In that case, the slippage will not be considered in the calculation of the total costs. So, in our example, the total cost will reduce by three pips.
Limit Model Account
Spread = 14 | Slippage = 0 | Trading fee = 0
Total cost = Spread + Slippage + Trading Fee
= 14 + 0 + 0
Total cost = 14