Categories
Cryptocurrencies

What is Ripple? A Complete Guide to the Cryptocurrency

Ripple has undoubtedly made a ripple in the world of finance and the cryptocurrency community. From making headlines for alleged price manipulation to its unusual monetary policy, the currency has firmly made a mark in the finance world. 

Ripple Explained

The first thing to know is that Ripple is both a cryptocurrency and a digital payment and exchange platform. The ripple cryptocurrency – abbreviated as XRP, is the native currency of the Ripple platform.

Ripple is more recognized as a digital payment platform than for its cryptocurrency. Through its Ripple Network (RippleNet), the model circumvents the multiple intermediaries and high fees typical with traditional banking models. 

History of Ripple

XRP was founded in 2012 by Jed McCaleb and Chris Larsen. The model integrated the elements of an earlier payment system called OpenCoin that was designed by decentralization expert Ryan Fugger.

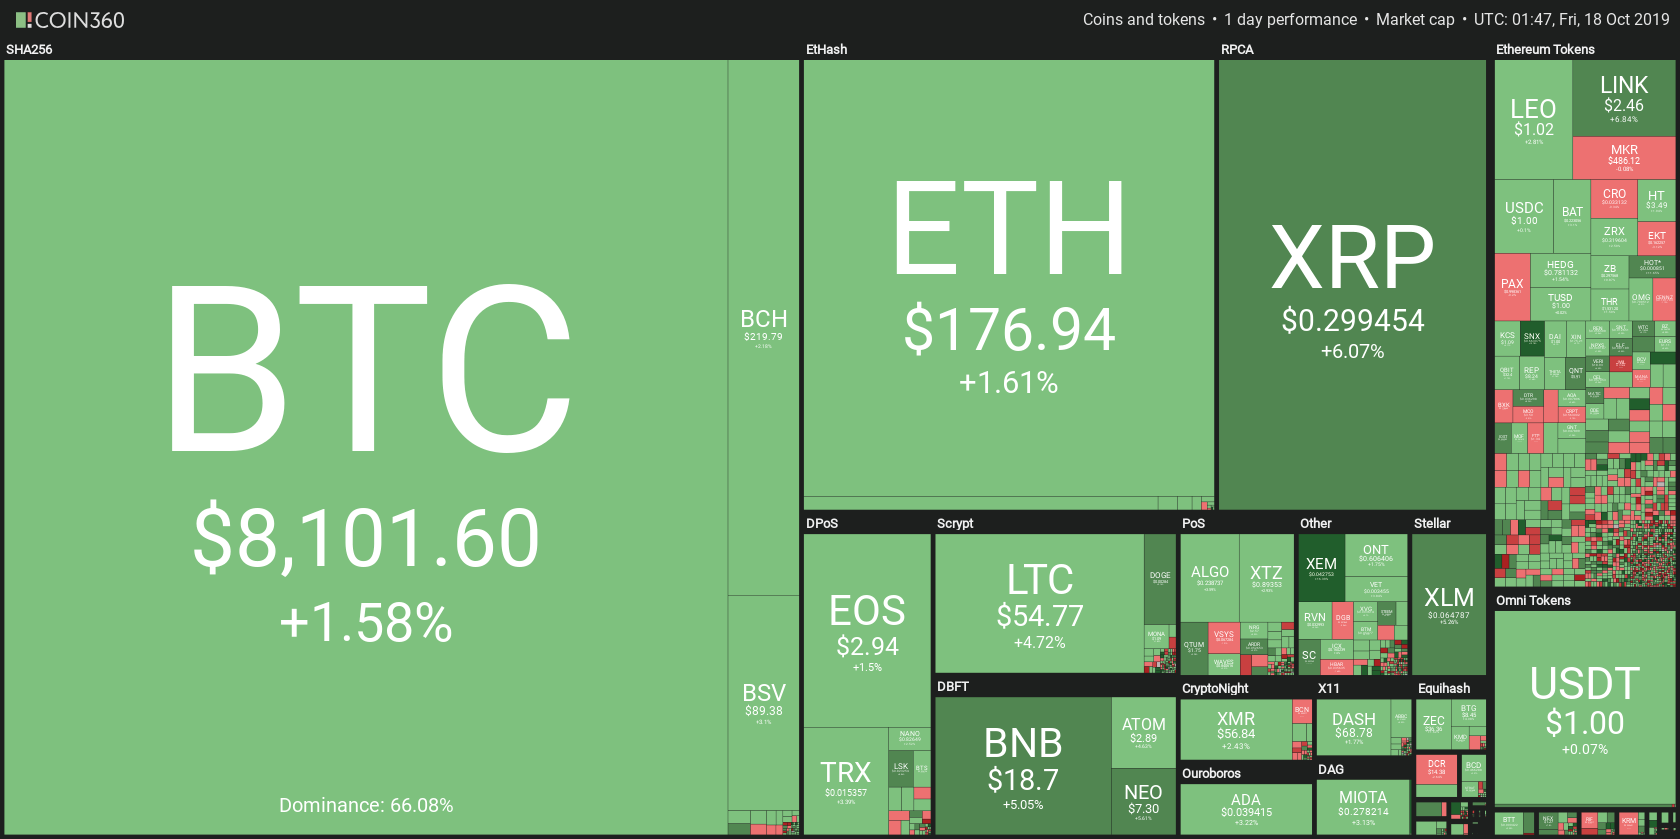
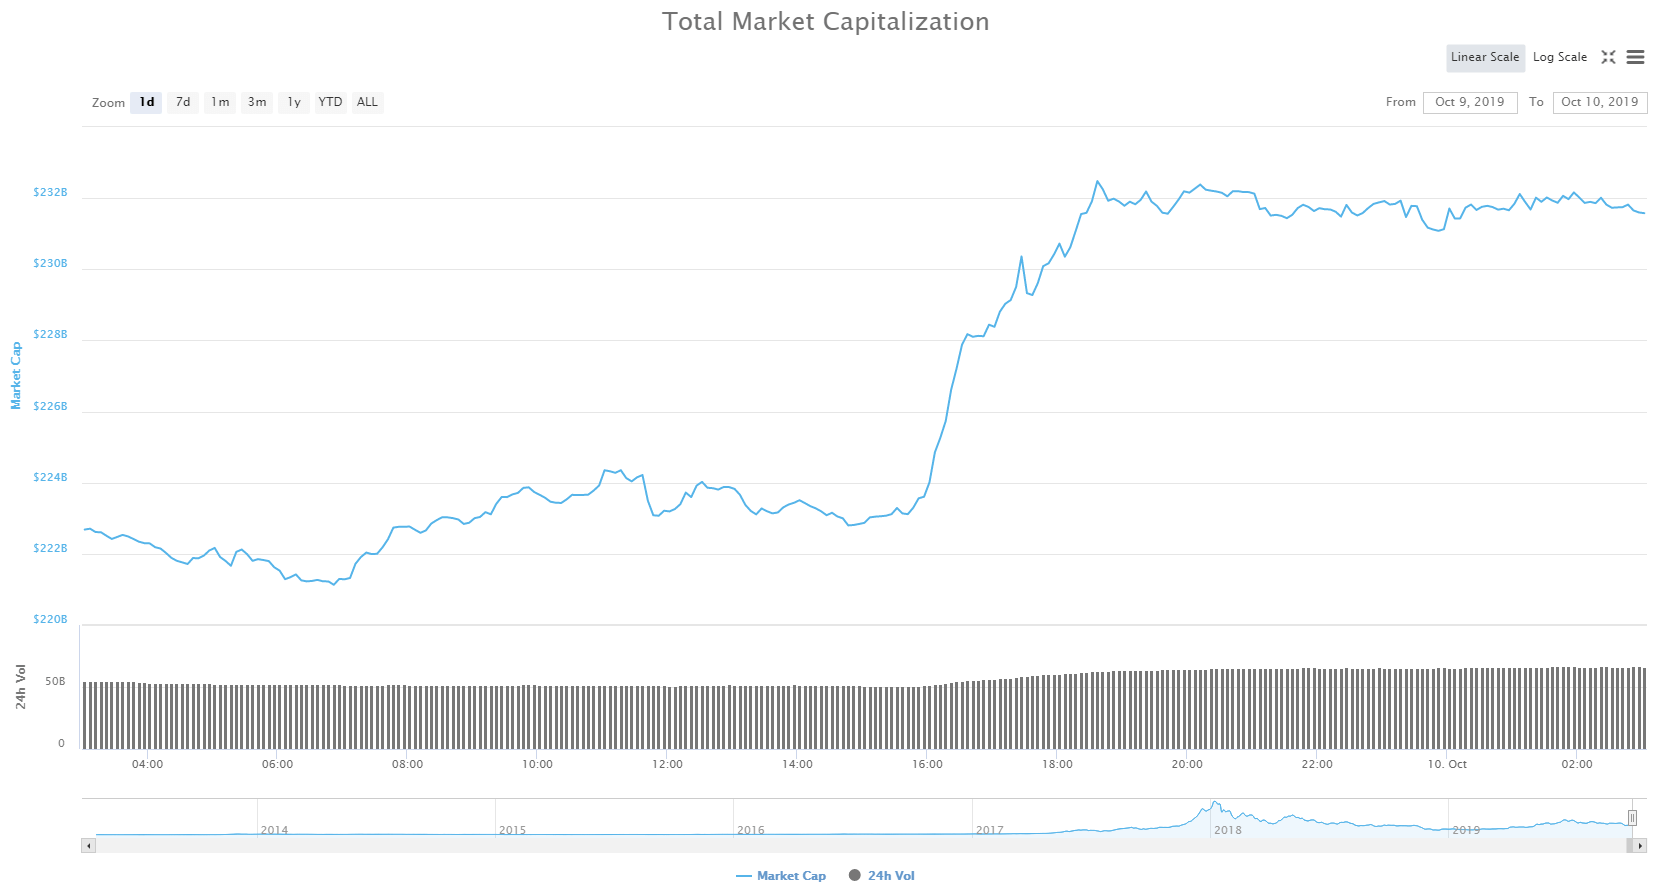
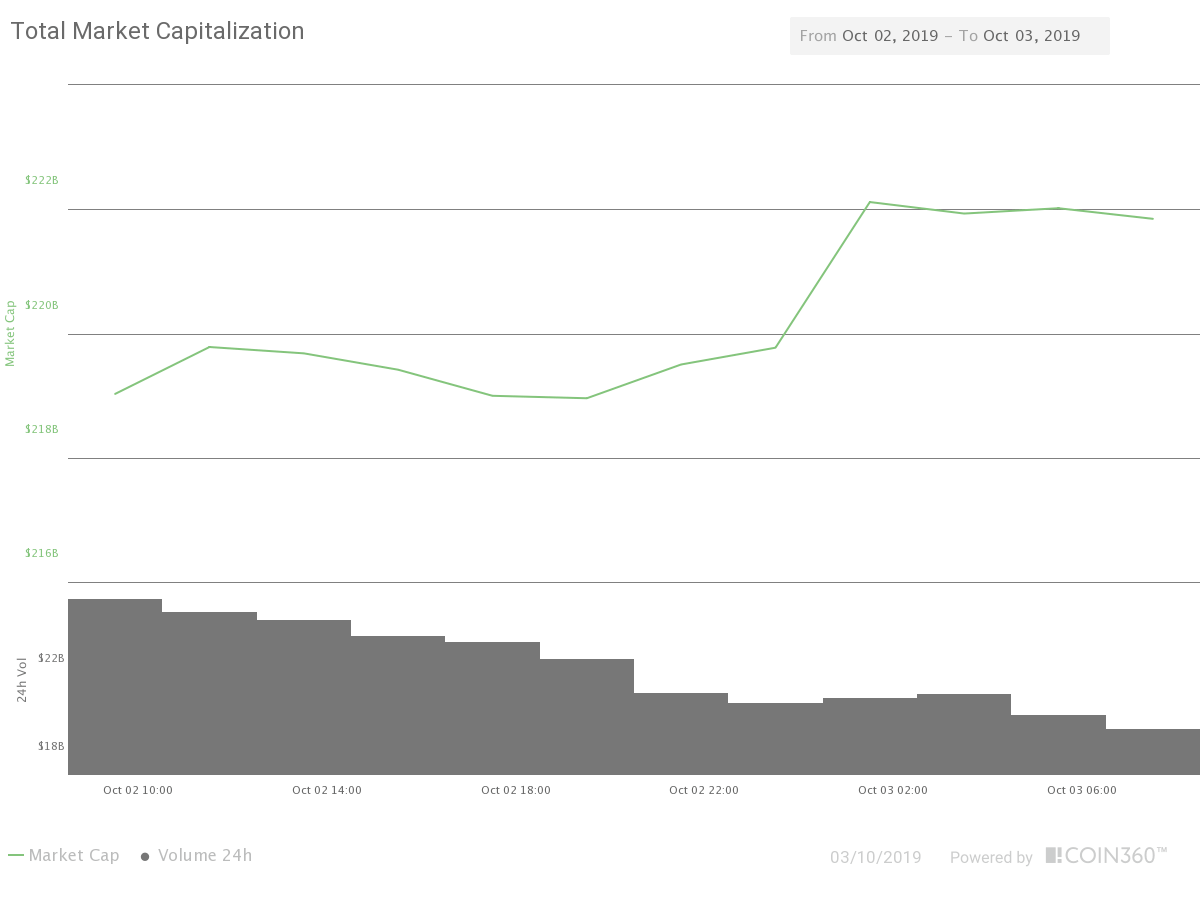
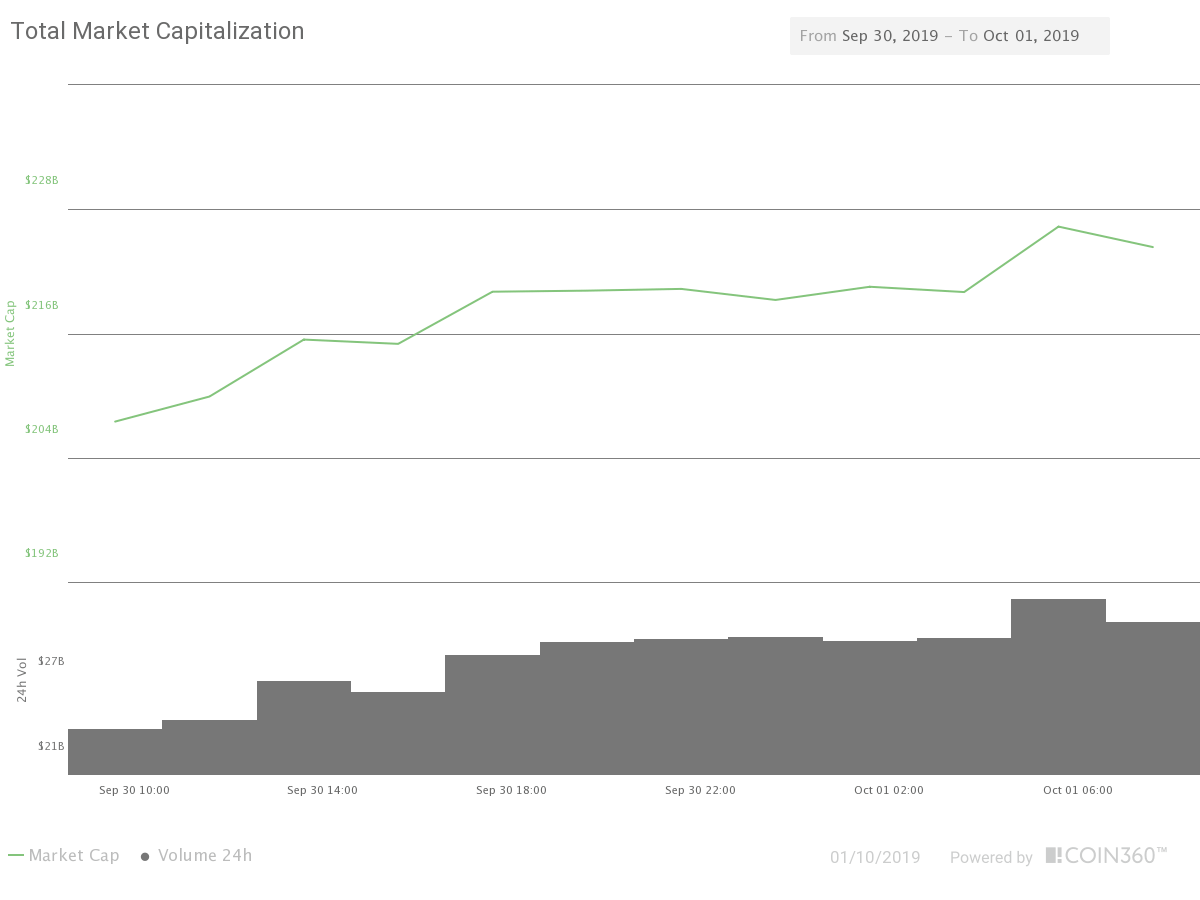
After its launch in 2012, it became the second-oldest crypto after Litecoin. As of October 2019, Ripple is the third-largest cryptocurrency by market cap – after Ethereum and Bitcoin.

Network Design and Security Model

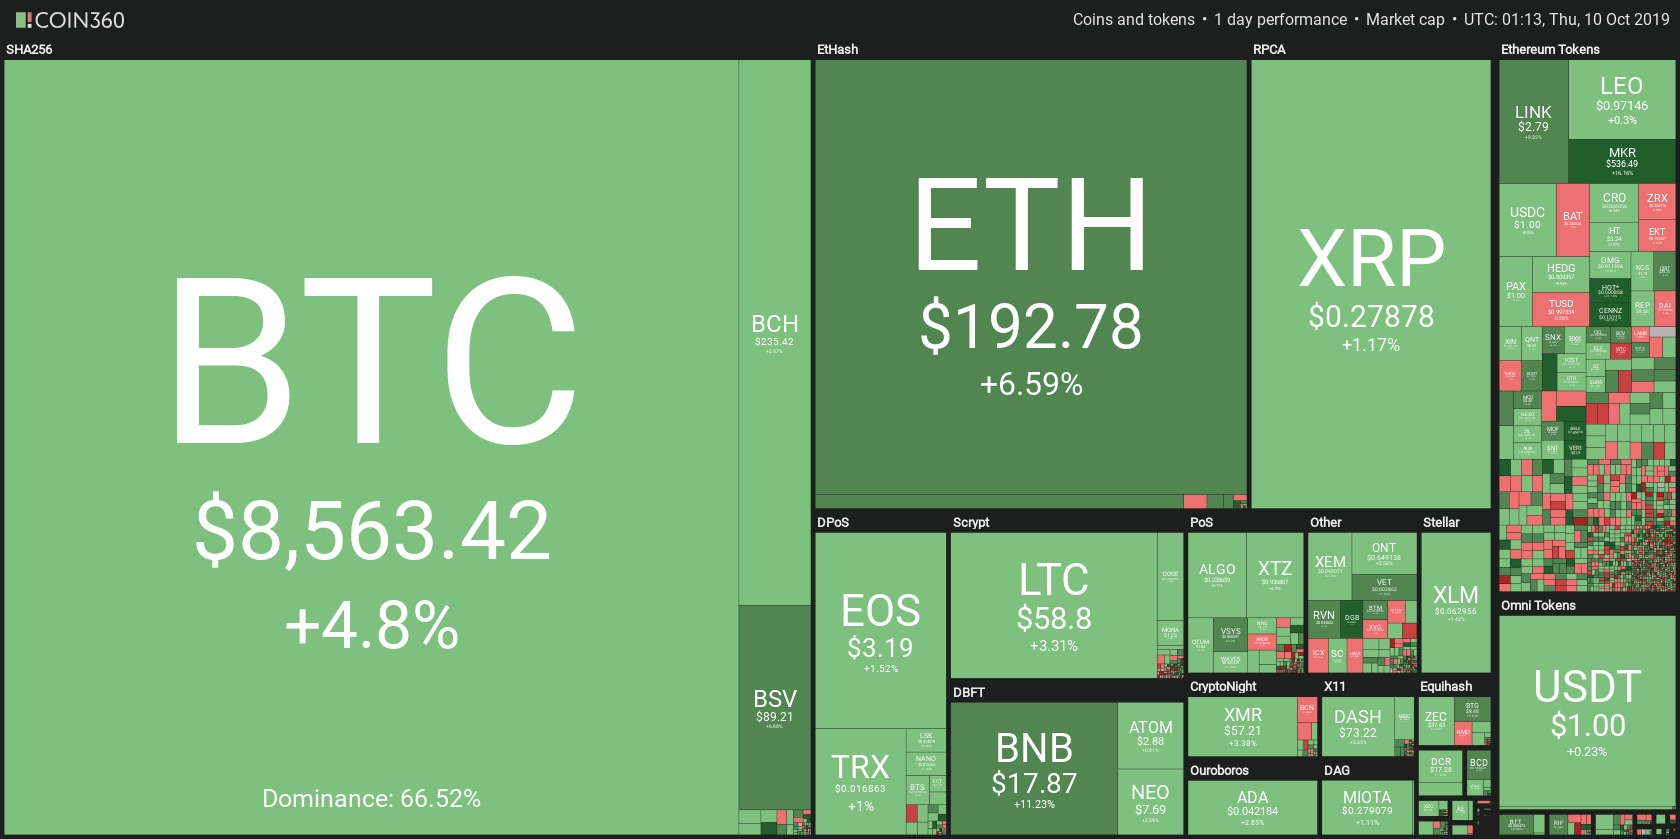
The XRP ledger is to Ripple what blockchain is to, say, Bitcoin. The ledger is a decentralized and peer-to-peer network of servers that powers borderless payments across multiple banking systems across the world. XRP acts as a bridge between currencies, making it easy to exchange any currency for another.

The XRP ledger uses the Ripple Protocol Consensus Algorithm (RPCA) to verify transactions. This algorithm enables the numerous nodes on the network to decide by consensus which transactions will go through, and in what order. These confirmations take only four seconds.

Monetary Policy of XRP

The maximum supply of XRP is 100 billion. The coins were all pre-mined before issuance, and according to Ripple, no other coins can ever be created. 

20 billion coins were given to Ripple founders Chris Larsen, Arthur Britto, and Jed McCaleb. Another 20 billion has been sold to companies and individuals, 7 billion is held by Ripple. In 2017, Ripple placed 55 billion in an escrow account, releasing a billion XRP each month for the next 55 months. At the end of each selling period, all unbought coins will be returned to escrow accounts for issuance beyond the 55 months. To decrease XRP’s supply overtime and prevent its devaluation, Ripple destroys XRP coins after they have been used to facilitate transactions. 

XRP can be divided down into six decimal places, and the smallest unit is known as a drop. This means 1 million drops are equal to 1 XRP. 

Differences between XRP and Bitcoin

Being the native currency for the Ripple ecosystem, XRP significantly differs from other cryptocurrencies in several ways. And since Bitcoin is the pioneer and the most popular of all cryptos, it makes sense to juxtapose the two to understand XRP better. Here is how the two cryptos differ:

☑️Aim of Development: Bitcoin was created as a digital means of exchange, but without the central authority and control exercised over fiat currencies by banks and governments. By contrast, Ripple was created for the banking system as a payment settlement, remittance system, and currency exchange. The idea was to design a system for asset transfers that were quicker, cheaper, safer, and more transparent.

☑️Mining Rewards: Ripple is not designed to be mined, unlike Bitcoin. All 100 billion XRP coins were pre-mined before their release. Only 43 billion are in circulation as of October 2019. On the other hand, Bitcoin has to be mined before being released, and miners get mining rewards in the form of BTC coins. 

☑️Protocol: Bitcoin is enabled by a technology known as blockchain to verify and confirm transactions. XRP is powered by an independent, patented ledger known as Ripple Protocol Consensus Algorithm to process transactions. Also, Bitcoin uses a proof-of-work mechanism to validate transactions, while Ripple relies on a consensus protocol to do so.

☑️Transaction Speed: Bitcoin transactions take 10 minutes on average, while XRP transactions take an incredible 4 seconds.

☑️Approach to the Banking Establishment: Bitcoin and other cryptocurrencies are disruptive to the established monetary system, with the potential to replace it in the future. Conversely, Ripple is cozy with the established system, with its value proposition, in fact, relying on being adopted by banks as a payment and settlement network.

Where to Buy and Store XRP

You can buy Ripple at any of the popular cryptocurrency exchanges, including Coinbase, Bittrex, Kraken, Binance, and Changelly.

For those intending to hold the coin for the long term, it is recommended to store your currency in cold (offline) storage such as a hardware wallet because it’s much safer and invulnerable to hacking attempts. An example of such a wallet is the Ledger Nano S and CoolWallet S, both of which support XRP.

For more active and frequent traders, having a software wallet such as Ripple’s own wallet or Edge and Abra wallets is more appropriate. Also, bear in mind that to store your coins in a Ripple Wallet, you need to deposit a minimum of 20 XRP. 

Should You Invest in XRP? 

XRP offers a quicker way for banks to process transactions faster, which could streamline banks’ operations in a major way and benefit both sides massively. Therefore, the question of whether XRP is a good candidate for investment depends on whether more banks and other financial institutions will adopt it as their payment and settlement infrastructure. Since no one is sure whether Ripple will succeed in its vision, the future value of XRP remains highly speculative for now. 

In any case, there is no such thing as a safe investment, and each decision bears a risk. Therefore, it’s entirely up to you to decide. 

Conclusion 

Being one of the most talked-about cryptocurrency and with its current rank among cryptos, Ripple looks set to continue being dominant in the crypto space. However, its potential for increasing in value hinges very much on the attitude of the banking establishment, something the crypto community is watching keenly. 


Categories
Crypto Market Analysis

Daily Crypto Review, Oct 23 – Stablecoins may be considered securities, crypto markets in the red today

The cryptocurrency market is in the red for the past 24 hours. Most of the day has passed by without any downside resistance whatsoever. There has not been any new money coming into the markets as volume seems to be a bit lower than average. However, the downward-facing moves were not weak, but rather steady and stable. The market is now trying to find a price level to consolidate. As for the top3 cryptocurrencies, Bitcoin went down 3.03%, while Ethereum lost 4.3% of its value and. XRP was down 3.01% in the past 24 hours. Out of the top50 cryptocurrencies, BAT performed the best with its gains reaching over 7.5%.


Bitcoin’s dominance increased a fraction of a percent when compared to yesterday’s value. It now sits at 66.5%, which represents a 0.01% increase from the previous day.


Most cryptocurrencies ended up being in the red in the past 24 hours. This, of course, slightly increased the value of the cryptocurrency market as a whole. The industry now has a market capitalization of $217.4 billion, which represents a $5 billion decrease from the previous day.

What happened in the past 24 hours

Cryptocurrencies have had both positive and negative news in the past 24 hours.

As reported by CoinDesk, Morgan Creek Digital managed to raise $60.9 million for its second blockchain venture capital fund. It seems that two pension funds invested $50 million into the project. This is more than double what they initially started with ($21 in the first blockchain fund).

The US Congress may consider a bill which would classify stablecoins as securities. This bill draft was published on Tuesday by Rep. Sylvia Garcia. The bill wants to regulate stablecoins under the Securities Act of 1933, seeking to provide clarity in an area the bill suggests lacks regulatory guidance.

Technical analysis

Bitcoin


Bitcoin has managed to break a bull flag downwards, making quite a bearish announcement to the market. If we take a look at the charts, the downtrend that started on Sep 30 ended up with a bull flag that broke upwards and increased in price right to the 161.8% of the downwards-facing move. After that, another similar downtrend started and we’ve come to the point when a bull flag was starting to rise. Everyone was expecting it to break upwards and Bitcoin to attempt to reach new highs (a 161.8% increase would mean a price of $9,440).

However, Bitcoin managed to fail the pattern and broke it downwards. Its price stabilized at just below $8,000.

Ethereum

Ethereum has lost over 4% of its value in the past 24 hours. It seems to be forming a falling wedge pattern on the daily chart. One more descending move is to be expected before Ethereum could attempt a price increase. However, if that does not happen, even a price of $110 is not excluded.


At the moment, Ethereum is sitting at $167, with a big support line being at $157. Its volume is at extremely low levels and RSI is approaching oversold territory.

XRP

XRP broke its ascending trend range and fell to $0.288. After creating a range that it moved in all the way from Sep 19 until now, XRP managed to break it downwards. It is now trying to recover and get back into the range, but the attempt has been unsuccessful so far.


XRP’s volume is average while its RSI is neither oversold nor overbought. It would take a significant increase in bull power in order for XRP to get back in its lane. If that does not happen, however, XRP has strong support sitting at $0.266.

Categories
Crypto Market Analysis

Daily Crypto Review, Oct 22 – Slow day for cryptocurrencies, Bitcoin SV skyrocketing

The cryptocurrency market has been pretty stagnant in the past 24 hours. After a green day (for the most part), cryptocurrencies have consolidated at their respective prices. The past 24 have been pretty stable when it comes to volume. Even though the majority of cryptocurrencies are in the green, there has not been any significant increase in the top-3 cryptocurrencies. However, Bitcoin SV skyrocketed and increased more than 20% in the past 24 hours. Bitcoin went down 0.56%, while Ethereum lost 0.13% of its value. XRP was the biggest gainer out of the top3, with a price rise of 2.25%. Bitcoin SV is the best performing large cryptocurrency in the past 24 hours (with the gain of over 15%) while the rest are pretty stable and have increased or decreased in price by a few percents at maximum.

Bitcoin’s dominance dropped a fraction of a percent when compared to yesterday’s value. It now sits at 66.4%, which represents a 0.02% decrease from the previous day.

Most cryptocurrencies ended up being in the green in the past 24 hours. This, of course, slightly increased the value of the cryptocurrency market as a whole. The industry now has a market capitalization of $222.86 billion, which represents a $0.5 billion increase from the previous day.

What happened in the past 24 hours

The global economy is looking pretty weak at the moment. Several central banks across the world have had to impose rate cuts. While the supply of fiat currencies has been growing in the past couple of years, Bitcoin’s block rewards are decreasing in an event called “halving.” Bitcoin’s new supply will drop even further after halving in 2020. Previous instances of halving resulted in a sharp price increase of both Bitcoin and the other cryptocurrencies.

Technical analysis

Bitcoin

Yesterday’s spike got Bitcoin all the way up to $8,320. However, that price did not hold up against the falling pressure of buyers and the rising pressure of sellers. Bitcoin is trying to stabilize at either above or below the 38.2% Fib retracement line, which is at $8,200. The volume is average, and the RSI doesn’t show any signs of overbought or oversold trading. Bitcoin is now left in the hands of the bulls and the bears and their momentum.


Ethereum

Ethereum’s volume has been on the rise in the past 24 hours. The bulls seem to have taken over the wheel at the start, bringing ETH up to $179.5. However, as it could not break the $180 mark, Ethereum had to consolidate at a lower price. After bouncing from the 23.6% Fib retracement line, which stands at $173, Ethereum is consolidating between that line and the resistance line, which is sitting at $176.


Even though the overall volume seems to be higher when compared to the previous day, it is on the decline at the moment, which makes an upward-facing move quite unlikely.

XRP

XRP is on the rise in the past 24 hours. After consolidating in a range between $0.29 and $0.295, XRP had a parabolic move upwards. In a matter of minutes, its price rose from 0.292 to 0.303. However, the top of the movement got rejected quickly, and the price is not reversing downwards. XRP’s first point of support is the 23.6% Fib retracement line, which sits at $0.299. With bear volume increasing and RSI reaching the overbought territory, it is almost inevitable for XRP to consolidate below $0.3.


Categories
Crypto Market Analysis

Daily Crypto Review, Oct 18 – XRP taking over, green day for the crypto market

After a pretty grim-looking situation in the past couple of days, the cryptocurrency markets are seemingly stabilizing. The past 24 hours have shown us mostly buying pressure, which can be seen in the cryptocurrency market overview. Most of the top cryptocurrencies are green, with XRP leading the path. The volume seems to have decreased a bit, which could indicate that strong bears took a break.  Almost every single cryptocurrency ended up in the green today. Bitcoin went up 1.65%, while Ethereum gained 1.71% of its value. XRP was the biggest gainer out of the top3, with a price rise of 6.07%. Once again, XRP showed to be the most resistant cryptocurrency of this week.

Bitcoin’s dominance has decreased slightly when compared to the previous day. It now sits at 66.1%, which represents a 0.03% decrease from yesterday.

Most cryptocurrencies ended up being in the green in the past 24 hours, which reflected on the market cap of the cryptocurrency industry as a whole. The industry now has a market capitalization of $221 billion, representing an increase of a little over $3 billion.

What happened in the past 24 hours

As the selling pressure and volume altogether decreased when compared to the past couple of red days, we can conclude that the bears have taken a break, at least for a day. Many people see this as the beginning of a bear market, but we have yet to see what is coming for the crypto industry. Most cryptocurrencies bounced off their immediate support lines and managed to stabilize or even attempt to form new daily highs above the resistance lines. Only a handful of cryptocurrencies managed actually break them, but this could be considered a good sign for the bulls.

Technical analysis

Bitcoin

Bitcoin reached a low of $7,900 yesterday after a series of downward-facing spikes and strong bear presence. However, this support line was not broken, and Bitcoin managed to bounce up over $8,000. Its overall volume has decreased (as shown on the chart), which could represent bears backing off. However, the lack of volume also stopped Bitcoin from crossing over the $8,130 resistance line. After two attempts, Bitcoin is still making a move and trying to go above it, but the decrease in volume does not seem helpful.


Bitcoin’s RSI is also approaching overbought territory, which means that there is a high probability of this attempt of breaking resistance to be rejected as well.

Ethereum

Ethereum managed to distance itself from Bitcoin a bit in the past 24 hours. Even though they shared a similar fate, Ethereum’s moves were not a mirror of Bitcoin. After the low of $172.5, Ethereum’s bulls picked up the pace and started pushing the price up. Ethereum breezed through the $176 resistance line, which now turned into a support line. Even so, the low volume kept it from pushing further up. The upward-facing move was strong, but not strong enough. Ethereum managed to push through $178.8 and reached for $180.7 resistance line, but got rejected. This pushed the price back into a zone around the $176 support line, which holds for the moment.


Ethereum’s RSI is somewhere above the middle of the range, while its volume is constantly low.

Ripple (XRP)

Against all the odds, XRP has managed to rise during the hard times that the cryptocurrency market is in at the moment. After a fairly stable day, XRP brought in some new capital, which pushed it from $0.28 all the way up to $0.305. This move happened extremely quickly, as the majority of is move actually happened in one 30-minute candle. Besides the huge 30-minute spike in price and volume, XRP’s volume got higher when compared to the past day.


XRP is now struggling to keep its gains, and time will tell whether it will stay above the $0.3 or fall below the line.


Categories
Crypto Market Analysis

Daily Crypto Review, Oct 17 – Bears Taking Over, Cryptocurrencies in the Red

Cryptocurrency market’s attempt to stabilize its price after the new highs last week has failed, and bears have started taking over. Slowly but steadily, most cryptocurrencies lost their gains and then some. The past 24 hours came with an increase in volume as bear presence increased.  Almost every single cryptocurrency ended up in the red today. Bitcoin fell down 2.13%, while Ethereum lost 2.91% of its value. XRP held on a bit better and lost only 1.99%, which would put it at the spot of the cryptocurrency that lost the least in the past 24 hours out of the top10 (excluding Tether).


Bitcoin’s dominance has increased slightly when compared to the previous day. It now sits at 66.4%, which represents a 0.02% increase from yesterday.

Most cryptocurrencies ended up being in the red in the past 24 hours, which reflected on the market cap of the cryptocurrency industry as a whole. The industry now has a market capitalization of $217.73 billion.

What happened in the past 24 hours

As volume increased steadily for a couple of days now, people were expecting a move upwards. However, they were greeted with a surprise as the market started dropping in price. As suspected yesterday, we can now say with certainty that the volume is coming from the bears instead of bulls, at least in the past couple of days. Most cryptocurrencies tested their immediate support lines and broke them downwards, trying to reach a point of consolidation. Only a handful of cryptocurrencies managed to stay out of the red today, while most of the cryptocurrencies lost several percents of their value.

Technical analysis

Bitcoin

Bitcoin’s short-term chart looks pretty grim at the moment. The bulls have seemingly left the building, and the bears are running the place. With volume increasing dramatically (and not just for one quick spike), Bitcoin seems to be dropping down slowly all throughout the day. The price seems to drop quickly and then consolidate at the next support line, which then gets rejected, and the price gets lower. That’s exactly what happened three times since the last green day Bitcoin has had. Bitcoin’s immediate support is currently at $7,912, and it is holding up well for now.


Bitcoin’s RSI has just left the oversold territory while the price remained on the same level. As for volume increases, it looks like that the big downward-facing price spikes require less and less volume, while volume during consolidation periods is increasing.

Ethereum

As stated in yesterday’s article, Ethereum started mirroring Bitcoin’s movements due to a lack of identity at the moment (mostly volume). Ethereum started falling in price slowly, dropping from $181 to $179, which is when the big drop happened. The spike dropped Ethereum from $179 all the way down to $172 in just over one hour. This price level became support as Ethereum rejected lower price points. The price is now in between the $172 support line and the $176.3 resistance line.


While its volume seems to be elevated, it does not seem enough to break from the major influence that Bitcoin has become.

XRP

Unlike Bitcoin and Ethereum, XRP did not have such a bad day. Even though it lost some value, it did not break any support lines. One the other hand, it did fail to break a resistance line as it tried to push past $0.2855 on one occasion. After the attempt of breaking the resistance failed, XRP dropped down to its support line, which is sitting at $0.282 and bounced from it to the middle of the “range.” If other cryptocurrencies keep dropping in value slightly every day, XRP might follow, but there is also a high probability of it just staying where it is price-wise as the bear volume avoided coming into it (at least for now).


XRP has not seen the same volume increase as with Bitcoin and Ethereum, which further proves that bear money has entered the market (it just avoided XRP for some reason).

Categories
Crypto Market Analysis

Daily Crypto Review, Oct 16 – Another Red Day in Play

The cryptocurrency market has been trying to recover and find a point of consolidation for some time now. While most cryptocurrencies ended up in green yesterday, that is not the case today. Bitcoin fell down 2.05%, while Ethereum lost 3.05% of its value. XRP held on a bit better and lost only 1.47%.  Bitcoin SV did the best out the top10 cryptocurrencies, being the only one in the green. It managed to gain 6.11% in the past 24 hours.

Bitcoin’s dominance hasn’t changed all that much from yesterday, but it did fall a few fractions of a percent. Its dominance now sits at 66.2%.

Most cryptocurrencies lost a few percents of their value, which reflected on the market cap of the cryptocurrency industry as a whole. The industry now has a market capitalization of $222.99 billion, which represents close to a $5 billion drop from yesterday.

What happened in the past 24 hours

A steady increase in volume and a green day for most cryptocurrencies indicated bulls rallying. Today, however, prices fell even with the volume keeping its level. The volume seems to have been coming from the bears instead of bulls today. Most cryptocurrencies tested their immediate support lines and broke them downwards, trying to reach a point of consolidation. While some cryptocurrencies only lost a fraction of a percentage, many lost a couple of percent of their valuation.

Technical analysis

Bitcoin

After a green day yesterday, Bitcoin seemed strong as it tried to establish a support line at $8,300 and even contest new highs. The bulls could not pass through $8,395, which is when bears seem to have taken over. With volume remaining at the same levels, Bitcoin started dropping down slowly until one big red candle, which brought its price from $8,326 all the way down to $8,078. This price got rejected quickly, and Bitcoin found its new short-term support at the $8,130 level.


Bitcoin’s RSI is currently not in overbought or oversold territory, but the current position does not look good. If the price goes under the support level, Bitcoin might have to look for new support at a level below $8,000.

Ethereum

Ethereum suffered from the same faith as Bitcoin today. After having a great day, the bulls lost momentum, and bears took over. Unlike Bitcoin, Ethereum had low volume levels throughout the week. After failing to break the $188 price point, Ethereum went down to $176. As with Bitcoin, this price got rejected, and Ethereum found support at the 0% Fib retracement line, which sits at $177.85.


Ethereum seems to have low volume levels apart from the sudden spikes in volume, which correct its price upwards or downwards. This fact might implicate that Ethereum has a high probability of mirroring Bitcoin’s movements in the short-term.

XRP

XRP lost the least out of the top-three cryptocurrencies today. This fact can mainly be attributed to its superb gains from the day before. With its volume looking good, yesterday’s move had to retrace a little in order for it to be a healthy move.


With XRP not having enough strength to pass $0.3, bears decided to take things into their own hands. The price dropped to $0.283 but quickly sprung up to $0.286, which now represents its immediate support. It is still uncertain whether XRP will try to push higher, consolidate or try its luck at a lower price point.

Categories
Crypto Market Analysis

Daily Crypto Review, Oct 15 – Gradual 24-Hour Volume Increase

The cryptocurrency market has been trying to recover and find a point of consolidation in the past 24 hours. Most of the cryptocurrencies ended up slightly in the green, while some even went up by quite a bit. While Bitcoin gained only 0.86%, Ethereum went up by 2.57% and XRP by 5.75%. Stellar was the biggest gainer of the day out of the top10 cryptocurrencies by market cap, gaining 7.08%.

Bitcoin has remained a dominant force in the industry as it always was, but it has dropped a few fractions of a percent today. Its dominance now sits at 66.25%.

As mentioned above, most cryptocurrencies kept their price levels or went up in the past 24 hours. This could translate to the overall market cap of the cryptocurrency market in a positive way. The industry now has a market capitalization of $227.11 billion.

What happened in the past 24 hours

After a red weekend, cryptocurrencies are trying to recover and settle at their respective price levels. Most of them had a slight increase in volume and a few attempts to break immediate resistances. Some made it through, and some didn’t. Even so, almost all of the top cryptocurrencies maintained their price levels or went above their most recent lows, which could only indicate a return of the bulls. This time, Bitcoin is not the main player, as many altcoins managed to outperform it.


Technical analysis


Bitcoin

Once the low of $8,133 got rejected, Bitcoin tried to find a price to settle at. It was unsure whether that price will be above or below the 23.6% Fib retracement line, which is now at the price of just below $8,300. However, as volume gradually increased during the day, Bitcoin went above the line and contested the next resistance twice. The $8395 line was not so kind to Bitcoin as it could not pass through it either time. Both attempts were rejected, and Bitcoin is now settling in between the Fib retracement line 23.6%, which now acts as support and Fib retracement 38.2% line, which is the immediate resistance.


As Bitcoin is now in a limbo between the two lines, RSI shows us that it’s not oversold or overbought. One thing that is different this time is that, unlike over the weekend, the volume increase was not sudden and a one-time thing. Bitcoin’s volume in the past 24 hours has been elevated, rather than it being one big spike of volume and then back to normal.


Ethereum

Ethereum has, similar to Bitcoin, denied its low of $178 and tried to find a price to consolidate at. With new money seemingly coming in, Ethereum slowly moved above the 23.6% resistance line now turning support, but quickly lost its momentum and headed straight back down. However, the bulls rallied, creating a sudden spike in price, skyrocketing Ethereum past two resistance lines ($182 and $185.5). The bullish sentiment toned down at that point, making the upward-facing move unable to reach another milestone and pass $188. Ethereum kept its daily gains and is now consolidating at $187.


XRP

XRP has had a great day. Unlike Bitcoin, which managed to consolidate or Ethereum, which made a slight move upwards, XRP skyrocketed and breezed through its resistance lines. The move completely nullified the whole weekend of price losses and then some. Its price went up from $0.273 all the way up to $0.3, which is its significant resistance. XRP is currently making moves towards reaching above this price, and only time will tell if it will be broken soon or not. However, the volume seems to be gradually tapering off, which might not be a good sign for the XRP bulls.


Categories
Crypto Market Analysis

Daily Crypto Review, Oct 11 – Healthy Consolidation Following a Green Day

The cryptocurrency markets are almost entirely mimicking the happenings we covered a few days ago. The market is trying to find a balance point to consolidate at, just like it did a couple of days ago. While Bitcoin did not go down, the other cryptocurrencies still try to find their points of consolidation below their highs from yesterday. Bitcoin went up all the way to $8710 and kept almost the same price level throughout the day. Most of the cryptocurrencies reached RSI overbought territory and started to decline in price as well as in volume. Bitcoin gained 0.04% on the day, while Ethereum went down 0.49% and XRP by 3.21%. Most of the top cryptocurrencies are in slight red today, but there have been no significant price fluctuations.

Bitcoin has managed to score a few fractions of a percent and add them to the dominance chart as it was one of the cryptocurrencies that did not drop in price today. The market capitalization of the crypto markets decreased slightly over the past 24 hours and is now standing at $230.57 billion.

What happened in the past 24 hours

After the upward-facing move in price came into the markets yesterday, markets decided to consolidate as there were no major resistances that could be broken. Most cryptocurrencies consolidated at their daily highs or slightly below them. After the influx of new money coming into the market yesterday, charts showed us a considerable increase in volume. Even though the price jump is over, some of the volume managed to stay in the markets, which is now that much more liquid than it was before the jump.

Technical analysis

Bitcoin

After reaching the price of $8,710, Bitcoin started to show signs of a possible retracement as the volume began to lower. RSI entering heavily overbought territory further proved the case. Bitcoin, however, did not retrace at all. It just consolidated at nearly the same price that it went to the price spike. After drawing a new Fib retracement line from the start of the new price jump, we can see that it is still uncertain whether Bitcoin will go above or below the 23.6% retracement line. The 38.2% line was, however, tested once today. The price briefly dropped below it, but quickly recovered and gained slight upward momentum.


If we take a look at the volume, we can clearly see that it is not the same as it was during the spike. However, it can also be seen that the volume is much higher than what it was before the spike.

Ethereum

Ethereum has, following Bitcoin, going upwards yesterday. It reached a critical resistance line from September at $196 and bounced back from it. The price dropped as low as $188 but managed to recover some of its value. Ethereum is now trying to consolidate above or below the newly-made 38.2% Fib retracement line. It is more likely that the price will end up above the line at this moment as Ethereum keeps rejecting lower price points, but only time will tell where it will actually consolidate.


The volume, just like with Bitcoin, has increased when compared to what it was before the price spike.

XRP

Unlike Bitcoin and Ethereum, XRP did not have such a good day yesterday. It did go up but only touched $0.29 before dropping down to the price level of after the October 7th price spike. The price retraced all the way to the newly-made 61.8% Fib retracement line before finding support. That support seems to be holding for now.


XRP’s volume seems to have returned to the levels it was before the price jump, making it close to impossible to push through the immediate resistances.

Categories
Crypto Market Analysis

Daily Crypto Review, Oct 10 – Market pushes up again, majority of cryptocurrencies in the green

After yesterday’s day of consolidation, the markets decided to head up and test new prices. With increased volume and new money coming into the market, Bitcoin increased its price by 4.5%, while Ethereum managed to go up by 6.62% and XRP by 1.35%. After reaching RSI overbought territories, the prices started stabilizing at the same or slightly lower levels, while RSI managed to settle down.

As both Bitcoin and most altcoins are in the green, the total cryptocurrency market cap has increased. It is now hovering at around $231,8 billion, just down from the daily high of $232,47 billion. Bitcoin is still keeping its dominance high, currently being around 66.6%.

What happened in the past 24 hours?

Cryptocurrency markets, judging by the increase of volume, have had an influx of new money coming. That has sparked some solid price growth, especially if we expand our views to not only Bitcoin but the rest of cryptocurrencies. Out of the top50 cryptocurrencies, only eight have been in the red. Out of the eight being in the red, half of them are stablecoins, which happen to lose out when the cryptocurrency markets go up. On top of this upward-facing move, the prices are not consolidating far below the levels they reached today. In fact, most of the cryptocurrencies kept their gains and are looking promising in the short-term.

Technical analysis

Bitcoin

Bitcoin has reached a new short-term high of just above $8700, before stabilizing its price at just below $8,600. The new influx of money coming into the markets helped Bitcoin surpass the immediate resistances and start making its way up. With volume skyrocketing, Bitcoin flew through the immediate resistance lines and stopped as the volume started reducing. However, it did not lose its gains and started consolidating at the top, which is rarely seen. This move has sparked some new thoughts in terms of whether the altcoins season has started or not. As the price reached the top of the movement, RSI indicated it was heavily overbought but managed to reach lower levels as the price consolidated.

Ethereum

Ethereum has surpassed Bitcoin in gains today, reaching the price of $196.3. It has retained its gains and started consolidating at close to its daily highs, which is a highly bullish sign. However, that may not be as promising as it sounds. Ethereum found new resistance at the $196.3 line. This price point acted as support and resistance as far as September and proved to be effective as both support and resistance. Only time will tell whether Ethereum can surpass this resistance, or if it will fall back to its previous levels.

On a brighter note, Ethereum’s RSI is almost identical to the one currently seen on the Bitcoin chart. After being heavily in the overbought territory, it started to fall while the price did not follow it. Even though the volume died down quite a bit, it still sits at a higher level than what it was before today’s spike.

XRP

Unlike Bitcoin and Etherum, XRP did not have a particularly good day. XRP moved, fueled by the price growth of Bitcoin and other cryptocurrencies, passed the 23.6% resistance line that the Fib retracement from the Oct 7th-Oct 8th move. However, it quickly found resistance at the top of the Fib retracement (0%), failed to break it, and retraced to the 23.6% line, which now acts as support.

Another thing separating XRP from the top2 cryptocurrencies at the moment is volume levels. Unlike the other two, XRP’s volume is currently lower than what it was before the upward-facing spike. Even with the RSI indicator reducing and the price staying relatively high, it might not be enough to keep XRP on a green path.

Categories
Crypto Market Analysis

Daily Crypto Review, Oct 03 – Slight advances on Decreasing Volume

Yesterday, cryptocurrencies moved sideways during the European and American sessions. Then, they advanced slightly during the Asian session.  Bitcoin gained +1.71%. ATOM /+7.38%), and LINK(+8.63%) experienced the more significant gains of the last 24 hours. Market cap is currently $221.85 billion (+0.59%), and the dominance of the Bitcoin is 68.25%.

fig 1- 24H market capitalization and Traded Volum


Fig 2- Heat Map of the crypto sector

What is Happening?

An exchange-traded product (EPT) combining Bitcoin and Ethereum has been made available on SIX, Switzerland’s Stock Exchange.  The product comes from a collaboration between Fintech firm Amun AF and Bitcoin Suisse AG, a Swiss cryptocurrency custodian. The EPT trades under the ticker symbol ABBA.  Source: The Block.

US Congressmen French Hill and Bill Foster are worried the Dollar is left behind for the rise in cryptocurrencies and issued an open letter to the Federal Reserve asking Jerome Powell to create a Digital Dollar. Source: dailyhodl.com.

The Indonesia government is hosting an eight-nation international conference on cryptocurrencies. The nations participating are Turkey, Singapore, Australia, Malaysia, Thailand, Russia, and Hong Kong. According to knowledged sources, Indonesia is hosting this conference with the aim of providing lawyers and enforcement agents with the knowledge needed to fight crypto-related crimes. Source: btcmanager.com.

BitPay will add support for Ripple (XRP) by the end of the year. Source: The Block.

Samsung-backed Blocko has launched in the UAE. In April 2018 the Dubai announced its Emirates Blockchain Strategy 2021, which aims to migrate 50% of its transactions to a blockchain platform. Blocko, in partnership with SEED Group, will be part of the effort to bring this plan to reality.  Source: coindesk.com.


Technical Analysis


Bitcoin

Bitcoin had modest advances during the last 24 hours. That said, the buying interest seems to be limited. Currently, the daily chart shows that the price has been encountering resistance in the 200-day MA (green). We see also that the volume is shrinking as the price advanced.


The 4H chart shows the price still moves in the upper side of the Bollinger band with the MACD in a bullish phase that gives a bit more weight to a short-term continuation to the upside. We see also that the 8,519 level is a fierce resistance level and that 8,200 has been holding the price lately. Therefore, these are the levels to watch. A Credible break of one od them will signal the future price direction.


Ethereum


Ethereum continues moving with a slight upward bias. The Bollinger mean line has been holding the price for some time. Currently, we see the price in the middle of the ascending channel, but what we see suggests the price is moving to retest the $185 resistance. A break below $177 will invalidate this scenario.


Ripple


Ripple still directionless after the large bullish candle. The price moves still in a band between 0.2468 and 0.257.  To be bullish, we need to see the price above the 0.253 level. A break of the 0.246 support will mean a possible visit to the 0.234 level and invalidate the bullish candlestick made on September 30.


Categories
Crypto Market Analysis

Daily Crypto Review, Oct 2 – Pullback Day or Dead Cat Bounce?

Yesterday, cryptocurrencies behaved as expected, retracing some of their Monday’s gains. Early morning losses continued. Bitcoin lost 2.47% over its 24-hour value. Most altcoins joined the movement such as Ethereum (4%), Ripple (-4.04%), Bitcoin Cash(-4.47%), EOS(-4.57%), Bitcoin SV(-6.15%)  and TRON (-5.61%).

The market cap descended to $218.5 billion, while the 24H volume was $26 billion, as seen in the figure below.

The current market dominance is as follows:

  • BTC:67.55%
  • ETH:8.62%
  • XRP:4.85%
  • BCH:1.82%
  • LTC:1.60%
  • EOS:1.24%
  • Others:15%

The Heat map here, shoes that, as usual, the whole sector moves with almost perfect correlation.

What happens

Ethereum-bases dApp FairWin has collapsed after the exposure of a vulnerability in its smart contract. Researches found the platform admins could drain the entire balance in the dApp easily, an $8 million worth of ETH stored in the platform. Researchers found $250,000 was stolen in a previous version. Source: Medium.com.

According to an article by condesk.com, major Libra backers Visa and Mastercard are re-thinking its participation in this digital project. Libra has been the trigger for regulators to start worrying for the irruption of digital assets and Libra has been opposed by European financial authorities saying Libra could destabilize the Euro, while the US Congress has demanded a complete halt on its development.

The Federal Reserve injects the USD worth the entire crypto market cap in days according to this article by beincrypto.com. The last one is said to add $162 billion to the total USD supply. US FED noted that it is a temporary measure.


Technical Analysis


Bitcoin


Bitcoin’s price has been losing ground after making a double top at $8,519. The MACD is dangerously approaching a bearish transition, while the price is currently sitting on the mean line of the Bollinger Band, at 8,200. That was our expectations yesterday. Thus, nothing to worry about unless weakness continues and the price keeps moving to the lower side of the Bollinger bands and challenge the $8,000 again.


Ethereum


Ethereum is moving in an ascending channel, a weak form of trending. Its price made a high at $185, then during the latest 4H candles has been retracing. At the moment of this writing, the price was held by the mid-line of the Bollinger Bands. MACD is also close to a bearish crossing. The figure created by the latest price action suggests the entire channel is a consolidation of the significant drop made on September 24. Short-term, if the price holds, we see a new test of the $185  high, although the price might go visiting the lower side of the channel.


Ripple


Ripple has retraced more than 50% of the large candlestick made on Sept. 30. Now the price is touching the upper border of the band where it had been ranging before that bullish candle. That may be a supply zone of people who wanted to go long that day but were late.  That means a bounce off of this level is likely. If that does not happen, then the bullish candle was just a trap for bulls, and the movement is negated.


Litecoin


Litecoin is starting to show signs of buying interest. The price has been held by the Bollinger mean line and now has headed up. MACD is bullish, also. The movement is still feeble, and $57 acts as a resistance level, so to confirm a bullish scenario we would like to ask for a close above that level.


Categories
Crypto Market Analysis

Daily Crypto Update, Oct 01 – Reversal Day!

Yesterday was a reversal day. Bitcoin went down from $8,054 to touch $7,701 to swiftly reverse its path and close above $8,300. Other cryptocurrencies followed. The heatmap here testifies the 24H advances, with Bitcoin, BCH, BSF, ETH, and XRP  up more than 7% over its previous session. Market capitalization went up to $224.8 billion with a traded volume of $33.4 Billion.

Fig- 1 Market Cap and Traded Volume

Fig 2 –  24-hour Heat Map


The News Front

Industry giants Coinbase, Bitrex, Kraken, Anchorage, and others join to form the Crypto Rating Council to qualify on how likely a coin is likely to be regulatory compliant and characterize tokens into currency, commodity, security or something else. The notable exception is Binance, which seems it has been excluded. Source: beincrypto.com.

SEC announced it had settled an agreement with Block.one the company behind EOS to settle the charges for raising billions in an ICO, back in 2017.  Block.one agreed to pay a “civil penalty” of $24 million. Source trustnodes.com.

Cardano is partnering with New Balance shoemaker to authenticate the company’s premium line of sports shoes. Cardano can produce blockchain.based data that consumers and stores can trust. Source: dailyhodl.com.

Bitpay achieves Service Organization Control (SOC2) compliance. That certification means BitPay is certified for confidentiality, security, privacy, processing integrity, and availability.  Source: cointelegraph.com.


Technical Analysis


Bitcoin


After creating a double bottom, yesterday bitcoin made a reversal day. The price made a kind of harami in the 4H chart and continue moving up to cross the Bollinger line mean and then the +1SD line. By crossing that line and then moving near the +1SD line, we should assume a new upward trend is initiated. MACD also confirms the bullish phase of the bitcoin.

Right now the price has bounced off of the $8,524 level, which touches the 200-day moving average on the daily chart. That means it is a tough resistance level to cross. If crossed, the price will need to fight the 8.800 level with is June’s 02 topping area. Right now BTC may need to consolidate near the Bollinger Mean line before continuing with the trend.


Ethereum


Ethereum has confirmed its bullish leg up by making another higher high and higher low. MACD and Bollinger bands are in agreement, obviously since indicators lag the price action. Currently, the price was rejected by the $185 resistance and is retracing some of the recent advances, as the price is overextended. We estimate that the price will retrace near its $177 support and, then continue its way up.  A breach of the $177 level ( on a closing basis) would imply less buying strength than anticipated.


Ripple


Ripple has made a sharp impulsive candle on strong volume, yesterday, and since then is making corrective candlesticks near the top of that range, the price hold by the 200-period MA. That is fine since this candle created a price overextension that now is being corrected. The MACD and Bollinger Bands confirm XRP has started a bullish trend, so buy the dip is the motto here. The chart shows the current key levels for this asset.


Categories
Crypto Market Analysis

Daily crypto update 10.07.2018 – Panic selling


General overview


Market Cap: $253,116,207,195

24h Vol: $13,918,432,489

BTC Dominance: 43.3%

In the last 24 hours the cryptocurrency market capitalization fell from 276,940,000,000$ which was yesterday’s high to around $253B where it is currently sitting.

The market is consequently in red with an average percentage of change among top 100 coins being 11,4%.


News


There aren’t any fundamental news that is causing this crash that we are seeing in the market. There are some negative news headlines nevertheless but they aren’t that significant to cause this panic selling.

Harmless for Now, Dangerous in the Future: Here’s What EU Researchers Think of Cryptocurrencies

On July 9, a “Monetary Dialogue” session was held by the Committee on Economic and Monetary Affairs Committee (ECON) of the European Parliament. It’s a quarterly conference that is directly interlinked with the European Central Bank (ECB): Every three months, the president of the ECB (or, occasionally, another representative) appears before the Committee to report on the state of monetary policy in the union.

Exclusive: Following ‘Security Breach,’ Bancor Expects to Be Online in 24 Hours

Bancor halted operations this Monday due to an investigation of a “security breach,” which involved more than $12 million. The platform confirmed the breach on its Twitter account, saying that “no user wallets were compromised.” The cybercriminals reportedly exchanged some of the tokens through conversion service Changelly. Sources familiar with the matter told Cointelegraph that the stolen tokens included Bancor’s native token BNT, about 25,000 Ethereum (ETH) ($12.2 million), and 300,000 Pundi X (NPXS) ($1,200).

Former World Bank Chief Economist: Bitcoin Will Fail as Governments Increase Regulation

Three major American economists have recently spoken negatively about Bitcoin’s (BTC) chances for survival in an interview with Financial News today, July 9. Joseph Stiglitz, Kenneth Rogoff, and Nouriel Roubini all made statements arguing that Bitcoin will fail as a currency, namely criticizing the cryptocurrency’s absence of intrinsic value and its price volatility. Stiglitz, a Nobel Prize-winning economist and professor at Columbia University, in particular criticized Bitcoin’s anonymity, which he argued contradicts the idea of creating “a transparent banking system.”

Source: cointelegraph


Crypto Market Analysis


BTC/USD

From yesterday’s high at 6730$ the price of Bitcoin has fallen by 5,43% and is currently sitting at 6364$.


Looking at the hourly chart we can see that the support line at yesterday’s levels was broken with a massive red candle as the uncertainty overruled the market, so the price fell to the next support level is found. This support level can’t hold the momentum behind the move which is why I am expecting more downside in the following days.


Market sentiment 

Bitcoin is in the sell zone.

Oscillators signal a buy, but moving averages signal a strong sell.


Pivot points

S3 6294.4 
S2 6497.8 
S1 6582.3 
P 6701.2 
R1 6785.7 
R2 6904.6 
R3 7108.0

ETH/USD

From yesterday’s high at 484$ the price of Ethereum has decreased by 10,46% as its currently 433$.


As you can see from the hourly chart, the price fell steeply which is a strong indicator that the sell of has begun. The price found some temporary support on the first significant level, but as this levels isn’t that strong we can expect a small consolidation before another drop.


Market sentiment 

Ethereum is in the sell zone as indicated by hourly chart technicals.


Pivot points

S3 437.46 
S2 456.74 
S1 464.14 
P 476.02 
R1 483.42 
R2 495.30 
R3 514.58

XRP/USD

From yesterday’s high at 0.481$ the price of Ripple has fallen by 7,1% and is currently sitting around 0.446$


Looking at the hourly chart we can see that the price has fallen below the 0 Fibonacci retracement level which is the level of the prior low on the daily chart. As the momentum is strong I am expecting this downtrend to continue.


Market sentiment 

Hourly chart technicals signal a sell.


Pivot points

S3 0.45342
S2 0.46450 
S1 0.46889 
P 0.47558 
R1 0.47997 
R2 0.48666 
R3 0.49774

Conclusion


In my yesterday’s update I have stated that the uncertainty may cause panic selling, and that is exactly what happened. Now that the sell-off has started I am expecting the prices to create lower lows which would in the case of Bitcoin be around 5500$.

Categories
Crypto Market Analysis

Daily Crypto Update 22.06.2018 – Big Bear Field

The market is completely red with losses of double digits in many currencies in a drop that was coming due to the pressure that the market has had all week. The market is showing its volatility again and I see there are some effects (not proven) according to news from Japan. The Financial Services Agency (Regulator in the country) has ordered six exchanges to improve their businesses and to improve their anti-money laundering measures. Some of them stopped adding new clients and started to review the identities of existing account holders. The pressure continues in the crypto field and we will surely see new minimums in many of the cryptos before seeing a reversal.


General Overview


Market Cap: $261.006.460.133

24h Vol: $14.560.479.309

BTC Dominance: 40.7%

The Market Capitalization dropped 20B in just 24 hours which shows the power of sellers at the moment, I think the market will have another bearish boost before Sunday where BTC could lose its $6000 value and very probably will test the $5,700


News


Japan Slaps 6 Licensed Cryptocurrency Exchanges with Business Improvement Orders
Japan’s financial regulator has targeted six licensed cryptocurrency exchanges to issue business improvement orders, ramping up its scrutiny of the
sector.

Breaking: Mt. Gox Case Moved to Civil Rehabilitation, Creditors May Be Paid in Crypto
Creditors holding bitcoins at infamous cryptocurrency exchange Mt. Gox may recover their funds, after all, a court has ruled.

NANO Issues Alert on Android App Vulnerability, Urges Users to Move Funds
NANO, which recently rebranded from RaiBlocks in January 2018, has issued a statement alerting users about a vulnerability in their android wallet, urging them to move their funds to a new wallet. This applies to anyone who generated a wallet seed using the NANO android wallet, which was released just a few hours ago.

Japan’s Biggest Cryptocurrency Exchange Suspend New Accounts amid Stricter Regulation
Merely three days after the Japanese government and local financial authorities requested cryptocurrency exchanges improve their infrastructures, bitFlyer, the country’s biggest cryptocurrency exchange, has suspended the registration of new accounts to overhaul its Anti-Money Laundering (AML) and Know Your Customer (KYC) system.

Source: ccn.com


Analysis


XRP/USD

XRP has broken all the daily pivots and also broke the level of $0.50 to the downside and is trading at $0.49 cents, the pair has lost more than 7% in the last 24H and is sitting now at $0.4929. The next support for the price is $0.4803 which I think can be reached in the next hours.


Market sentiment

4-H chart technicals signal a sell sentiment.

Oscillators are showing sell signals and pointing down.


Pivot points

R3 0.5655
R2 0.5575
R1 0.5459
P 0.5379
S1 0.5263
S2 0.5183
S3 0.5067

LTC/USD

Litecoin price comes under heavy selling pressure as are all the currencies in the charts. The price has dropped almost 12% in the last 24H and it is at the lowest levels seen since 7th December 2017, now the price is sitting at $85.03 and the immediate support is $82.69.


Market sentiment

4-Hourly chart technicals signal bearish.

Oscillators are showing sell signals and pointing down.


Pivot points

R3 102.19
R2 100.70 
R1 98.71 
P 97.02 
S1 95.20 
S2 93.80 
S3 91.84

EOS/USD

EOS price dropped considerably during the trading session and reached reach a 2-month low of $8.20 loosing over 15.71% in the last 24H. The RSI and Stochastic indicators are showing oversold and pointing down, the bear’s strength is completely high and the negative hype can continue during the weekend for the pair.


Market sentiment

4-Hourly chart technicals signal bearish.

Oscillators are showing sell signals and pointing down.


Pivot points

R3 11.48
R2 11.17 
R1 10.78 
P 10.47 
S1 10.09 
S2 9.78 
S3 9.38

 Conclusion


Many of the major cryptocurrencies have contributed with their losses to the market drop of around $18 billion in the past 24 hours, it seems to be a short-term decline but this significant momentum could continue if the Bitcoin price manages to pass the important level of $ 6,000. You will see the drop down all weekend until we see a recovery.

Categories
Crypto Market Analysis

Daily Crypto Update 29.05.2018 – Price Action is Showing Signs of a Struggle


General Overview


Crypto Coin Market News:

Market Cap: $306,776,676,366 
24h Vol: $15,425,897,276 
BTC Dominance: 39.8%

In the last 24 hours, cryptocurrency market capitalization has been declining steadily from $328,1B which was yesterdays high to $306B where it is currently sitting. 
Crypto Coin Market News:

The market is mostly in red as you would presume, with an average decline of 3-4% among top 100 coins. There are some in green as well. For example, Cardano (ADA) is up by 6.4%, Icon by 2.16%, Golem by 5% and CyberMiles is the biggest gainer amongst the top 100, experiencing an increase of 21%.


Crypto Coin Market News


Top stories that came out in the last 24 hours are mostly about fundamentals and are analytical in nature. As far as sentiment is concerned, it looks like the tone is bullish reassuring.


Despite Hitting Monthly Price Lows, Bitcoin Network Fundamentals Keep Growing

While the crypto markets overall are seeing a downward trend, some of the fundamental Bitcoin indicators such as the hashrate and the number of the Segregated Witness (SegWit) transactions are growing steadily, indicating the continued development of the network.

Ethereum’s Price Drop Possibly Due To Large ETH Sell-Off By EOS, Report Says

Etherscan shows that wallet address marked as EOSCrowdsale still has around 200,000 ETH, and wallet address marked EOS-Owner around 916,000, together equaling over 1.1 mln ETH.

1090 DApps And 700 Tokens Launched on Ethereum Network in 2017, Analyst Says

In 2017, 1,090 decentralized applications (DApps) and more than 700 tokens have been deployed on the Ethereum (ETH) network, Finance Magnates reports May 28.

Bank of England: Central Bank Digital Currencies Can Jeopardize Commercial Banks

The Bank of England has issued a May 2018 staff working paper, which suggests that the adoption of central bank digital currencies (CBDCs) could pose a competition threat to commercial banks.

Source: cointelegraph.com


Analysis 


BTC/USD

From yesterday’s open, the price of Bitcoin dropped by 3.23% going from $7343 to $7117 where it is currently sitting.


Looking at the daily chart we can see that the price is between the baseline support (black line) and the triangle support (blue line). After those, there is a third support level which is an unconfirmed baseline support 2 (dotted line). The price is likely heading down toward one of them, as the search for support continues.


Zooming into the hourly chart we can see that we are about $135 away from the triangle support line at around $7000 and that the price is going to meet that level. When the price does reach that level, I would be looking for either a sign of a trend reversal or trend continuation which is a more likely scenario from a probability standpoint. If the trend continues I am expecting the price of Bitcoin to fall to the dotted line which is an unconfirmed baseline support 2 at around $6600.


Market sentiment

  • Bitcoin hourly chart technicals signal a sell.
  • 9 oscillators are on neutral, and 11 moving averages signal a sell.

Pivot points

S3 6448.5 
S2 6823.9 
S1 6960.9 

P 7199.3 

R1 7336.3 
R2 7574.7 
R3 7950.1

ETH/USD

From yesterday’s open, the price of Ethereum has dropped by 7.68% from $568.9 to $522 where it is currently.


On the daily chart, we can see that the price bounced off of the 0.236 Fibonacci level, but judging by the hight of the candle the momentum behind the bounce was not strong enough to even come back to the prior support line which now serves as resistance at $539.5.


Zooming into the hourly chart, we can see that the price action is currently in a triangle from which it’s likely heading lower, and we are going to see a breakout from the downside.


Market sentiment

  • Ethereum is in the sell zone.
  • Oscillators are on buy, but with 9 on neutral, and moving averages signal a sell.

Pivot points

S3 363.16 
S2 444.66 
S1 478.32 

P 526.16 

R1 559.82
R2 607.66 
R3 689.16

XRP/USD

In the last 24 hours, the price of Ripple has decreased by 4.83% – from yesterday’s open at $0.604 to $0.58.


Looking at the daily chart we can see that the price is interacting with the prior support which now serves as resistance at $0.573.


If we zoom into the hourly chart we can see that the price is above it, but we need to wait for the candle to close to be sure, as selling pressure can slap the price back below it, leaving a wick.


Market sentiment

  • Ripple hourly chart technical signal a buy.
  • Oscillators are on buy, and moving averages signal a buy.

Pivot points 

S3 0.44321 
S2 0.50486 
S1 0.52601 

P 0.56651 

R1 0.58766 
R2 0.62816 
R3 0.68981

Conclusion


Crypto Coin Market News: Prices are getting pushed to new lows which may trigger some buying. That’s why I am expecting some short-term sideways movement, before another final drop. Bitcoin is near the support levels, Ethereum is in a triangle and Ripple is struggling to move back above the support line which means that price action is showing signs of a struggle. These are significant levels on which the prices of three major cryptos are at the moment and what happens today will affect what happens in the following days. If these lows trigger buying, we can see the prices bounce back to the prior high level, if not we are in for lower lows.

Categories
Crypto Market Analysis

Daily crypto update 23.05.2018 – After a big drop, the price is struggling for support.


General overview


Market Cap: $348,018,621,395 
24h Vol: $18,262,368,943 
BTC Dominance: 38.8%

In the last 24 hours, cryptocurrency market capitalization dropped from $383B to $342B, which is a decrease of 41 billion dollars in the evaluation.

cryptocurrency market capitalization dropped from $383B to $342B

The market is currently in red, with an average decrease in the price of 10%. Biggest losers among top 100 are Verge -14,7%, 0x -14,3%, Bitcoin Diamond 15,6%, and the only one crypto that’s in green is Bitcoin Private +7%.


News


Top stories that came out in the last 24 hours are mostly about blockchain tech adoption and acceptance, however, after the big drop in the evaluation, there is much analytical news as well.

These are some of the significant headlines:

Mitsubishi, MUFG Conduct Successful Pilot Payment With Major Thai Bank’s Blockchain

Several major global banks have successfully completed a cross-border payment pilot test using Thai bank Krungsri’s (Bank of Ayudhya) Blockchain Interledger, according to a press release May 22.

Bitcoin Price Is Struggling After Blockchain Week, Possible New Regulatory Pressure

Cryptocurrencies continue to slow down today as all major coins are in the red on Tuesday. Bitcoin (BTC) price is struggling for gains above $8,500 following concerns over increased regulation according to Naeem Aslam, chief market analyst at Think Markets:

“The recent selloff has come from the news out of China that the ICO [initial coin offering] market is still very active and there are fears that China will further increase the strict regulation.”

Russian State Duma Almost Unanimously Approves First Reading of Crypto Industry Bill

Russia’s parliament the State Duma approved the first reading of new laws regulating the crypto industry Tuesday, May 22. The laws define cryptocurrencies and tokens as property, and lay out specifications for interacting with crypto and blockchain-related technologies.  

US: Crypto Could Pose a Problem for Candidates Seeking Security Clearances

The recognition of Bitcoin as a form of foreign currency could potentially have an impact on decisions in recruiting new employees to the US Department of Defence (DoD), Bloomberg reported May 22. The Pentagon’s chief concern is whether investment in cryptocurrencies indicates criminal intent or constitutes an increased predisposition toward risky personal behavior. This could detrimentally affect a job candidate’s profile should the DoD be considering them for a security clearance.

Argentinian Bank Now Using Bitcoin for Cross-Border Transactions

Argentinian Banco Masventas (BMV), has announced a partnership Bitex to enable clients to use Bitcoin for international payments as an alternative to SWIFT, according to a Facebook post May 21. Bitex is a blockchain-based financial services provider based in Latin America.

Nobel Prize Economist Says That Crypto the Latest in a Pattern of Alternative Currencies

In a May 21 article entitled “The Old Allure of New Money,” the 2013 Nobel laureate of Economics Robert Shiller calls crypto the newest iteration of alternative currency ideas.


Analysis


BTC/USD

In the last 24 hours, the price of Bitcoin has dropped by 6,7% coming from 8400$ to 7847$ where it is currently sitting.


Looking at the daily chart, we can see that the price of Bitcoin is back in the wedge pattern, as I predicted in my weekly forecast. The drop in price has to find new support, and the 0.236 Fibo level will serve as support at least temporarily, so watch out what happens at these levels.


Looking at the hourly chart we can see that last 4 candles are dojis, meaning that the price is experiencing a lot of buying and selling pressure and considering the proximity of the 0.236 Fibonacci level we can conclude that price is struggling and looking for support there.


Market sentiment

  • Bitcoin hourly chart technicals signal a sell.
  • Oscillators signal a sell and moving averages a strong one.

Pivot points

S3 6427.8 
S2 7387.3 
S1 7809.2 
P 8346.8 
R1 8768.7 
R2 9306.3
R3 10265.8

ETH/USD

From yesterday’s open the price of Ethereum has dropped by 10%, coming from 693$ to 621$ where it is currently.


On the daily chart, things are looking very bearish. The price is currently at the levels of prior resistance, looking for support, and it’s near the 0.382 Fibonacci retracement level, but we haven’t seen the interaction with it just yet.


On the hourly chart, we can see that the price is struggling for support, as indicated by the wicks we are seeing on the candles. The price is likely going to bounce back quickly after this massive and fast drop occurred, before continuing to go down further.


Market sentiment

  • Hourly chart technicals signal a sell.
  • Oscillators are on neutral, and moving averages on a strong sell.

Pivot points

S3 539.11 
S2 598.95 
S1 619.48 

P 658.79 

R1 679.32 
R2 718.63 
R3 778.47

XRP/USD

In the last 24 hours, the price of Ripple has dropped by 8,86% coming from 0,676$ to 0,617$ where it is now.


On the daily chart, we can see that the price of Ripple has fallen below the 0.236 Fibonacci level. From there on the only significant level, I see stopping this momentum is at the close of the candle before one that broke that level from the upside, which is at 0,54$.


Hourly chart shows us the interaction with the Fibo level, and as you can see it was broken with a strong momentum, and the current situation is similar to that of Bitcoin and Ethereum in a sense that there is a lot of wick on the current candles.


Market sentimet

  • Ripple is in a sell zone.
  • Oscillators are on sell, and moving averages a strong one.

Pivot points

S3 0.56621
S2 0.60802
S1 0.62285

P 0.64983

R1 0.66466
R2 0.69164
R3 0.73345

Conclusion


The price is struggling to find support after a massive and quick drop in price. I expect the prices to quickly bounce to the 0.5 levels of prior highs before another drop in price. We are going to see a lot of sideways price action today, as indecision is taking over, and reactions from participants are unclear. 

Categories
Crypto Market Analysis

Daily Crypto Update 21.05.2018 – Indecision


General Overview


Crypto Market Update Today:

Market Cap: $389,840,003,354

24h Vol: $17,523,547,047

BTC Dominance: 37.2%

In the last 24 hours, cryptocurrency market cap has increased from $375B to slightly below $390B.

Crypto Market Update TodayThe market is mostly in green, with the biggest gainers among top 100 being Tron +14%, Skycoin 10%, Holo 20%.


News


There isn’t any significant news that came out during the weekend. Top stories are therefore analytical in nature or follow-ups from prior stories.  These are some of the more significant headlines:

Iran and Russia Discuss Transacting in Crypto to Avoid International Sanctions

Iran and Russia could start using cryptocurrencies to avoid Western sanctions, Russian news portal RBC reported yesterday, May 17.

Norway Central Bank Considers Developing Digital Currency

Norway’s central bank, Norges Bank, is considering developing its own digital currency as a supplement to cash to “ensure confidence in money and the monetary system”, according to a working paper May 18.

Former UK Visa CEO Takes Helm of Crypto Consumer Payment Startup

The former head of Visa in the UK and Ireland has joined a startup bringing crypto to consumer payments, Business Insider NL reports today, May 19.

WSJ: Coinbase Spoke to U.S. Regulators About Acquiring Federal Banking License

Major U.S. cryptocurrency exchange and wallet Coinbase spoke to regulators about obtaining a federal banking charter, according to a report by the Wall Street Journal (WSJ) May 18.

Source: cointelegraph.com


Analysis


BTC/USD

From yesterday’s open, the price of Bitcoin has increased by 3.4%, going from $8229 to $8510 where it is currently sitting.


On the daily chart, we can see that the price is currently a red doji above 0.382 Fibonacci retracement level.  We can also see a breakout from the falling wedge.


Zooming into an hourly chart, we can see the interaction with the Fibo level, and the momentum behind the up move. Price action formed a double top, with the last top’s candles closed with two massive wicks from the upside, which indicates selling pressure.


Market sentiment

Bitcoin is in the buy zone, as indicated by hourly chart technicals.

Oscillators are on buy, and moving averages on a strong one.


Pivot points

S3 7578.2 
S2 8004.6 
S1 8264.2 
P 8431.0
R1 8690.6 
R2 8857.4 
R3 9283.8

ETH/USD

The price of Ethereum has increased by 3.34% from yesterday’s open, going from $690 to $712,8 where it is currently.


Looking at the daily chart, we can see that the current candle is a red doji, like in the case of Bitcoin, and it sits at the levels of prior high.


Zooming into an hourly chart, we can see that the price has retraced to retest the support, which is on the levels of prior high at $712. We can also see a breakout from a triangle which wasn’t that strong, as the impulse behind the move looks like any other prior move.


Market sentiment

Ethereum is in the neutral zone, as hourly chart technicals are on neutral.


Pivot points

S3 638.08 
S2 673.30 
S1 694.40 

P 708.52 

R1 729.62 
R2 743.74 
R3 778.96

XRP/USD

In the last 24 hours, the price of Ripple has increased by 3.17%, from $0,67250 to $0,69436. The price has been steadily rising and is now facing first strong resistance.


On the daily chart, we can see that the current candle is red, and is sitting at the levels of prior high.


The hourly chart paints a clearer picture. We can see that the price is still in an upward channel which is inside the symmetrical triangle pattern. The price found resistance on the triangle’s resistance line levels and is currently struggling to keep up the upward movement.


Market sentiment

Hourly chart technicals are on neutral, so the price of Ripple is currently indecisive.


Pivot points

S3 0.61264 
S2 0.65176 
S1 0.67536 

P 0.69088 

R1 0.71448 
R2 0.73000 
R3 0.76912

Conclusion


Crypto Market Update Today: In the last day, we have seen an upward movement has been stopped by first major resistance, as seen on the charts from three major cryptocurrencies that we are covering in this daily report. The market is currently showing signs of indecision indicated from the current candles being Dojis. We are likely to see a move down, which would be a final corrective move, before a new runup to new highs.

Categories
Crypto Market Analysis

Market Cap Has Formed a Cup and Handle Pattern

General overview

Market Cap Has Formed a Cup

Market Cap: $421,269,776,870

24h Vol: $26,437,548,757

BTC Dominance: 37.5%

At the start of the week on Monday, April 23. Crypto market capitalization was around 388 billion dollars and rose up to 436,994,000,000$ on April 25, which is this week high. The day after the high was hit, the evaluation of the crypto market capitalization went to the lowest point of the week of 380,513,000,000$. Since it is on the rise and is now sitting at 421,268,000,000$.

Analysis

BTC/USD

On April 23, the price of Bitcoin was 8748$. Only two days later the price went to 9700$ which is this week’s highest point, and after that it fell by 1000$, coming to the lowest point of the week at 8700$. Since the price has increased to 9240$ where is now sitting slightly above 0.5 Fibonacci level and 100 day EMA. The price has increased by 5,4% overall.

Analysis BTC/USD

On the daily chart we have a potential tweezer top, which is the candles on 24. and 25. and if today ends up closing as doji, we can are going to see a trend reversal coming into the next week.


Overall daily chart signals a buy.

Overall daily chart signals a buy

Pivot points:

S3 6109.5
S2 7355.5
S1 8134.0
P 8601.5
R1 9380.0
R2 9847.5
R3 11093.5

ETH/USD

Since Monday, April 23. The price of Ethereum has increased by 8,8% coming from 620$ to 675$ where is now sitting. Like in the case of Bitcoin, the price oscillated to the weekly high at 708$ and then fallen to the weekly low at 611$.

ETH/USD

The price is currently above the 1.618 Fibonacci level drawn from bottom to the top of the prior range and above the 50 and 100-day EMA. Unlike Bitcoin, today’s candle isn’t a doji. However, it looks even from both sides, which nevertheless indicates indecisiveness.


Overall, daily chart signals a buy.

daily chart signals a buy

Pivot points

S3 324.51
S2 450.42
S1 527.43
P 576.33
R1 653.34
R2 702.24
R3 828.15


XRP/USD

Ripple has decreased in price by 1,62% during the week, starting from 0.86$ at Monday, April 23rd. to 0.847$ where it is today. The price pathway is also like in the case of BTC and ETH been oscillating to form weekly high at 0.958$ and weekly low at 0,77$.

XRP/USD


Looking at the daily chart, we can see that this week was really turbulent for Ripple. The price is currently above 50 and 100-day EMA, but it’s also below 100% Fibonacci level and today’s candle is a doji. Having that and this double top that struggled to become a higher high and failed indicates a potential trend reversal in the following week.

Overall daily chart signals a buy.

daily chart signals

Pivot points

S3 0.20439

S2 0.50804
S1 0.68659
P 0.81169
R1 0.99024
R2 1.11534
R3 1.41899


LTC/USD

LTC/USD

This week the price of Litecoin increased by 3% overall coming from 146,4$ to 150,33$ where is now sitting. At the end of 24, the price of Litecoin was the highest 166$ coming slightly above the 100% Fibonacci level, only to fall the next day to the lowest point of the week at 143$ on the 0.618 Fibonacci level which served as support. The price is currently in between 50 and 100-day EMA slightly below 0,786 Fibonacci level.

Overall, daily chart signals a buy

daily chart signals

Pivot points

S3 79

S2 111
S1 129
P 143
R1 162
R2 175
R3 207


Conclusion

Compared to Monday’s 387 billion dollar evaluation, crypto market capitalization evaluation rose up by 50 billion on Wednesday and fallen by 7 billion on Thursday. The cup and handle is a pattern is now clearly seen.

The similar chart pattern is imprinted on the four major cryptocurrencies which again shows a strong correlation in the crypto markets. Having seen the signs of struggle on the charts that we’ve covered and the tweezer tops followed by doji’s we can conclude that we are in for a bit of a downside before a breakout to new highs in the following period.Cryptocurrencies Market cap

©Forex.Academy

Categories
Crypto Market Analysis

Cryptocurrency Market Is On The Rise Again

General overview

Market Cap: $413,692,195,374

24h Vol: $26,702,372,910

BTC Dominance: 37.9%

Since yesterday, cryptocurrency market cap is on the rise again. Market capitalization was  380,513,000,000$ at the lowers point, and it has increased to almost 416B.Cryptocurrency Market Cap Is On The Rise Again

The market is in green, and some of the biggest gainers among top 100 are Siacoin +52% and Bitcoin Diamond 42%. Other cryptos are about 7-9% up on average since yesterday.

News

IBM And Jewelry Industry Leaders To Use Blockchain To Trace Origin Of Diamonds

>Leaders in the gold and diamond industry have partnered with IBM to develop a blockchain network for tracing the origin of finished pieces of jewelry, IBM announced in a blog post-April 26.
Source: cointelegraph.com

Mt. Gox Moves Around $165 Mln In BTC And BCH From Its Wallets
>16,000 Bitcoin (BTC) and 16,000 Bitcoin Cash (BCH) have been moved out of cold wallets associated with the infamous, now defunct Japanese Bitcoin (BTC) exchange MT. Gox today, April 26, according to Mt. Gox cold wallet tracking data on Crypto Ground.

Source: cointelegraph.com

Comcast’s Venture Capital Arm Is Bullish On Bitcoin and Blockchain

>Gil Beyda, managing director of the venture capital (VC) arm of Comcast, appeared on CNBC today, April 26, with a bullish outlook for Bitcoin and real-world applications of blockchain technology

Source: cointelegraph.com

17 Mln Of Total 21 Mln Bitcoins Now Mined In Milestone For Digital Scarcity

>In a round million milestone, 17 mln bitcoins (BTC) have now been mined as of today, April 26, according to data from statoshi.info. Because of Bitcoin’s supply cap of 21 mln, this means that only four mln Bitcoin, or about 19 percent, remain to be mined.

Source: cointelegraph.com


Analysis

BTC/USDBTC/USD

In the last 24 hours, the price of Bitcoin has increased by 5,42% coming from 8750$ to 9200$ where it is now. Looking at the daily chart we can see that the price went above 0.5 Fibonacci level and the 100 day EMA againThe current sentiment for Bitcoin is positive according to sentimnt.io having 74% positive mentions out of 70 in total.

The current sentiment for Bitcoin is positive according to sentimnt.io having 74% positive mentions out of 70 in total.


Bitcoin is positive having 74% positive mentions out of 70 in totalZooming into an hourly chart, we can see that the move to the upside had momentum and that the price has formed a mini cup and handle.

Overall hourly chart signals a buy.

Overall hourly chart signals a buy

Pivot points

S3        6109.5
S2        7355.5
S1        8134.0
P          8601.5
R1       9380.0
R2       9847.5
R3       11093.5


ETH/USD

ETH/USD

Since the start of April 26 until now the price of Ethereum went from 599$ to 651$ which is an 8,45% increase. Looking at the daily chart, we can observe that the price went above 1.618 Fibo level and is now sitting right on it. 100 day EMA is also below serving as support.Ethereum is very positive

The current sentiment for Ethereum is very positive according to sentimnt.io having 82% positive mentions out of 67 in total.

Ethereum is very positiveHourly chart is similar to that of Bitcoin, meaning that the price is forming a mini cup and handle pattern.


Overall hourly chart signals a buyOverall hourly chart signals a buy

Pivot points

S3        324.51

S2        450.42
S1        527.43
P          576.33
R1       653.34
R2       702.24
R3       828.15

XRP/USD

XRP/USD

The price of Ripple has also increased in the last 24 hours and did so by 7,83% coming from 0.772$ to 0.832$. The daily chart is looking bullish, as the price is above 100-day EMA.

The current sentiment for Ripple is negativeThe current sentiment for Ripple is negative, having 61,5% negative mentions out of 13 in total, according to sentimnt.io

RIPPLE


Hourly chart is similar to that of Bitcoin and Ethereum, however, unlike those cryptocurrencies, XRP is below 100 EMA.

Overall hourly chart signals a buy.Hourly chart is similar to that of Bitcoin and Ethereum

Pivot points

S3        0.20439

S2        0.50804
S1        0.68659
P          0.81169
R1       0.99024
R2       1.11534
R3       1.41899


Conclusion

A strong correlation between the three largest cryptocurrencies is shown, meaning that the chart looks pretty much the same. Market capitalization hasn’t exceeded the prior high at around 434B and has formed a mini cup and handle that retraced back to prior lows for a retest of support. In the next 24 hours, we are going to monitor what is going to happen but, I am expecting a new influx of money into the market, which will push the evaluation further to breakout and form new highs above 434B evaluation.

©Forex.Academy

Categories
Crypto Market Analysis

Crypto market pullback is almost over

General overview

Market Cap: $384,204,107,562

24h Vol: $36,631,965,479

BTC Dominance: 38.8%

Crypto Market Pullback

In the past 24 hours, crypto market capitalization has plummeted down from 437 billion dollars to 382,3 billion, and spiked up. This downward channel looks like it’s the part of wider cup and handle formation that originates from 21 March at 355 billion dollars.

cryptocurrency market capitalization

Having said that, this pullback can potentially end somewhere at these levels.

News

News that came out in the past day are extremely positive. Analytical content is bullish, dominant headlines are about cryptocurrency adoption and use cases. Those that stand out are the following:

Philippine Gov’t To Allow Country’s First Crypto Businesses In Special Economic Zone

The Philippine government will allow 10 Blockchain and cryptocurrency companies to operate in the Cagayan Economic Zone, Reuters reports April 25.

German Securities Trading Bank Reportedly Becomes First In Country To Trade Crypto

VPE WertpapierhandelsBank AG (VPE), a German securities trading bank, has partnered with Berlin-based technology company solarisBank to launch a cryptocurrency trading service for institutional investors, according to a VPE press release April 25.

Nasdaq CEO Says Company ‘Open’ To Becoming Crypto Trading Platform When Market Matures

The CEO of Nasdaq said that the stock market could become a platform for trading cryptocurrencies in the future, if the market becomes more regulated, CNBC’s Squawk Box  reports Wednesday, April 25.


Analysis

BTC/USD

Analysis BTC/USD

In the last 24 hours Bitcoins price went down from slightly below 9700$ to 8760$ which is 9,5% decrease. Looking at the daily chart we can see that the price was repealed by 0.618 Fibonacci level and went below the 100 day EMA.

The current market sentiment for Bitcoin is positive meaning out of 146 mentions in total, 72% are positive.

BITCOIN SENTIMENT TODAY

Source: sentimnt.io

crypto market capitalization

Looking at the hourly chart we see that the price went below 0.5 Fibonacci level and 50 and 100 EMA.

Overall hourly chart signal a sell.

hourly chart signal

Pivot points

S3 6109.5
S2 7355.5
S1 8134.0
P 8601.5
R1 9380.0
R2 9847.5
R3 11093.5

ETH/USD

ETH/USD market cap

In the last 24 hours, the price of Ethereum has fallen from 702$ to 615$ where is now sitting which is 12,5% decrease. Looking at the daily chart, we see that the price has fallen below 1.618 Fibonacci level and is now sitting just below 100 day EMA.

The current market sentiment for Ethereum is positive, with 70% on the positive side.

Ethereum is positive, with 70% on the positive side

Source: sentimnt.io

Zooming into an hourly chart we can see that the price is currently looking for support, and, judging by the lower-side wicks, there’s a lot of buying pressure.

bitcoin pullback

Overall, hourly chart signals a sell

hourly chart signals - forex.academy

Pivot points:

S3 324.51
S2 450.42
S1 527.43
P 576.33
R1 653.34
R2 702.24
R3 828.15


XRP/USD

XRP/USD

The price of Ripple has fallen by 17% coming from 0.95$ to 0.79$ where is now sitting. The daily chart shows the amount of momentum behind the sell-off. The price has fallen below 100% Fibonacci level and is now sitting above the 100 day EMA.

The current market sentiment for Ripple is positive, but there are only 27 mentions in total.

sentiment for Ripple

Source: sentimnt.io

XRPUSD-H

Zooming at its hourly chart, we can see a similar pattern as in other cryptocurrencies. The price is looking for support, and buying pressure is imprinted on the chart as wicks.


Overall, hourly chart signals a sell

Overall, hourly chart signals a sell

Pivot points:

S3 0.20439
S2 0.50804
S1 0.68659
P 0.81169
R1 0.99024
R2 1.11534
R3 1.41899


Conclusion

After the steep run upward, we are currently experiencing the first retracement. This retracement seems to be over, as indicated by the buying pressure from the charts on three major cryptocurrencies.  

©Forex.Academy

Categories
Crypto Market Analysis

Pressure From Both Sides

General overview

Market Cap: $359,246,046,514

24h Vol: $22,391,963,491

BTC Dominance: 39.1%

In the last 24 hours cryptocurrency market capitalization increased by around 20B.

cryptocurrency market capitalization - forex academy

News

There is no significant news to justify this increase in market cap. Dominant headlines are regarding exchanges

South Korean Crypto Exchange Bithumb To Issue its Own Token In Singapore

Bithumb, South Korea’s leading cryptocurrency exchange, has recently revealed plans to issue its own token, Bithumb Coin, in an Initial Coin Offering (ICO), local news outlet TokenPost reports Thursday, April 19.

Source: Helen Partz, April 19. cointelegraph.com

Decentralized Exchanges, Off-Chain Atomic Swaps, And A Brief Look Into The Future

For an economy that emphasizes decentralization, cryptocurrency has ironically relied primarily on centralized platforms of exchange. This is problematic as they often hold funds in giant “honeypot” addresses that attract sophisticated attackers. This has resulted in several cases where exchange funds have been drained. In fact, there were two in the past 3 months alone! Bitgrail reported on Feb.12 that over $170 mln in XRB was stolen from their wallets. Coincheck suffered one of the largest losses ever with over $400 mln in NEM being stolen.

Source: guest author, April 19. cointelegraph.com

Crypto Exchange CEO Runs For Mayor Of Taipei To Make It Asia’s ‘Pioneer Blockchain City’

CEO of major over-the-counter (OTC) crypto exchange OTCBTC and Facebook hackathon winner Yi-Ting Cheng (better known as xdite) has announced that she is running for mayor of the Taiwanese capital city Taipei this year, according to Cheng’s Facebook post on April 14.

Source: Molly Jane Zuckerman, April 19. cointelegraph.com

Chilean Banks vs. Crypto Exchanges: Will Citizens Have Access to Technology?

Earlier this week, a group of cryptocurrency exchanges in Chile applied to the courts to fight the decision of banks to shut down their bank accounts. The exchanges, including Buda, Orionx, and CryptoMarket (CryptoMKT), state that the banking system in Chile is taking matters into their own hands and that they are “killing the entire industry.”

Source: Darryn Pollock, April 20. cointelegraph.com

Analysis

BTC/USD

BTC/USD - pressure from both sides

In the last 24 hours, the price of Bitcoin went from 8146$ to 8366$ and has retraced since, to 8280 where is now sitting. Looking at the daily chart, we can see that the price is held by 50-day EMA. The  created a doji candle for now.

Bitcoin is positive
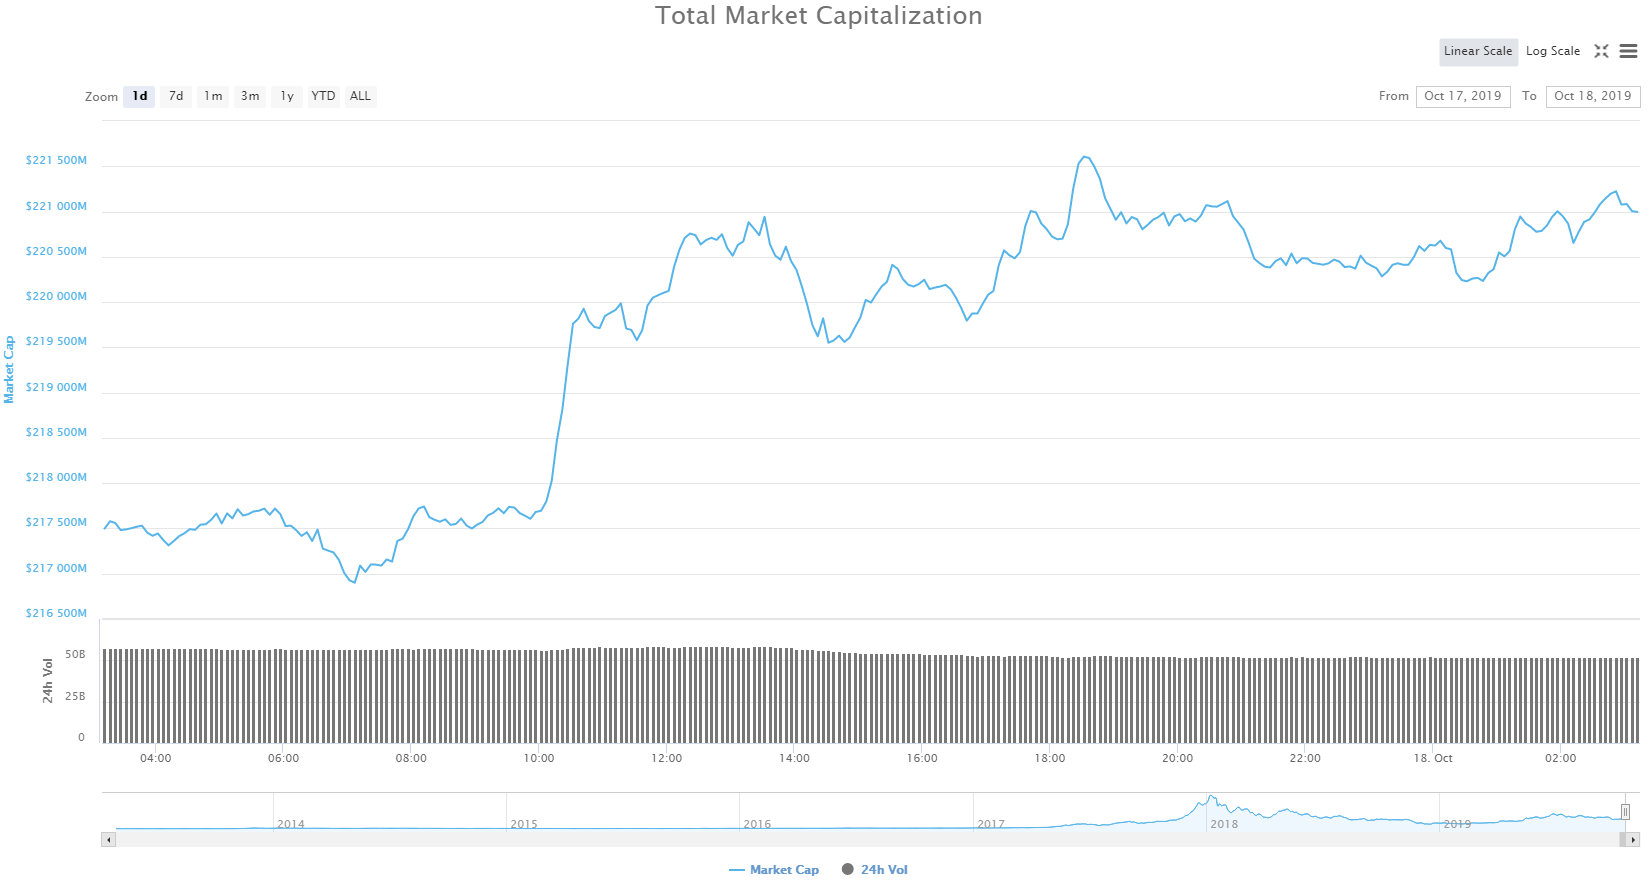
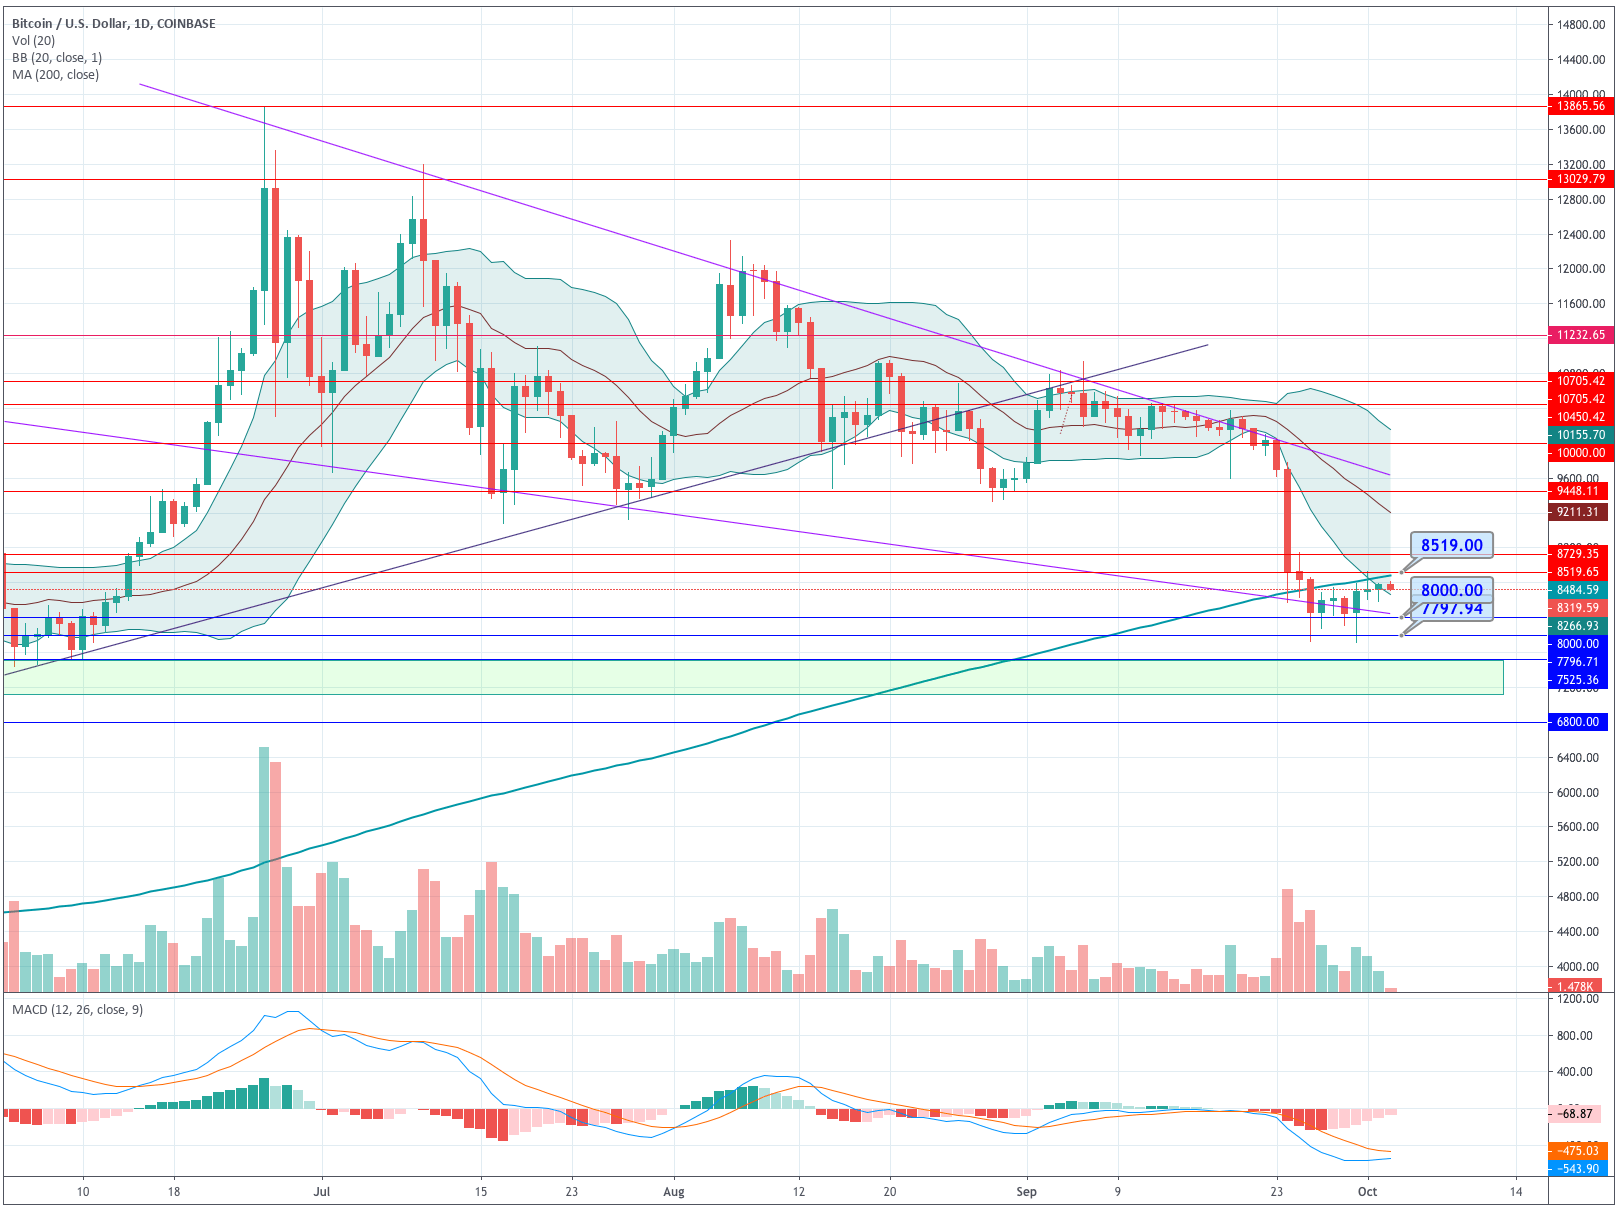
The current market sentiment for Bitcoin is positive, meaning 70% out of 85 mentions in total are positive.
Source: sentimen.io

short-term support line BTCUSD

Zooming into the hourly chart, we can see the pressure from both sides. The price is above the short-term support line, but it has been repealed again at the same levels.

Overall, hourly chart signals a buy

hourly chart signals a buy Pivot points:

S3 4361.0
S2 5990.0
S1 6997.9
P 7619.0
R1 8626.9
R2 9248.0
R3 10877.0

ETH/USD

ETHUSD

In the last 24 hours price of Ether was increased by 8,57%, rising from 521$ to 566$ where it is now. On the daily chart, you can see that, similar to Bitcoin, the 50 day EMA is in combination with 1,414 Fibo level are repealing the price. But there is buying pressure also, which is creating a doji candle.

Ethereum is positive, meaning 78% out of total 97 mentionsThe current market sentiment for Ethereum is positive, meaning 78% out of total 97 mentions are positive.

Source: sentimen.io

ETHUSD chart

Looking at the hourly chart, we can see that the price was broken down from this upward channel with strong momentum, but has now bounced back off at the Fibo levels.

Overall hourly chart signals a buy.

XRP/USD

 Pivot points:

S3 183.46
S2 327.57
S1 415.01
P 471.68
R1 559.12
R2 615.79
R3 759.90

XRP/USD

XRPUSD-D-4

Ripple has been rising with strong momentum in the last 24 hours and has increased by 16,5%, coming from 0,7$ to 0,83$. Looking at the daily chart, we can see that momentum is slowing down by the 100% Fibonacci level, which is the top of the prior range.

The current market sentiment for Ripple is slightly positive, meaning 69% of 42 mentions in total are positiveThe current market sentiment for Ripple is slightly positive, meaning 69% of 42 mentions in total are positive.
Source: sentiment.io

interaction between the Fibo level

Looking at the hourly chart, we can observe the interaction between the Fibo level and how the price quickly bounced.

Overall, hourly chart signals a buy.

hourly chart signals Pivot points:

S3 0.13715
S2 0.37215
S1 0.50608
P 0.60715
R1 0.74108
R2 0.84215
R3 1.07715


Conclusion

After a powerful bull run market experienced in the past couple of days, the first firm resistance is found. Three coins that we are covering in this report are all currently held at Fibonacci significant levels, and their price has been pushed from both sides. Who will win, bulls or the bears, we will see by the end of the day.

Categories
Crypto Market Analysis

Bitcoin reverses and entered into losses again


BTC

The Bitcoin price for today reports loses around -4.06% as the session has progressed on Monday, after initially starting the day with some gains. Following on from some decent buying seen over the weekend, as has proven to be the case on several occasions.

Upward price movements were seen across the crypto market after over-excitement produced by reports of big players interest in cryptos. The intentions of George Soros and Rothschild were mentioned, among others.

Technically, BTC/USD looks pretty vulnerable to another drop, as the price has formed a bearish pennant pattern, seen within the 4-hour time frame view. Support is currently set around $6,600. If this support is broken, we could see a downward move to the mid $5,000 region. The closer resistance is its 200 EMA, located at around $ 6.935, but the price has to cross first its 100 EMA around $6.848.


ETHEREUM

Ethereum’s price shows a slight increase of about 0.79% in the last 24 hours, after an exciting rise up to $ 430.24 in the today’s early hours. Over the weekend, ETH broke its 200 Period EMA in the 1 H chart, and it was quite bullish, but this morning it quickly resigned its profits to return around the 200-period EMA.  At this moment it is quoted at around  $400. Now its 200-EMA seems to become a strong support for the coming days on the ETHUSD pair.

The bullish trend line that was forming was not strong enough neither it held the price, so we will watch if it becomes resistance in the next few days.

The next visible resistance is $ 411, and above $ 430, if the price returns below $ 400, the $ 391 would be its closest support, then the 100-period EMA close at $ 386 and, below,  $ 376 (last April’s bottom price)

XRP

Ripple lost -1.42% in the last 24 H, and it is now moving around $0.48. After starting the day up 5%, the gains were quickly taken back by the market bears, reconfirming that the current trend is still firmly pointing to the downside.

XRP as BTC was receiving some renewed optimism initially after several reports raised a lot of excitement. They were suggesting that there were big players interested in cryptocurrency investing, such as George Soros, Rothschild, and others.

But the news wasn’t good enough for the XRP price, and it ran into some heavy selling that sent price close to the $0.50 level.  Now its wise to look back towards $0.45 area for support and if crossed, the likelihood of its price to visit the $0.40 level is high.


Categories
Crypto Market Analysis

Cryptocurrencies Market Cap Slightly Up From Its Lowest Point

General overview:

Cryptocurrency Market Cap: 265,511,000,000$

24h Vol: $9,014,760,000

BTC Dominance: 44.8%

Current Crypto Market Cap

In the last 24 hours crypto market cap has slightly risen from its lowest point at 259,285,000,000$ to its highest point at 267,789,00,000$ and has now pulled back to 265,511,000,000$ because of the resistance at these levels.Current Crypto Market Cap


As we’ve recently bounced upward from a support around 250B which is where we were on November 25th last year, more sideways movement is expected.

News:

Some positive news came out in the last 24 hours which might change this sideways action to an upward trajectory.

As it turns out, State Bank of Pakistan never banned the use of cryptocurrencies.

>The State Bank of Pakistan (SBP) has released information that seeks to clarify the bank’s position on digital currencies. Although the statement “advises” both the public and institutions against dealing in the coins, it is not an outright ban.

Source: Thomas Delahunty | April 8, 2018, newsbtc.com

Soros, Rothschild, and Big Institutional Investors are Entering Bitcoin Market

>Financial moguls, including George Soros, the Rothschild family, and others, now have their sights set on Bitcoin. It makes for an interesting development, albeit the potential impact has yet to be determined.

Source: JP Buntinx | April 8, 2018, newsbtc.com

Petition To Reverse Indian Central Bank’s Crypto Ban Gains 17,000 Signatures

>A Change.org petition for “Mak[ing] India at the forefront of Blockchain Applications Revolution” in response to the Indian central bank ending all dealings with crypto-related accounts this week has gained over 17,000 thousand signature since going online April 5.

Source: Molly Jane Zuckerman | April 8, 2018, cointelegraph.com

OTC Bitcoin Trading Surges in Canada, Same May Happen in India

>In Canada, it seems OTC trading is quickly gaining popularity. Just last week, the volume has spiked well beyond the regular volume. Over in India, the regulatory situation has taken a bit of a dire turn. The Reserve Bank of India made it clear banks are expected to end support for cryptocurrency companies. Exchanges and trading solutions may find different ways to counter this solution, assuming the need arises to do so.

Source: JP Buntinx | April 8, 2018, newsbtc.com


Analysis


BTC/USD

BTC/USD Cryptocurrencies Market Cap
As you can see from this daily chart, the price is still in this falling wedge, which started as a correction on December 16. Since then the price has fallen around 65% and is now sitting around 7000$ after the uptrend support line, originating from July 17 last year, repealed the price.

cryptocurrency valuesThe current crypto market cap sentiment for Bitcoin is slightly negative, meaning that mentions and discussions on the web are leaning 10% toward negative.


Source: sentiment.io


current market cap


Zooming into an hourly chart, we can clearly see the interaction with the uptrend support line and how it held pretty good. The price is currently experiencing sideways movement because of the interaction with these significant levels which can be interpreted as indecision.

Overall hourly chart signals a buy.

Overall hourly chart signals


Even though hourly chart signals a buy, be cautious if trading, as we are still in a no-trade zone, and without confirmation for a trend reversal. As you can see from the daily chart, I’ve drawn another non-confirmed uptrend support line (dotted line), originating from March 25 last year. That line crosses over 50% Fibonacci level which is very significant, so in the next couple of days, I will be closely monitoring price action, as I am expecting another downward movement to retest those levels which in terms of price will be 6000$. However I am not expecting it to be a wick like last time on February 6, but a proper close, and a wick to extend to 5500$.

ETH/USD

cryptocurrency value

Ethereum daily chart shows that the price is still in the falling wedge, and not only that but has also fallen below the secondary uptrend support as is now sitting at around 400$ which is a 71% less than at its highest point of 1419$ per ETH on January 13.


current Ethereum sentiment is mixedThe current Ethereum sentiment is mixed, meaning that there are equally positive and negative mentions and discussions on the web.

Source: sentiment.io


crypto currencies market cap

In the last 24 hours, ETH price has risen 6.95% and is now sitting at 412$ interacting with a 100% Fibonacci level that was the top of the range on June 12 last year.


Overall hourly chart signals a buy.


 digital currency values


Even though the price is showing an upward movement, Ethereum is like Bitcoin in a no-trade zone. Closely monitor what happens at these levels, as I would expect the price to go down from here to the cross-section of the uptrend support line number 2, top of the triangle from which the price has previously broken and 0.78 Fibo level which will be in the term of price around 330$.


XRP/USD

cryptocurrency market

As you can see from this daily chart, the price was broken out of the first falling wedge only to get caught into a downward channel that brought the price down to where it is now sitting at around 0.5$ interacting with 0.38 Fibonacci level which is 57% less than the starting point of the channel.

RippleThe current Ripple sentiment is slightly negative, meaning mentions and discussions on the web are just slightly leaning toward the negative side.

Source: sentiment.io


digital currency by market cap

Hourly chart shows sideways price action but definitely on a short-term uptrend in which the price rose up 5.66% in the last 24 hours and is now interacting with 0.38 Fibo level which serves as a resistance point for now.


Overall hourly chart signals a buy.

crypto market


What is stated about Bitcoin and Ethereum implies here as well – no trade zone.

Conclusion

As a conclusion, I would like to say that the correlation between these three cryptocurrencies is strong and that they are all in the same point of their cycle. These are interesting levels as the downtrend is losing its momentum and the bulls are waiting for a confirmation to reenter the market. Expect a lot of sideways action as we are nearing the accumulation zone.

Categories
Crypto Market Analysis

Risk aversion returning to crypto markets once again

BTC

Today, the Bitcoin price shows a decline of -2.55% in the last 24 H and its moving at the time of writing this update around $ 6587.

The Immediate support is $ 6495 and a bullish pressure not necessarily strong can send it to $ 6434 (Minimum of April 1)

The 200 and 100 SMA lines are approaching. If the 100 SMA crosses over the 200 SMA, we could be facing a reversal; however, this SMA can become an important resistance in the short term even for a probable rebound.

The stochastic is pointing down to indicate that sellers still have some energy to pressure the BTC to have more losses, although it is still far from oversold conditions which indicate weakness in the bearish pressure.

Risk aversion returned to markets once again in the face of worsening trade tensions between the US and China. Any of the parties refuses to back down and has announced higher tariff blocks between them in the last 24 hours.

That has led to a large wave of stock and commodity sales, which has motivated traders to place funds in the Dollar as a safe haven. This morning’s NFP did not bring good news for the dollar either, as only 103,000 jobs were generated in the last month compared to an expected data of 190,000. This result discourages the hopes of rising rates during the rest of the year and does not make the dollar attractive compared to the Bitcoin price.

XRP

The Ripple price lost -4.20% in the last 24 H, and it is now moving around $0.46

The XRP has not had any recovery during the last sessions above $ 0.5000. There were mainly bearish movements below the resistance of $ 0.5000 and the Simple Moving Average of 100 hours. The recent minimum was formed at $ 0.4754, and after that, its price has been moving in a range.

The most important barrier to a recovery is near the resistance at $ 0.5000 and the simple 100-hour moving average. If the price crosses this number, most likely will visit the $0.5260 and then the $0.5487.

Below that level, we find an immediate support at $ 0.4538 reached on April 1, and, below that level, there are no other supports other than the last prices reached on December 12,  at $0.3715

The stochastic is pointing up (1H graphic) and close to the 80 level, which means that the price could bounce and still move lower.


ETH

Ethereum price has lost -3.68% in the last 24  Hours, currently moving around $367.

A short-term bearish trend line has been formed, with resistance at $ 385 on the 1H chart. If we want to see gains in the pair, its price would have to exceed this level, and also exceed the 100 SMA level, which is located a bit higher, and approach the round number $400; but to get there, it must break the resistance at $385 and $391.

There is a positive fact that the price has managed to stay above its support at $ 362-364. The most recent minimum was formed at $364.32 before the price started to consolidate. Currently, it is trading above the $ 364 level.

Categories
Crypto Market Analysis

Another down move down in the Crypto markets

BTC

The price of Bitcoin went down 3.66% in the last 24 hours. It reached $7,499, just crossing the 100 period EMA in the 1 Hour chart, but the price wasn´t strong enough, and it bounced back. It is now moving around the $6,916 level.

The 200 EMA seems to offer strong resistance in the path of recovery. The 100 EMA, on the other hand, couldn´t support the price in the $7,202 area and the next support is located near the level of $7,000. The MACD is dipping into negative territory indicating the presence of a bearish force. If the price breaks below the $7,000 level, $6,930 could be the next support. However, it is not far from the recent low at $6,450.

The stochastic is very close to the 20 level and showing a very strong force to go lower with a high selling pressure and still without touching oversold levels. Sellers are having a good time right now.

XRP

Right now, Ripple is undervalued from the longer-term perspective. The cryptocurrency lost over 70% since January 2017, but the massive sell-off was not because of clear fundamental reasons. In this scenario, we could see a more pronounced rebound when the cryptocurrency market starts recovering from recent lows.

The main partners in the Ripple Network are payment operators, big banks, and financial institutions, especially in the emerging markets. The market is driven by global catalysts and correlated to Bitcoin movements. So, Ripple has good upside potential, but it won’t have a chance to realise it until the global sentiment shift takes place.

XRP/USD is trading at $0.4935, losing 6.65% in the last 24 hours. The price crossed the 100 EMA easily today, also breaking the uptrend line and the $0.5000 wasn´t a problem neither. It is now looking for the next support at $0.4823. On the upside, the resistance is seen at $0.5500, that’s where the recovery stalled on Tuesday. Once it is cleared, the cryptocurrency will have a chance to get to the $0.60 level.

The stochastic is under the 20 level and seems to have still some grounds to go down further.

ETH

The price of Ethereum has been falling considerably in the last hours after reached $415, and then broke a major resistance near the area of $390-395. Then it came the strong sellers force generating a downward correction sending the price to where we have it at this time in the $375 area. There was no consideration of the significant support near the $400 level and the 100 EMA on the 1Hour chart.

If the price loses the support in the $374 area, we could be visiting $360. On the positive side, $445 would be the next resistance level and maybe above $460, the 28th March maximum.

The Stochastic is recovering a bit and trying to leave the oversold area but still below the level of 20.


Categories
Crypto Market Analysis

The bearish sentiment remains firm in the Crypto world

BTC

The Bitcoin price for today reports a decline of -1.74% in the last 24 hours, the price at the time of writing this update is $6,740. The technical indicators are giving us mixed signals, but it seems that the bearish sentiment remains firm and the bears will continue to win, although if we look at the Stochastic pointing upwards, we could be feeling a bullish pressure, so the price of Bitcoin could bounce from here.

If the Bitcoin price reaches its minimum of the 1st of April, we would be forming a double bottom pattern. This would indicate a buying opportunity, taking the neckline as a reference in the $7,500 area, which would give good dividends. We find immediate support in $6,495, below $6,185.90 and then $5,876.60.

Below the current price range, the price would drop to the $5,000-$5,500 region if these few supports are broken. This scenario would make a price recovery very difficult.

An important consideration in the current market is the global uncertainty caused by commercial tensions between China and the United States, as this is one of the main factors that drives the price of Bitcoin down. Under these situations of uncertainty, traders feel less appetite for risk, and instead, put their funds in safe assets such as the Dollar and bonds. Operators have also taken this step back as an opportunity to liquidate positions, fearing that the upticks will not last long in this market environment.

The 100 and 200 periods SMA appear even distant for the price, so it seems unlikely for Bitcoin to break them. If the 100 SMA is broken, the next reference point would be the 200 SMA at $7,151. Above $7,344 and $7,500 are the next resistances for the price, if reached, it would probably set the bullish trend to an end.

XRP

The Ripple price lost -1.74% in the last 24 hours and had started another day of loses, which is normal lately for this cryptocurrency. Ripple is currently within a four week consecutive period of losses and dealing with low levels that have not been seen since December 2017. During the bull run, the cryptocurrency dropped to $3.

Technically, XRP/USD is moving in a range between $0.48-0.43. If the price goes lower, it would be facing a quick drop to the $0.20 area, within the short term, upside looks to be reached around $0.55 and then the $0.70.

The stochastic touched the oversold area and now is pointing up but this hasn’t had any influence on the price.

ETH

The price of Ethereum has gained 1.50% in the last 24 hours, but it remains on the back foot in trading on Thursday, and it’s trying to reach the support area around $370. The bears are providing added pressure, after allowing some minor upside at the start of the week.

Most of the important cryptos are in a strong downward trend right now, but there is not much in the way of fundamental drivers to attribute this situation.

Yesterday, we could see a small upward movement above $400 in price against the US dollar. However, the price couldn´t gain traction and started a downward movement from $405, first breaking the round number of $400, and then the 100 period SMA. The lower part of a very defined bullish channel with support at $395 has also been broken in the hourly chart. At this moment, the price is negotiating close to $376, and if recovery does not appear in the short term, we could be visiting the minimum of $364. A break of $360 could open the doors to $300.