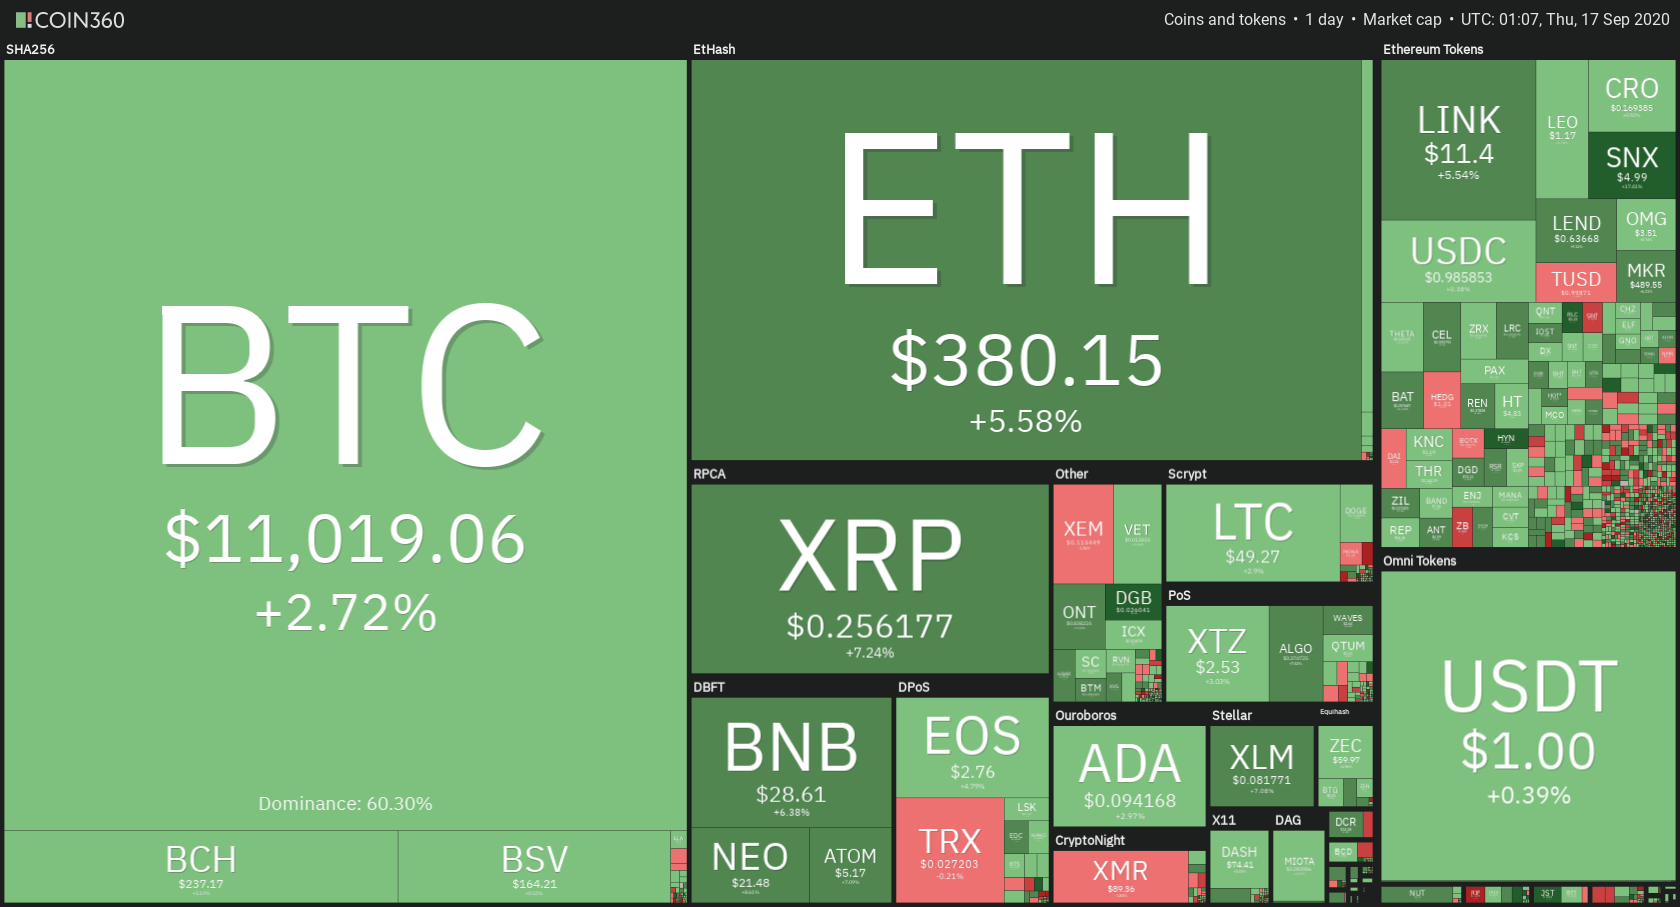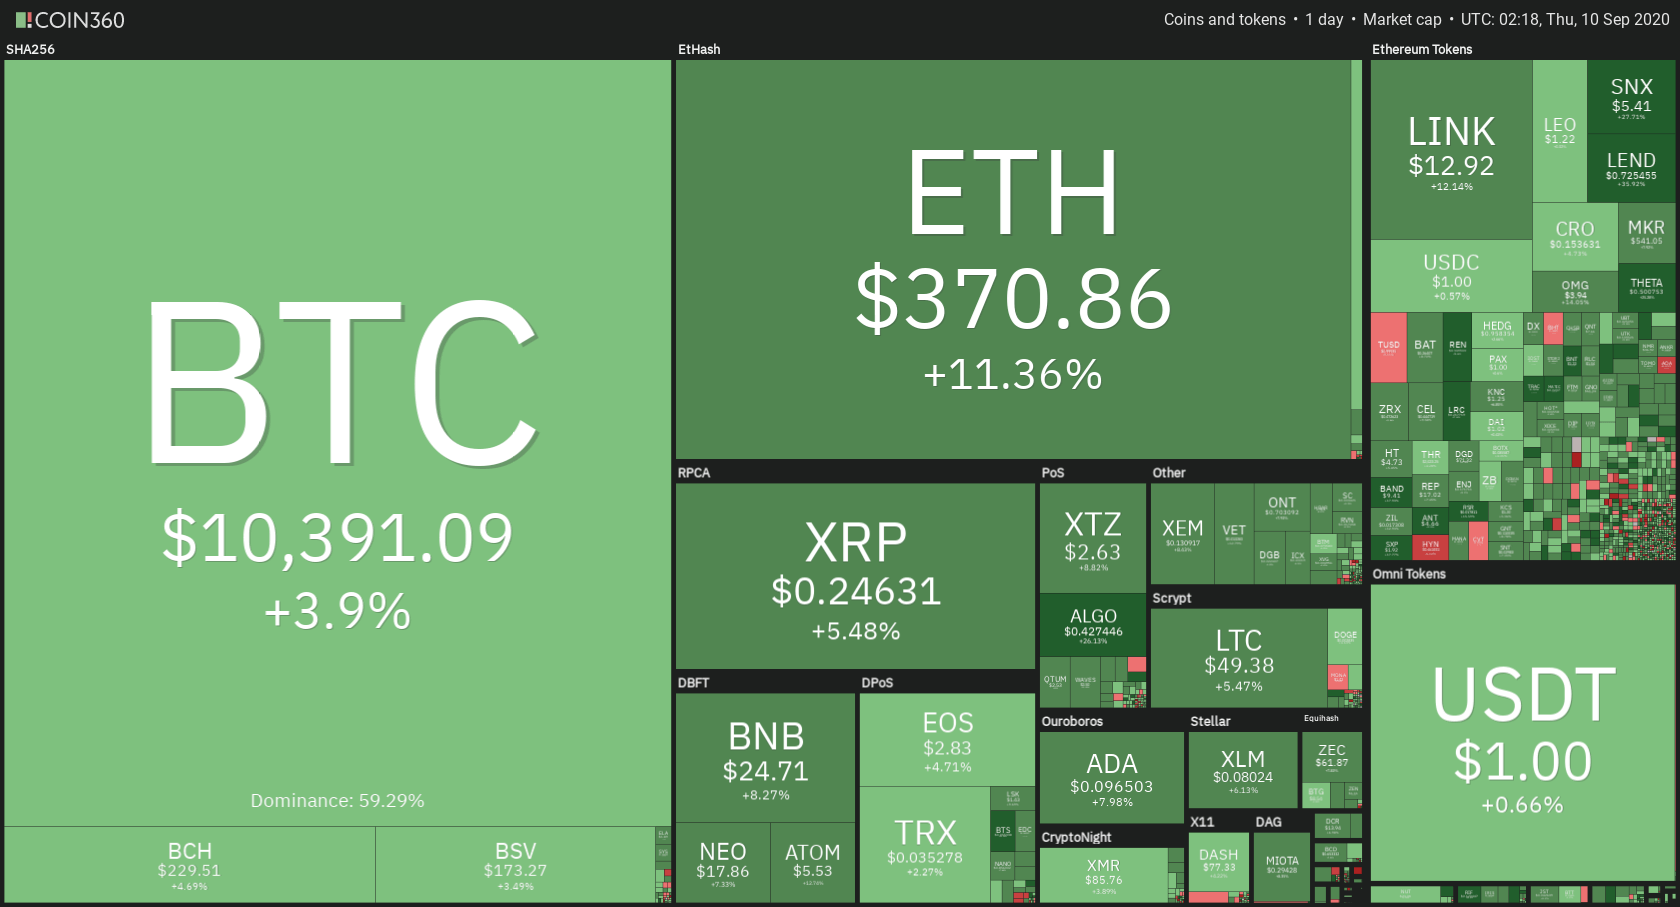
The cryptocurrency sector had a great day, with most cryptocurrencies ending up in the green due to Bitcoin pushing towards $13,900. Bitcoin is currently trading for $13.720, representing an increase of 4.81% on the day. Meanwhile, Ethereum gained 3.63% on the day, while XRP gained 1.61%.
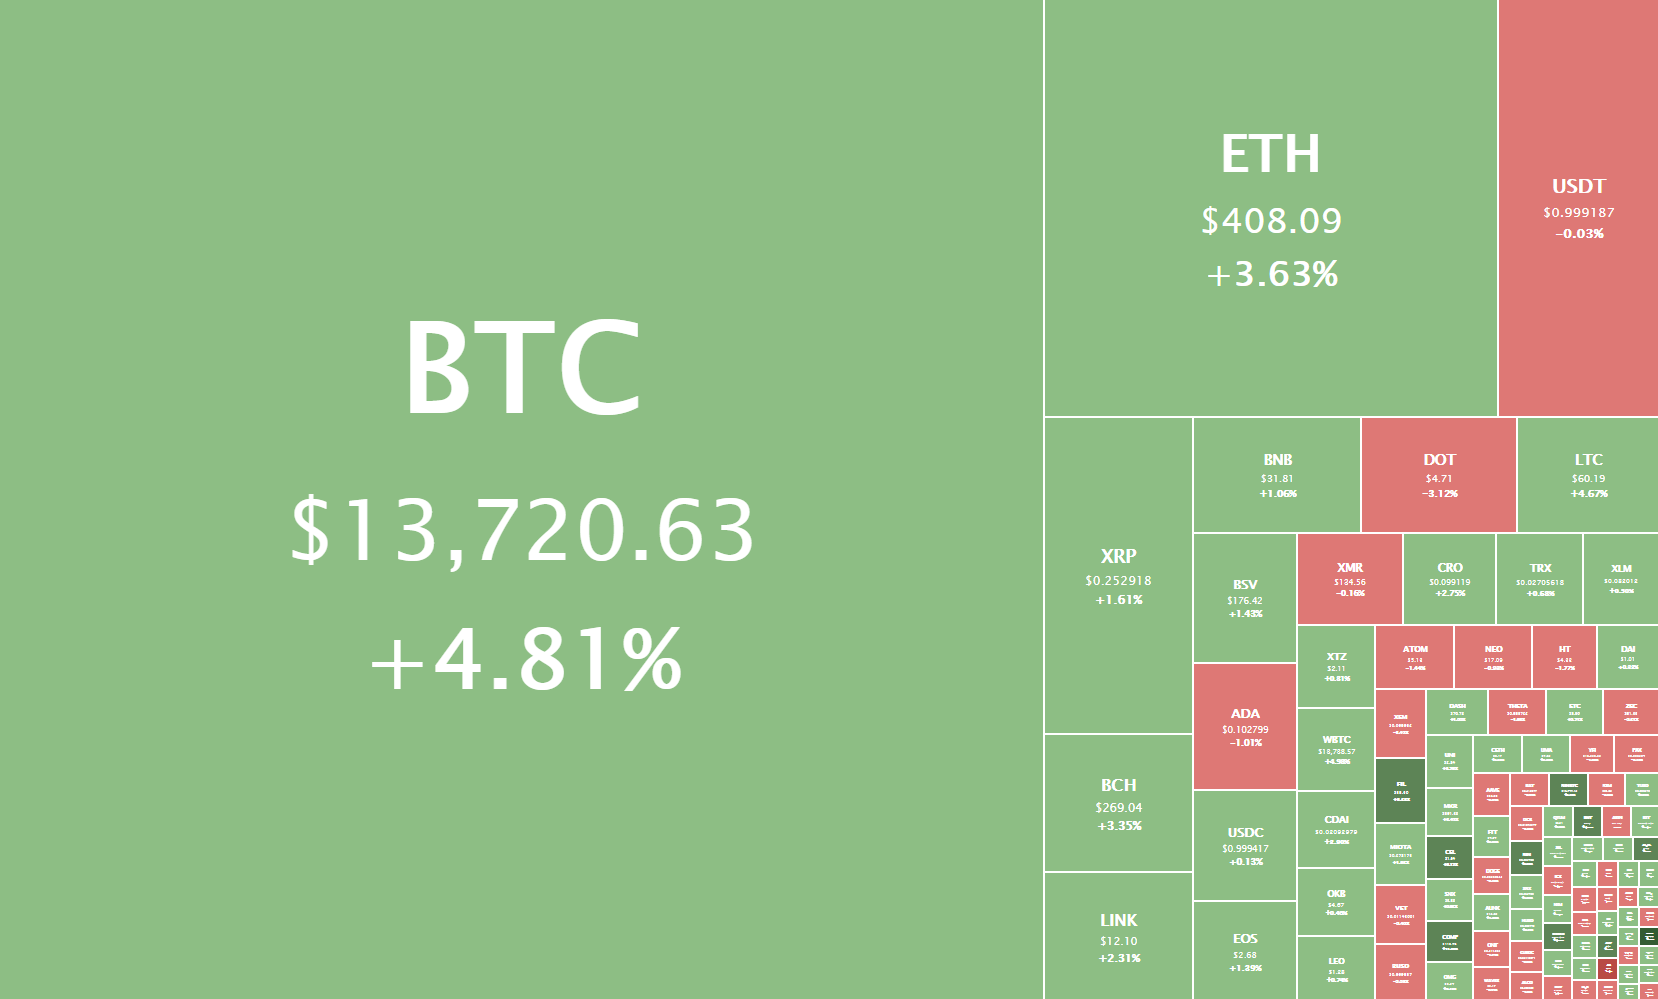
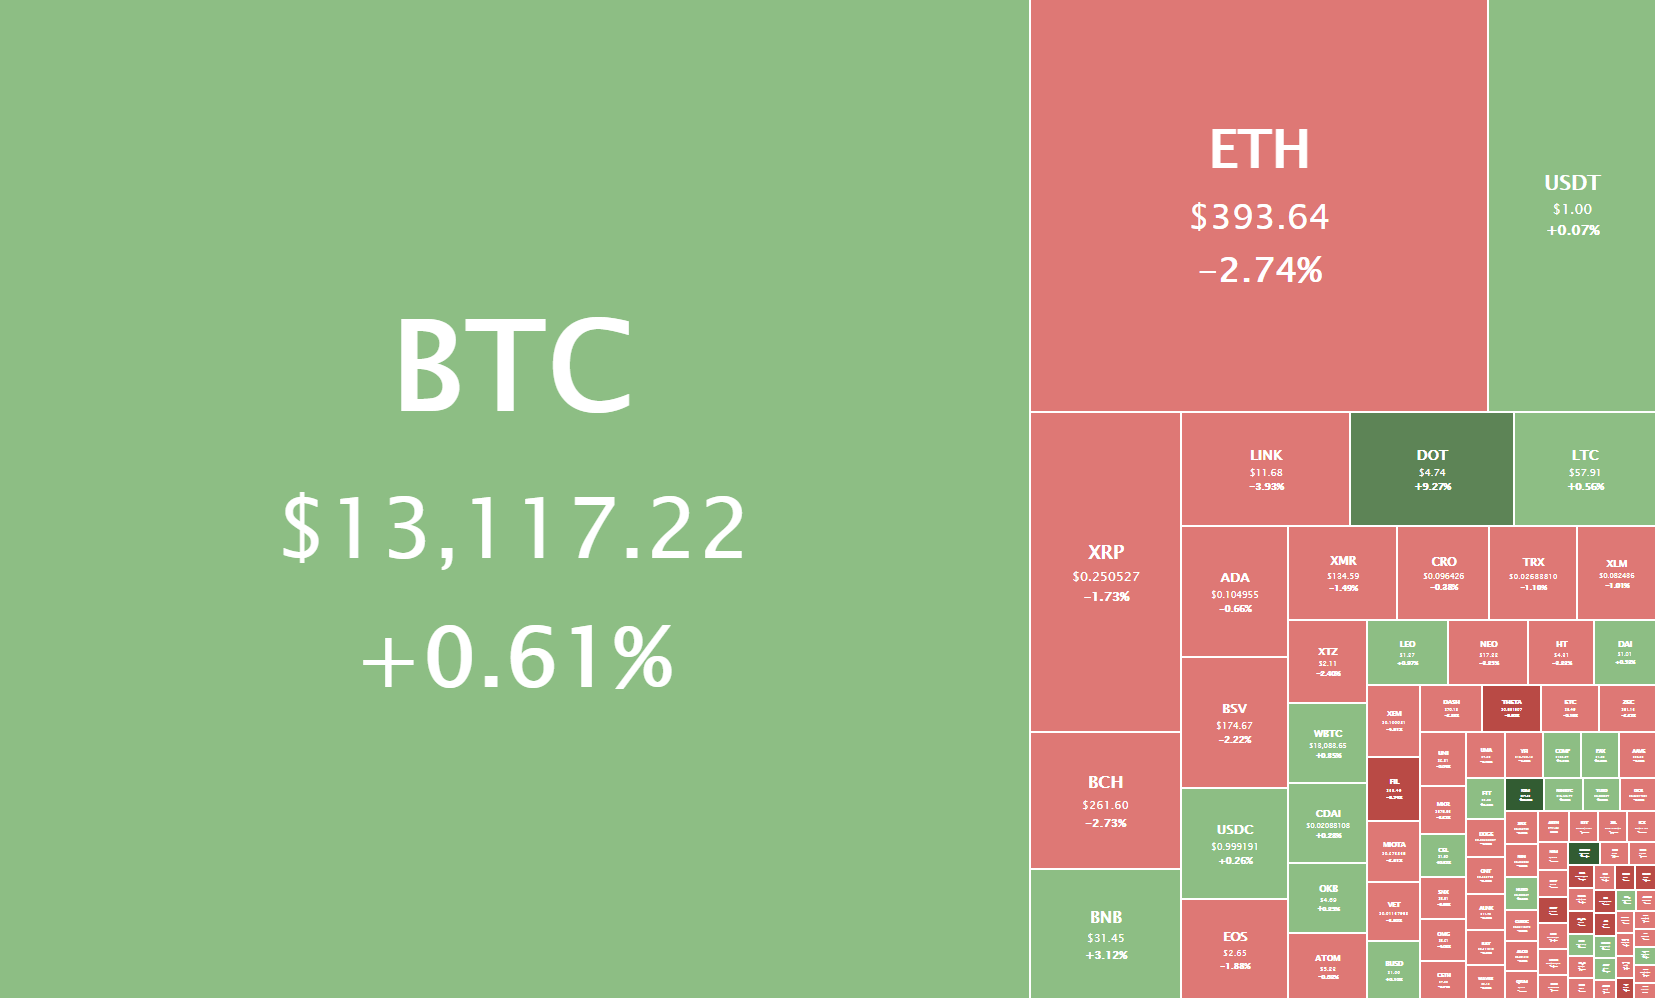
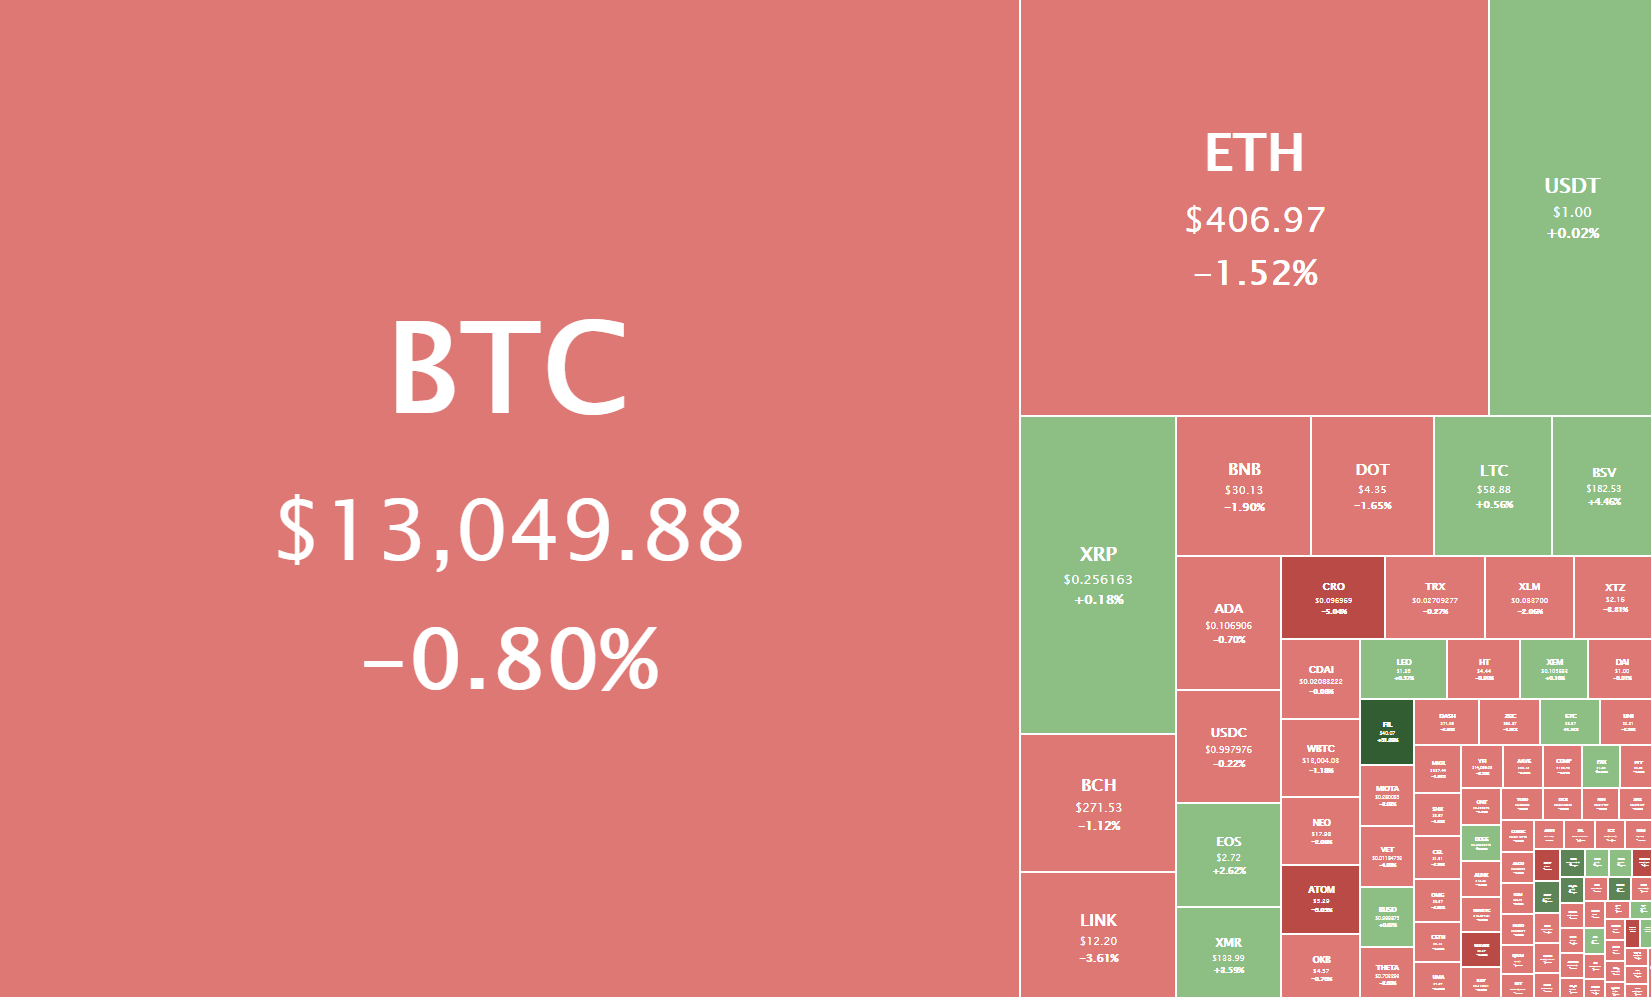
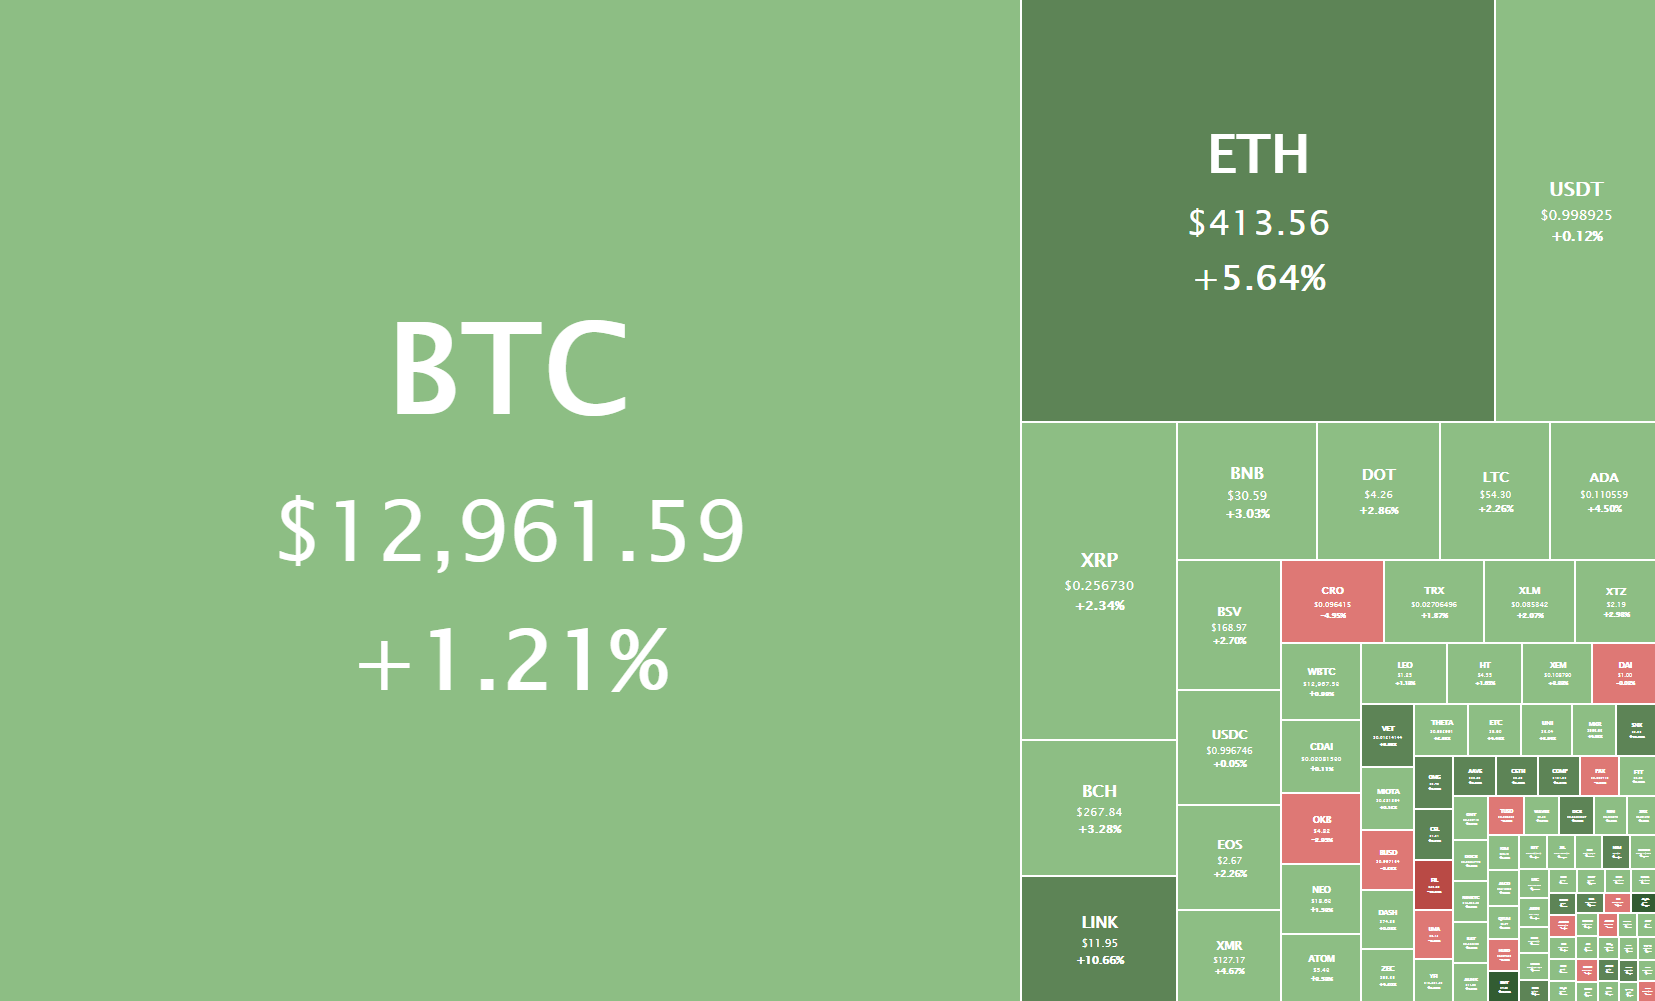
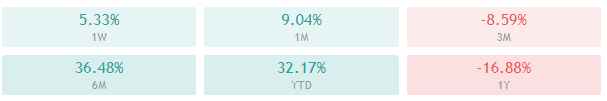
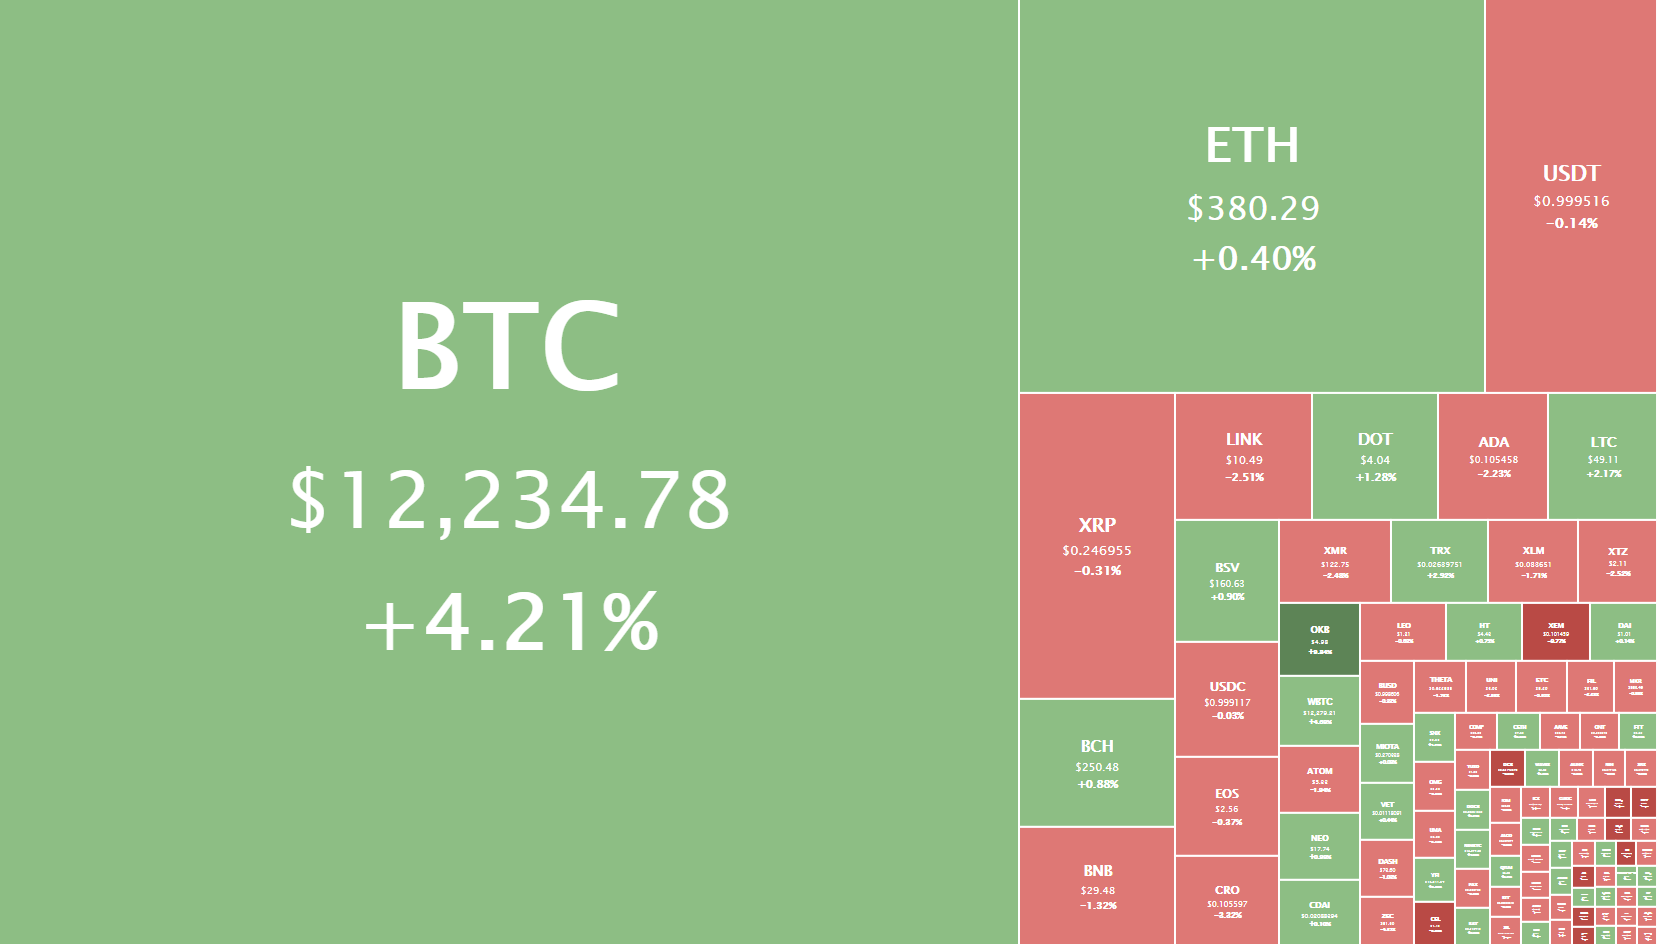
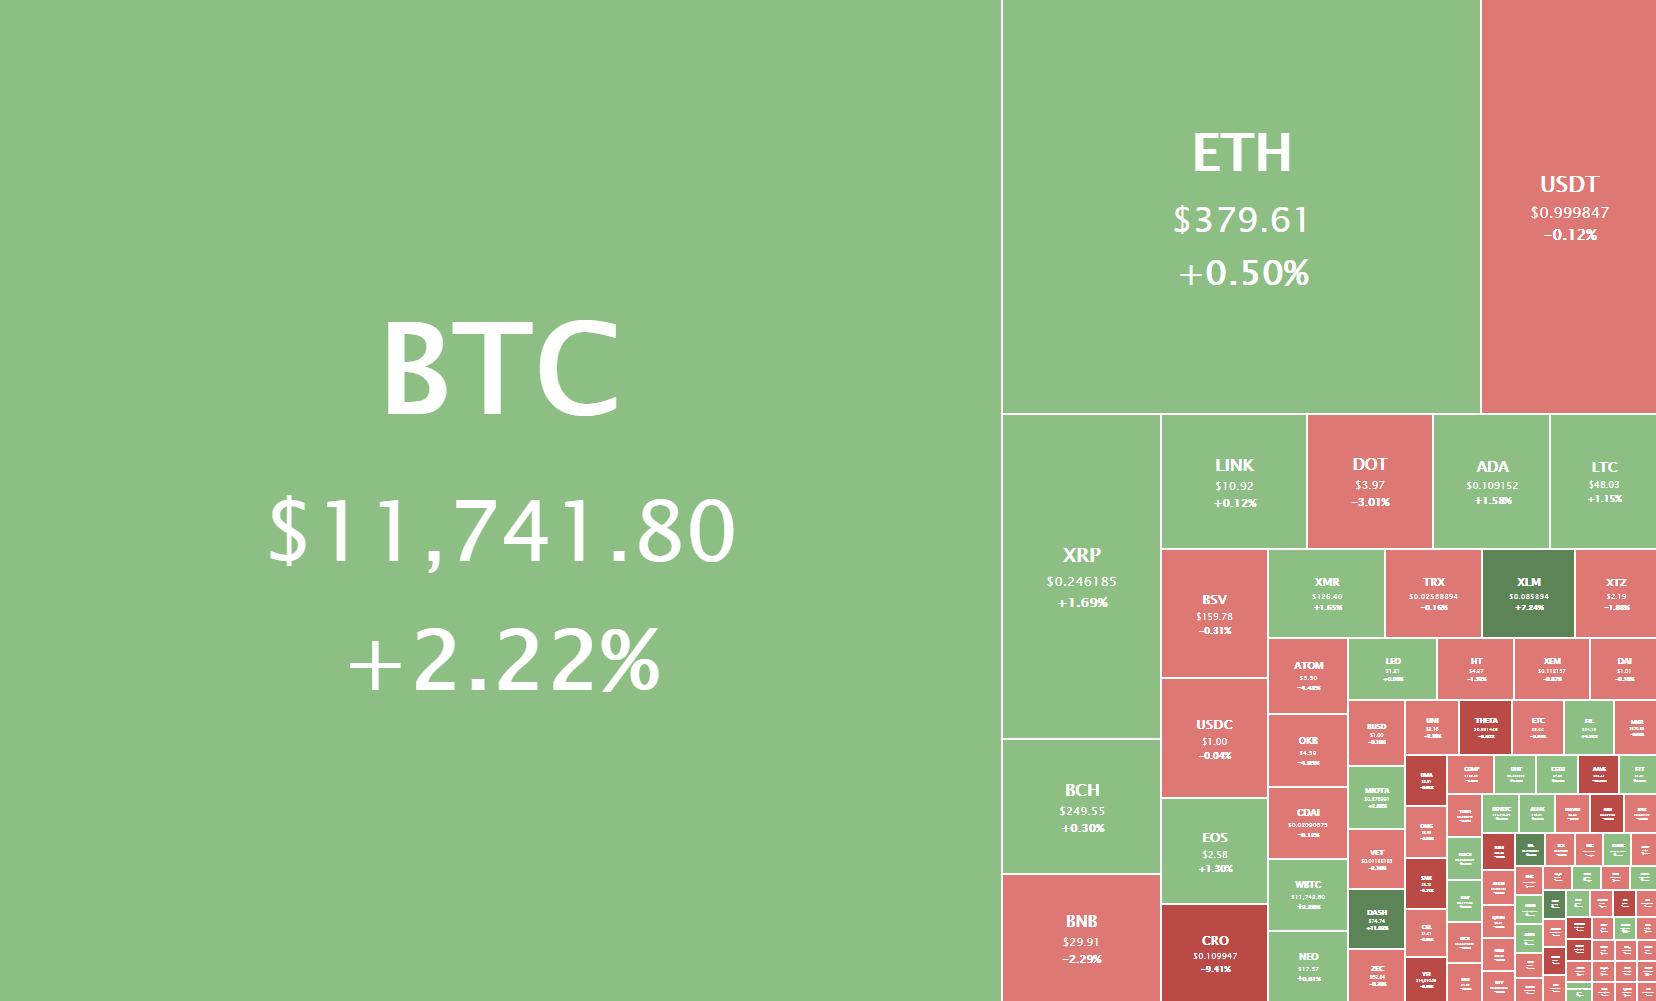
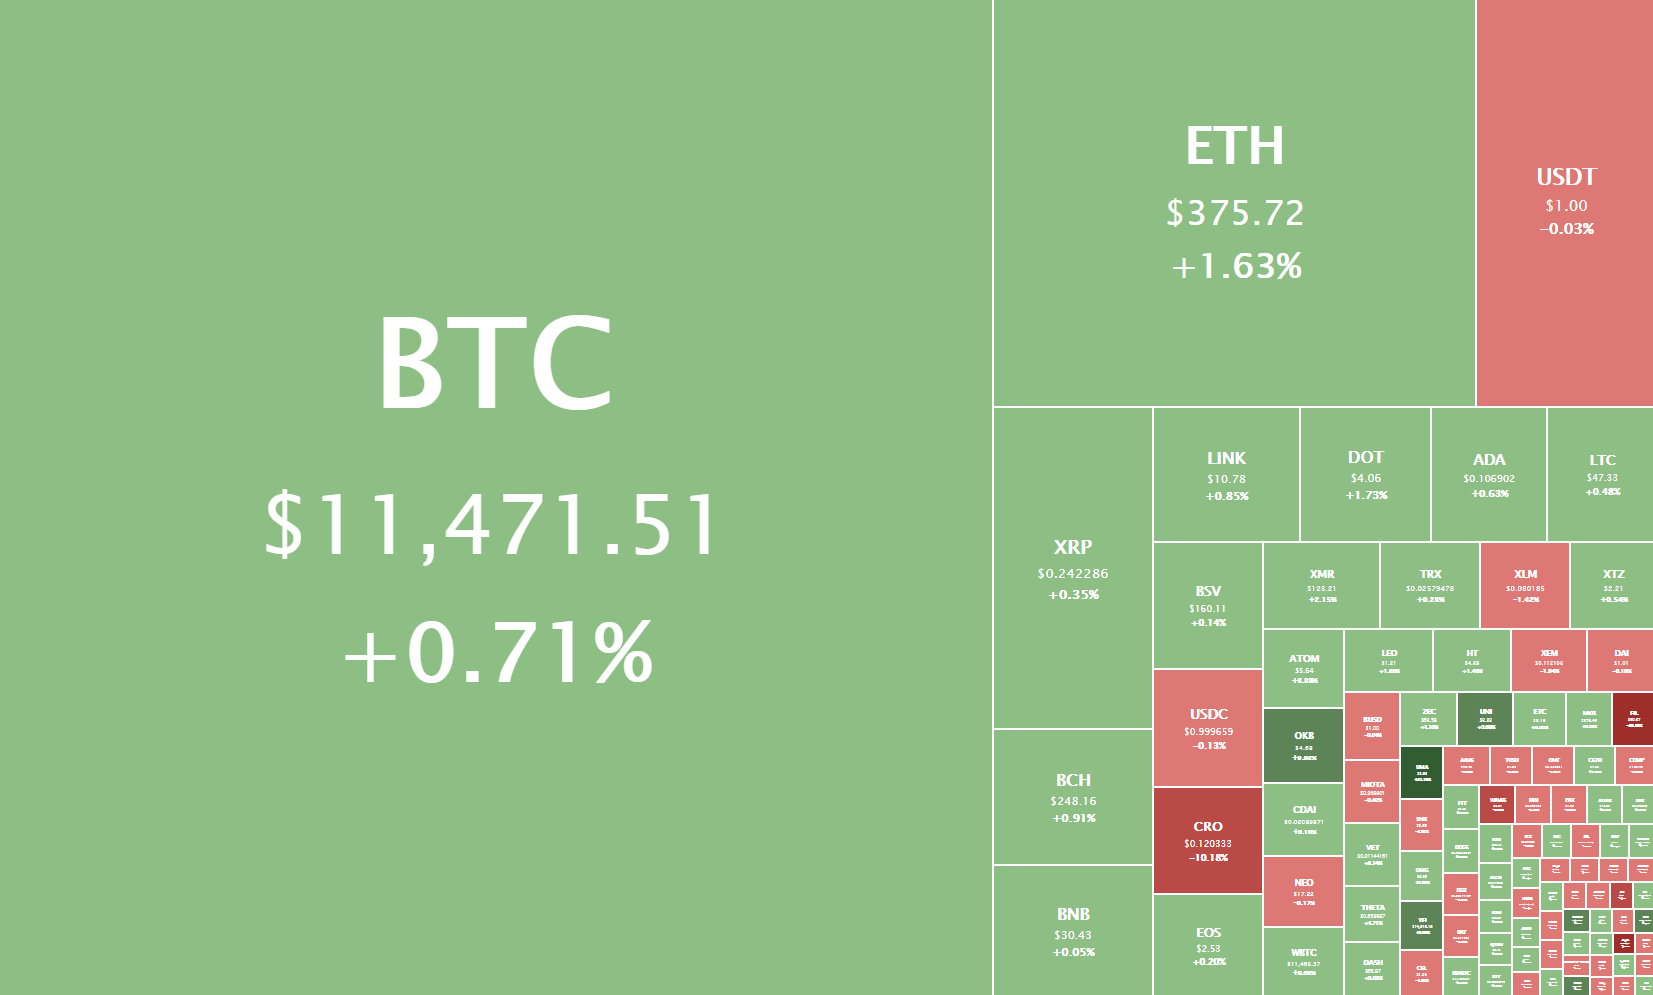
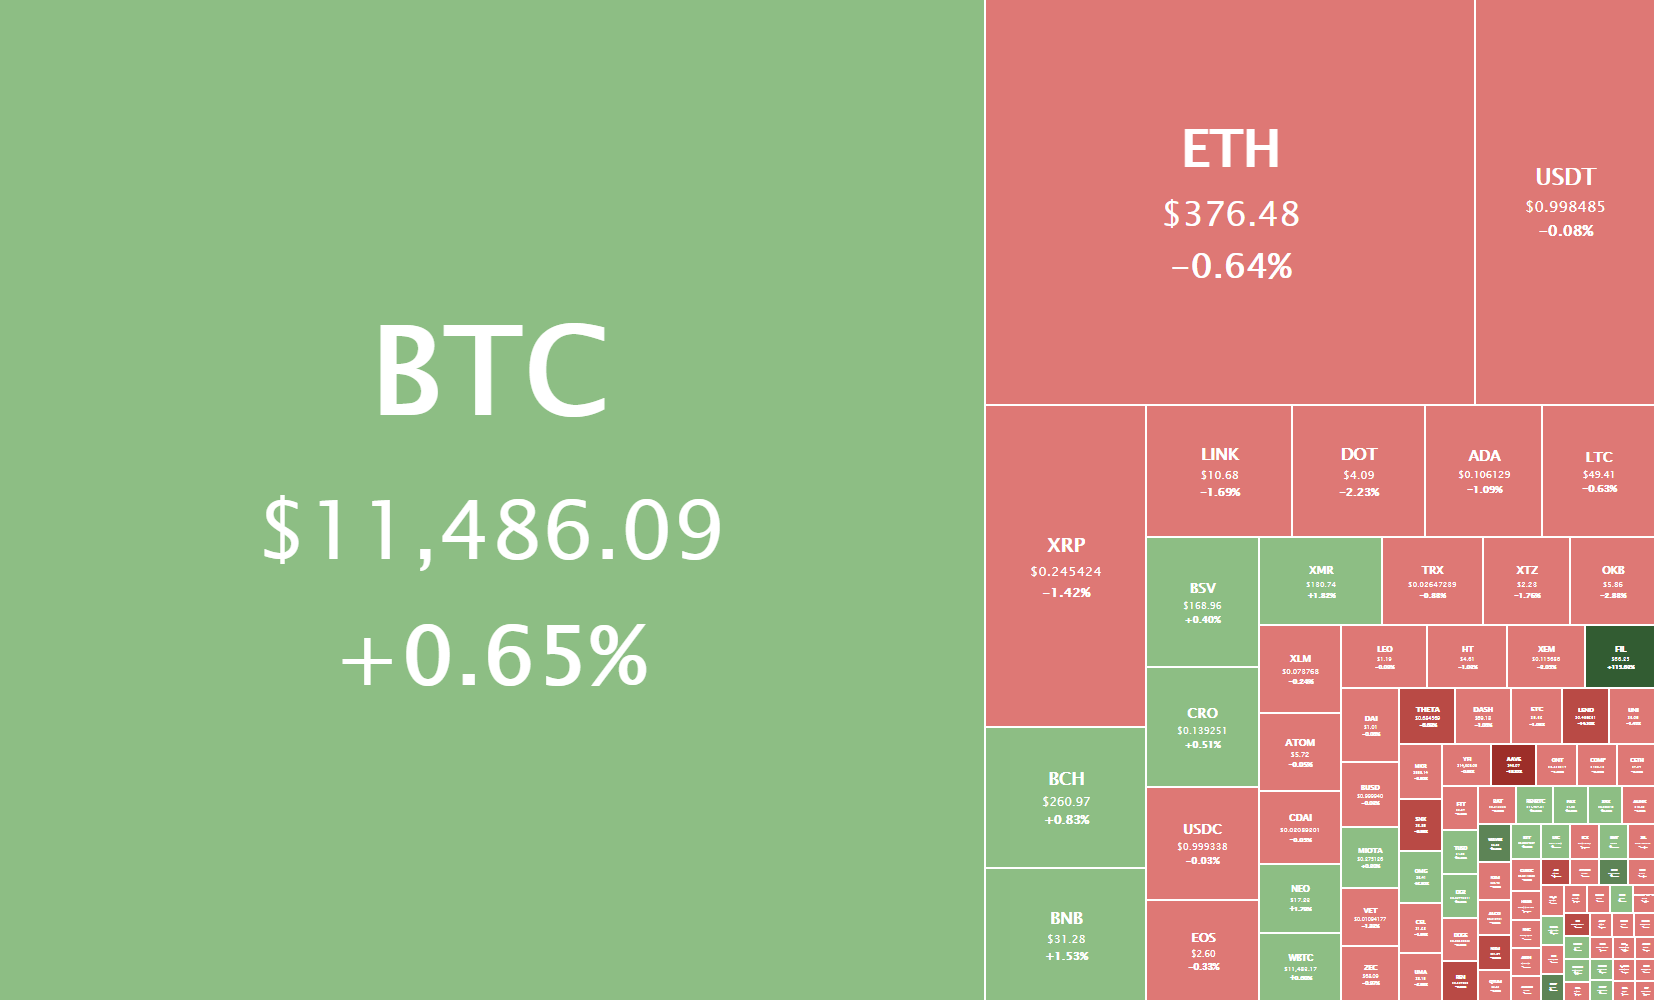
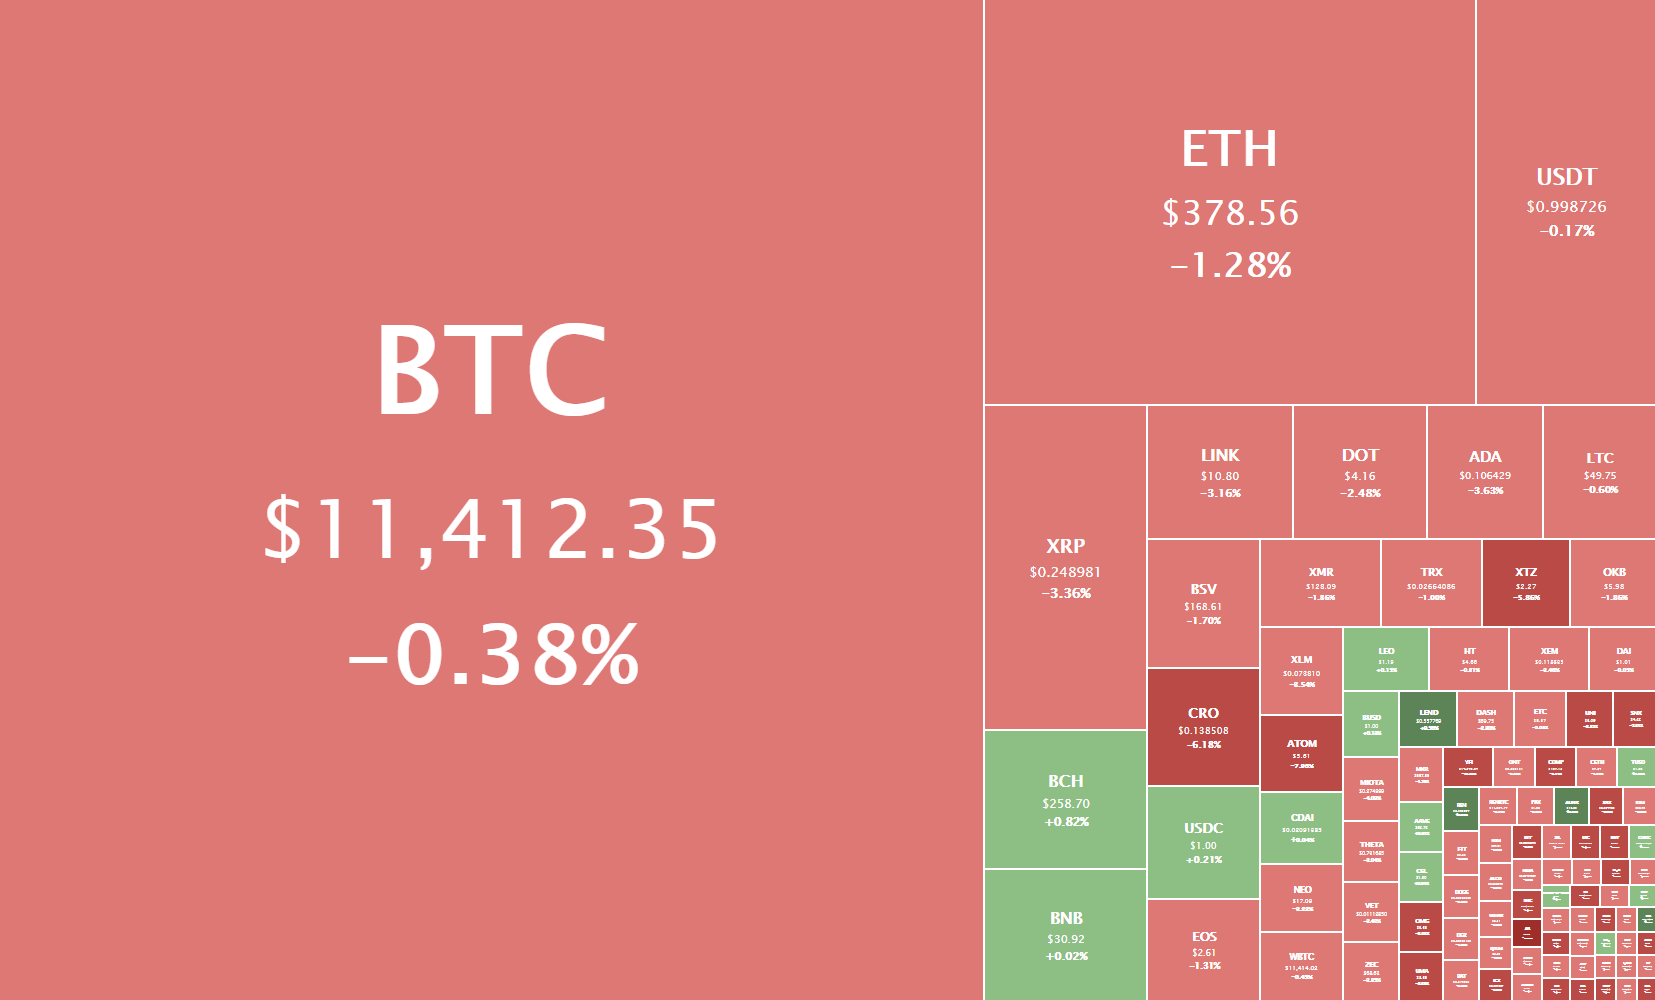
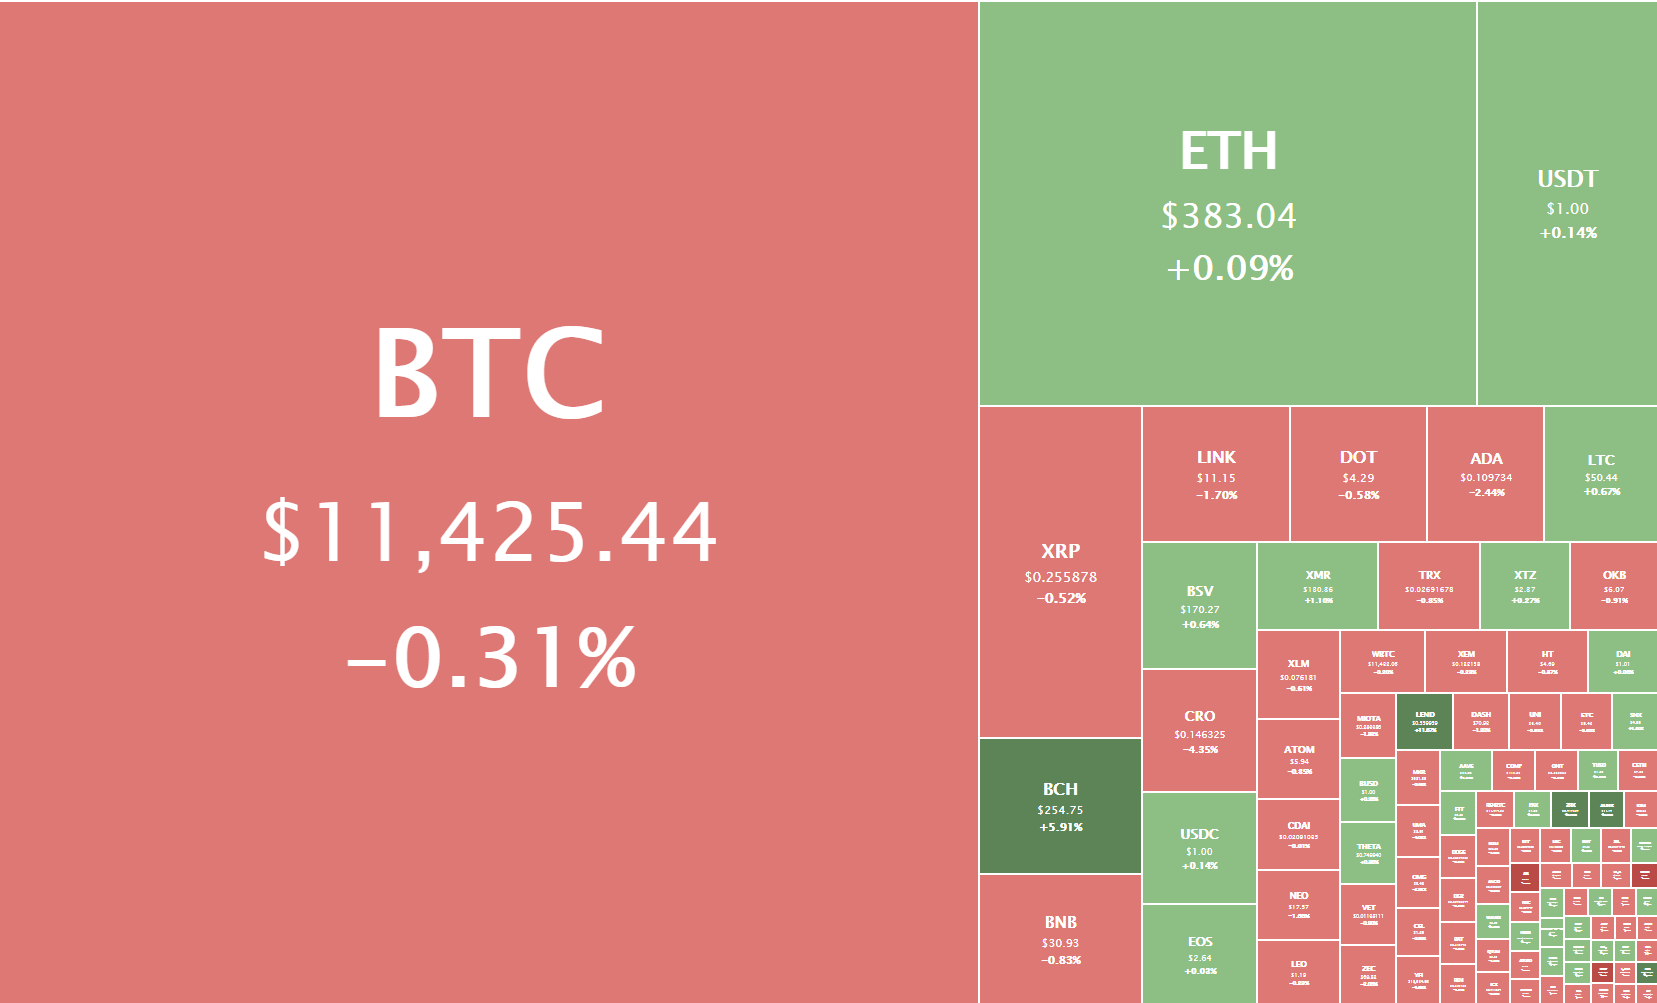
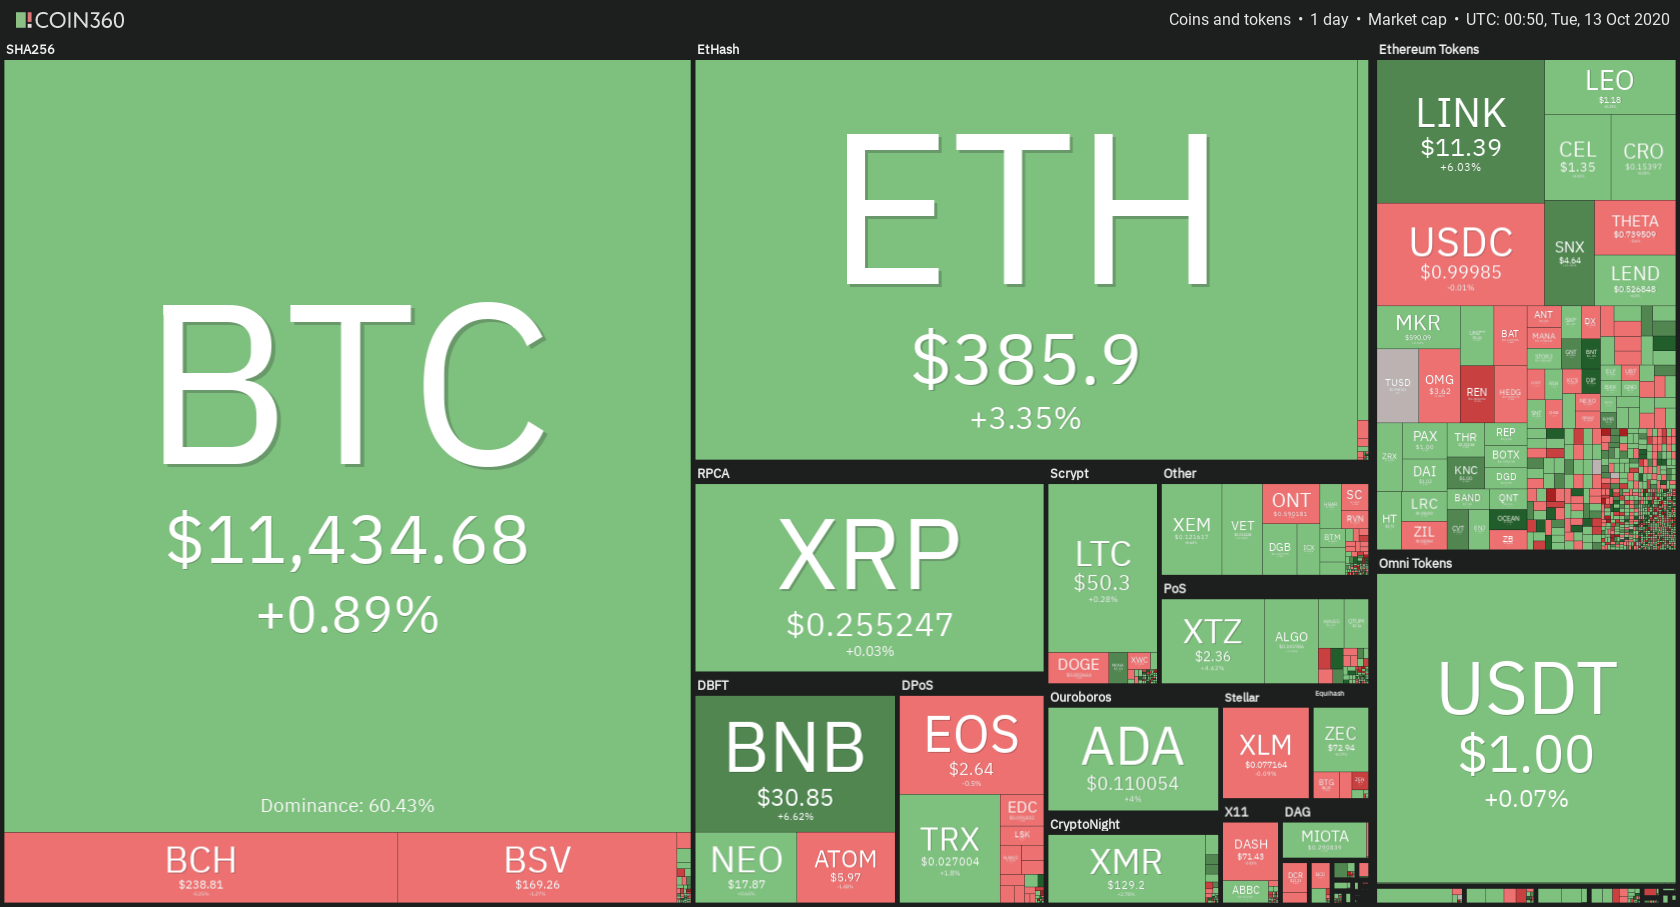
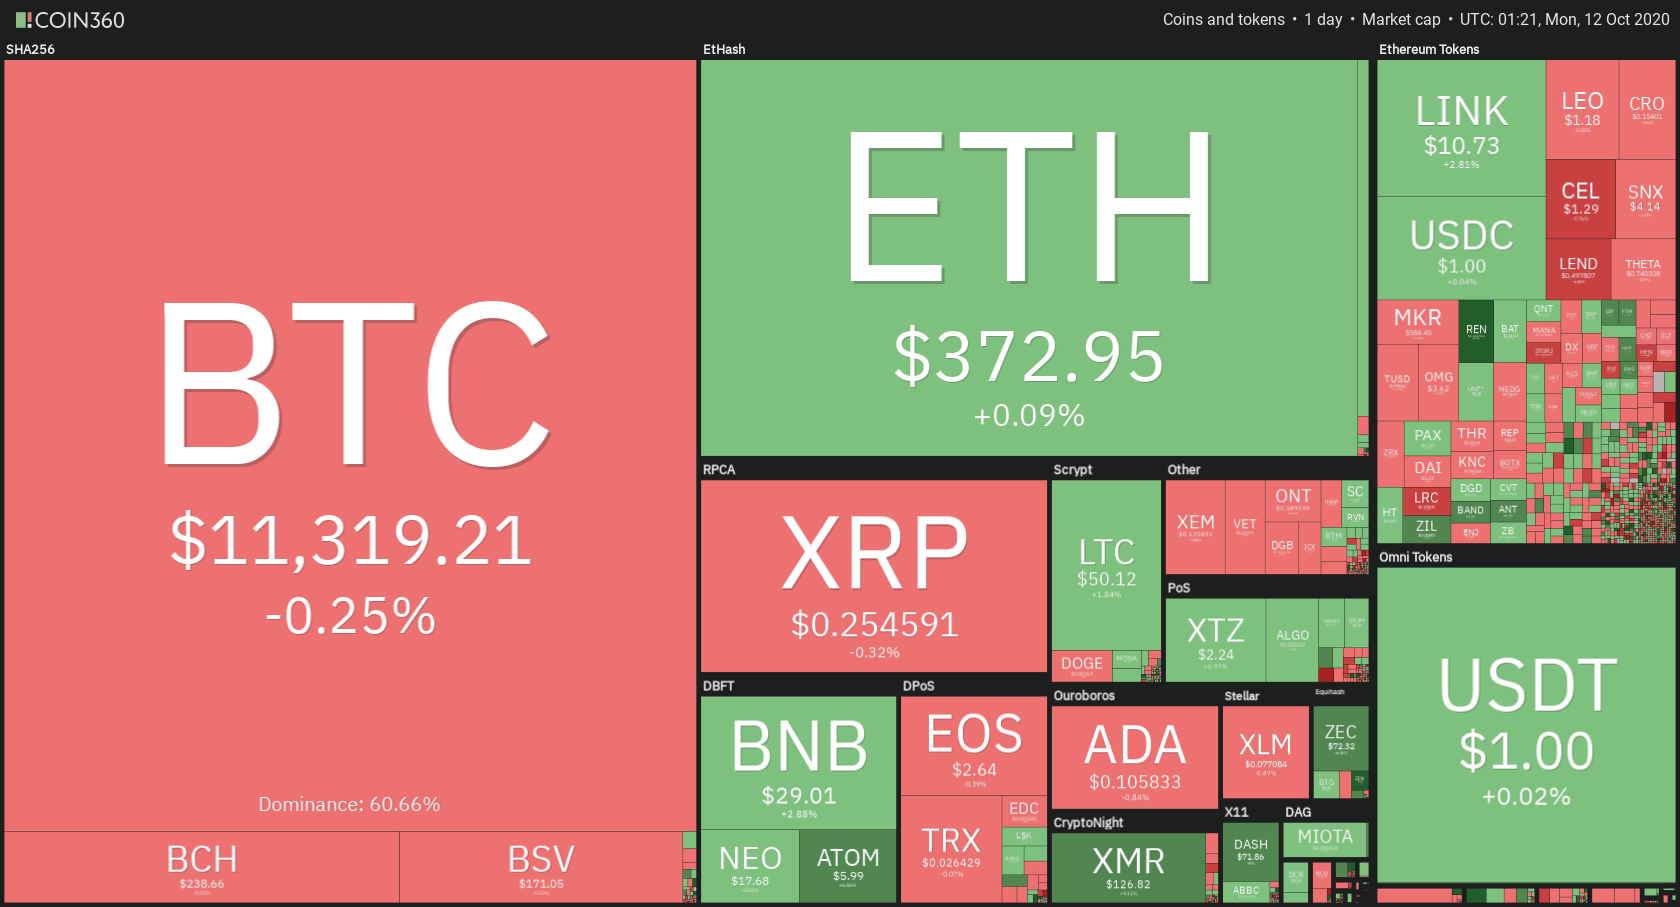
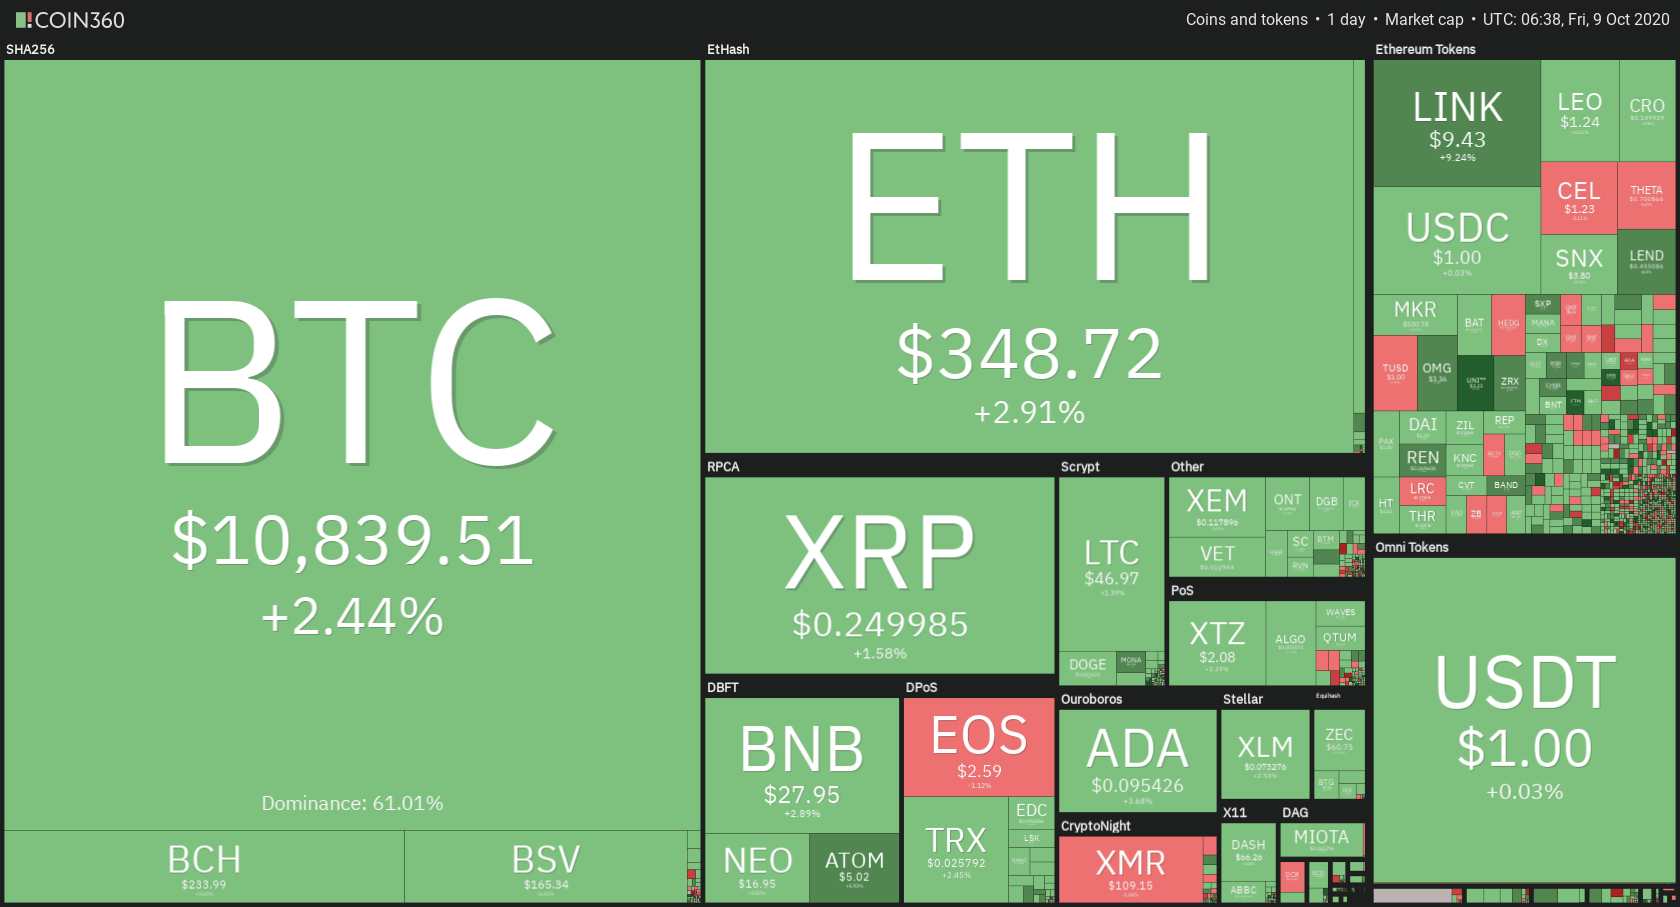
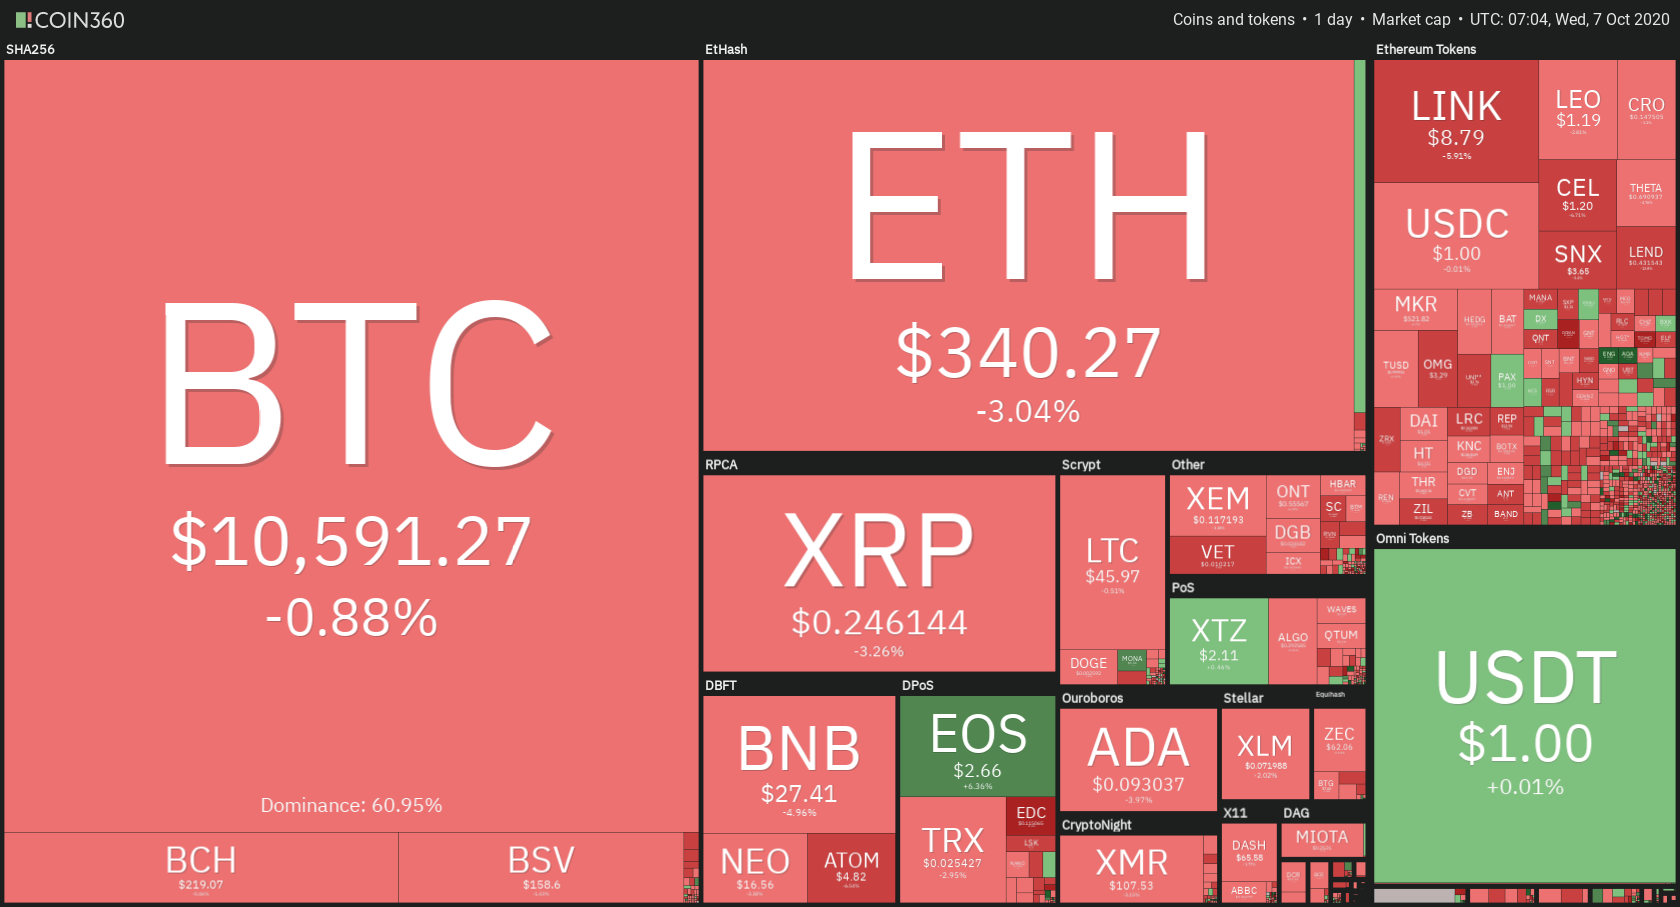
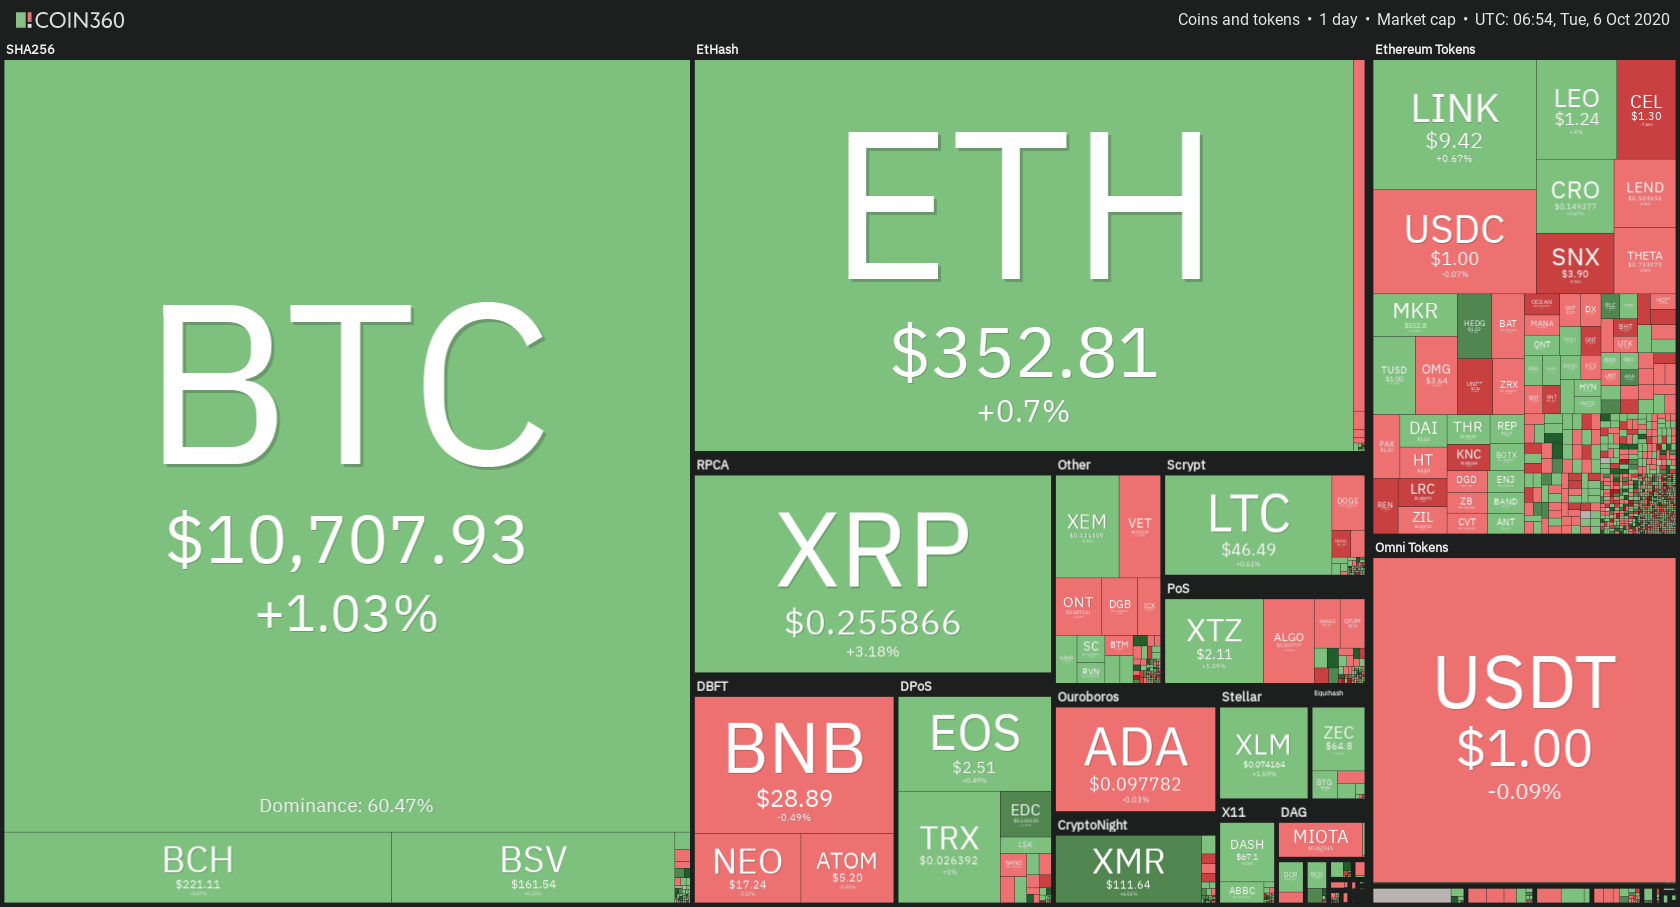
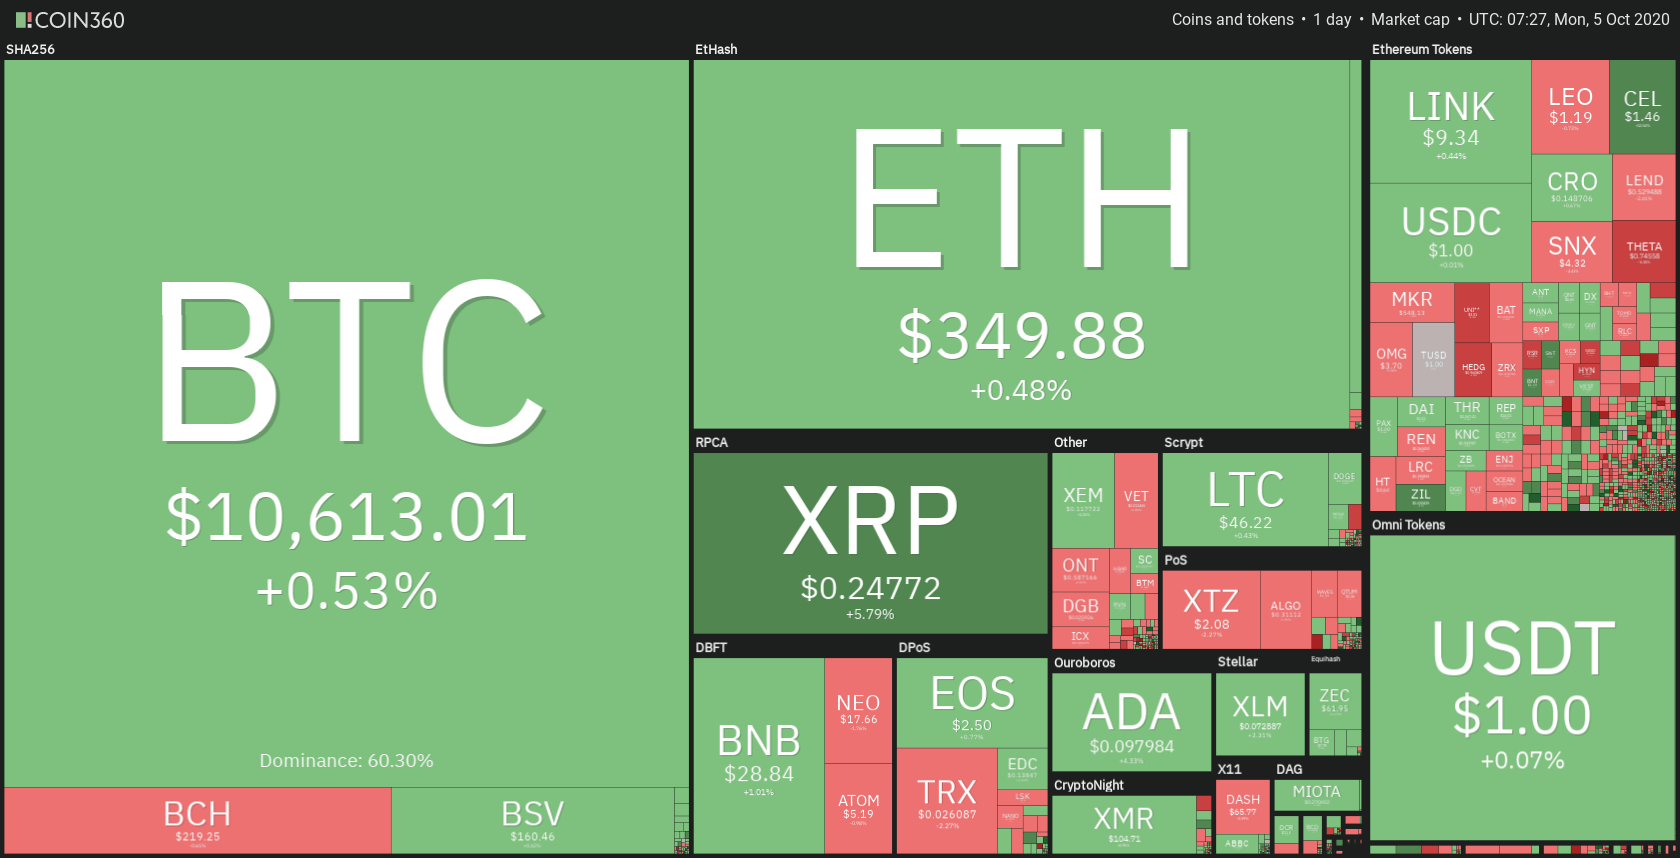
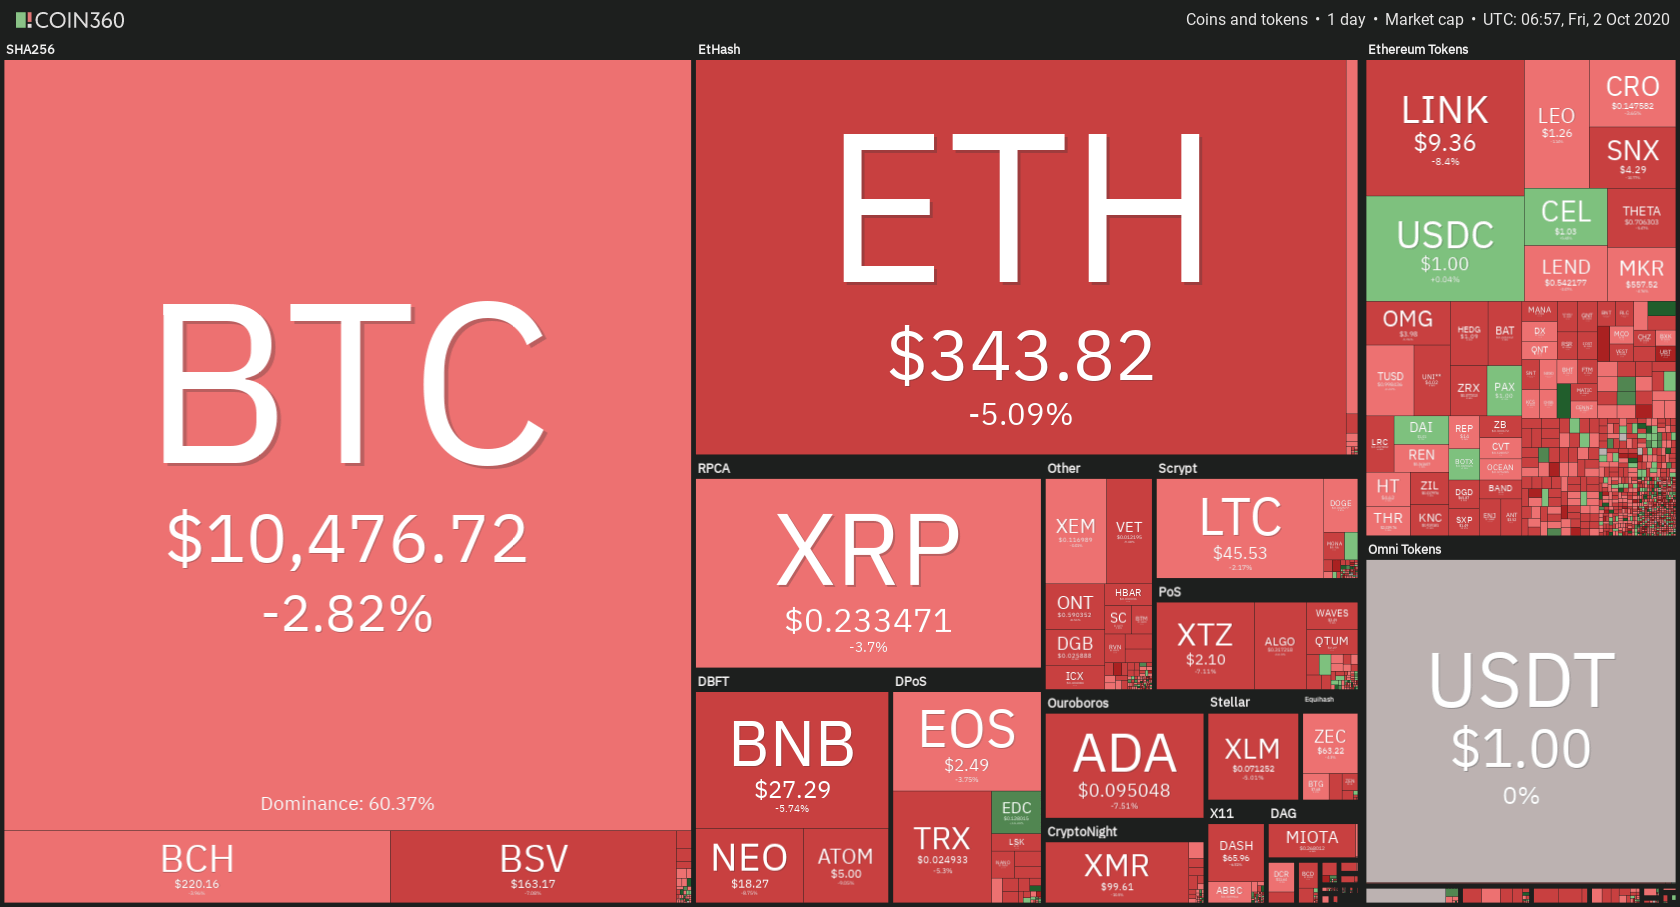
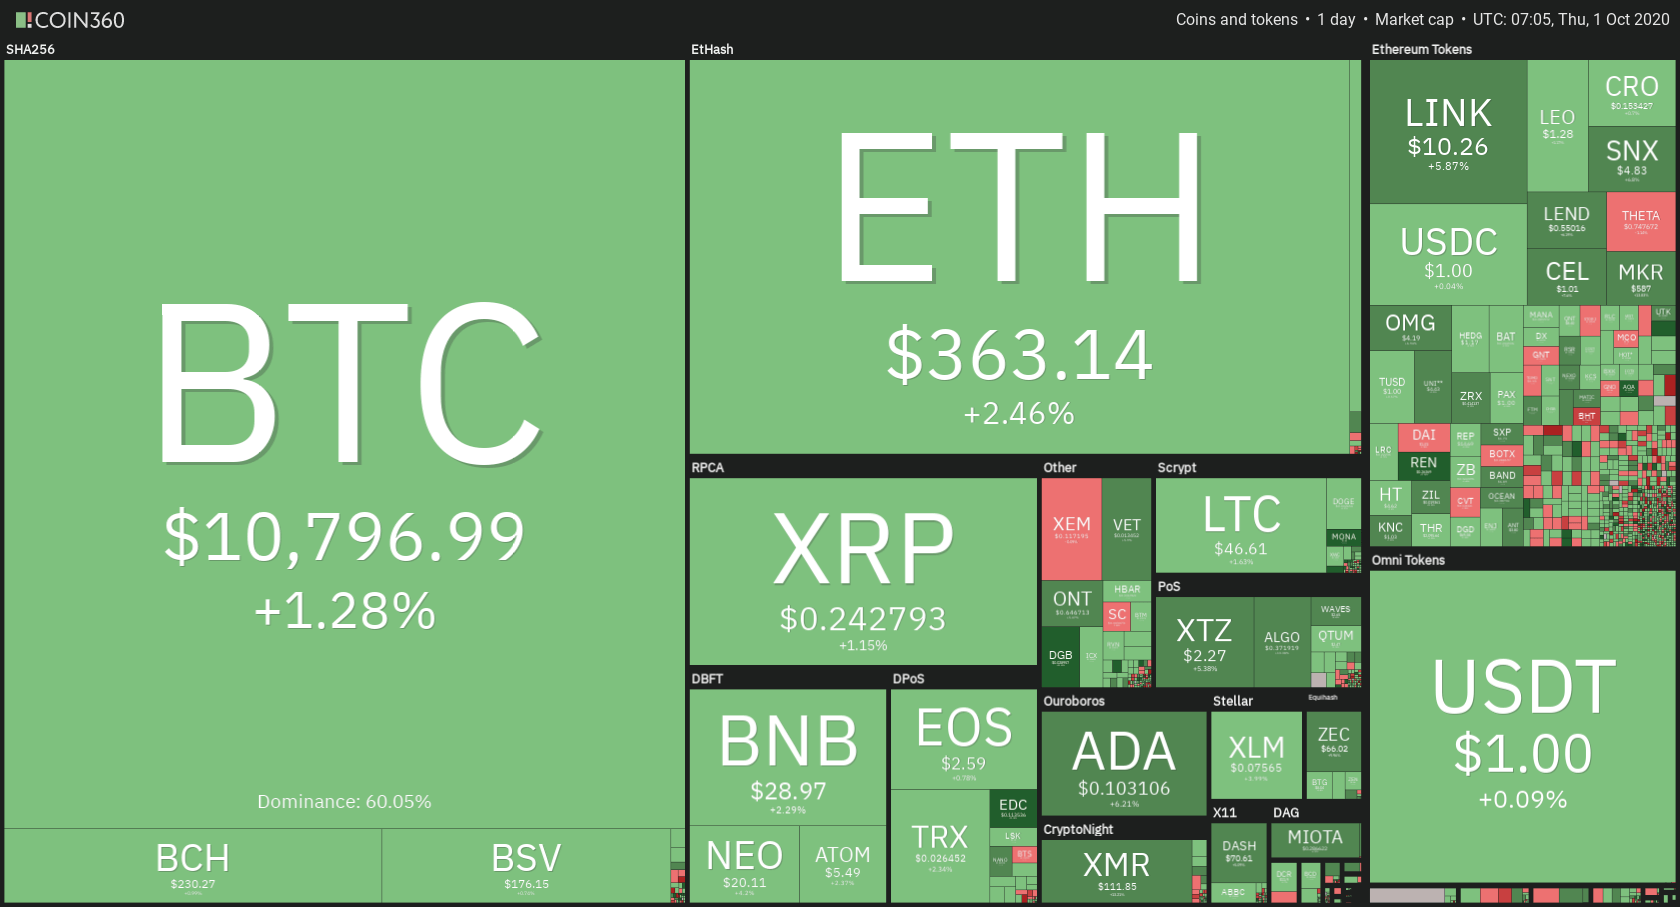
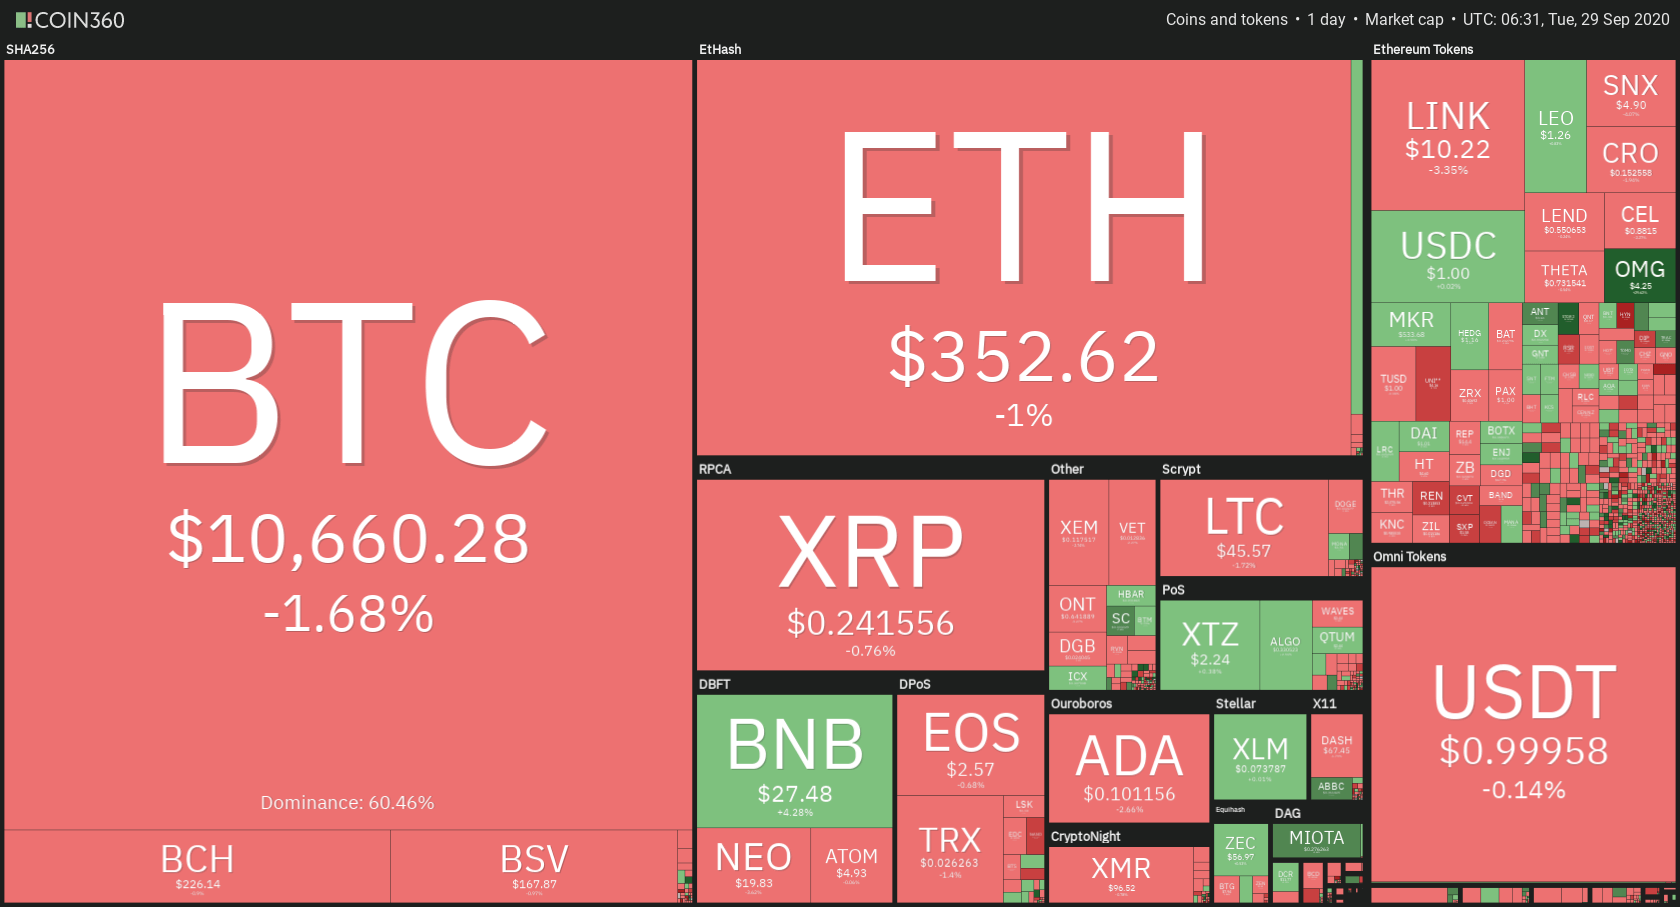
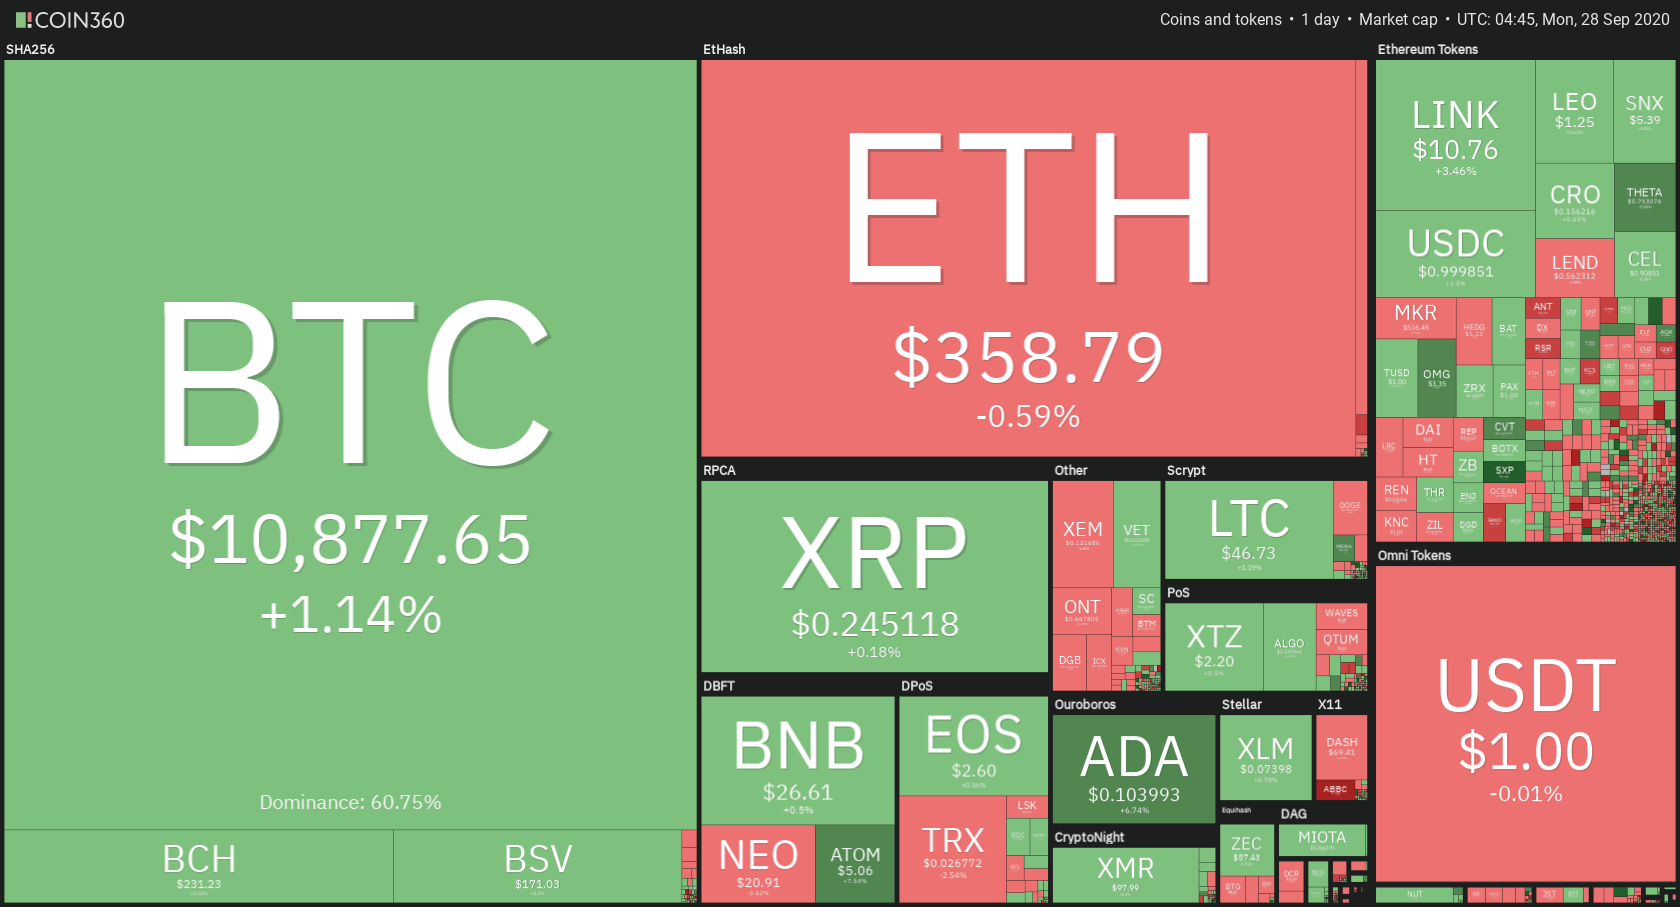
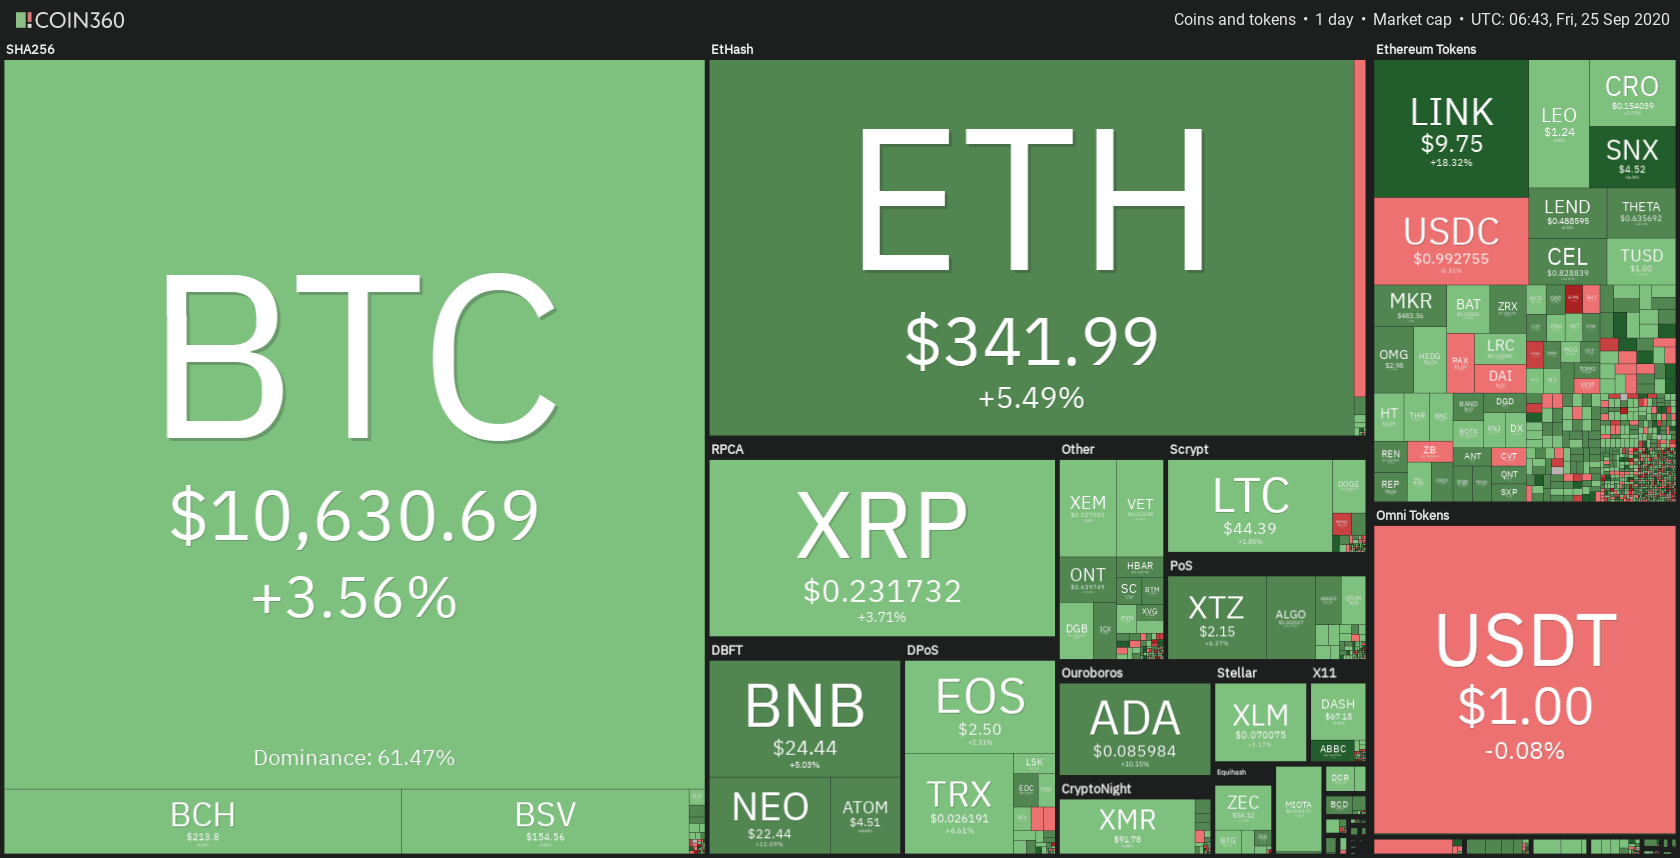
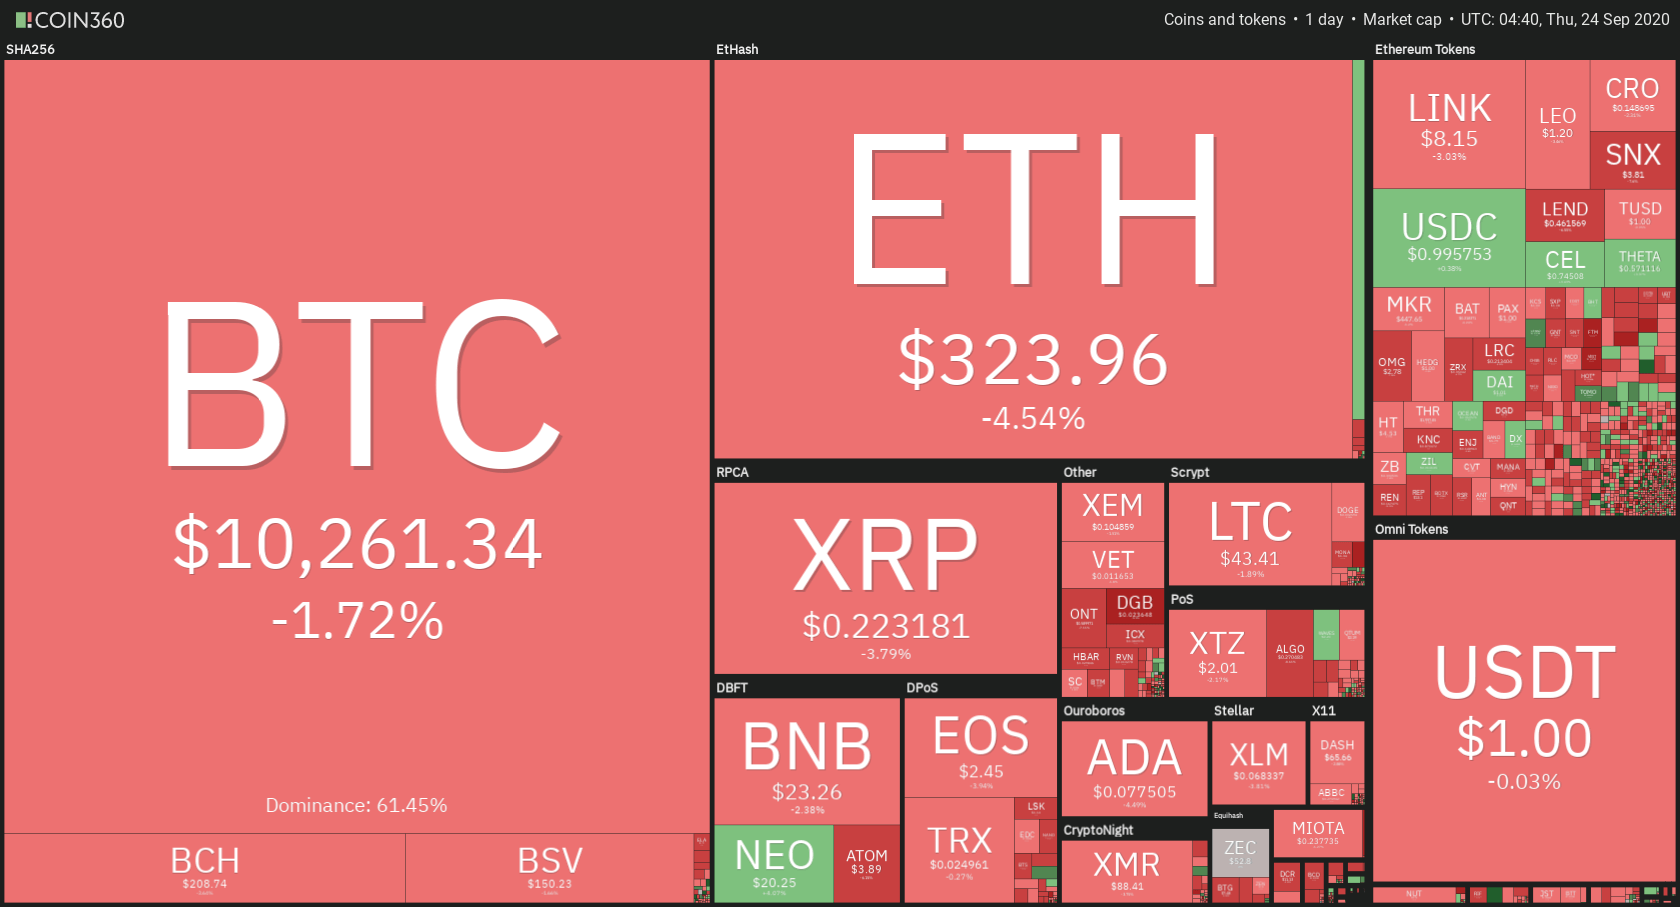
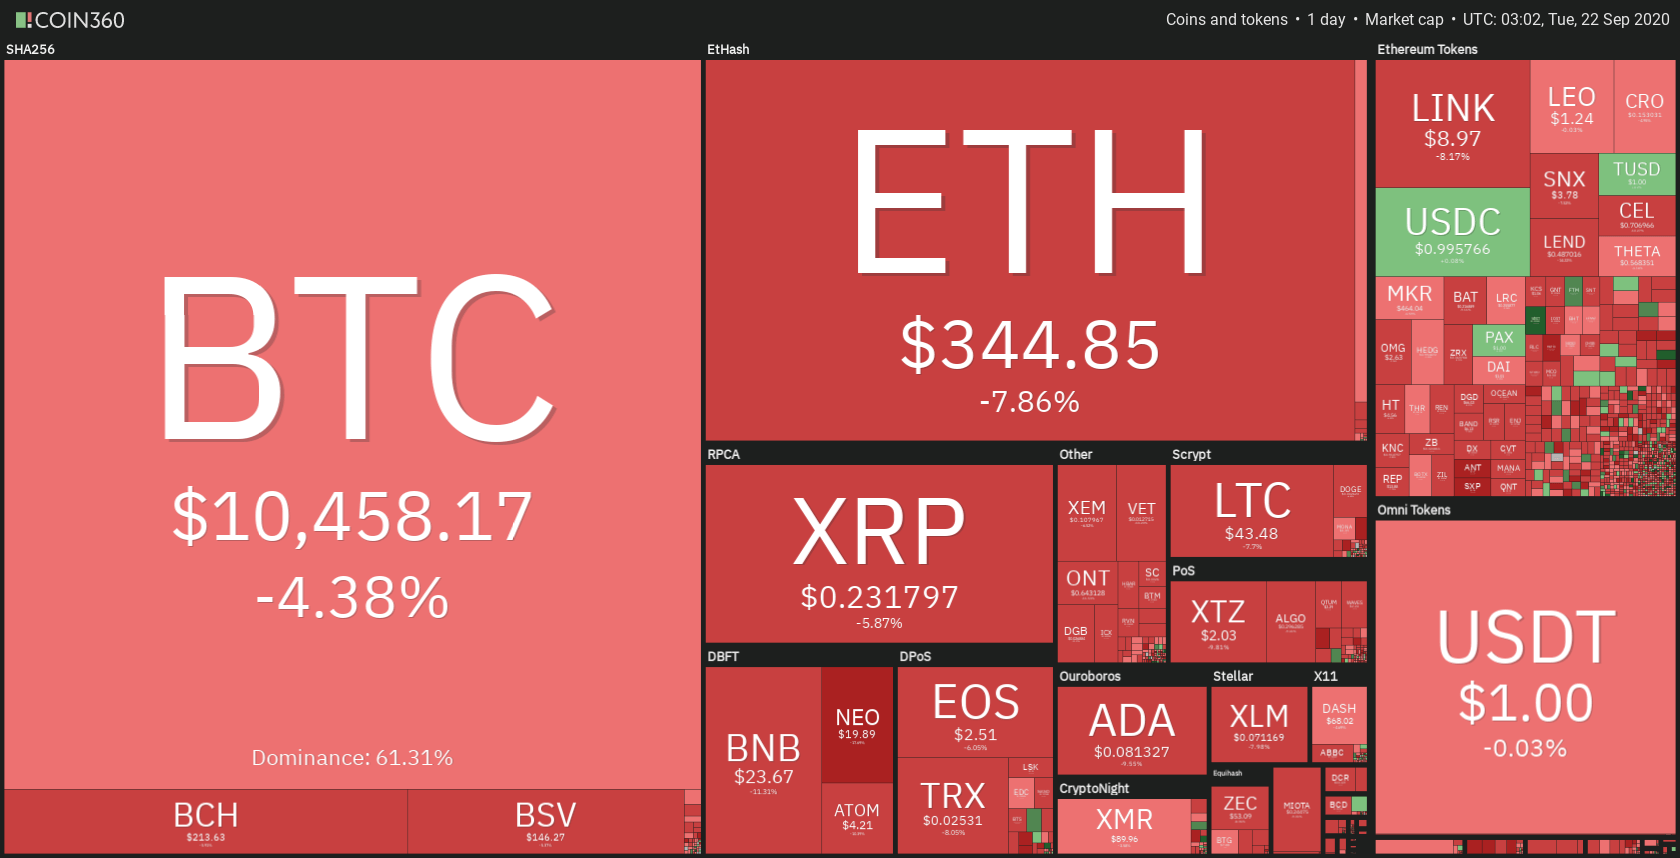
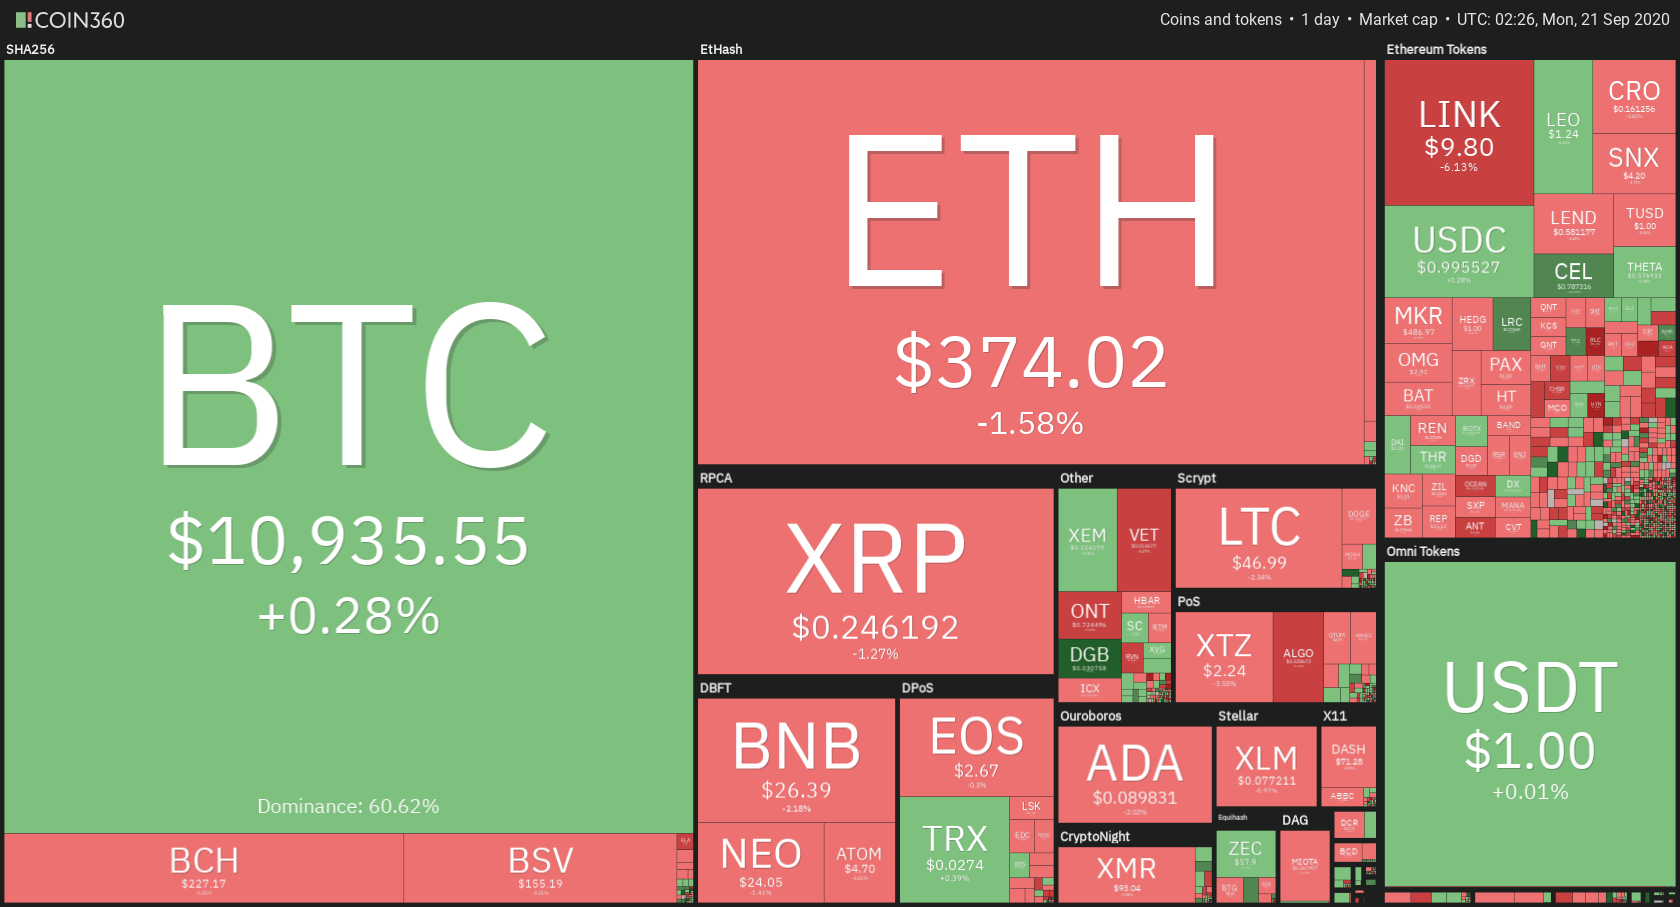
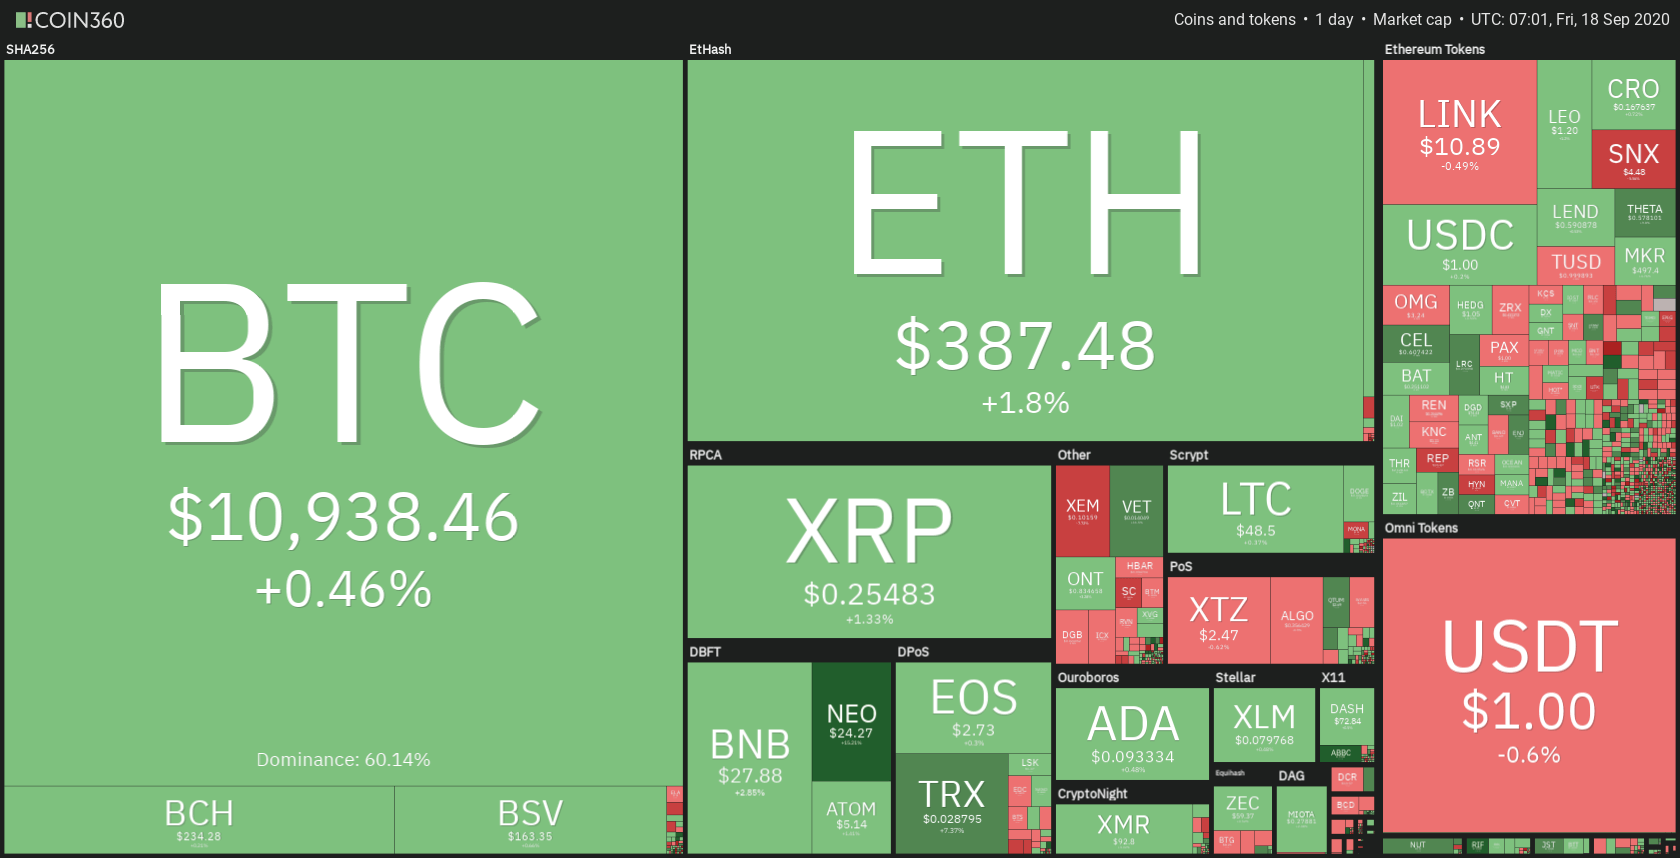
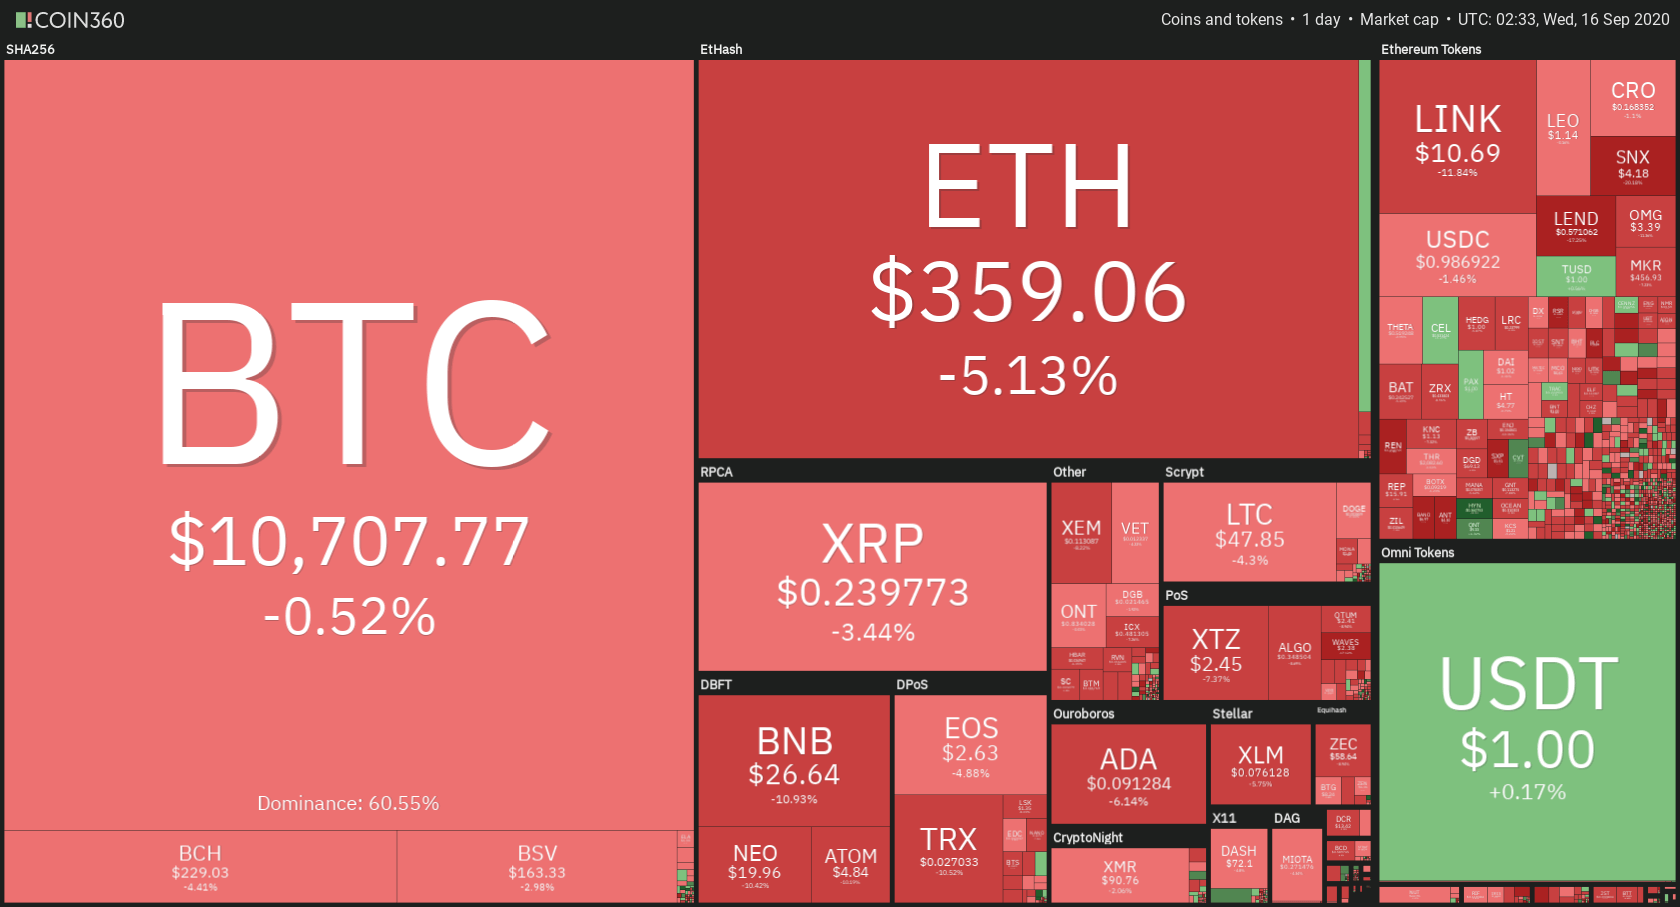
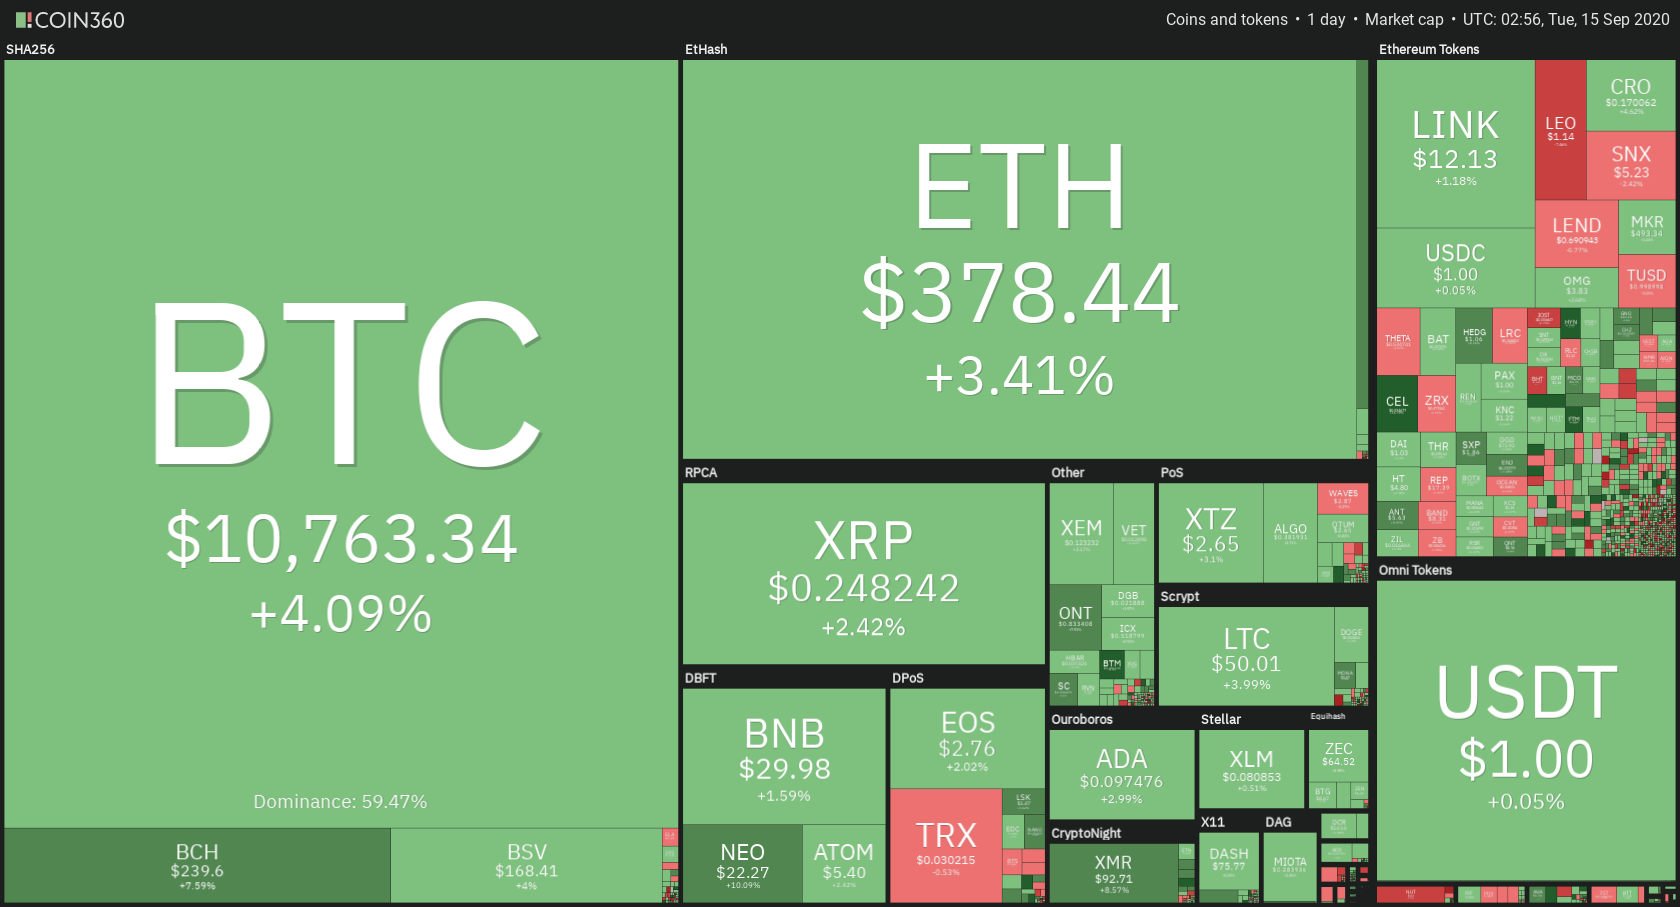
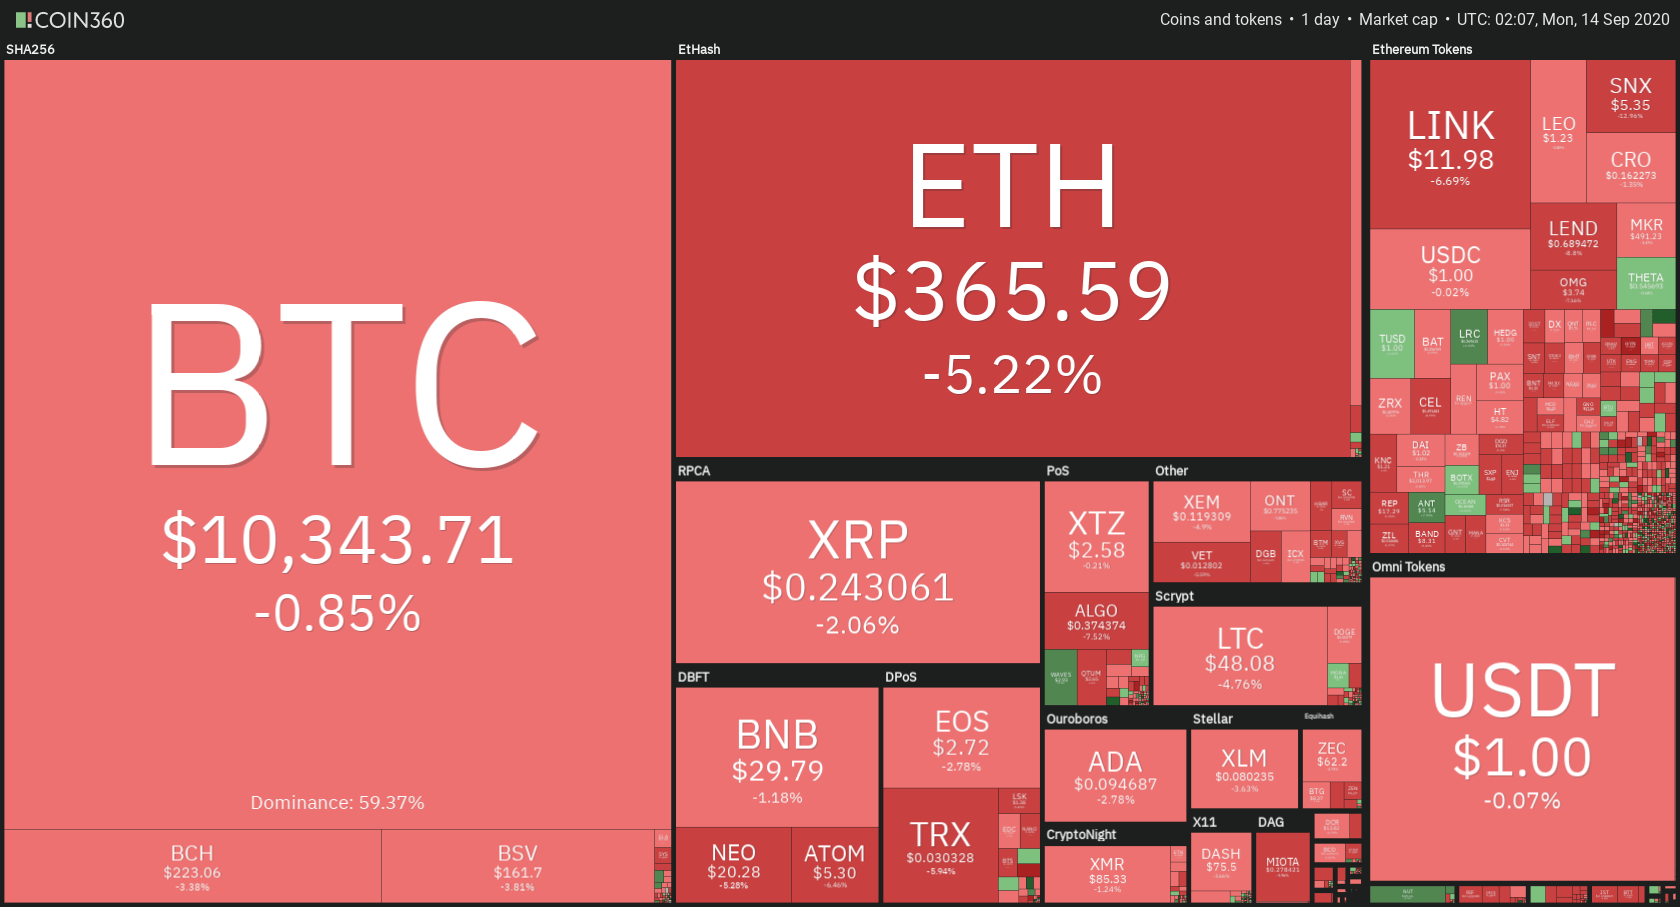
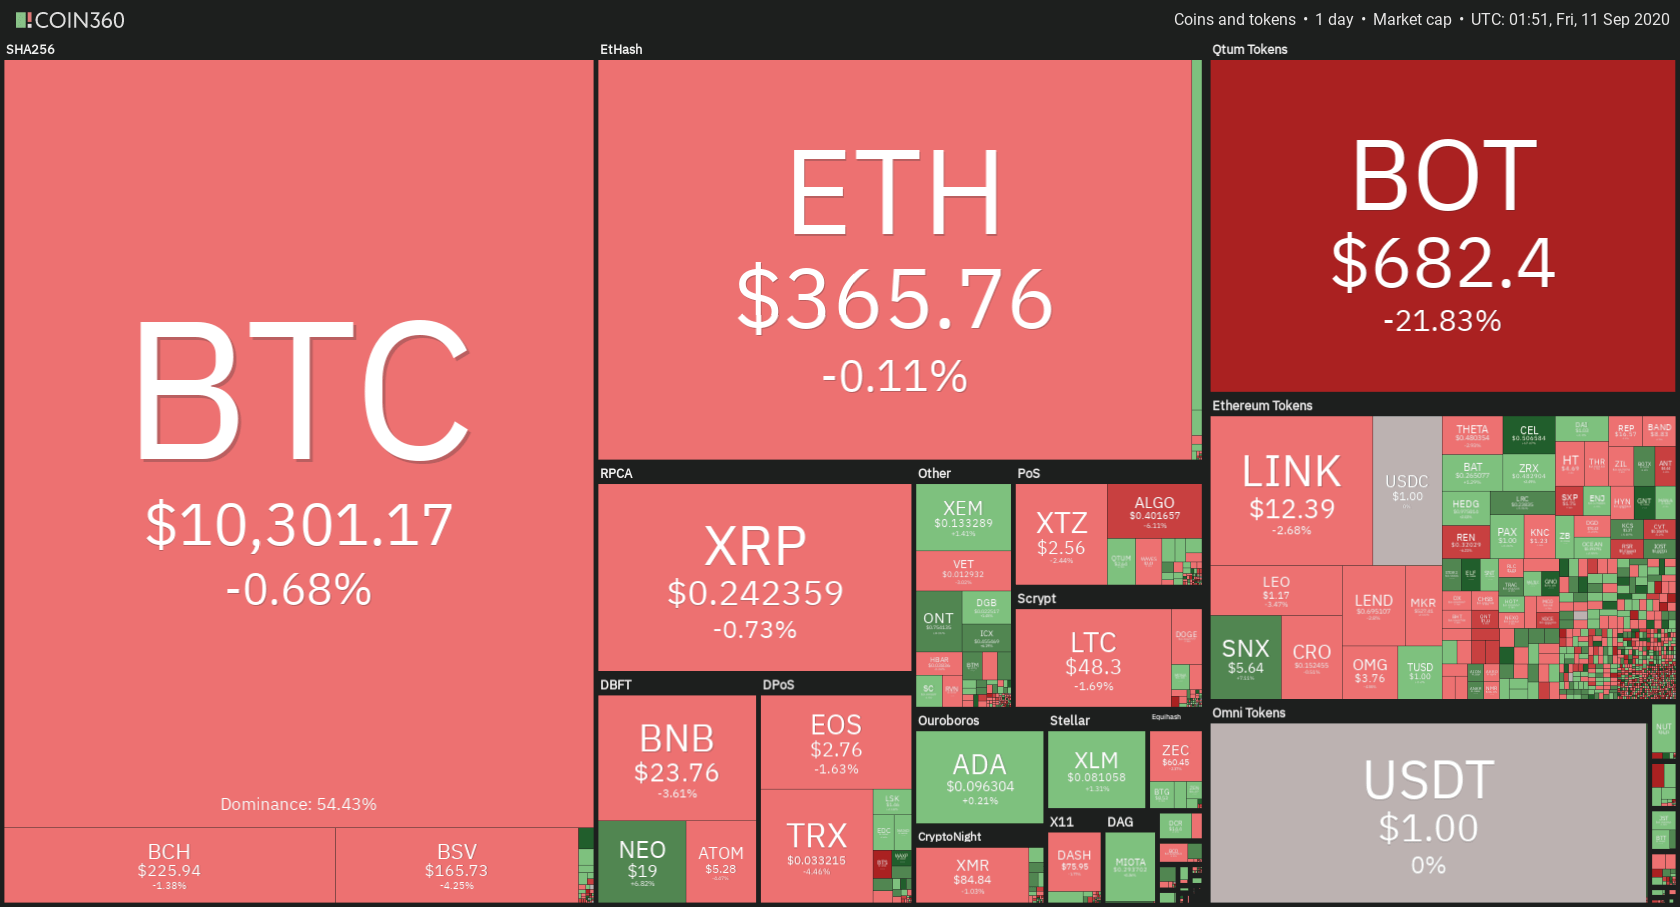
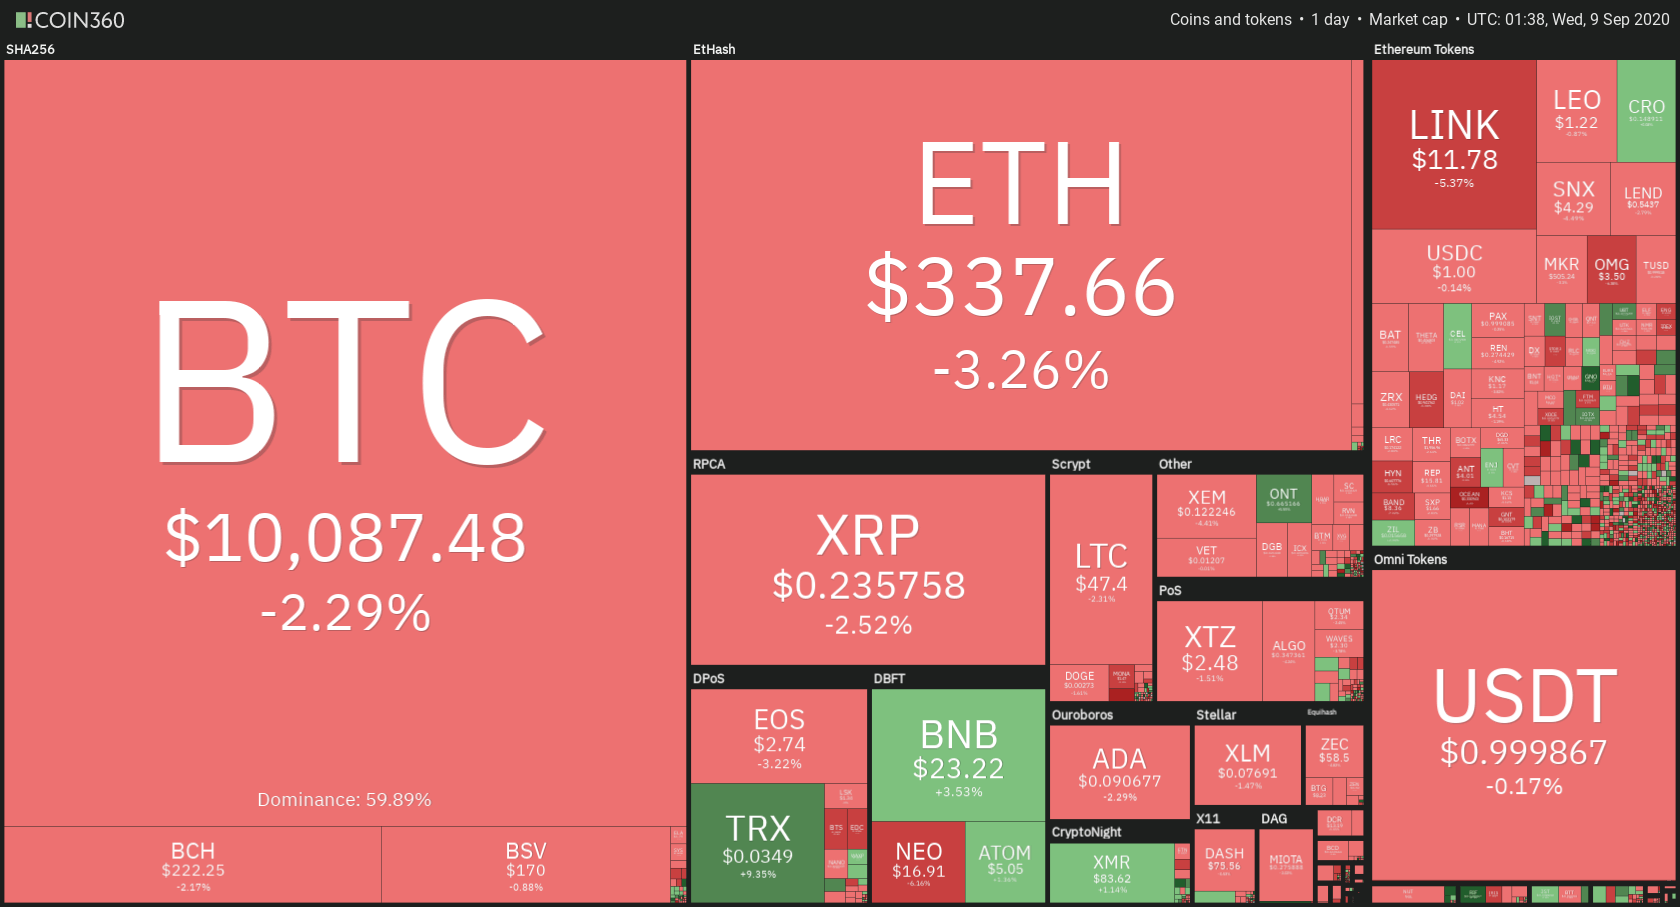
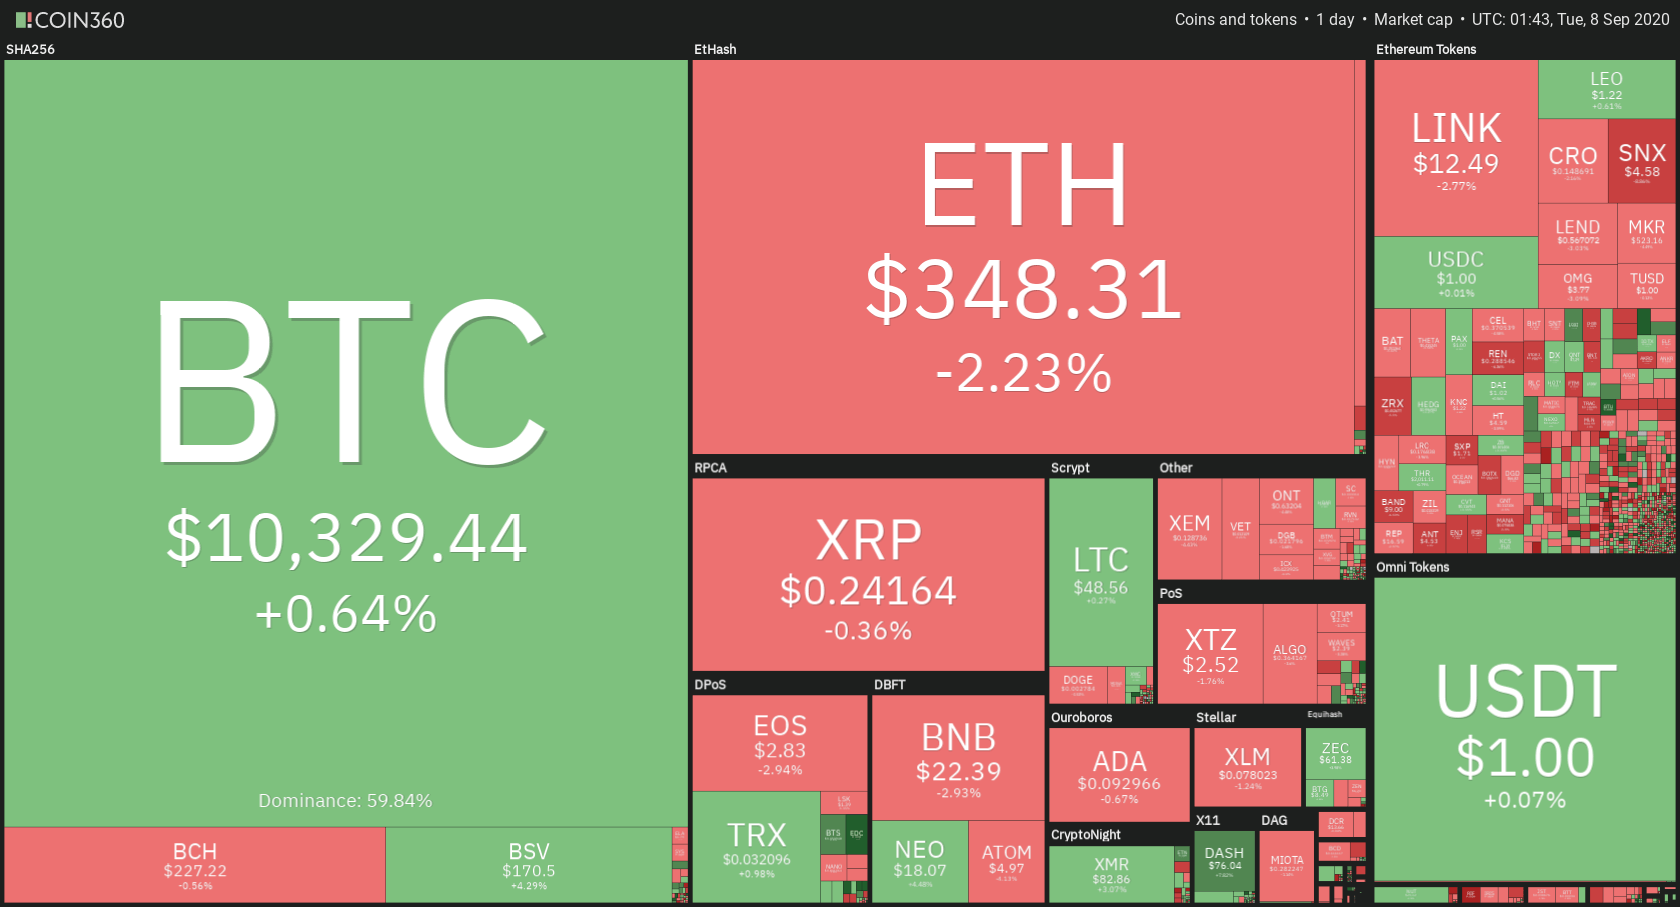
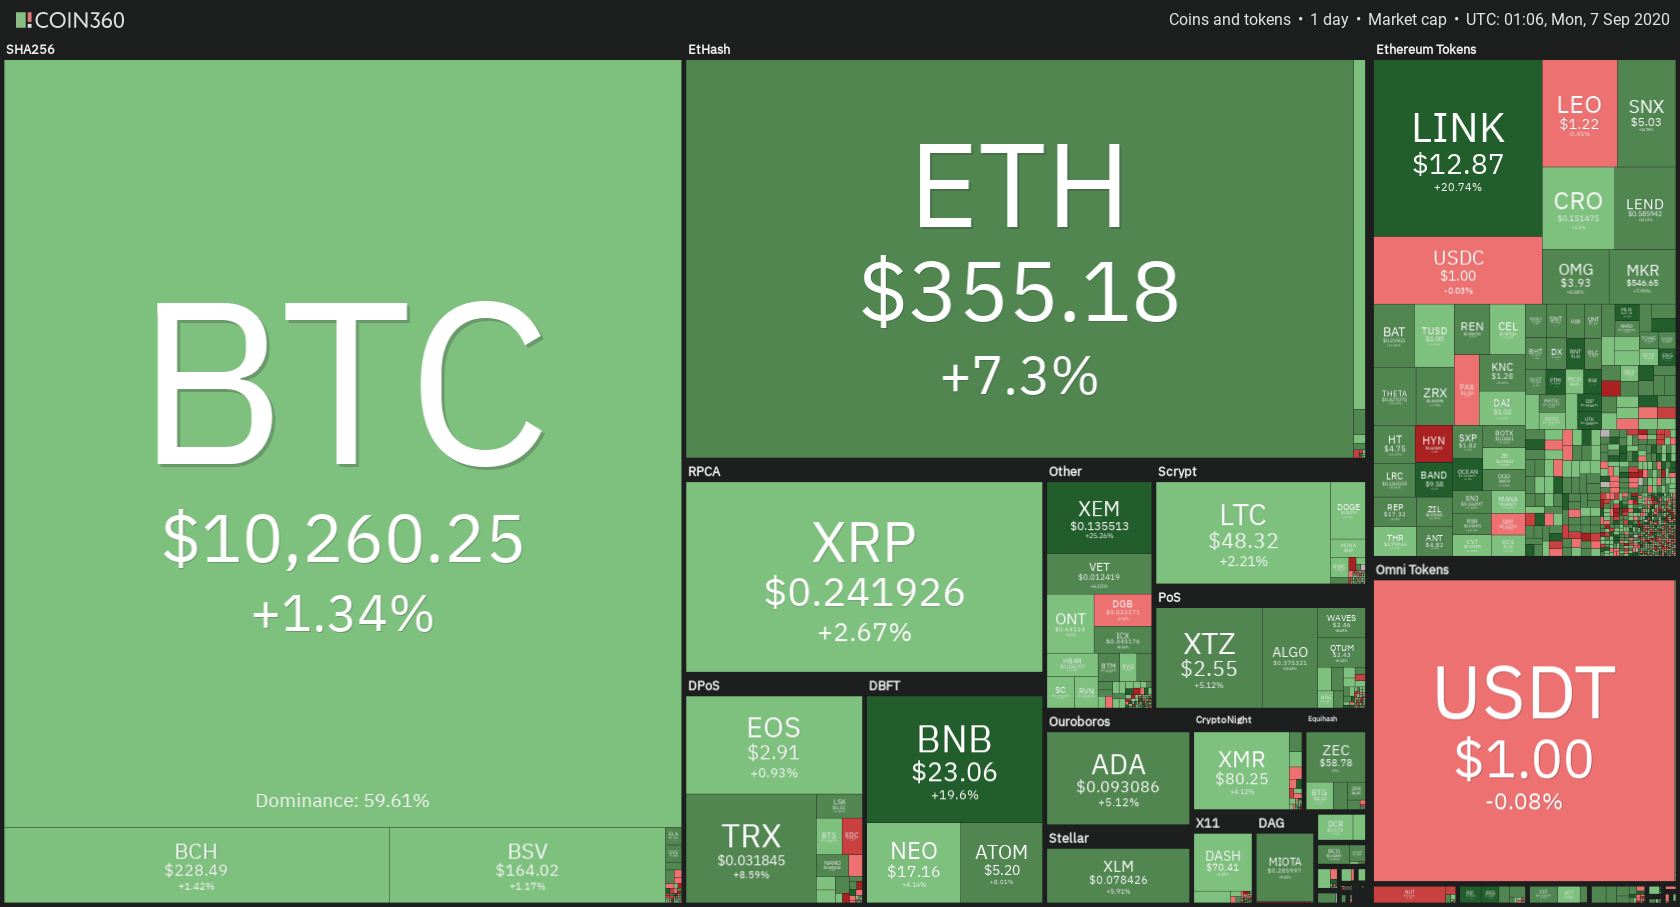
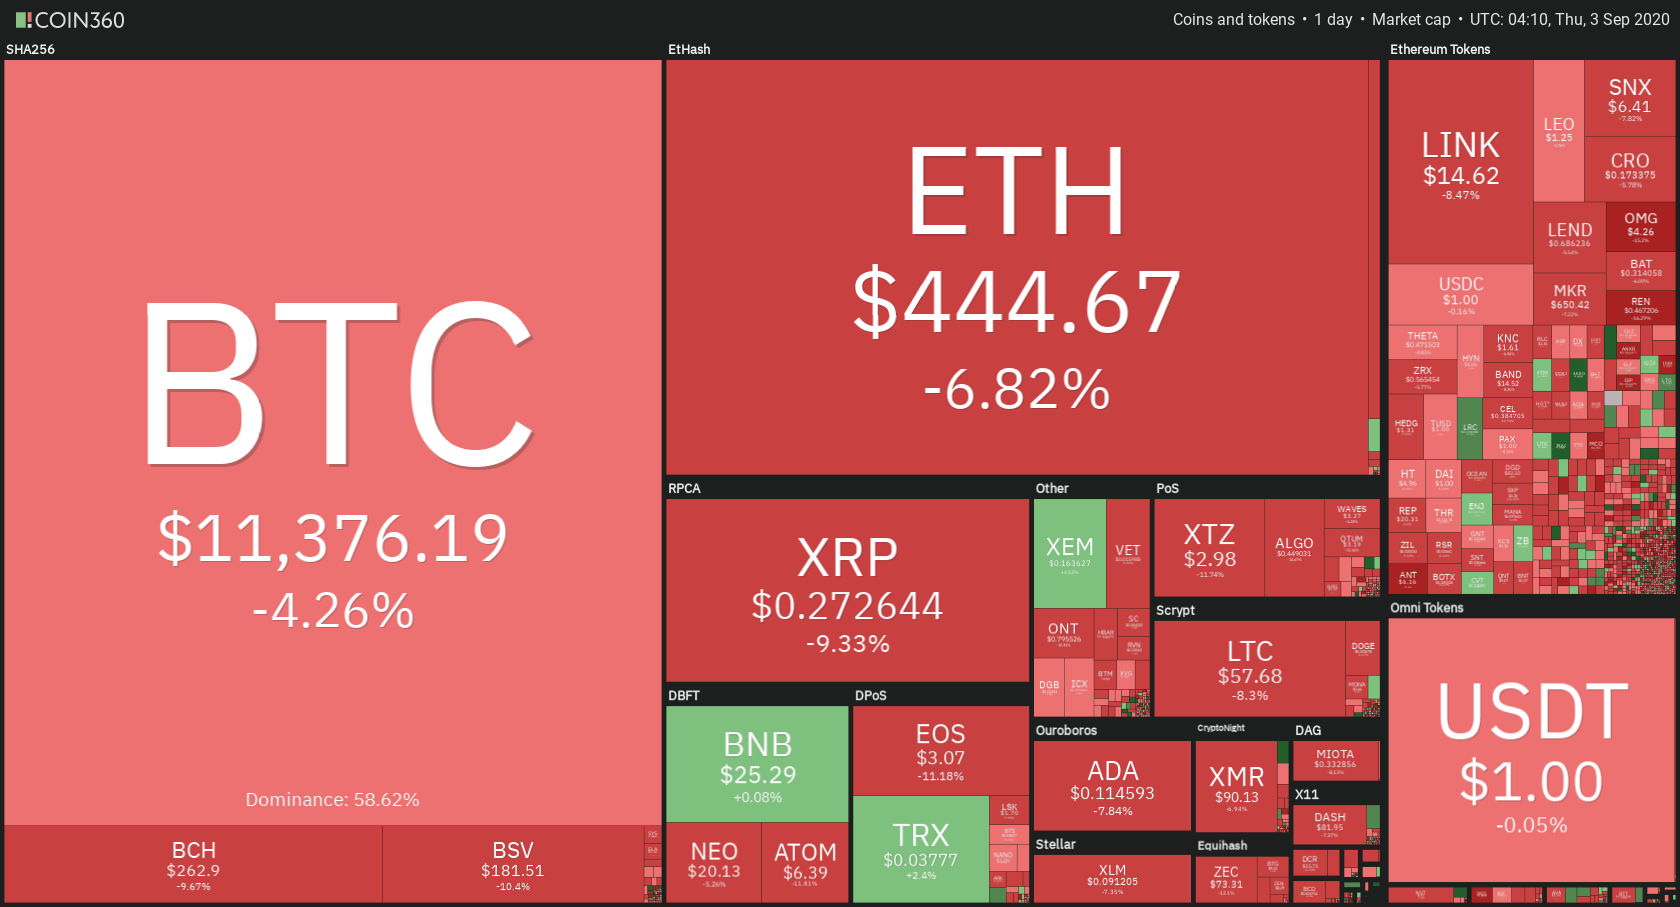
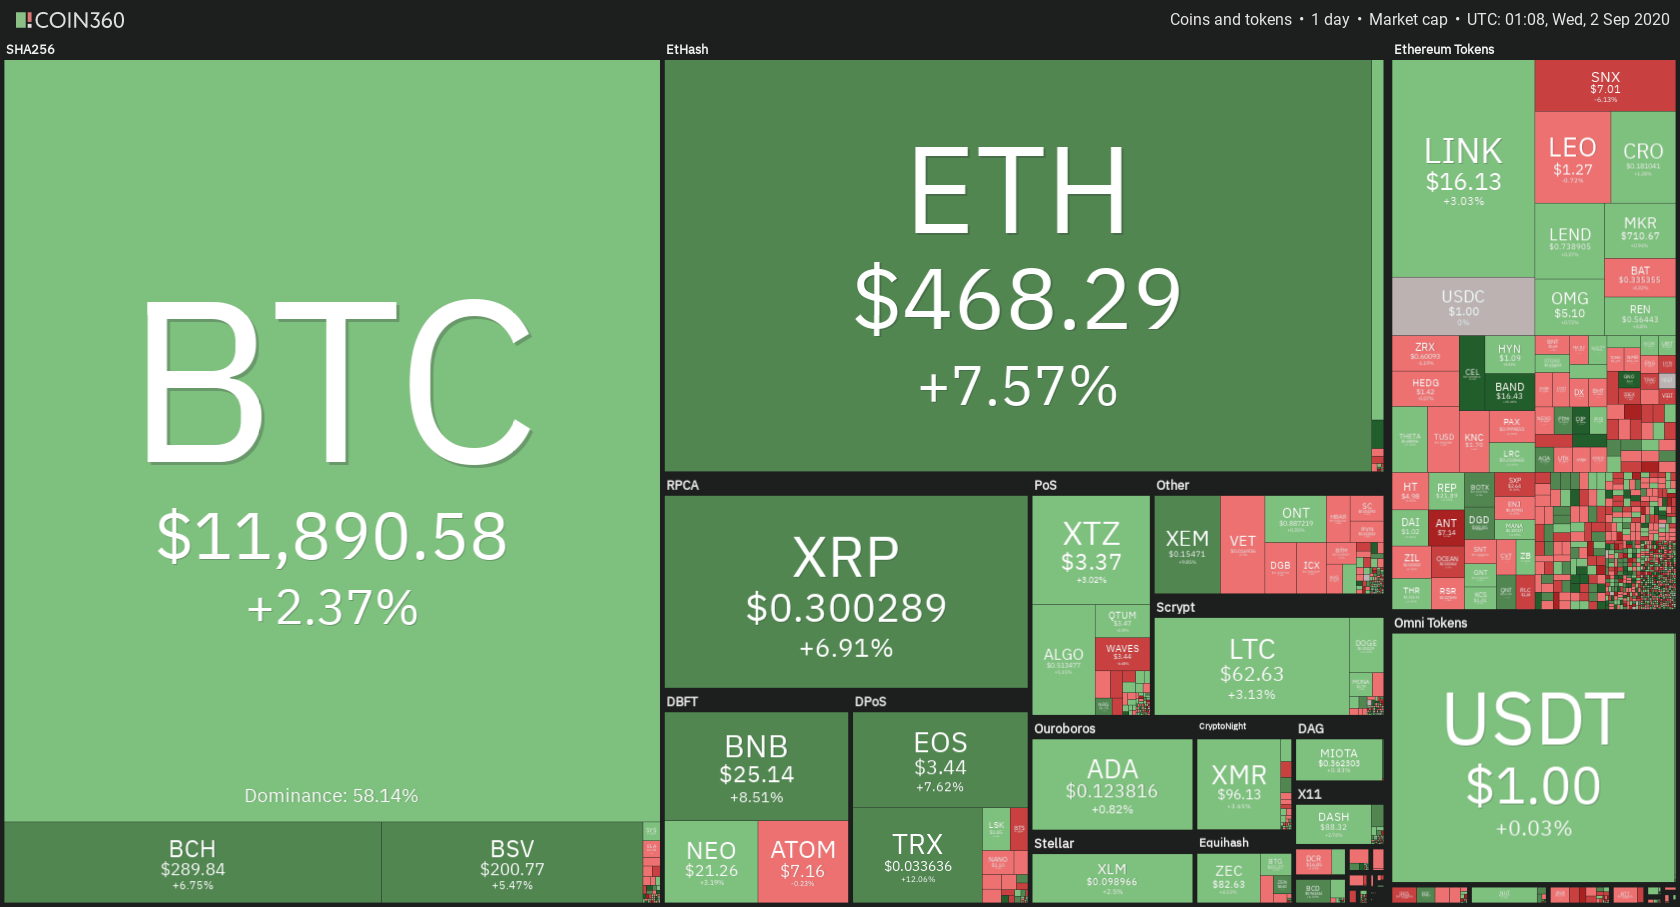
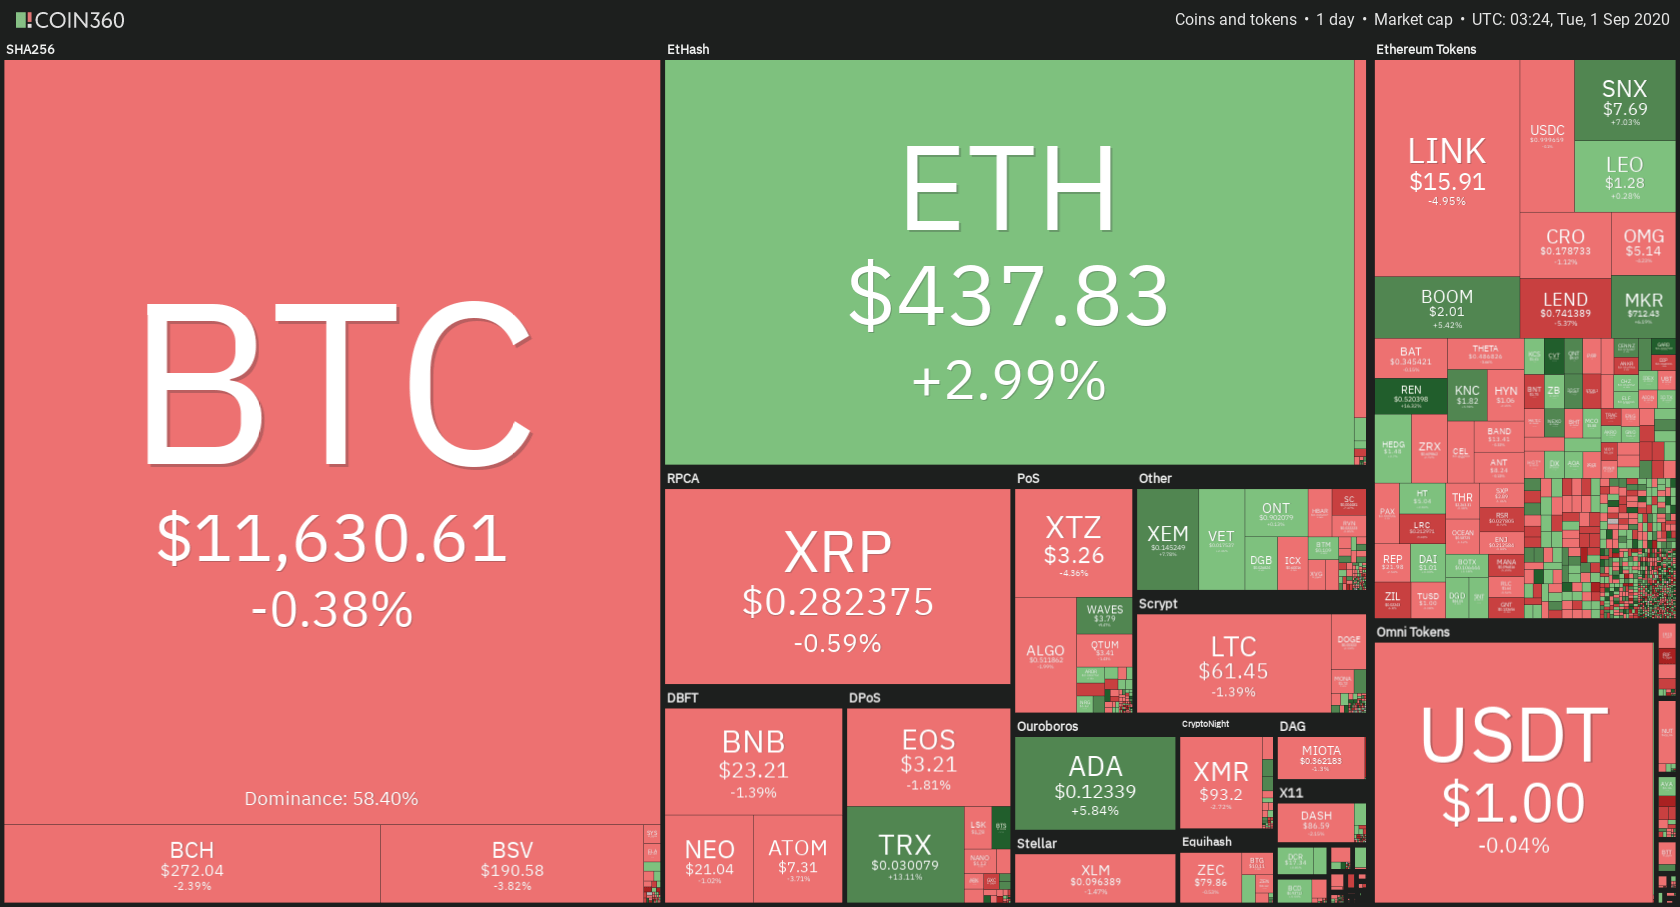
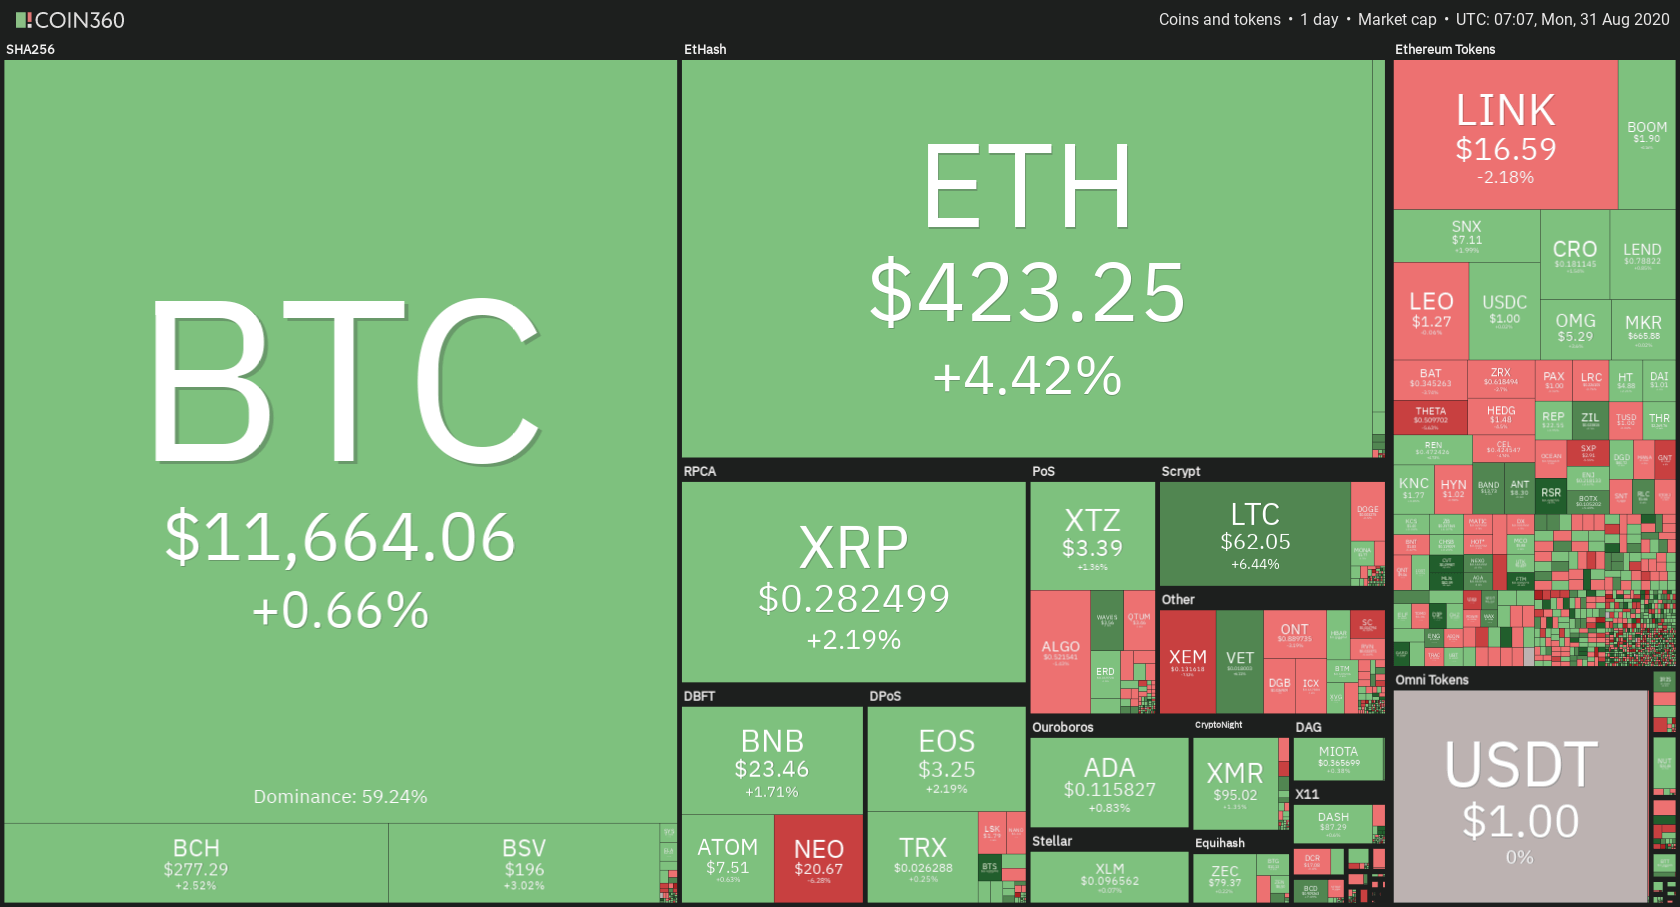
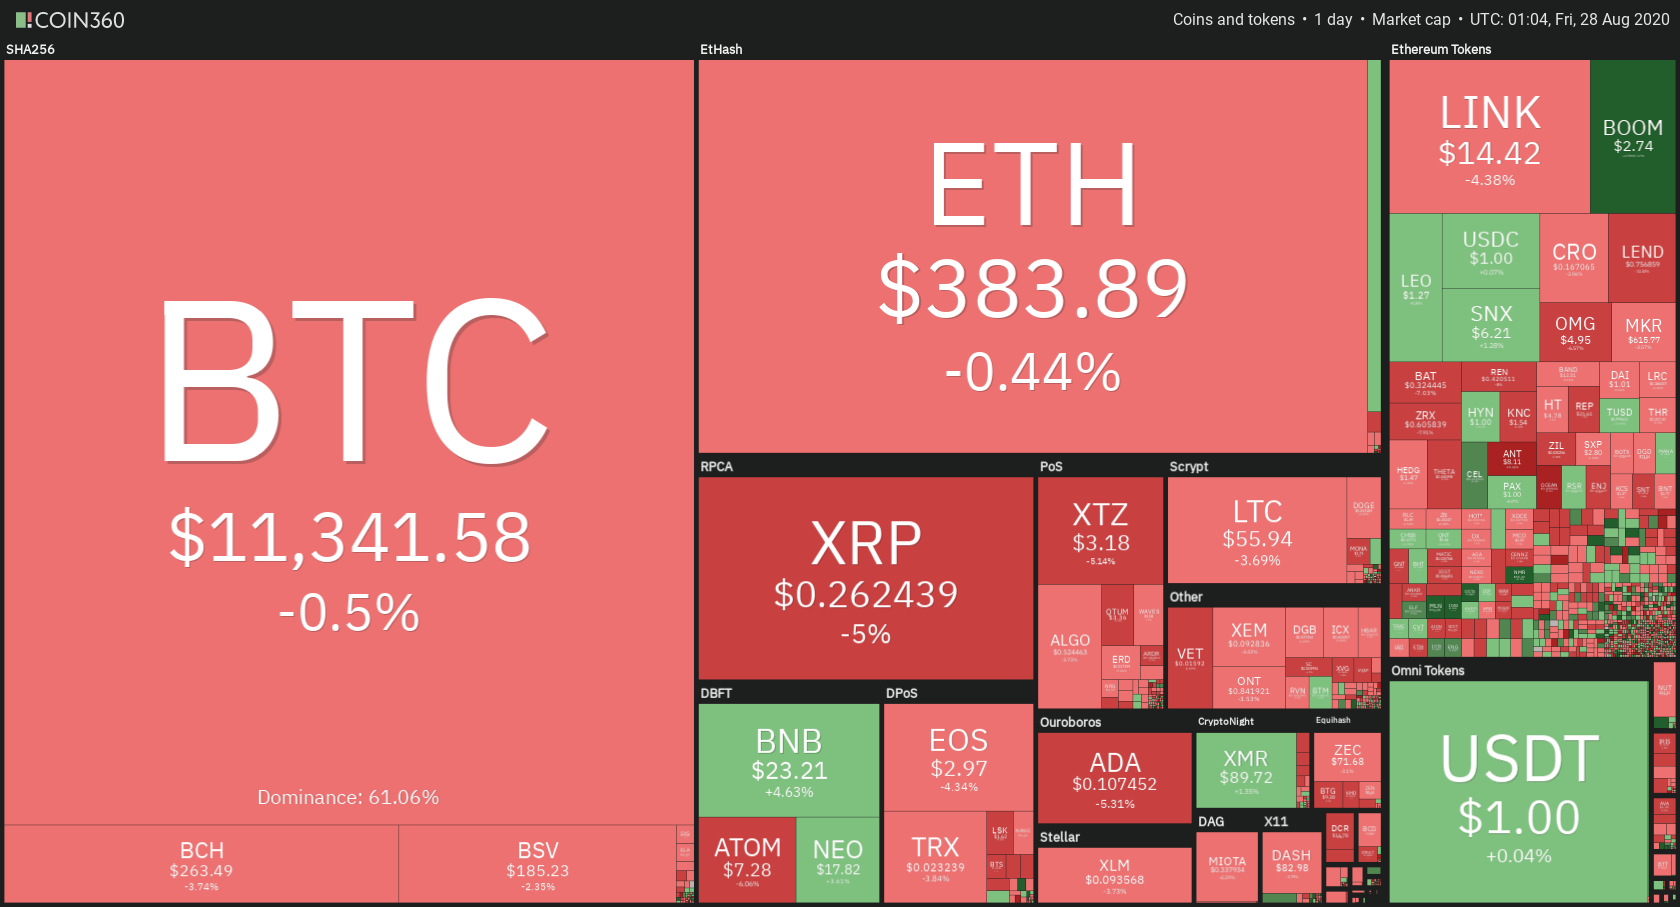
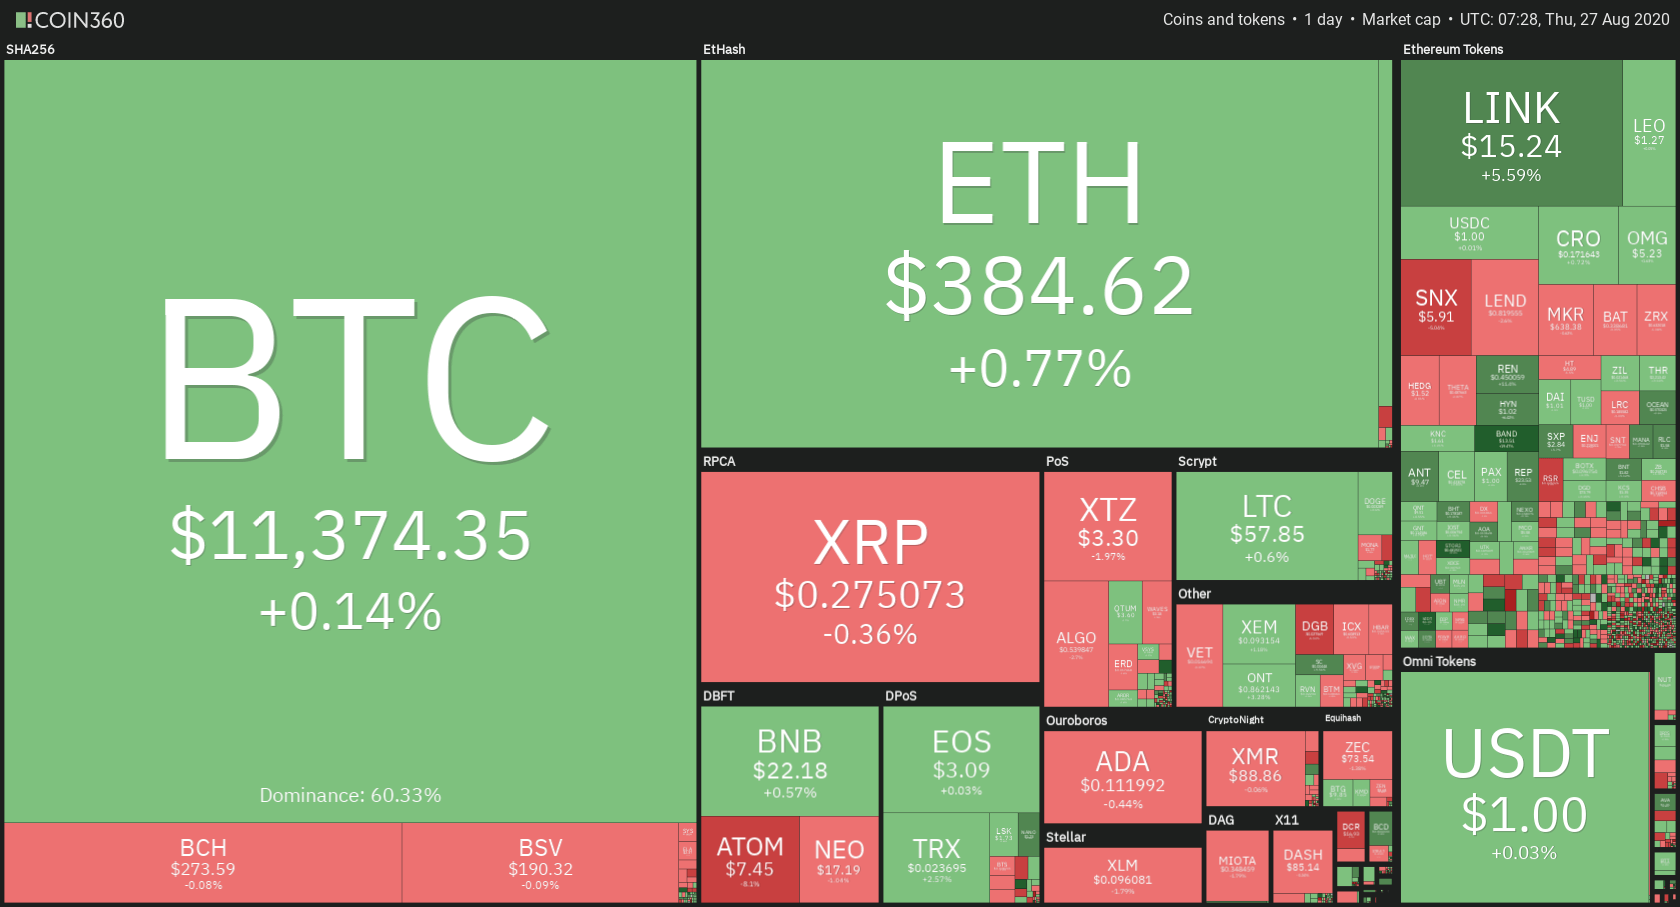
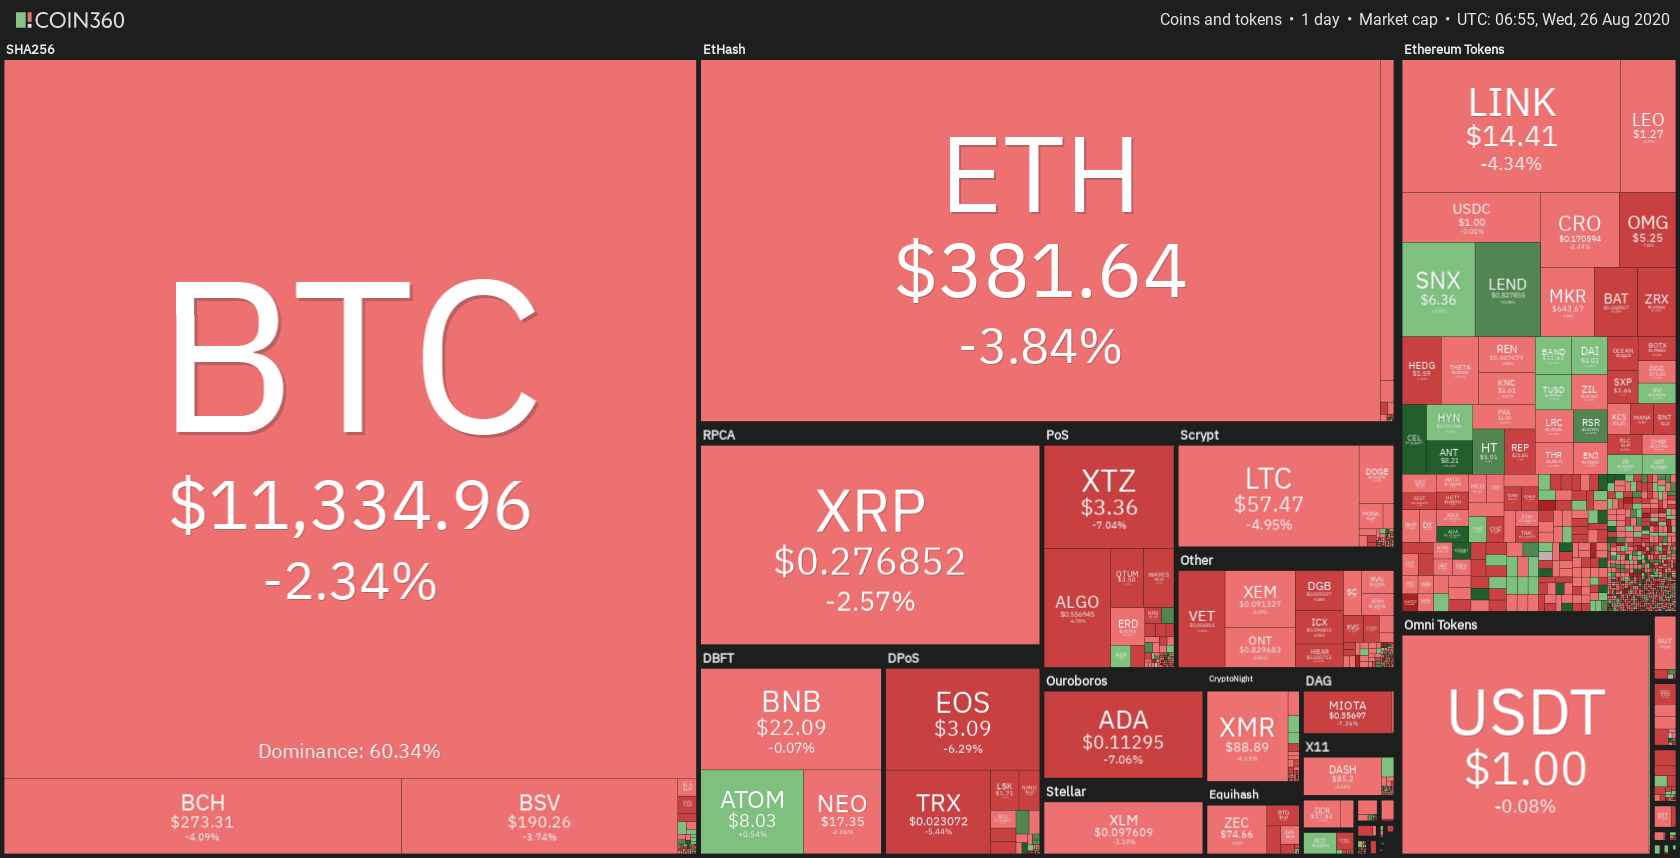
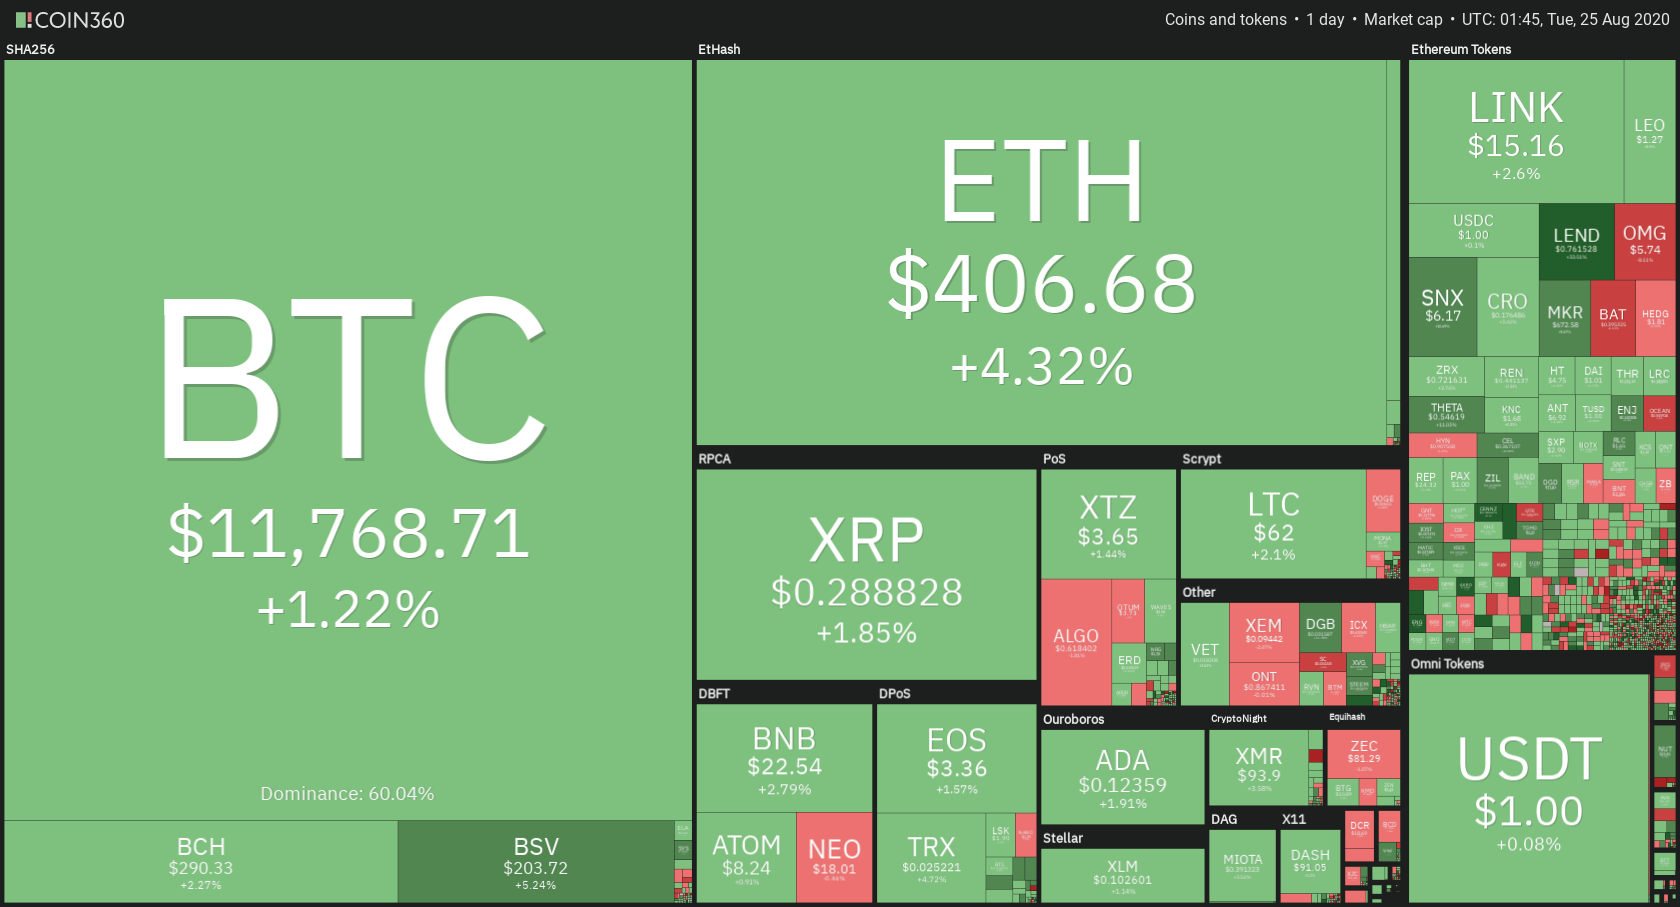
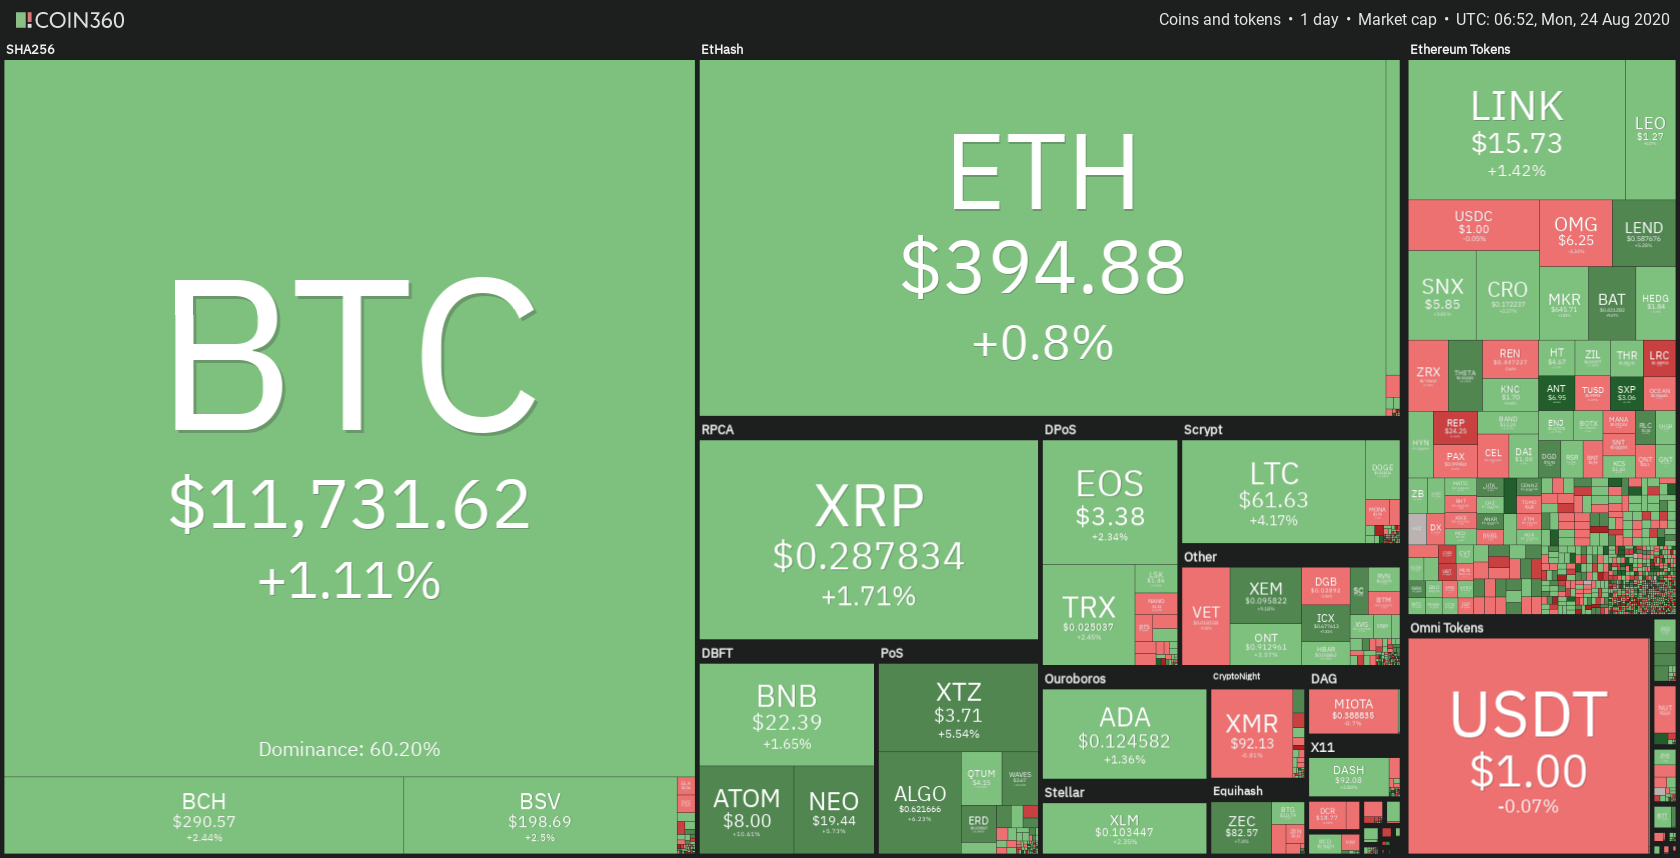
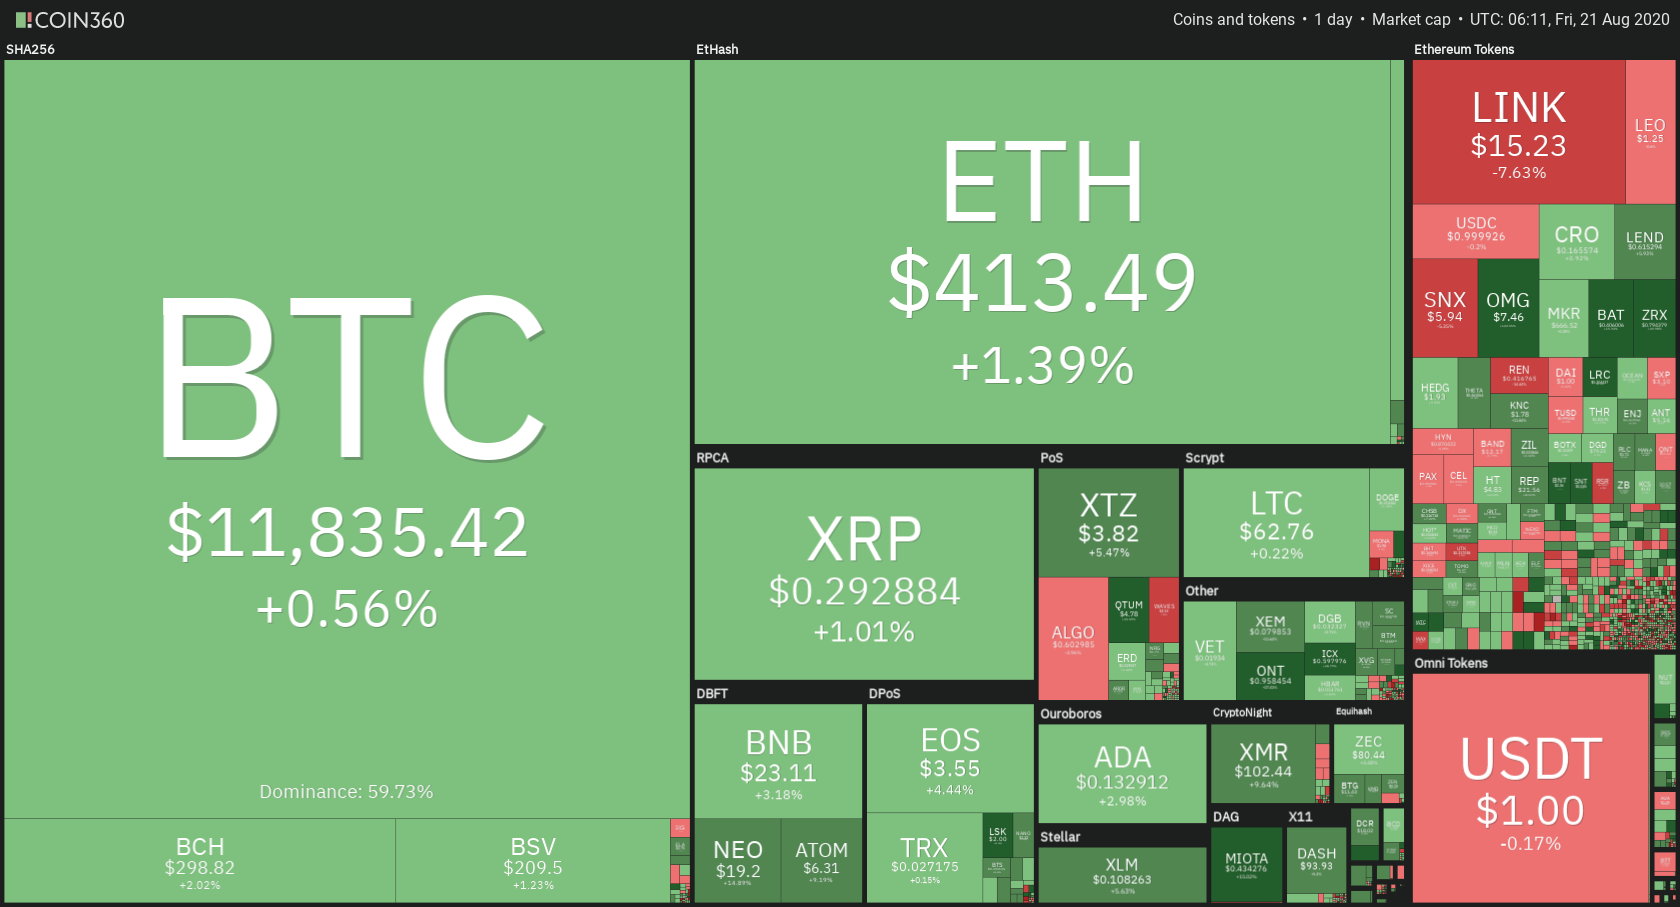
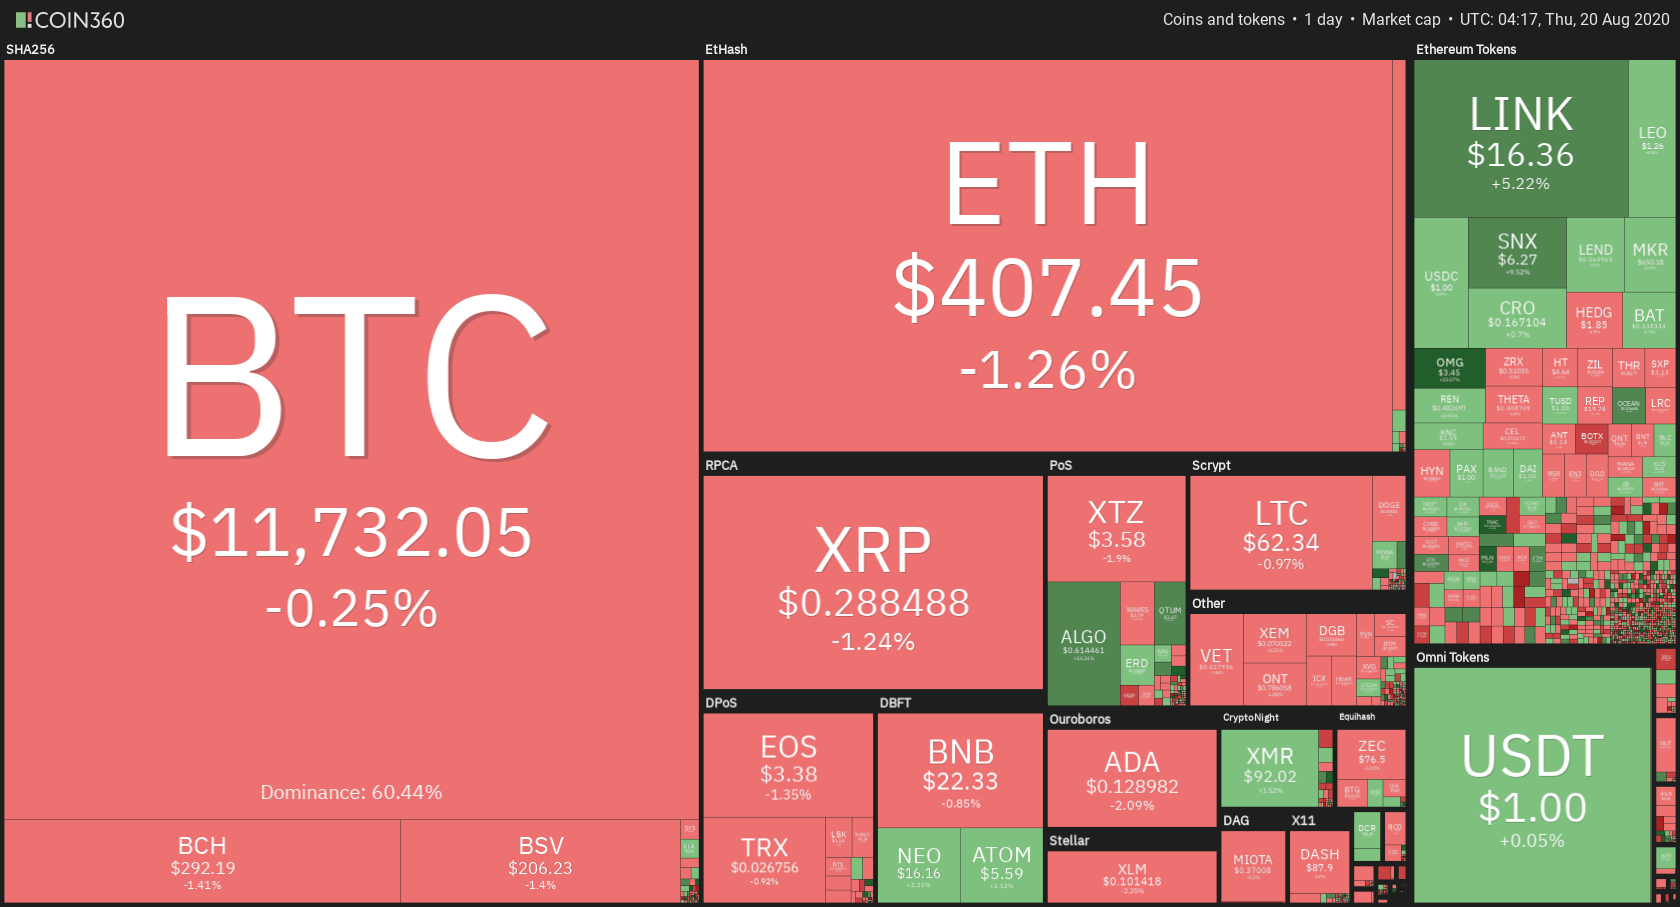
Daily Crypto Sector Heat Map
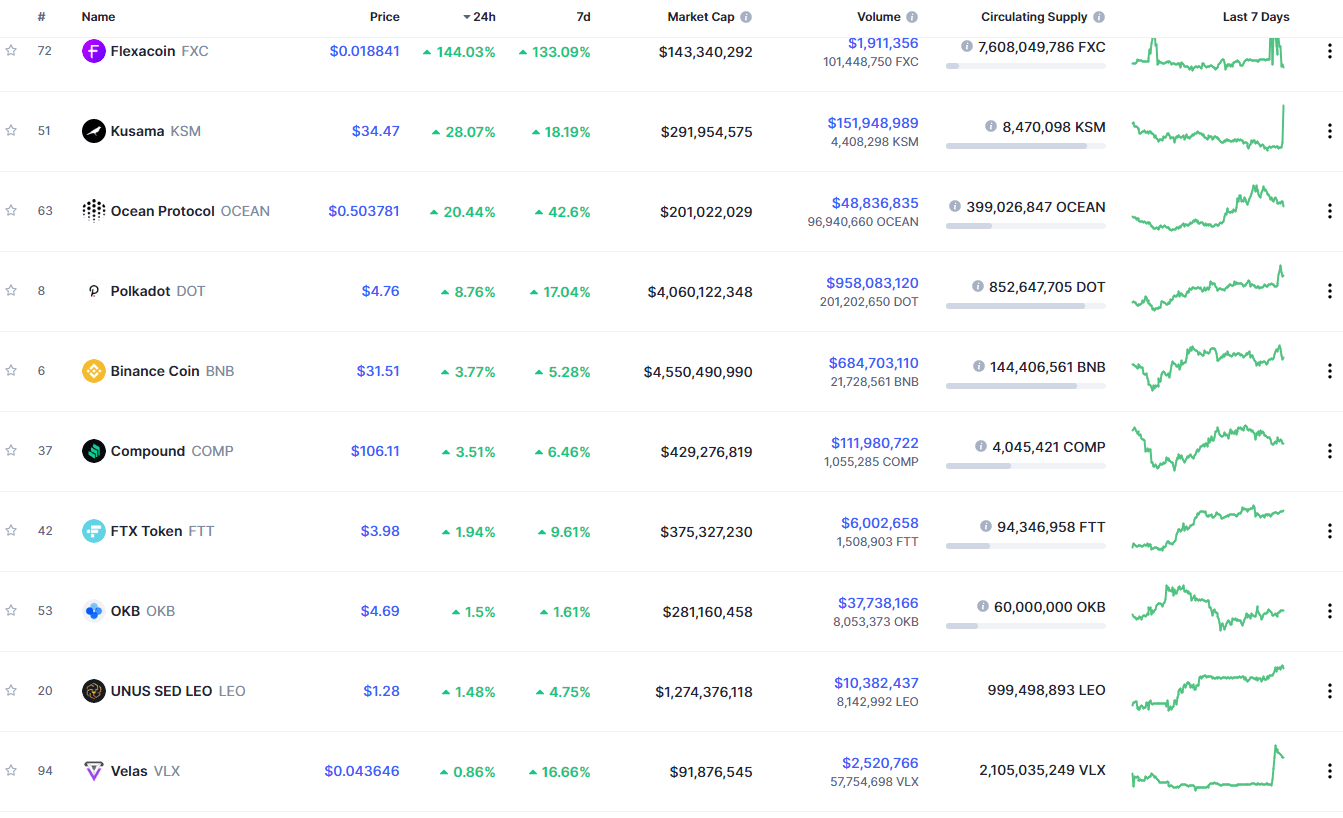
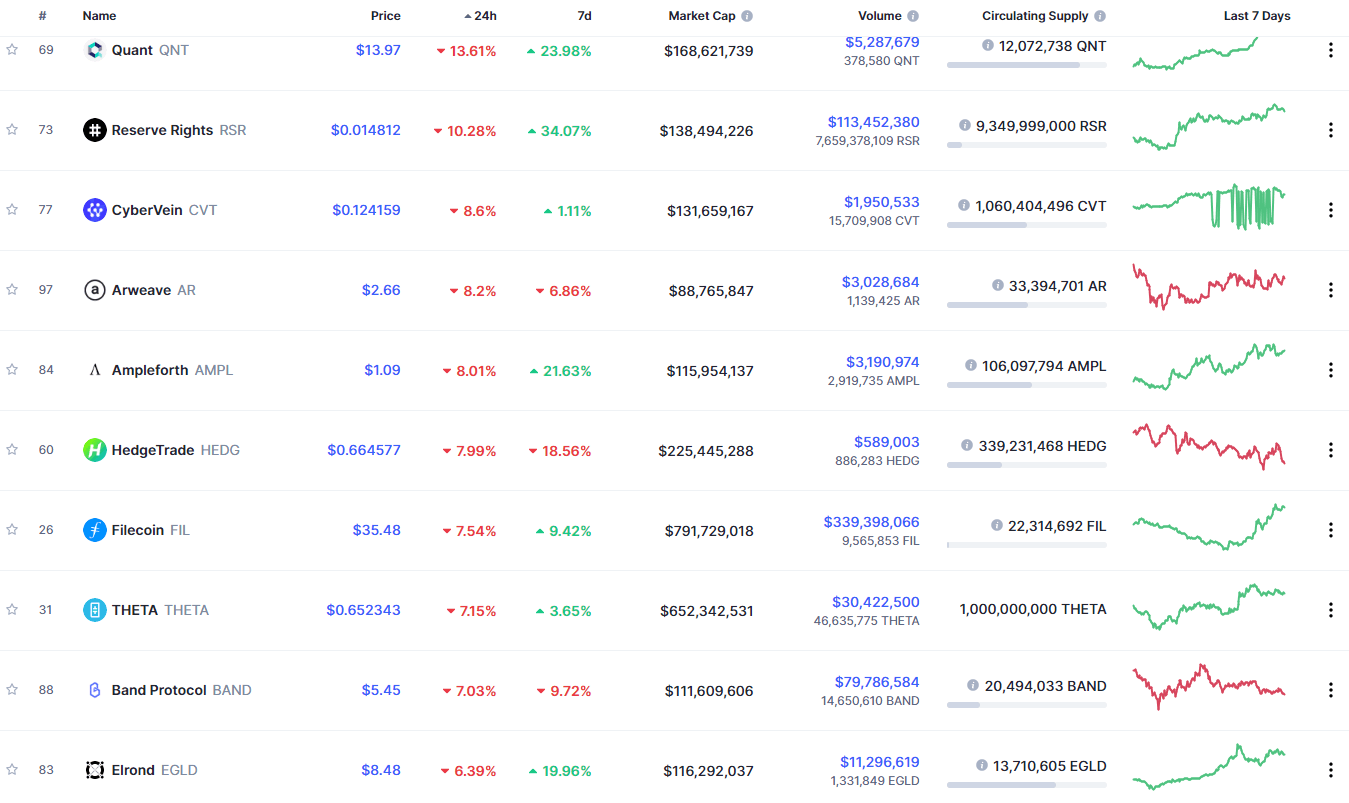
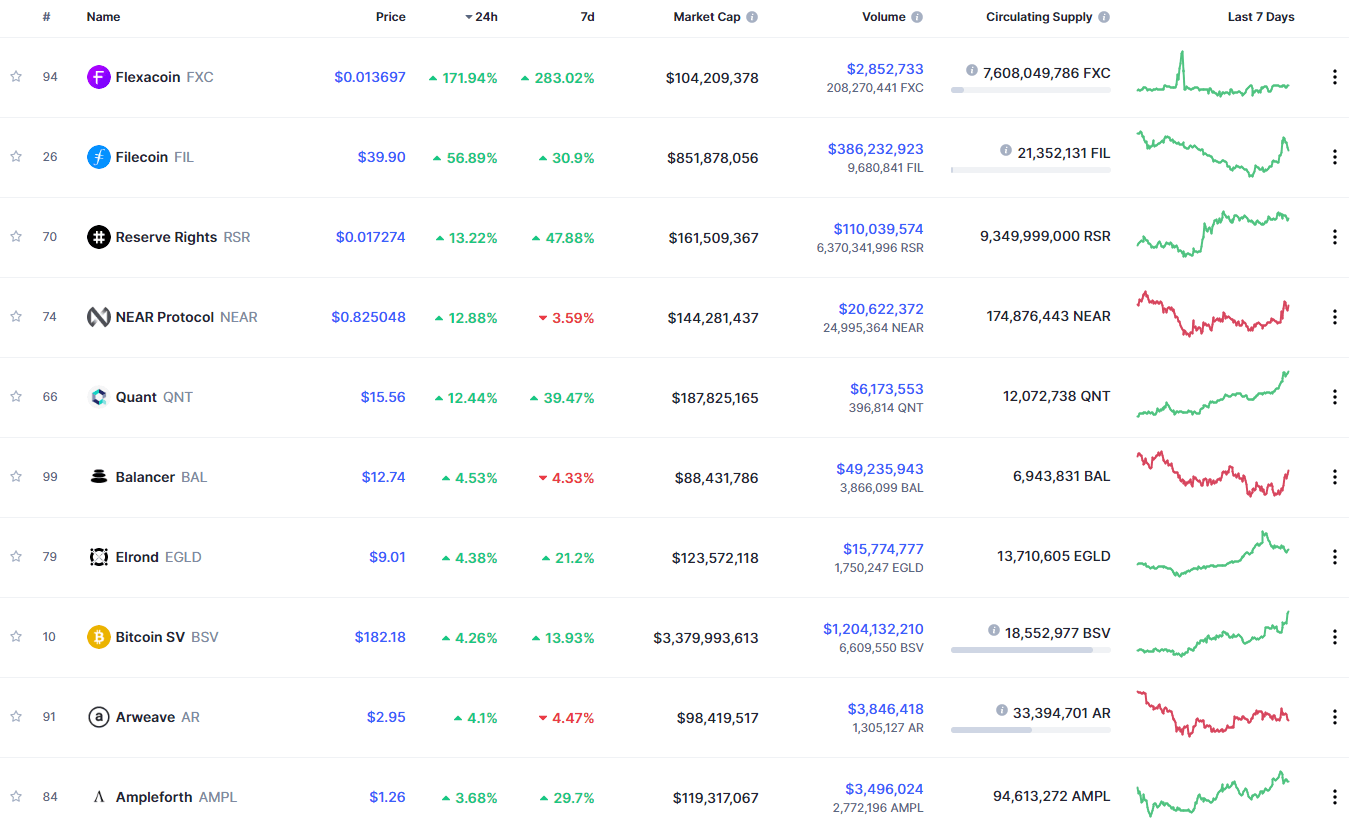
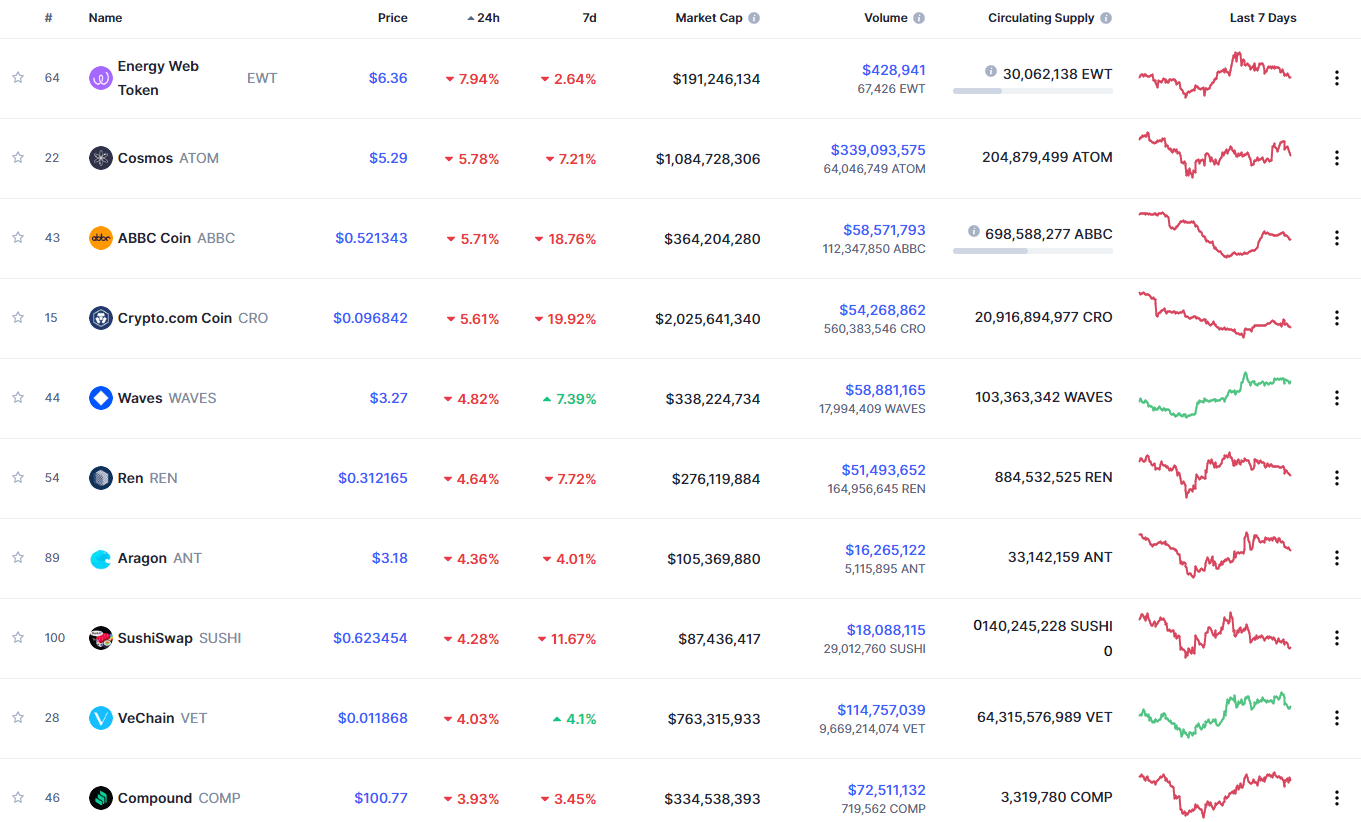
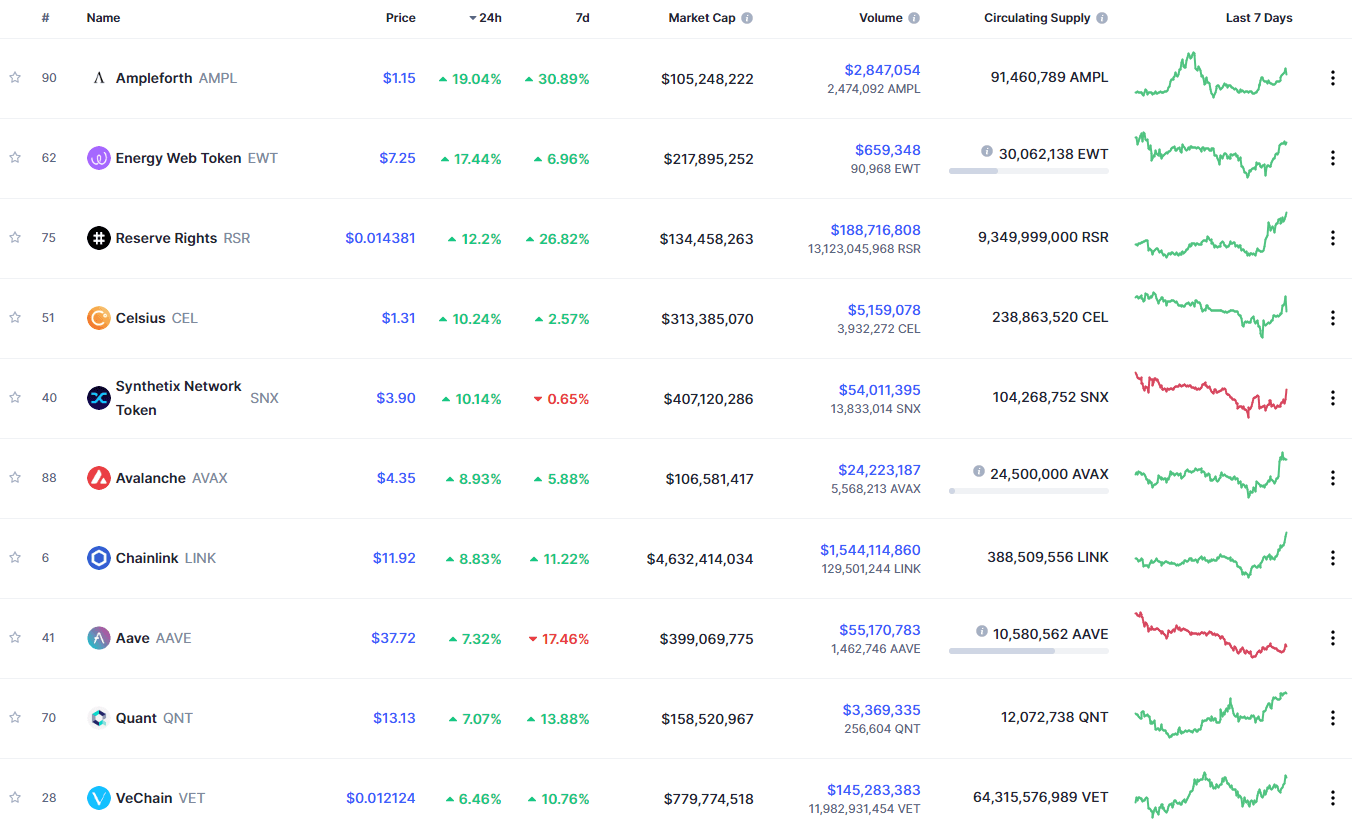
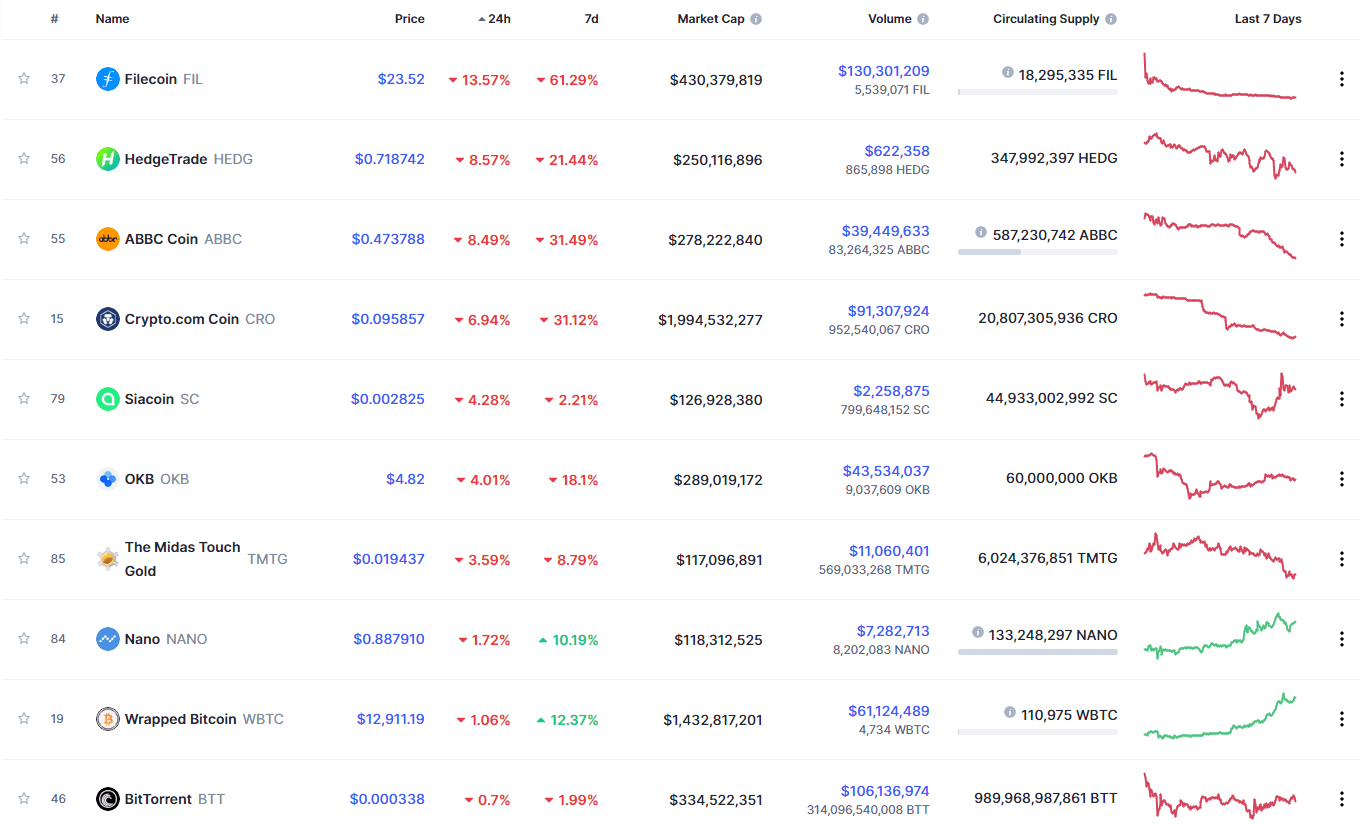
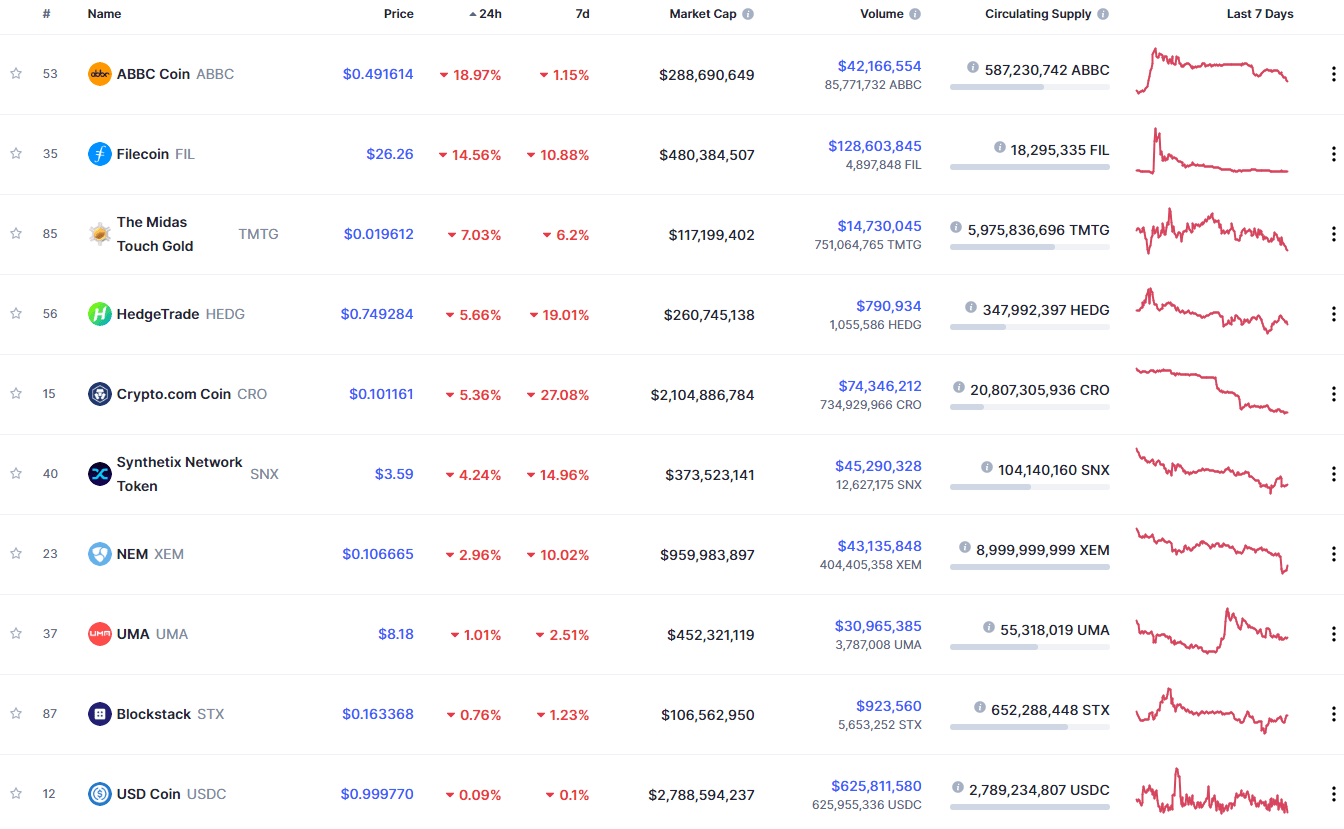
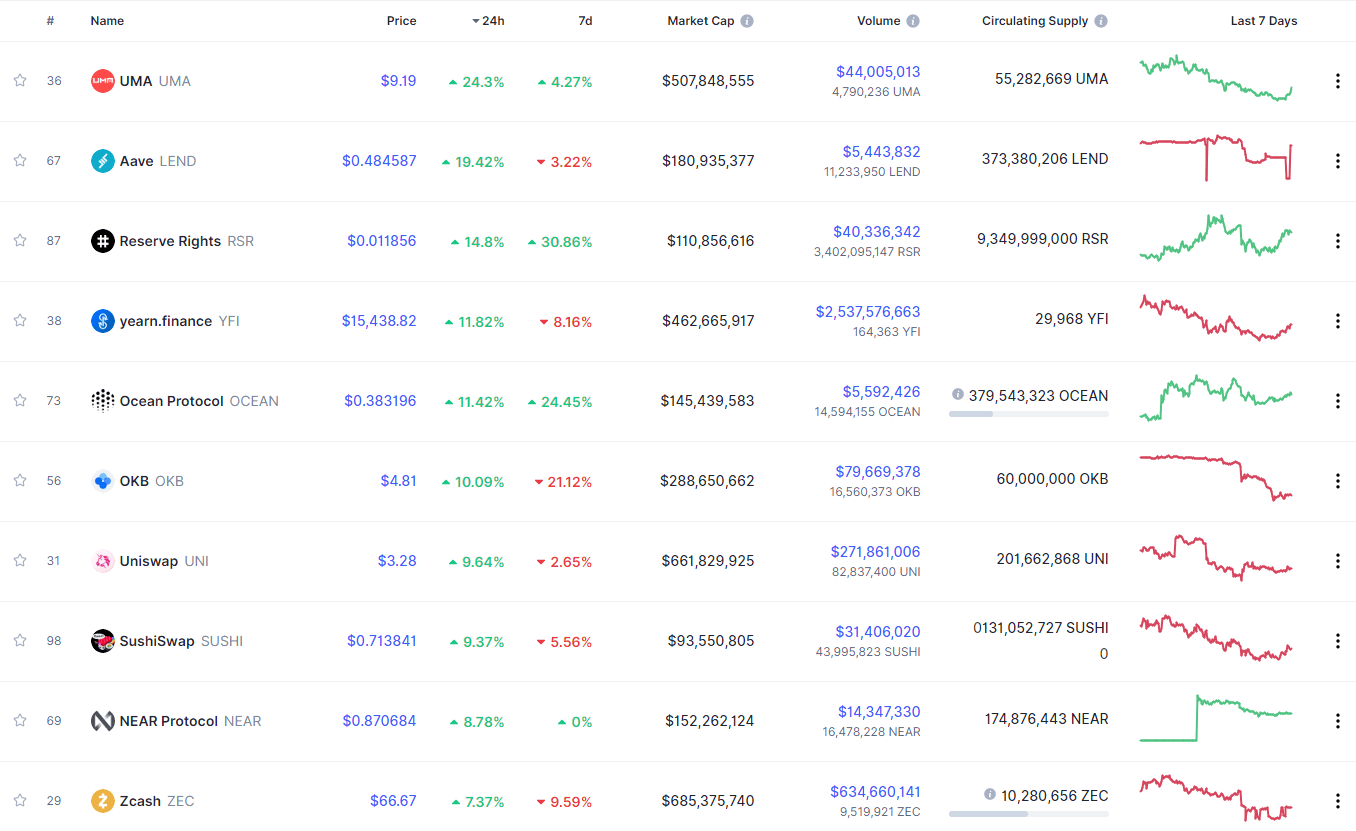
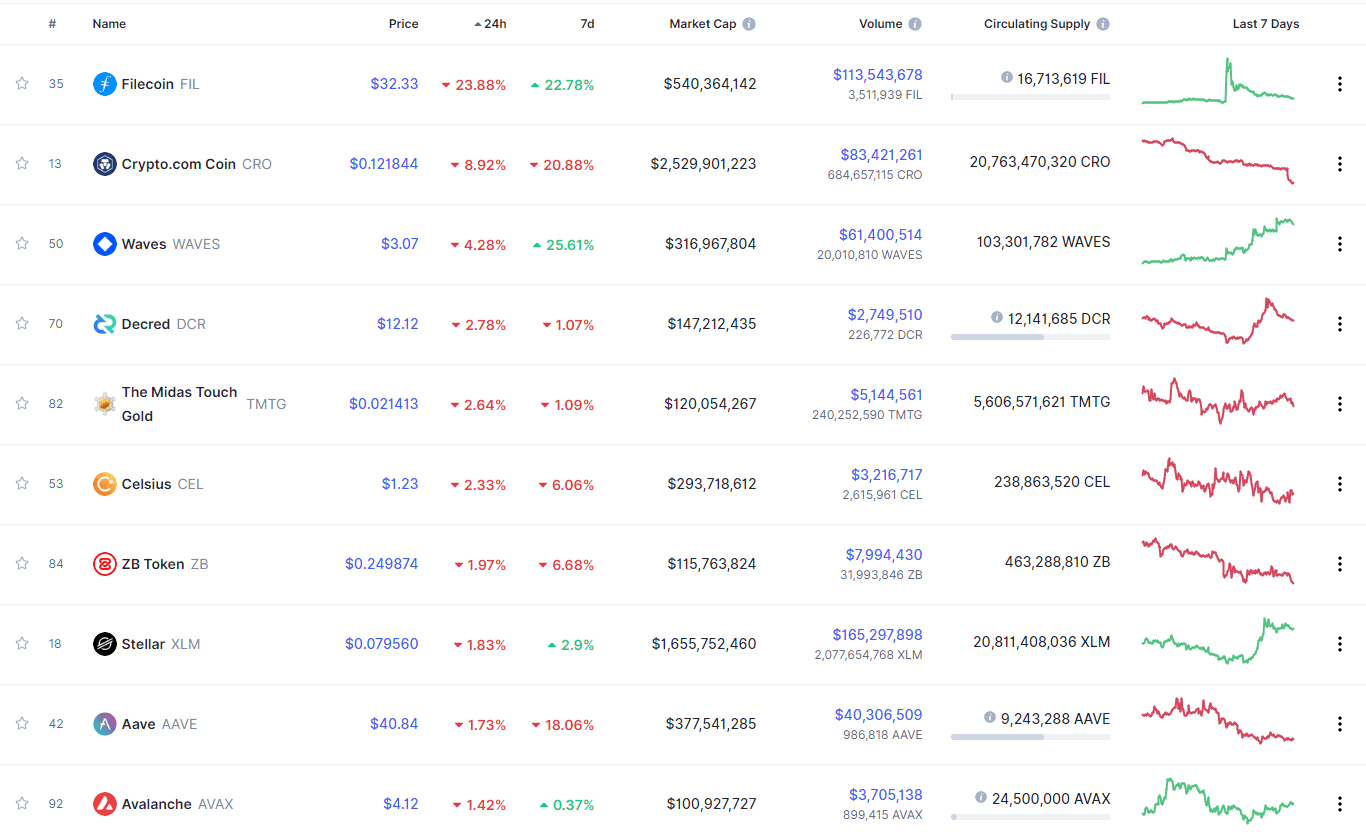
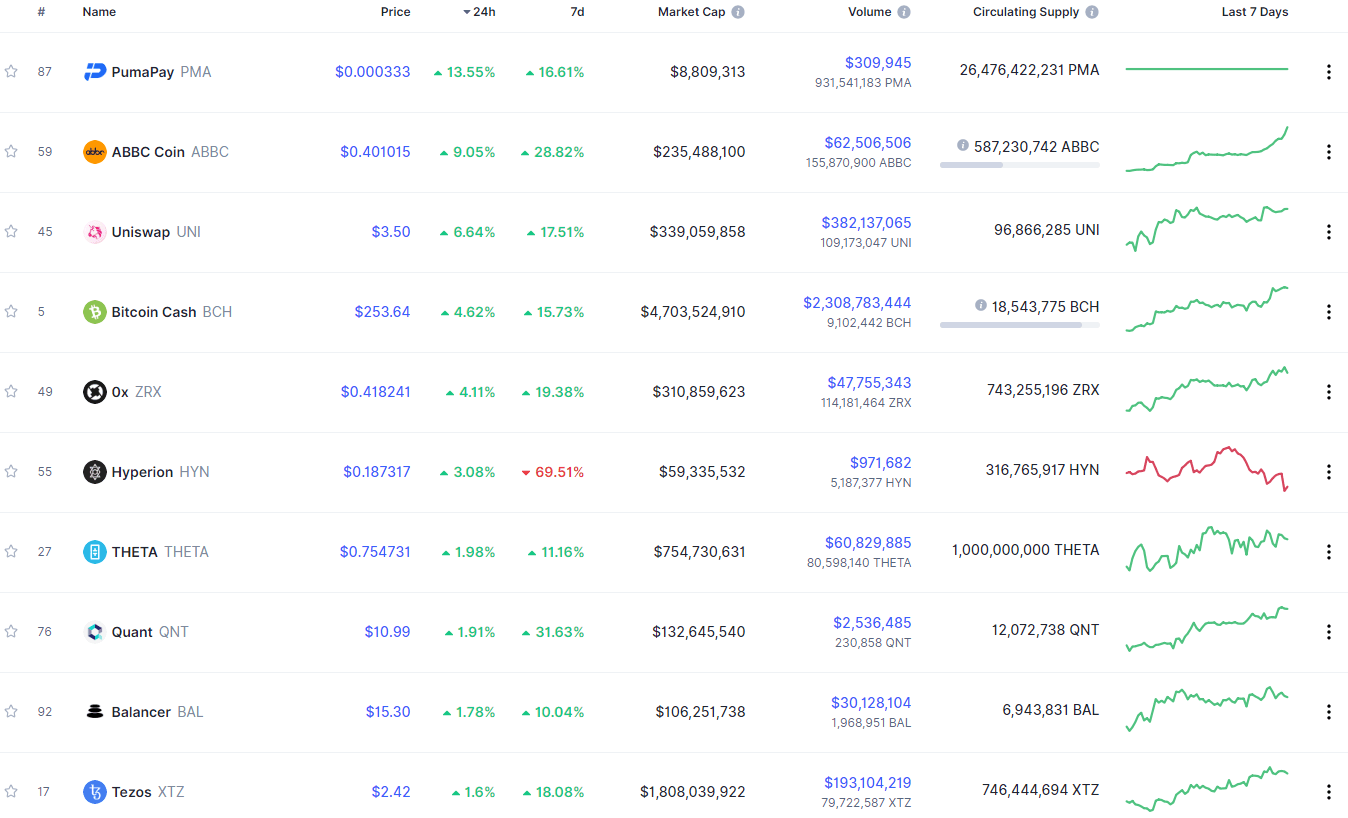
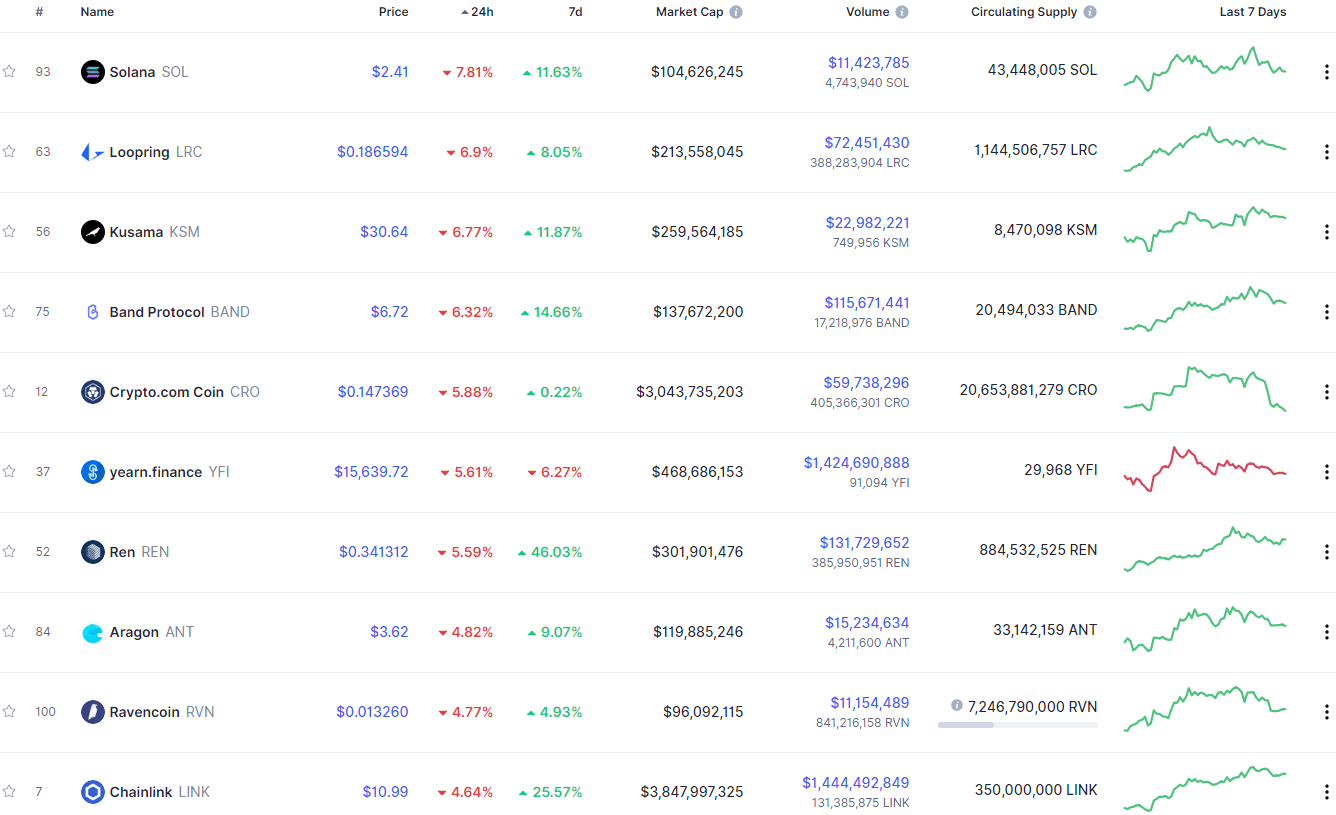
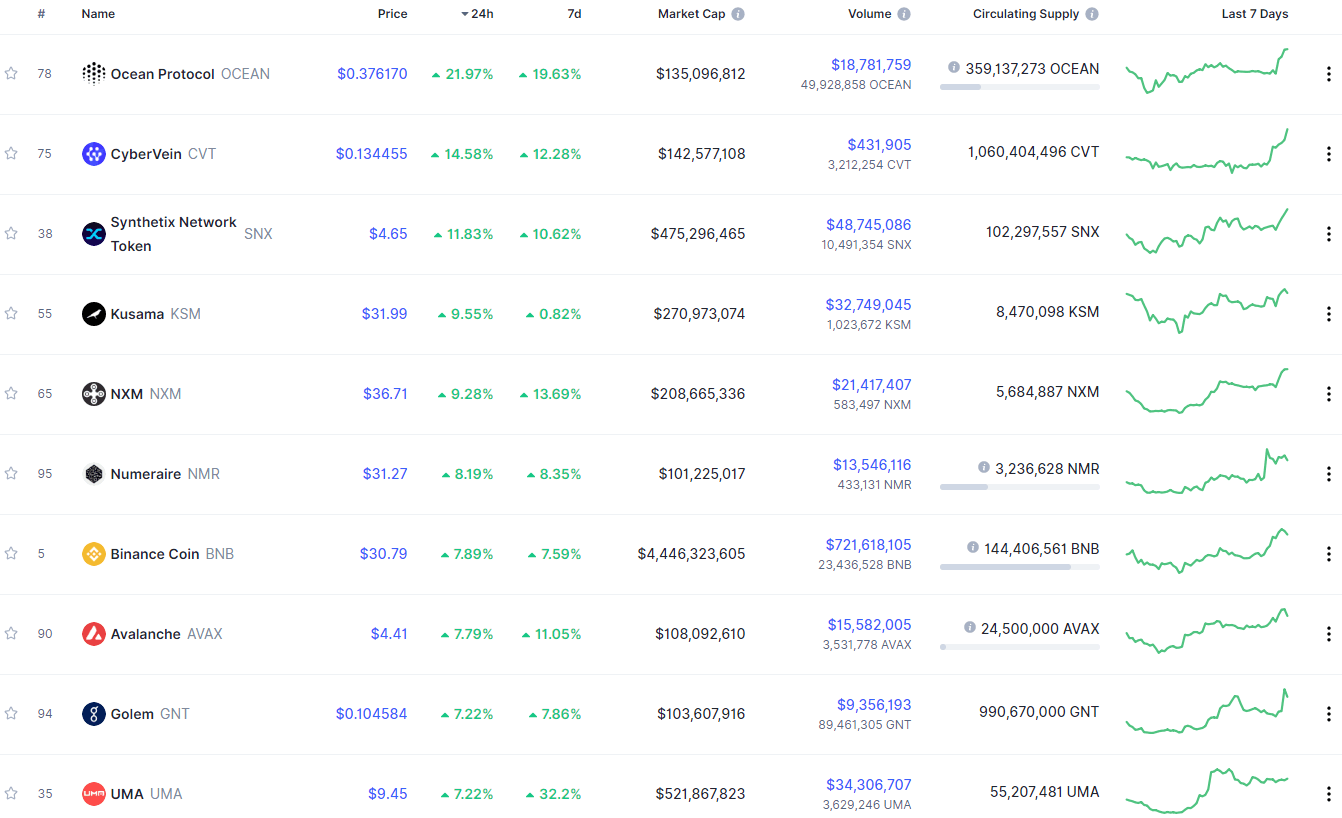
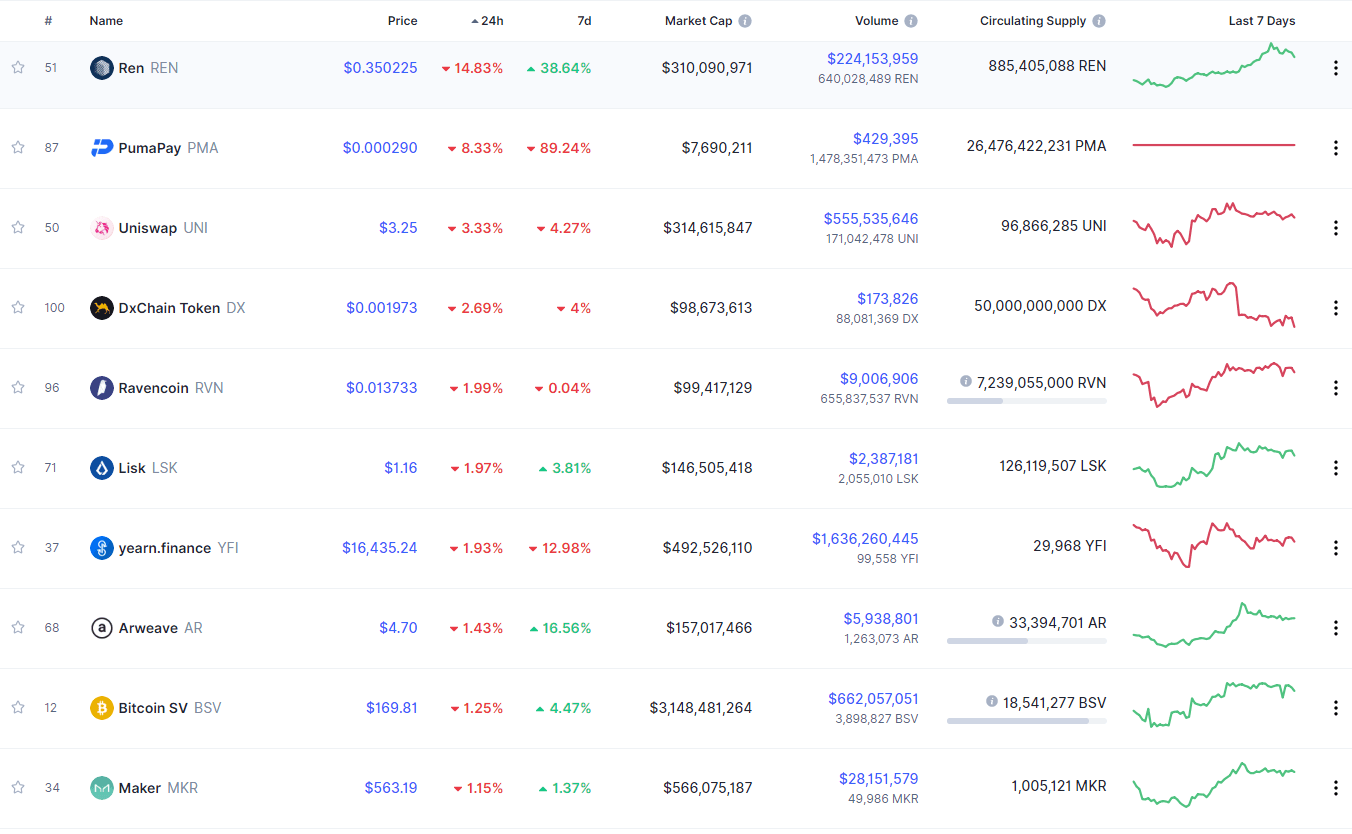
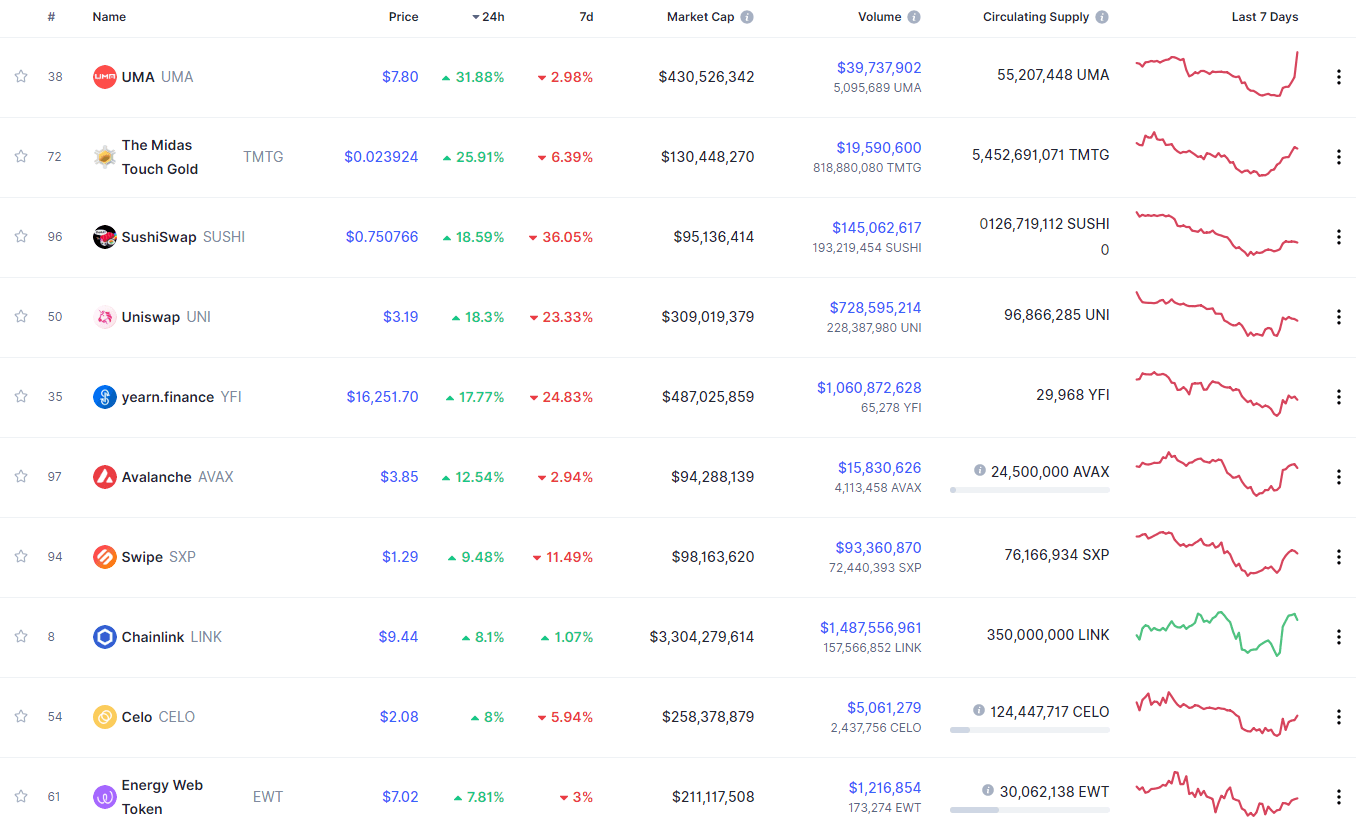
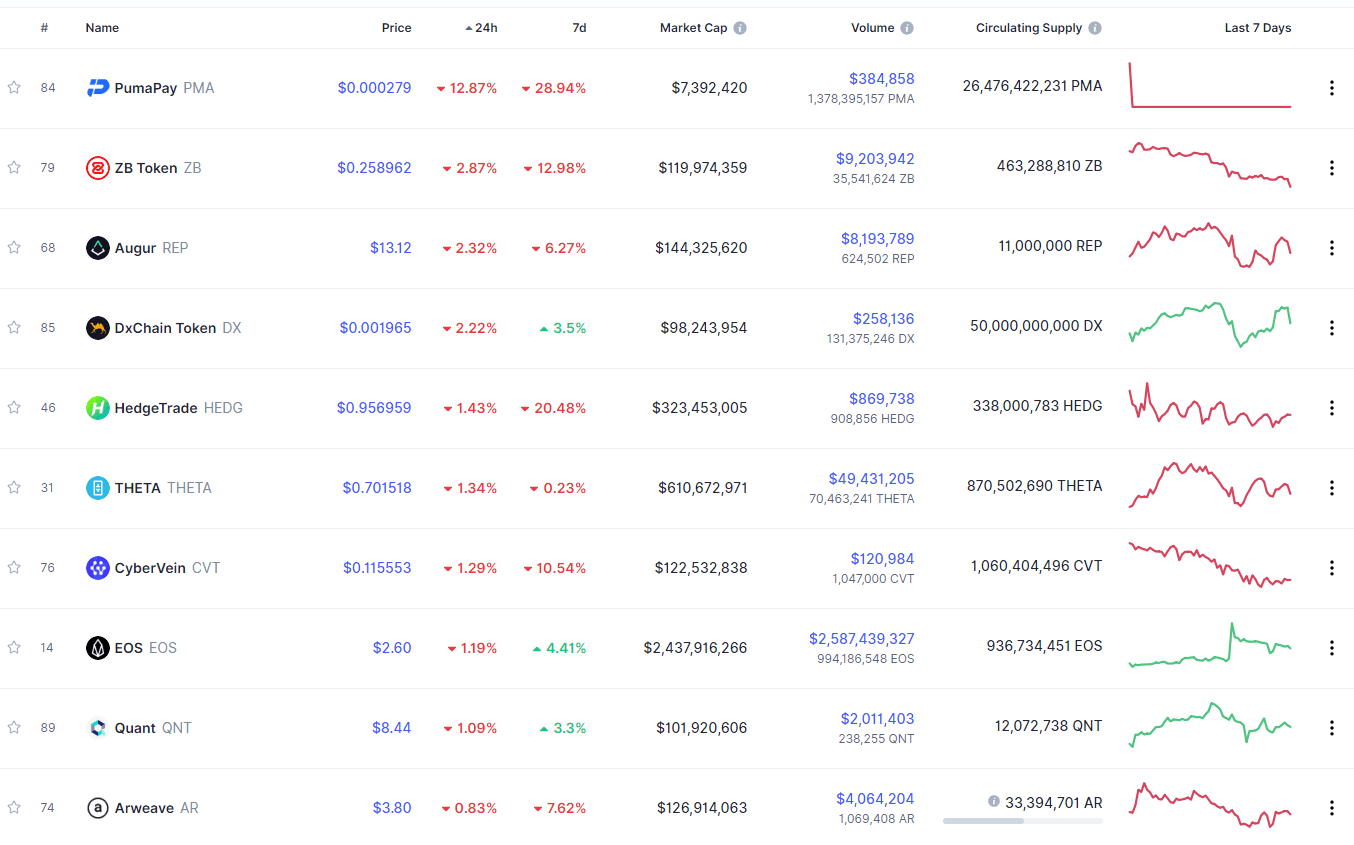
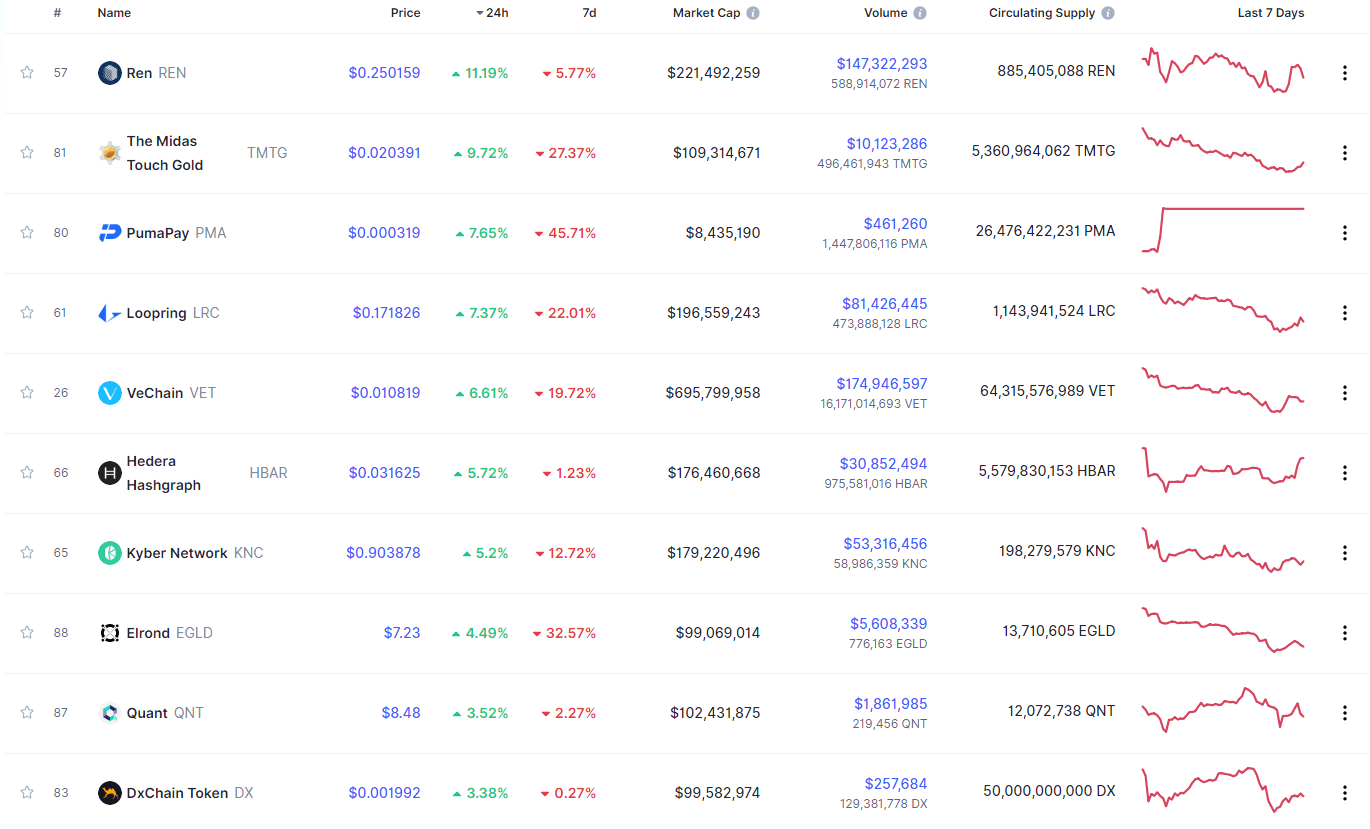
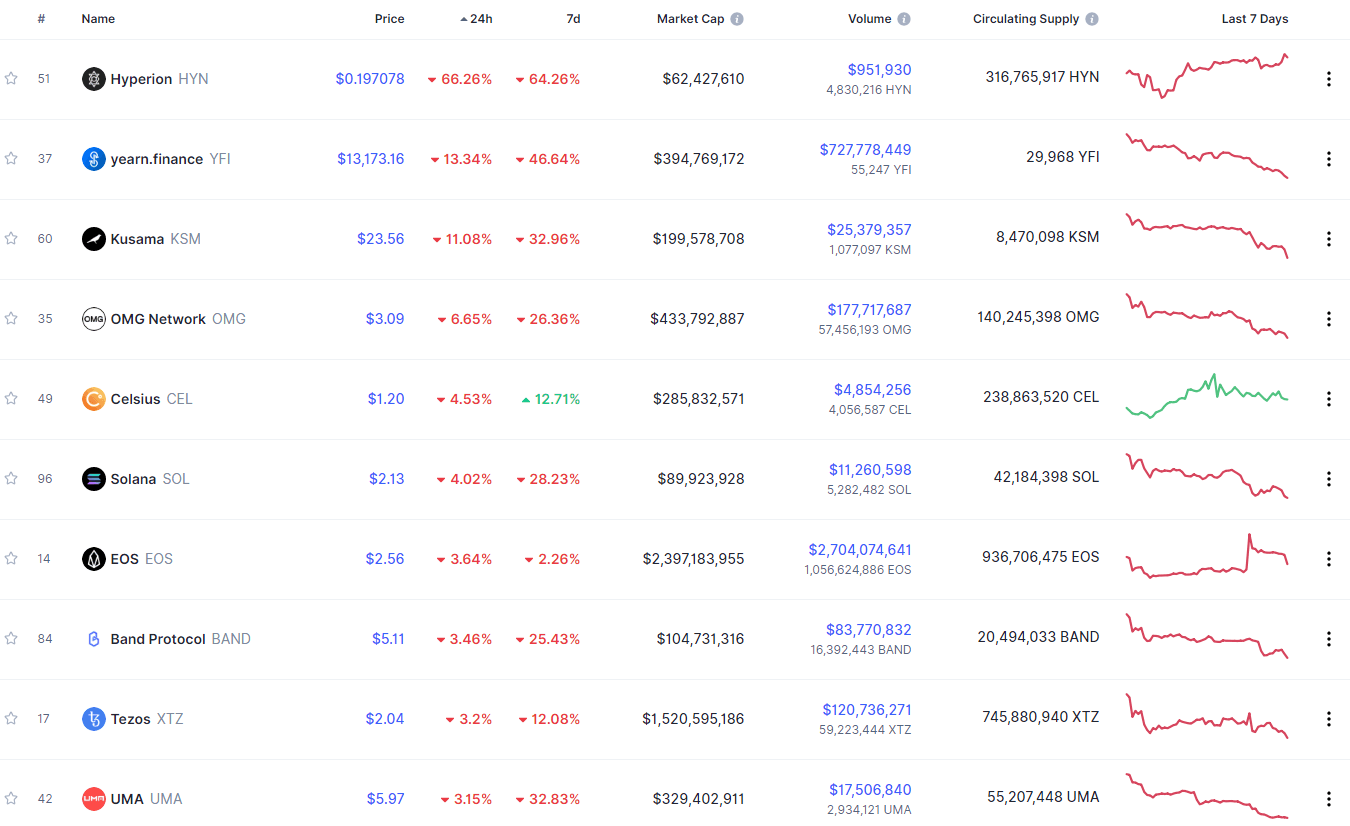
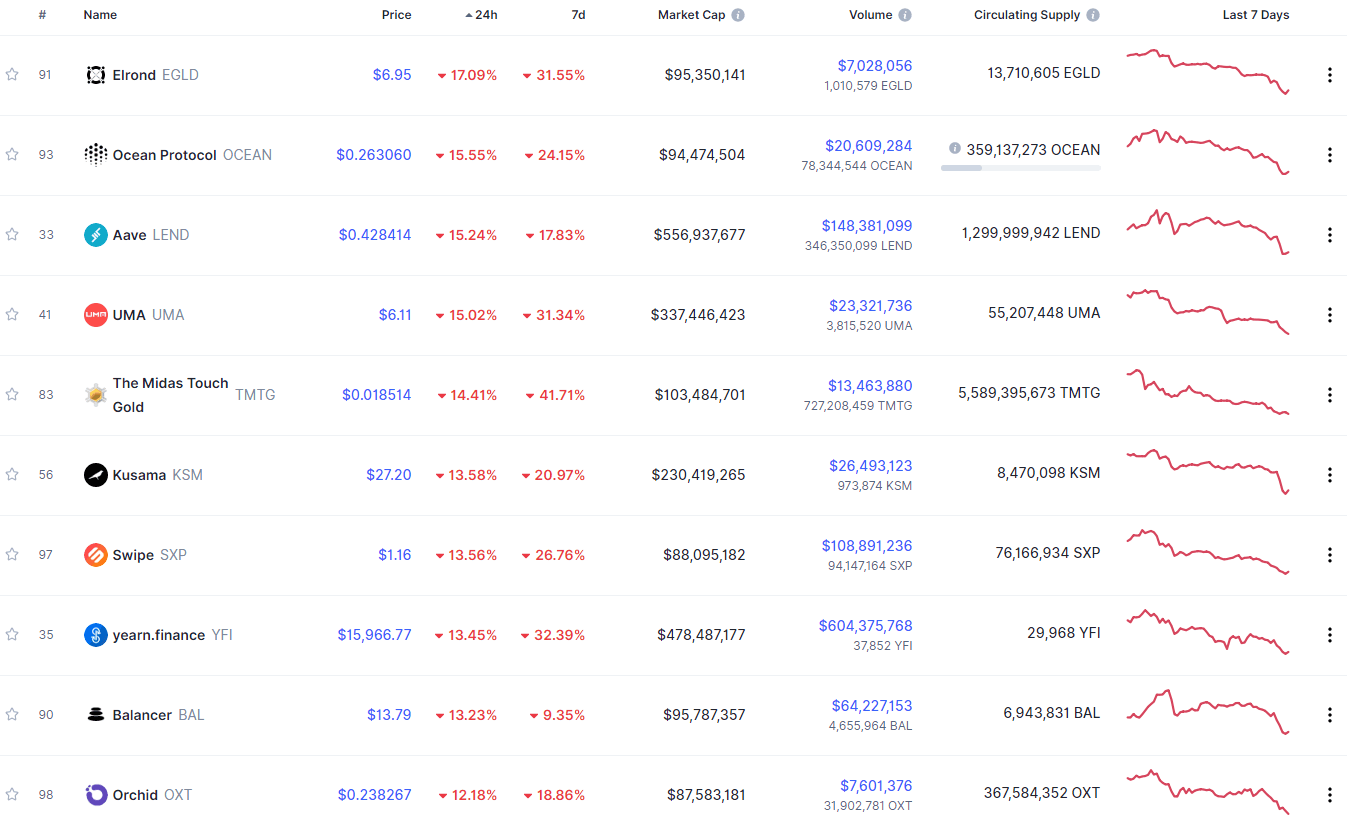
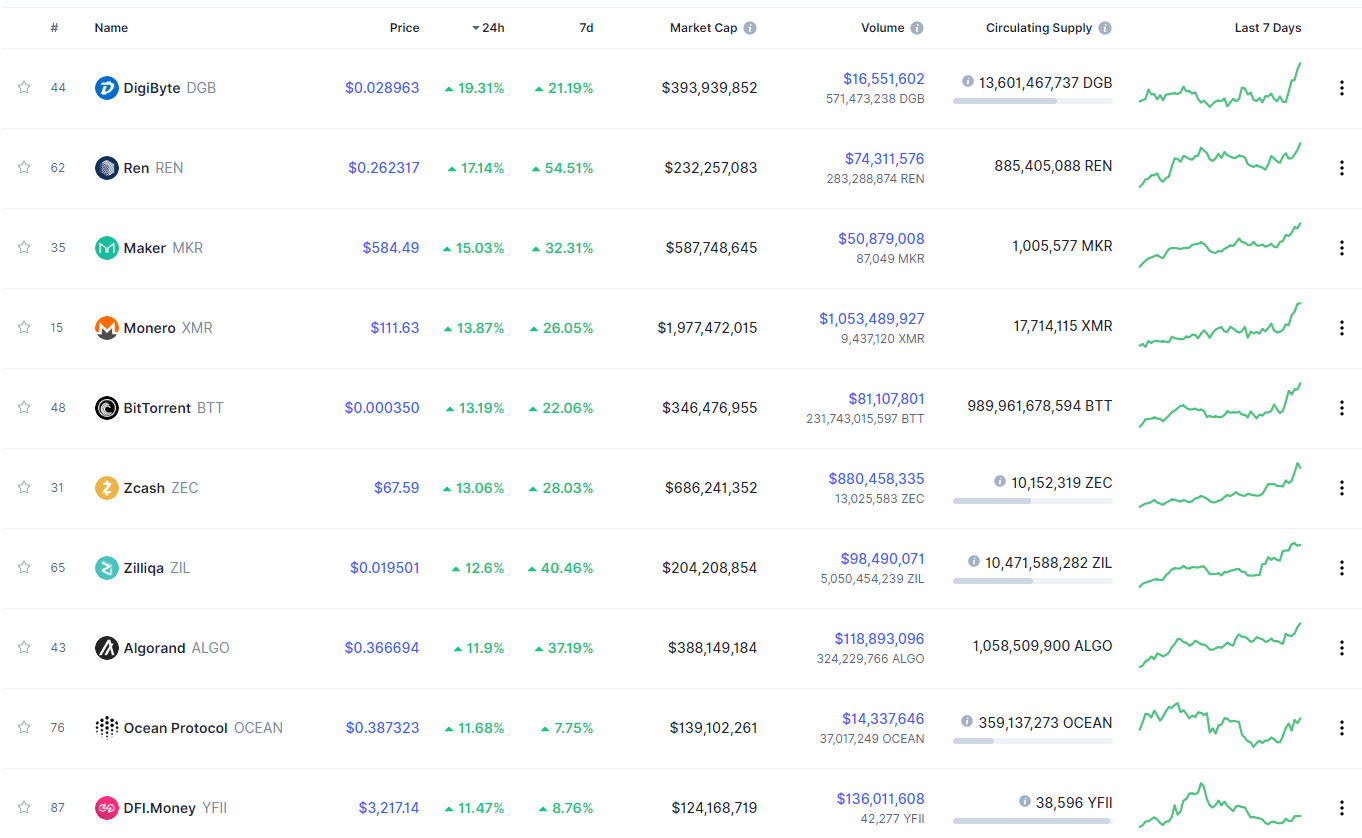
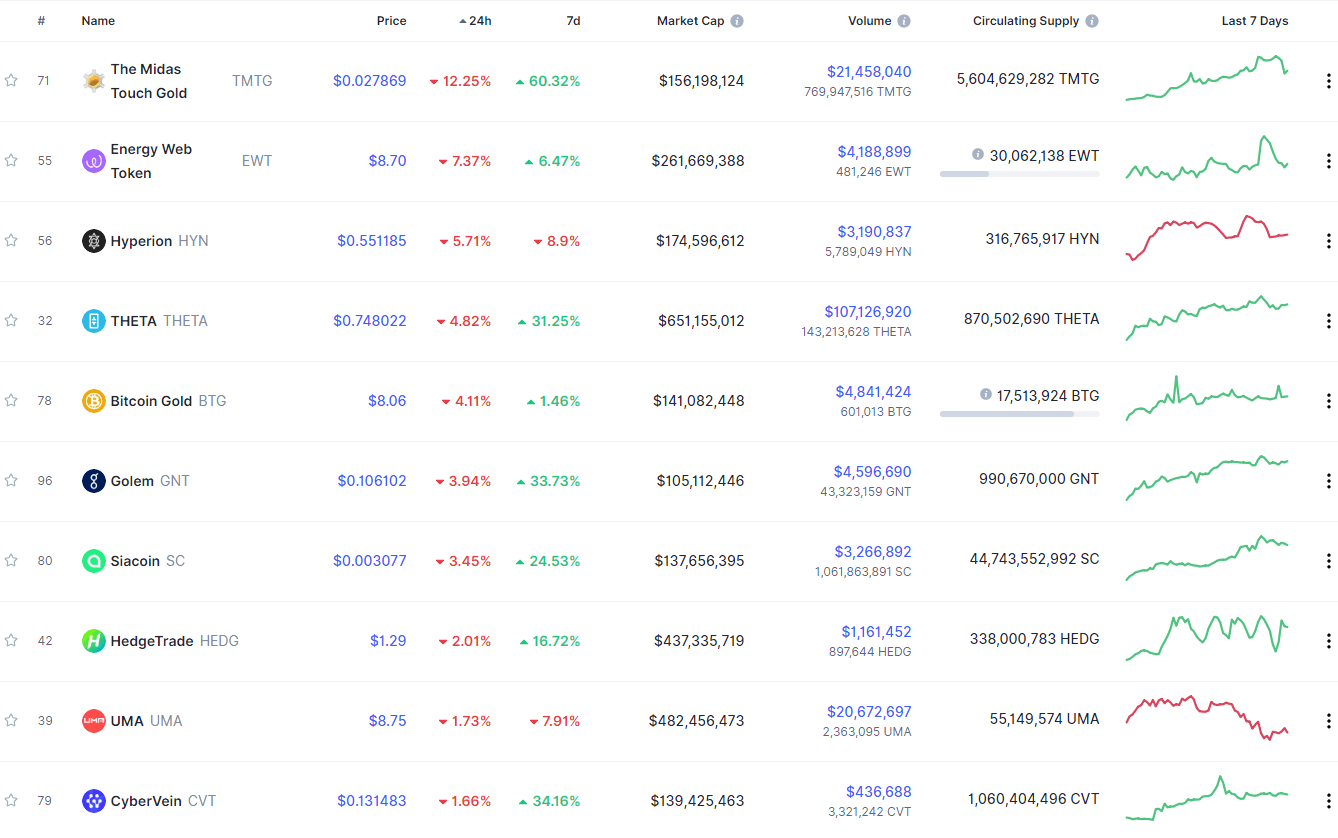
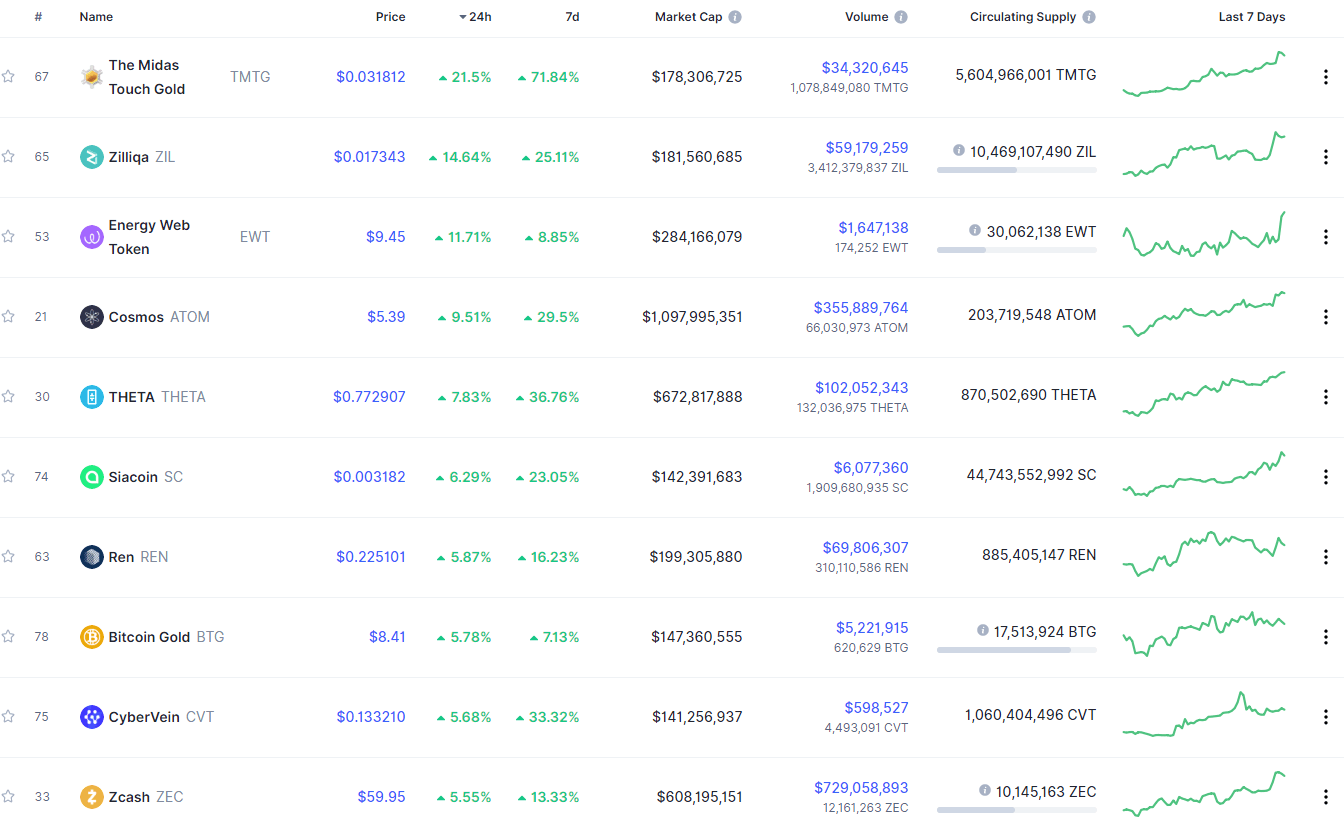
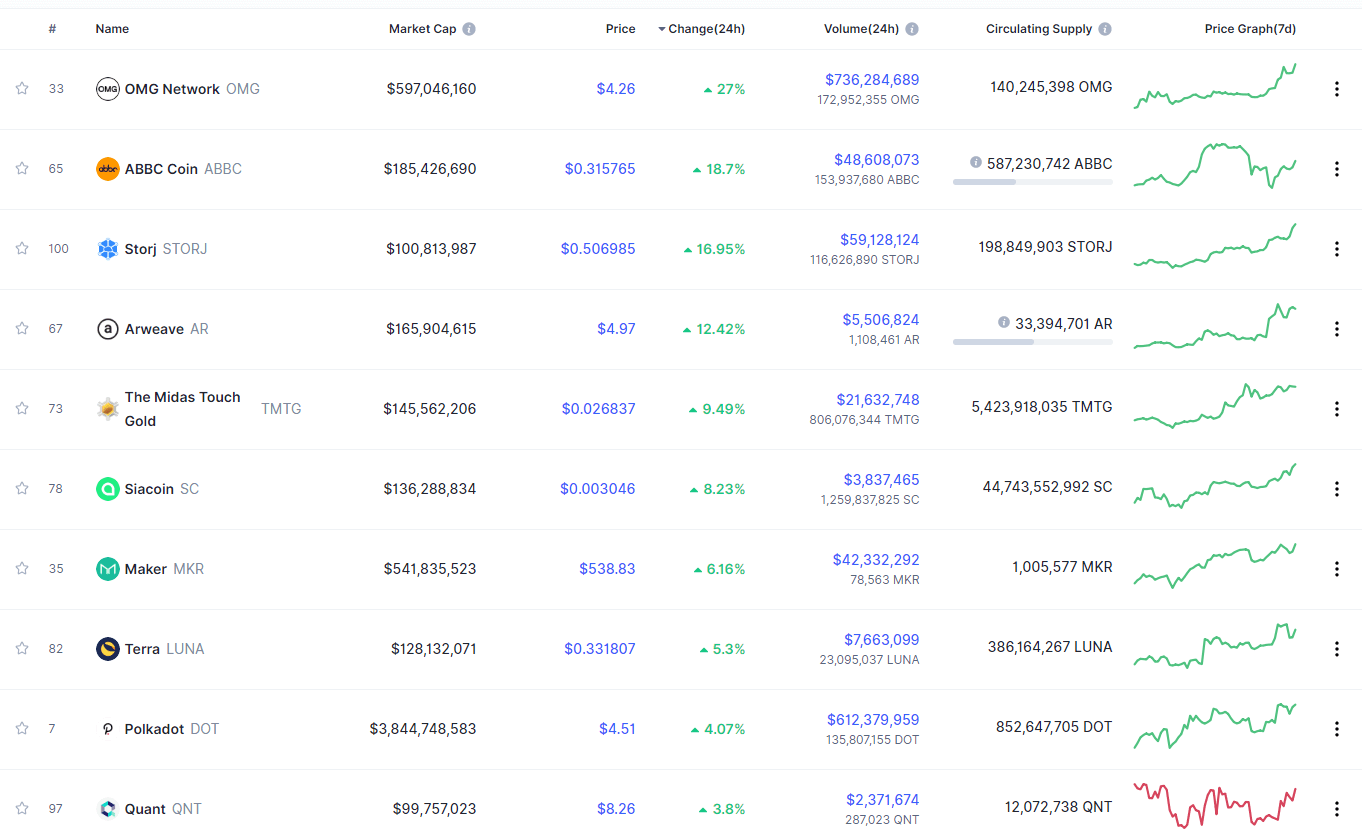
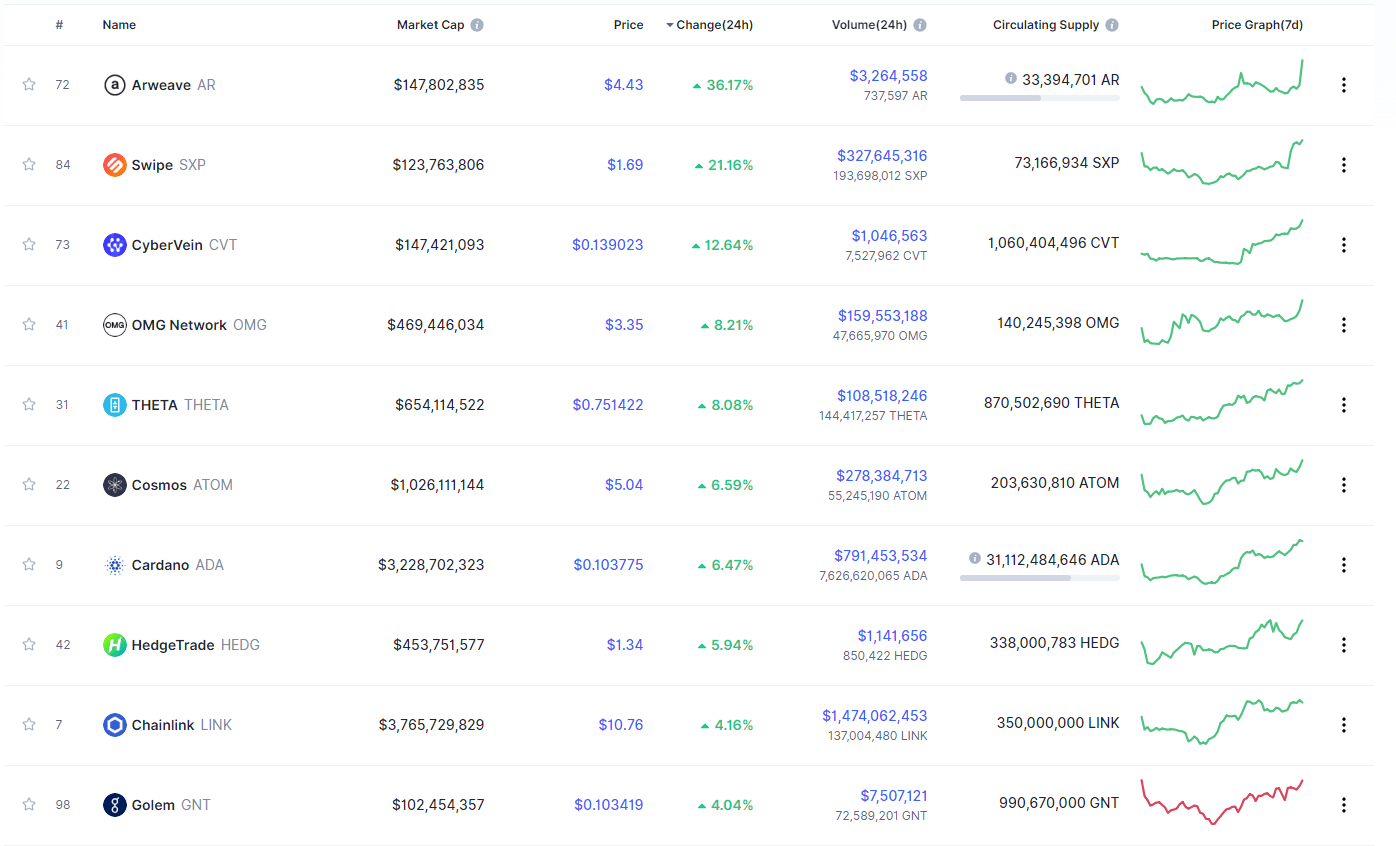
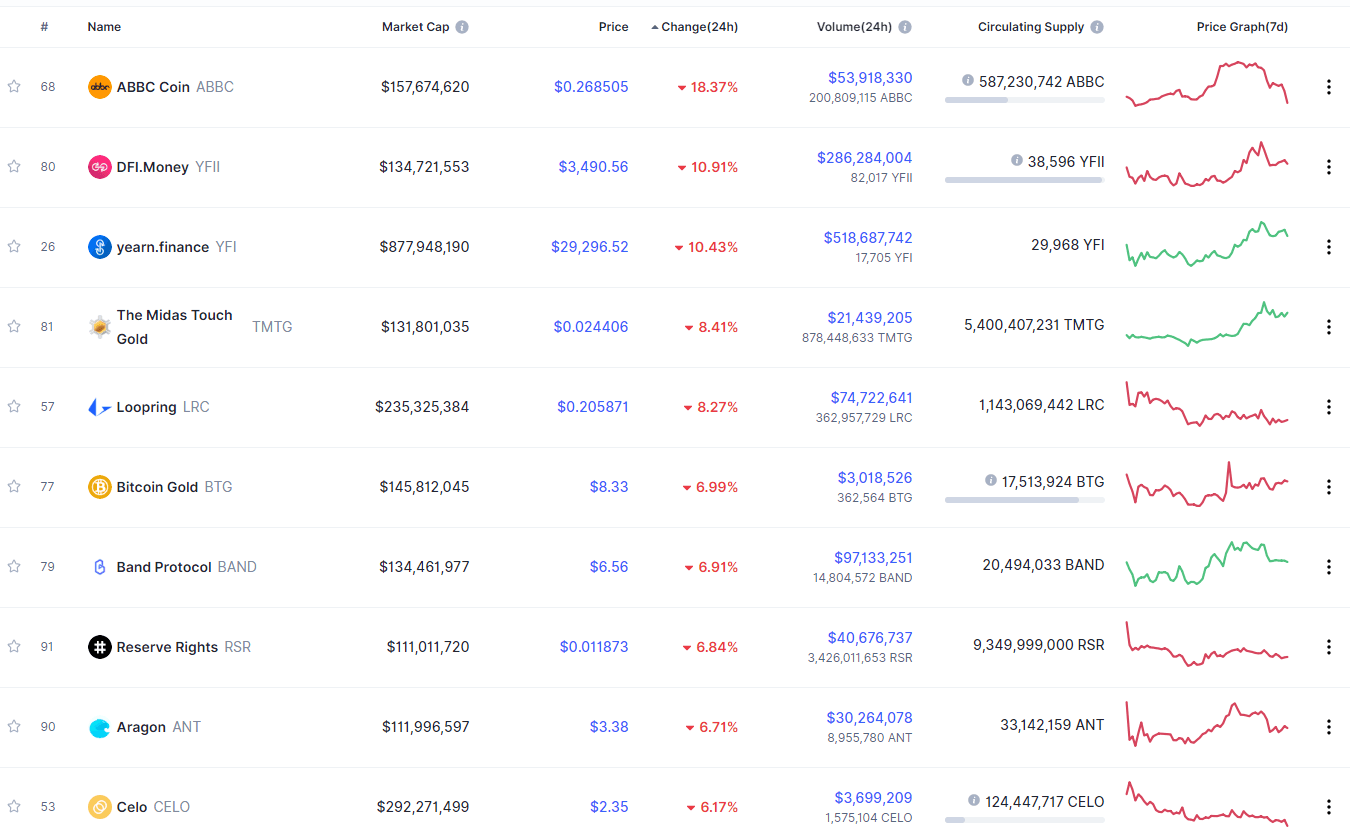
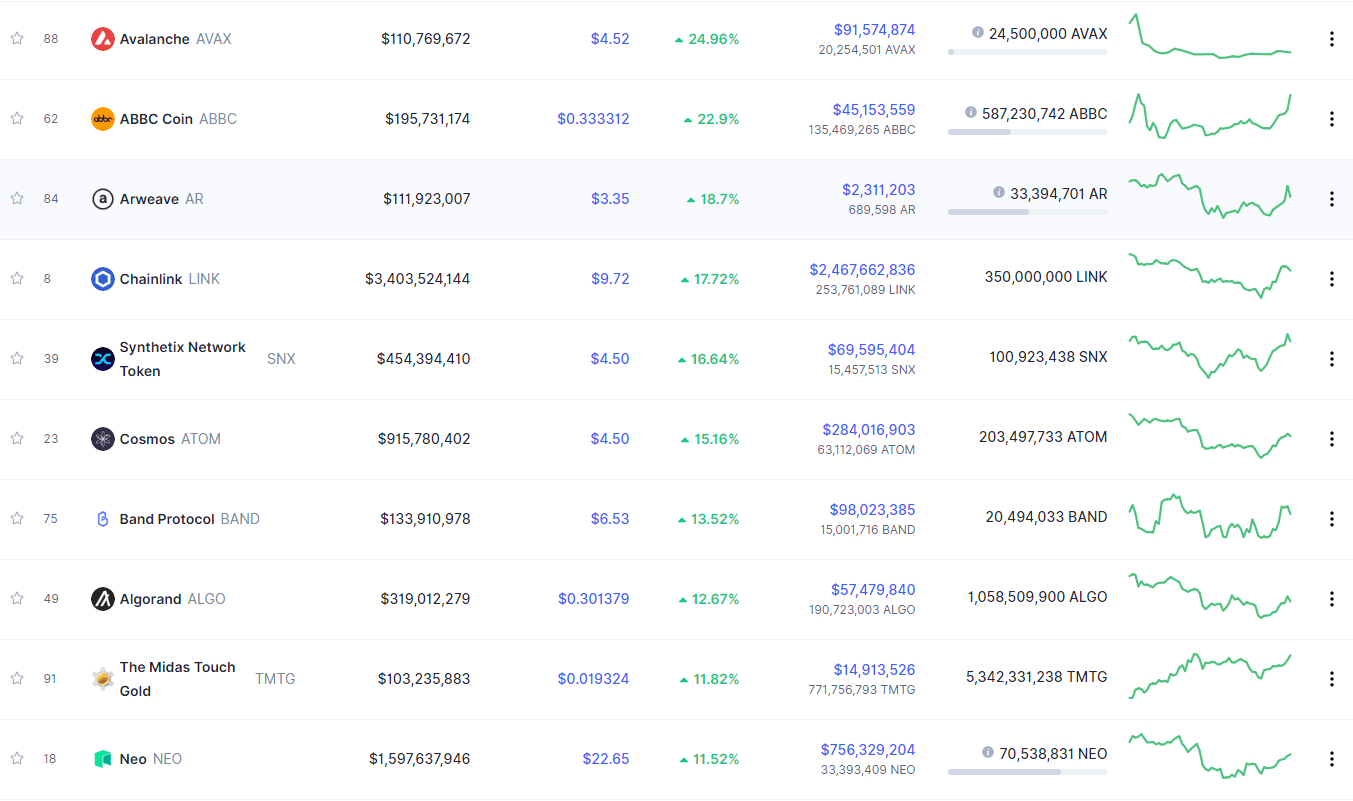
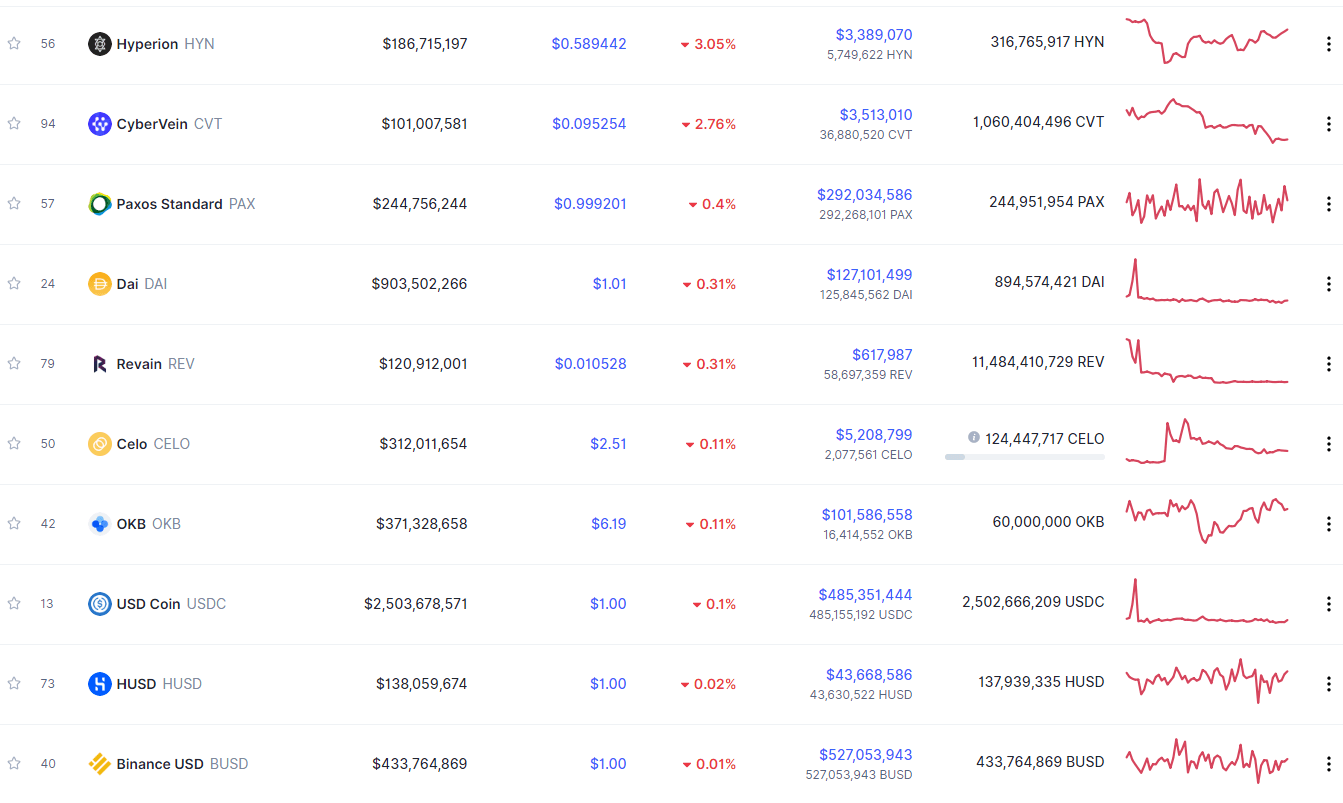
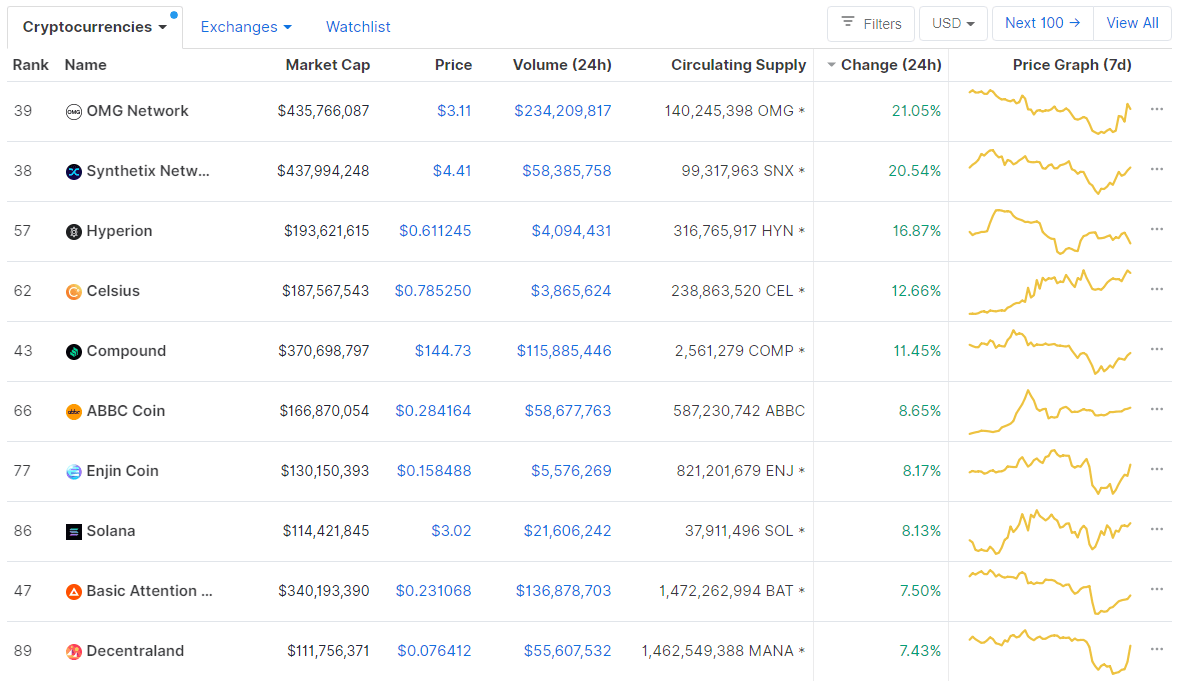
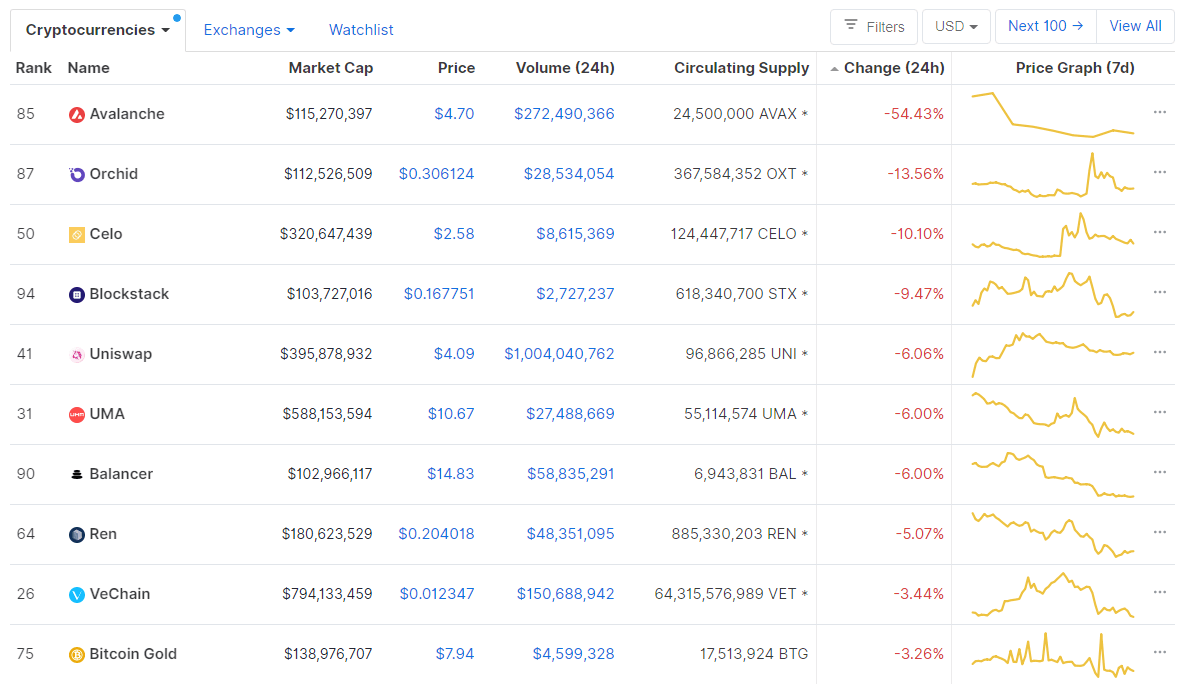
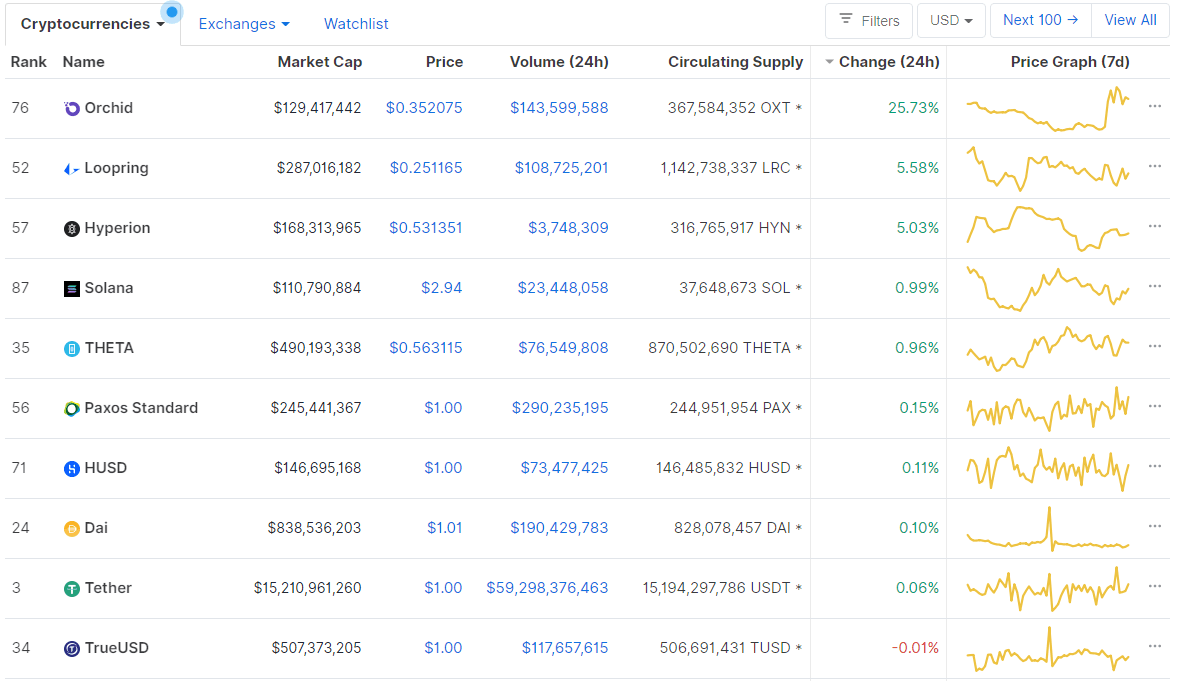
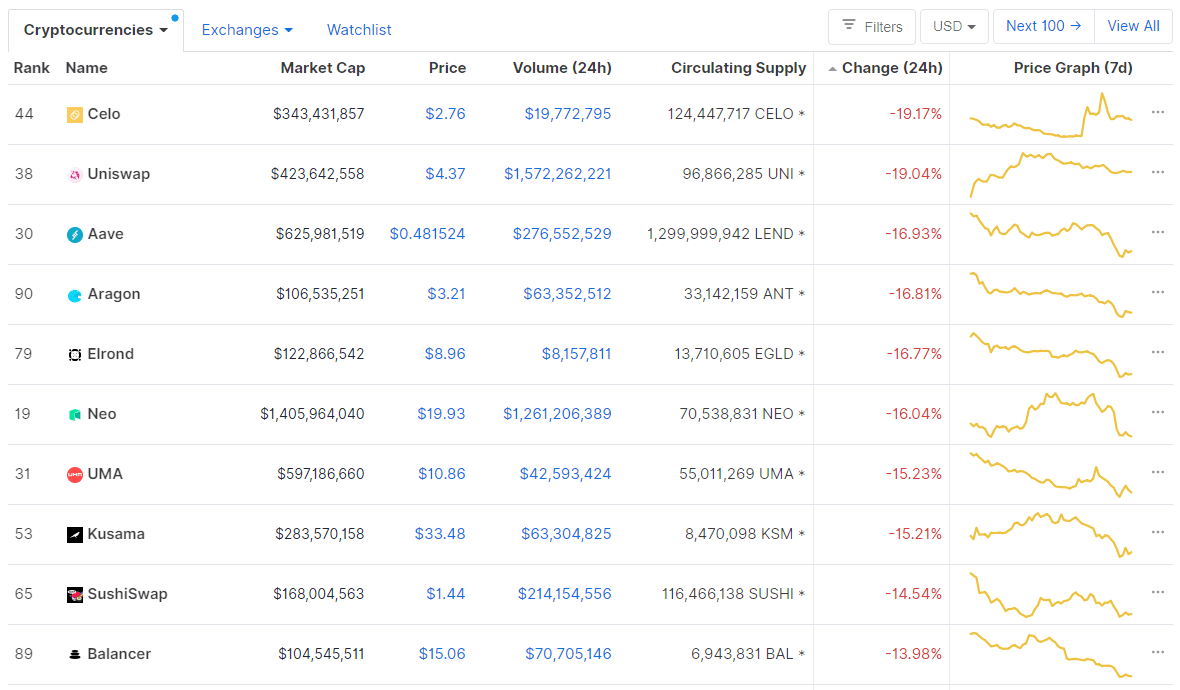
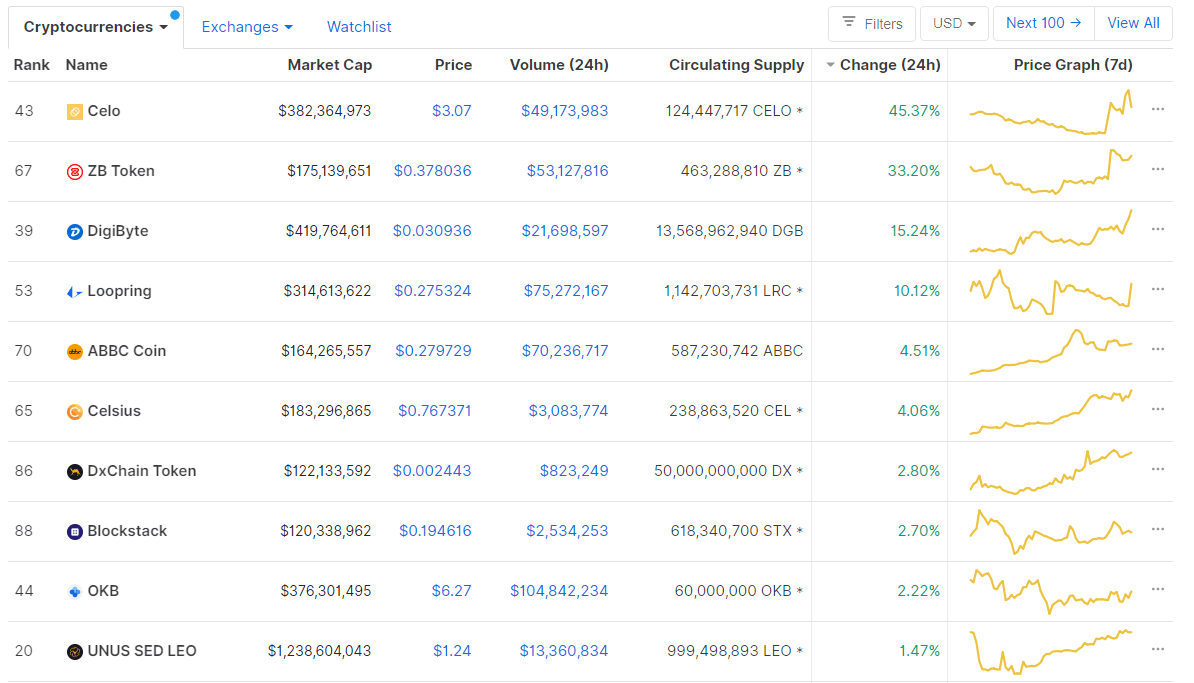
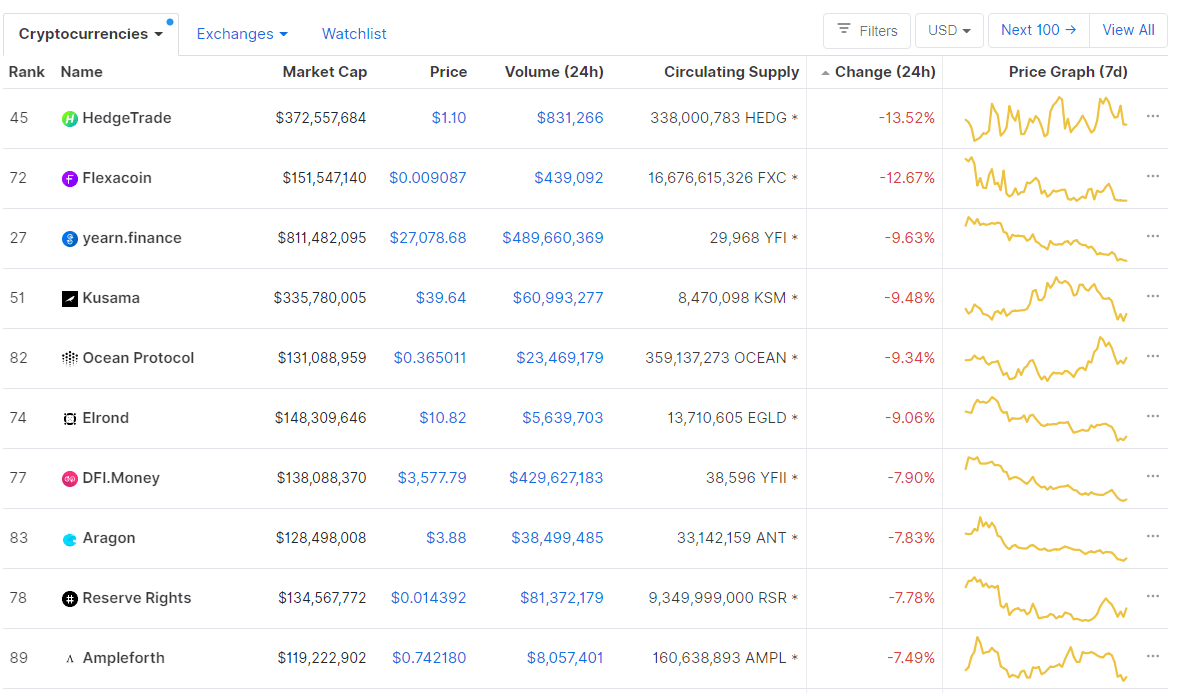
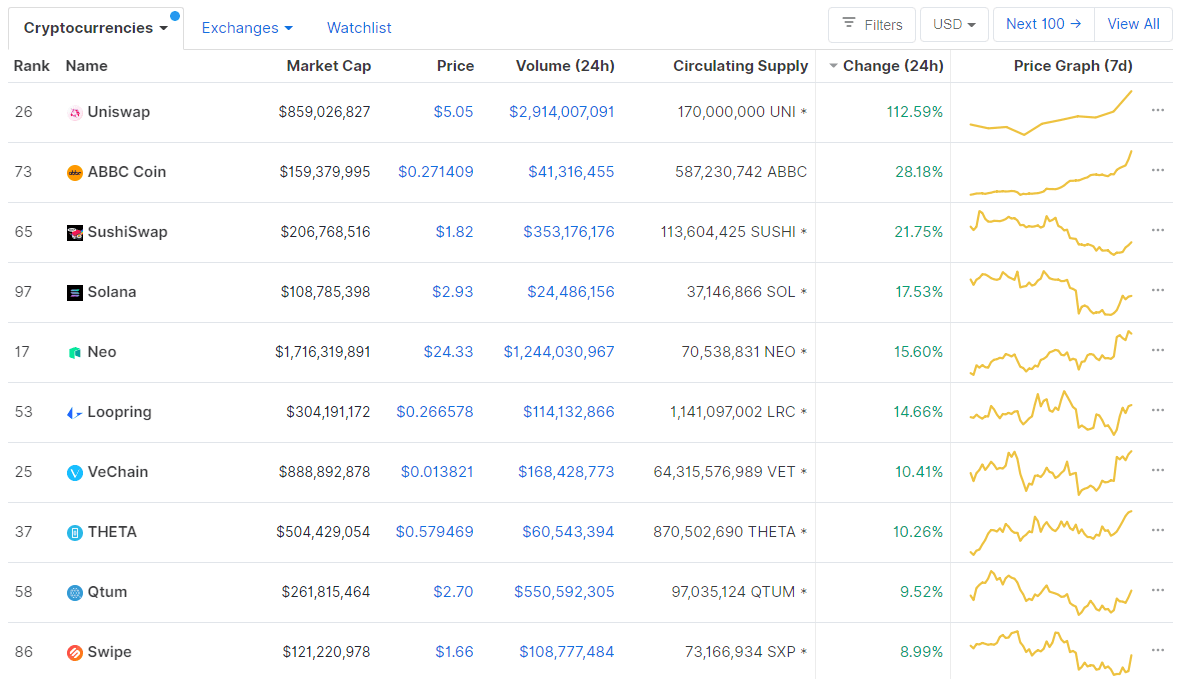
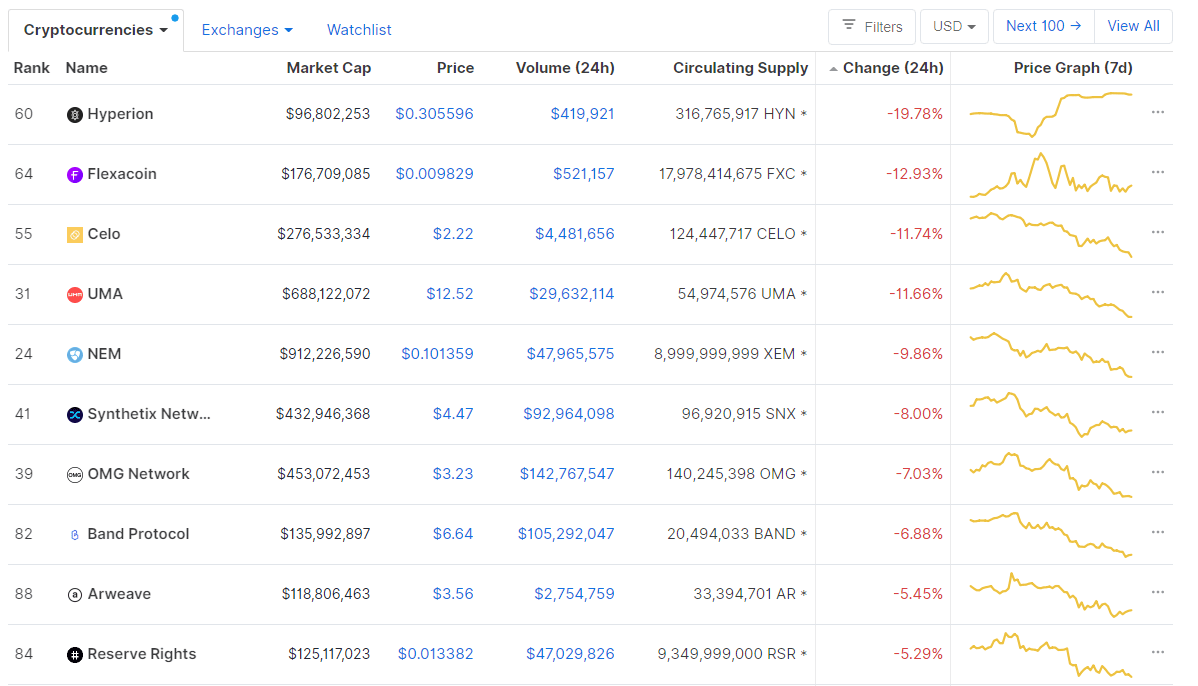
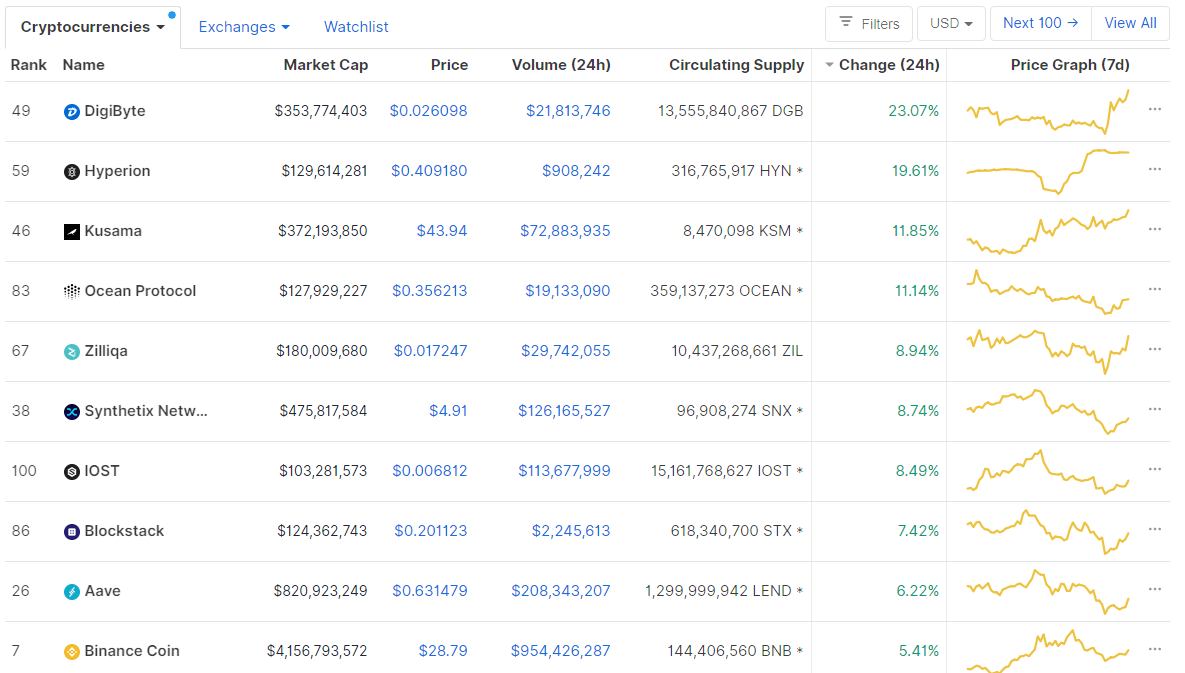
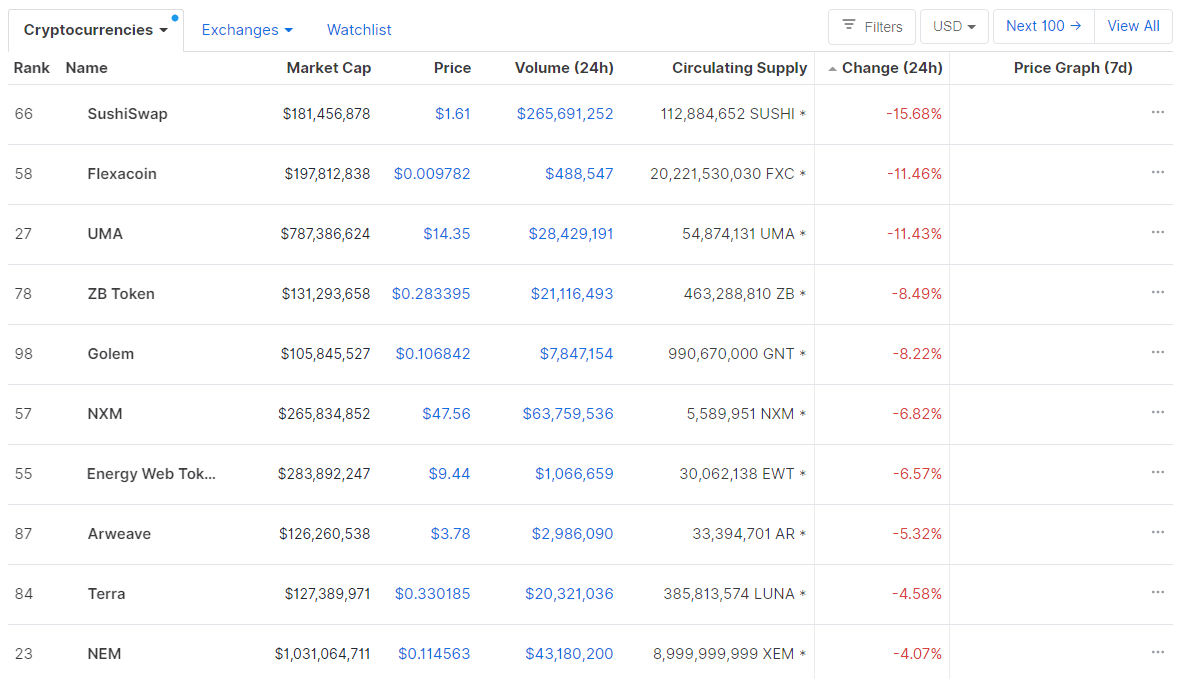
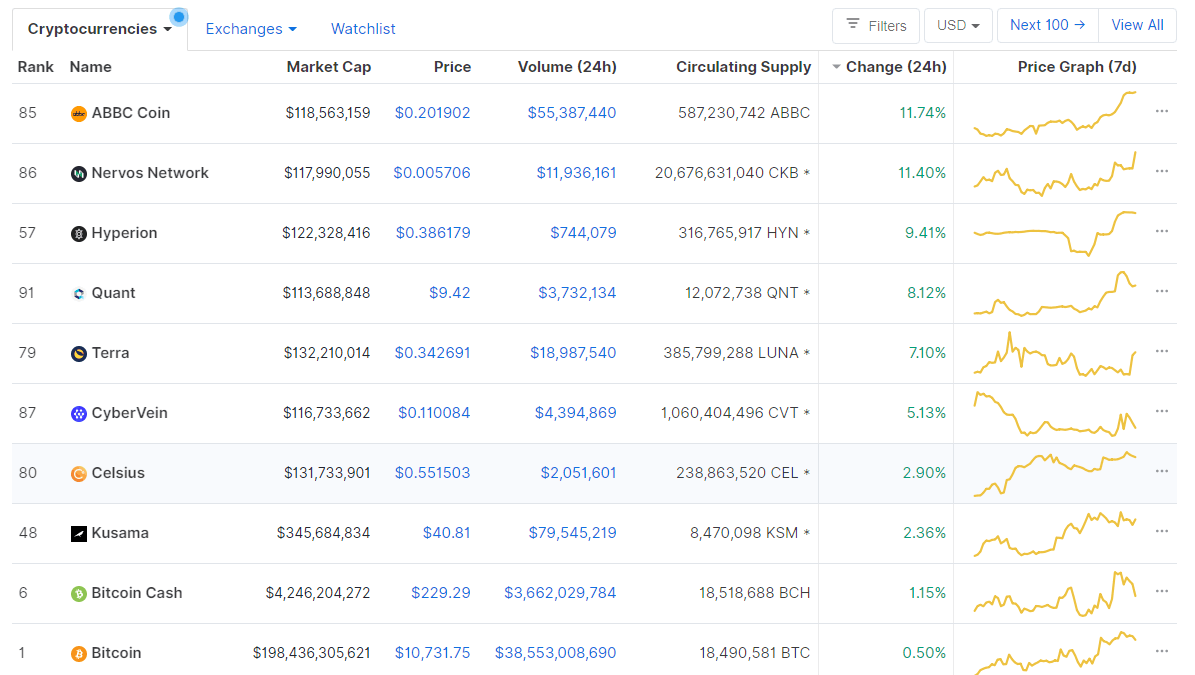
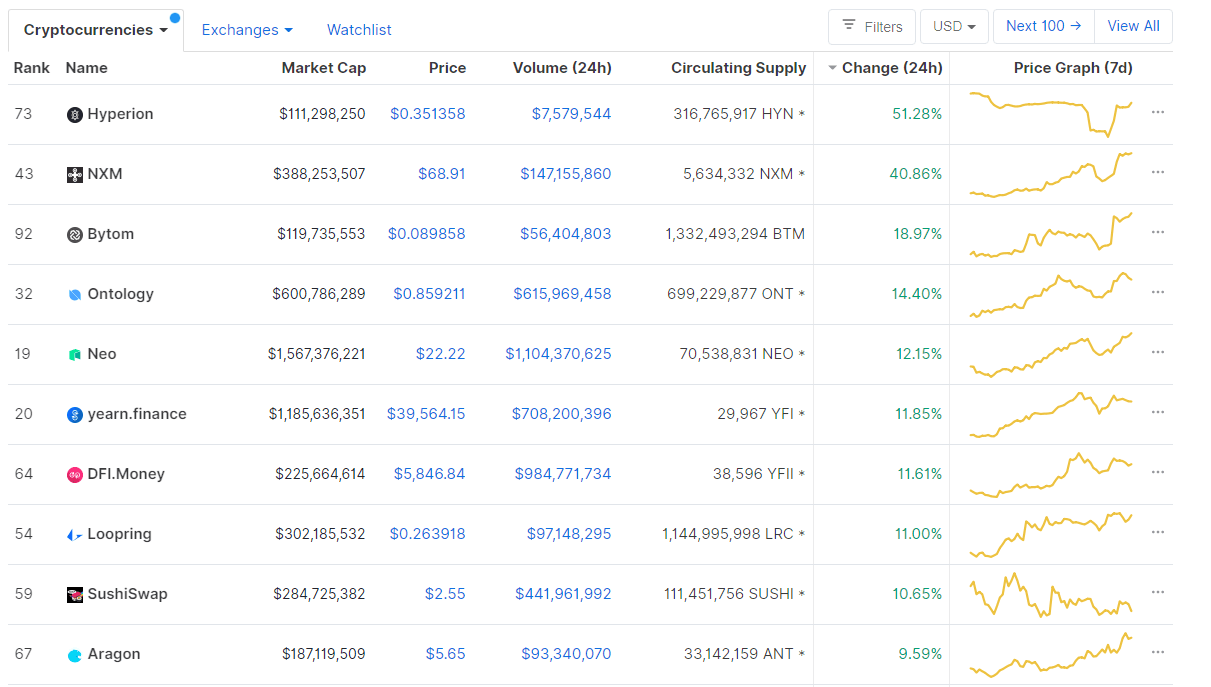
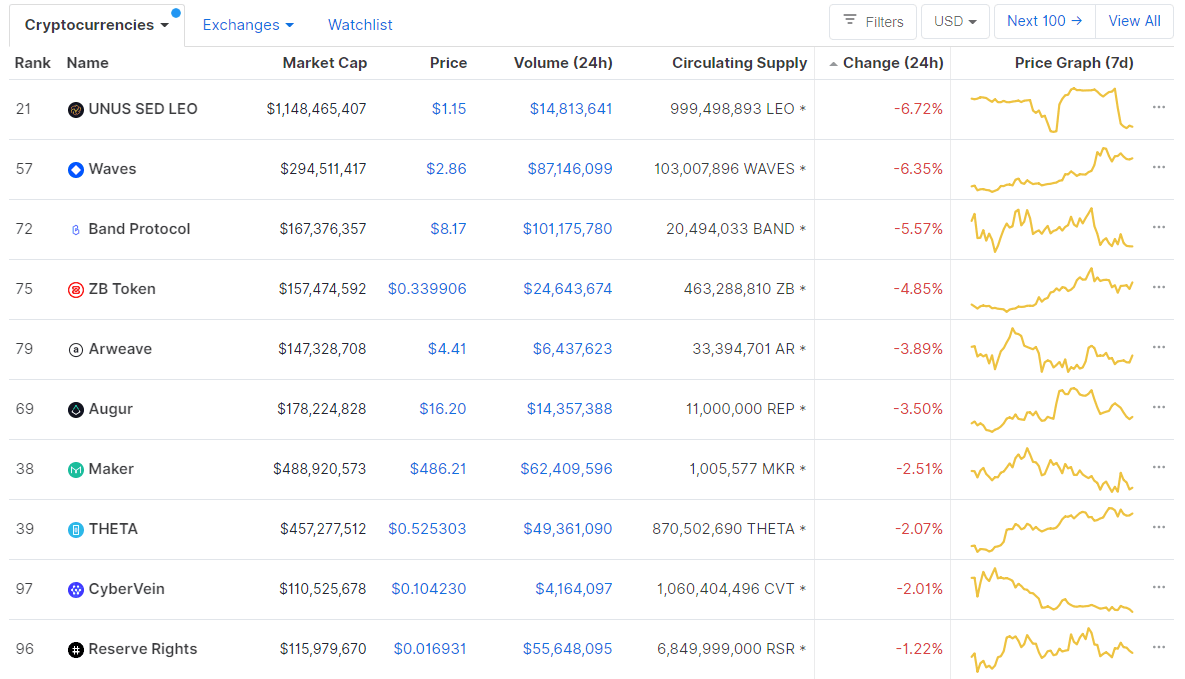
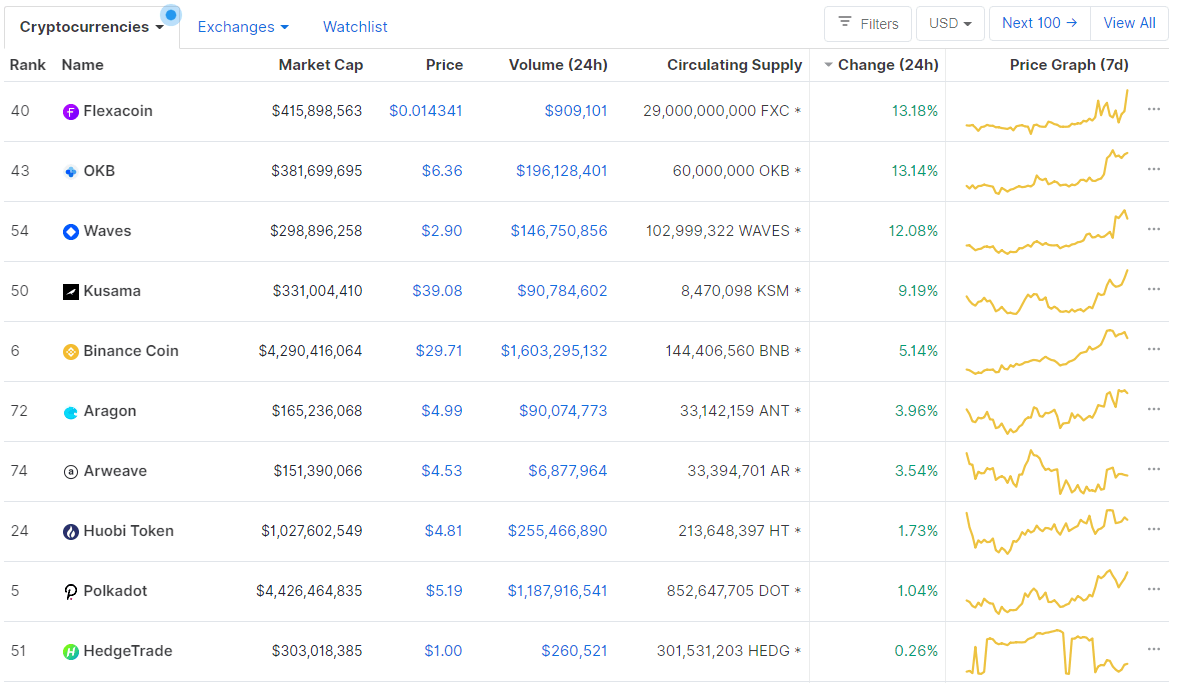
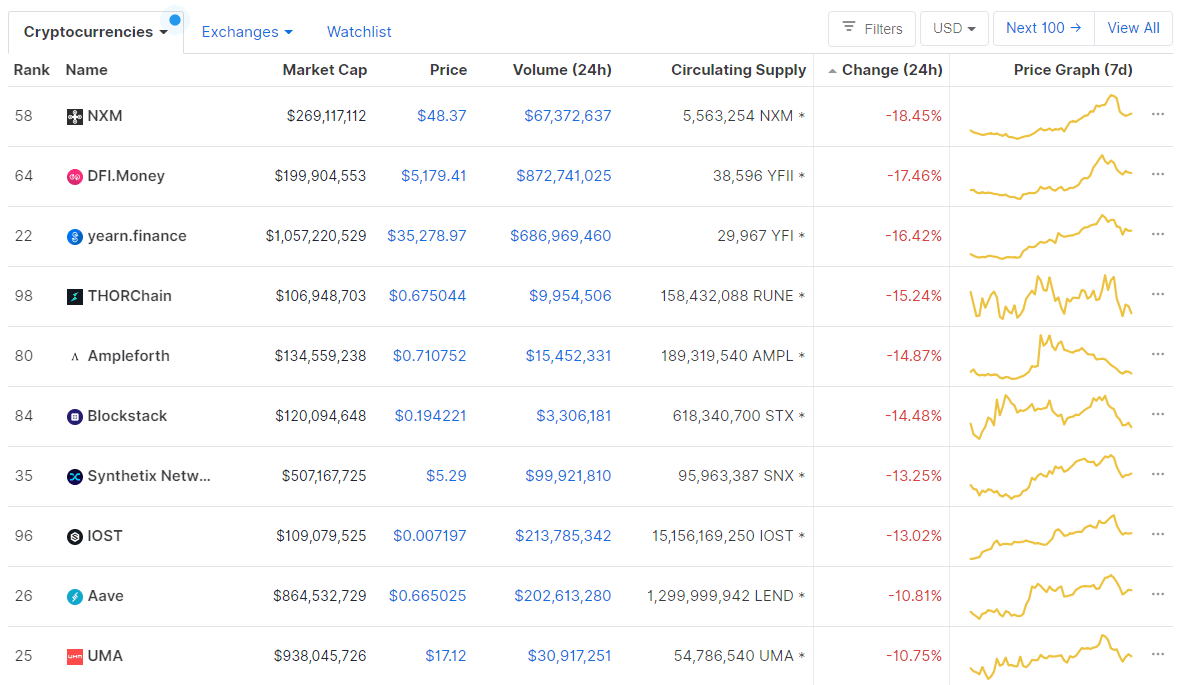
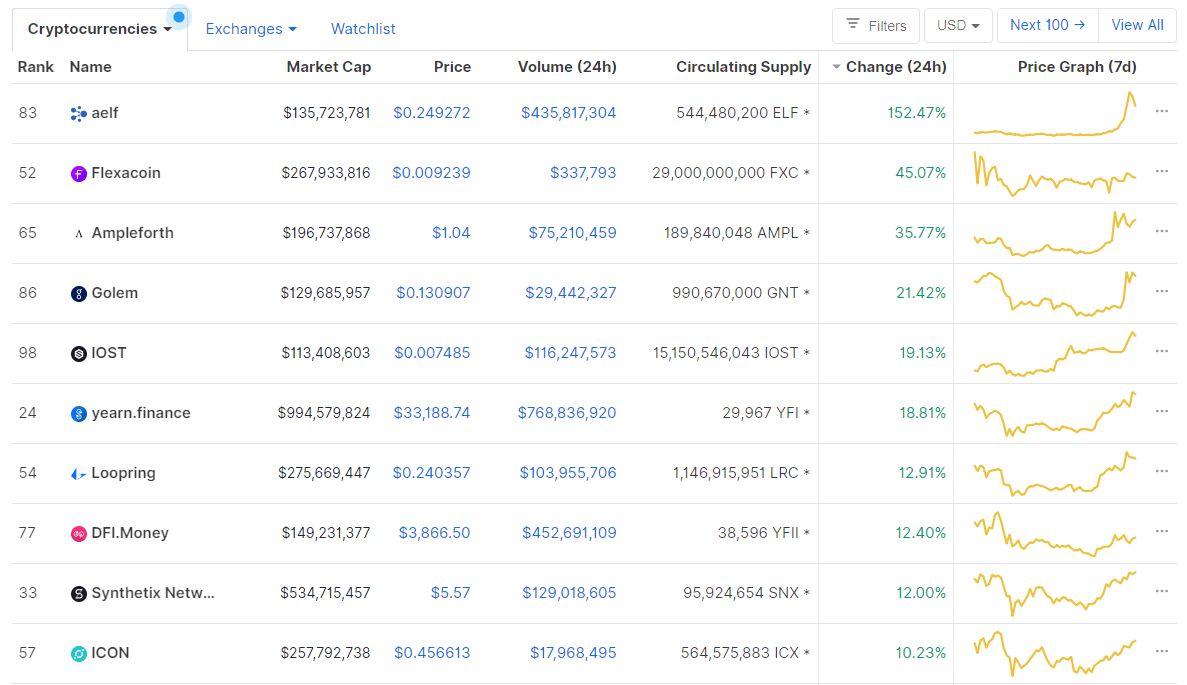
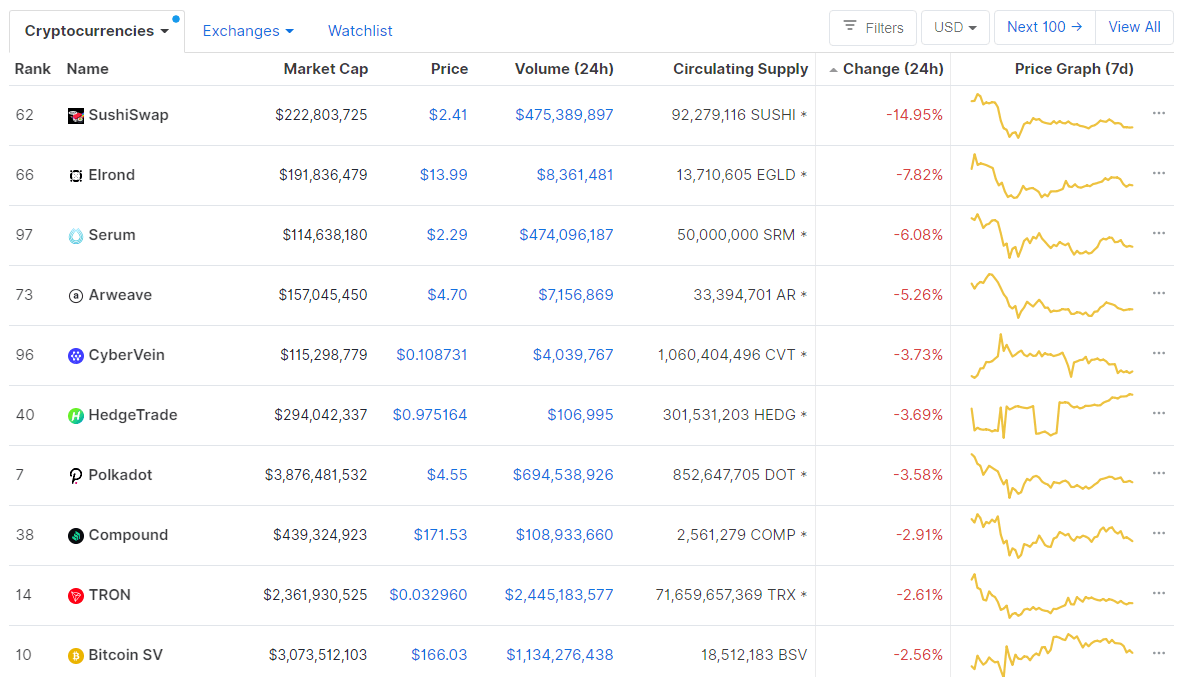
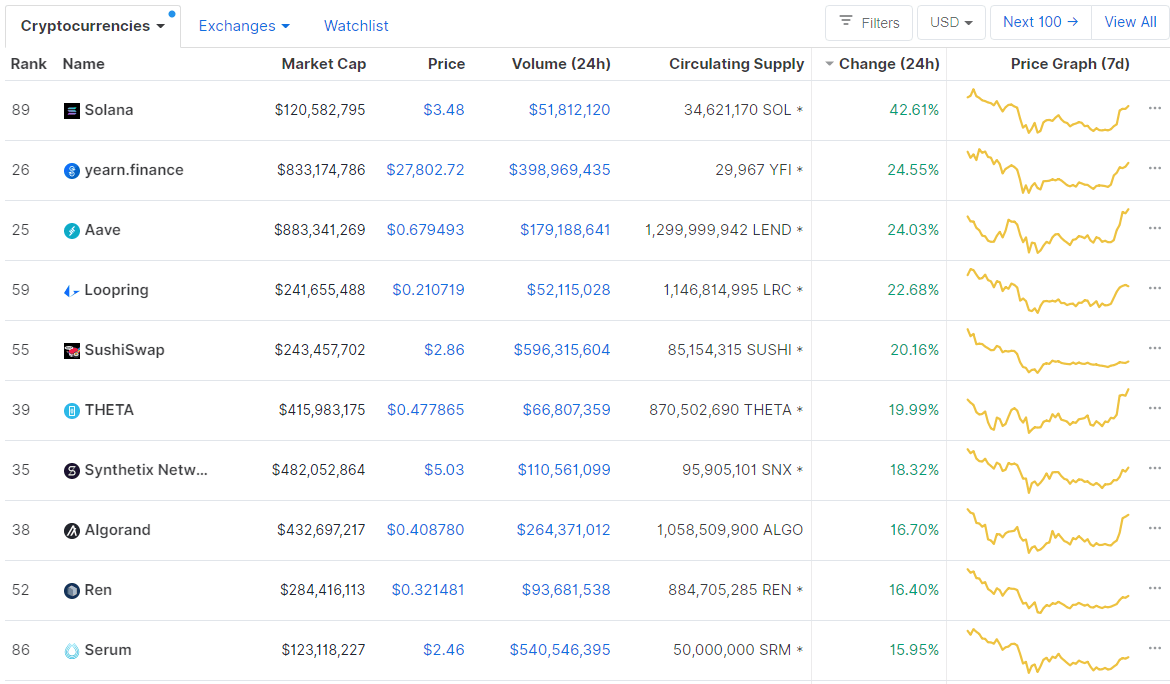
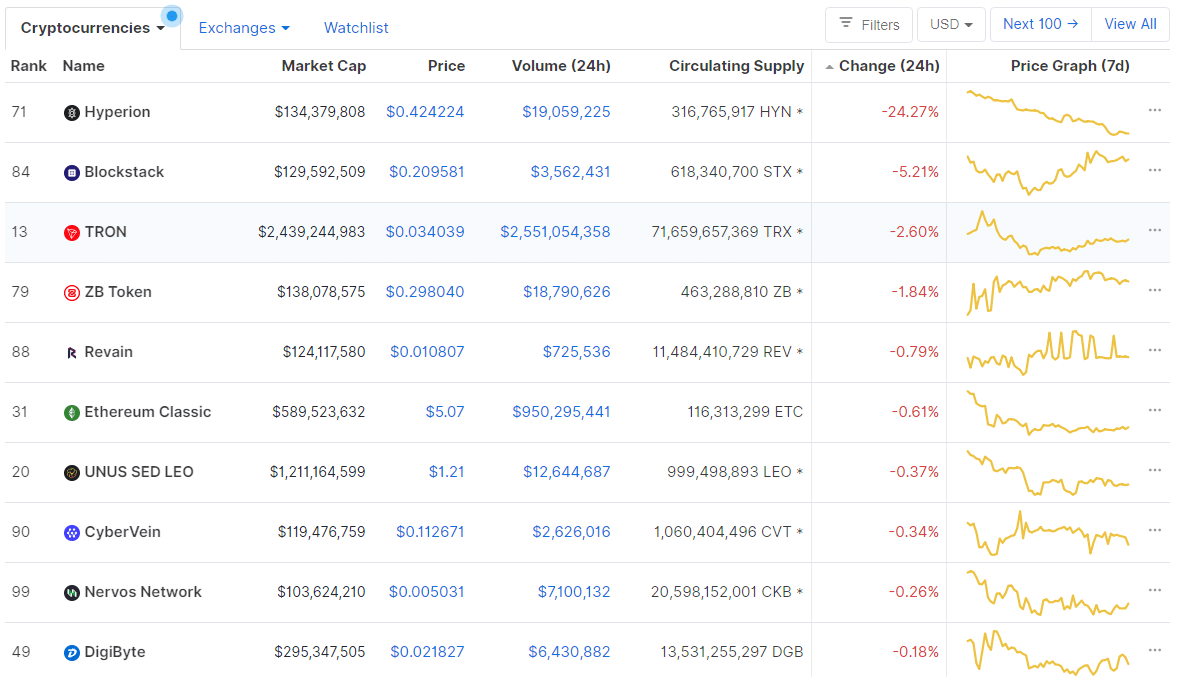
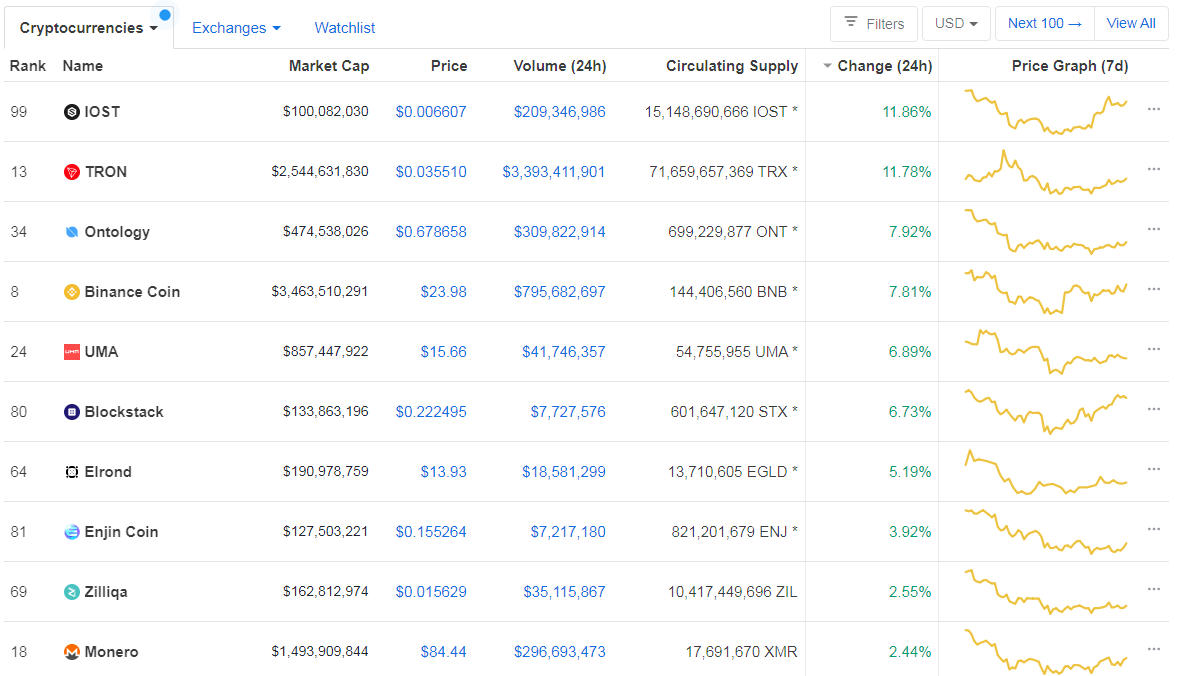
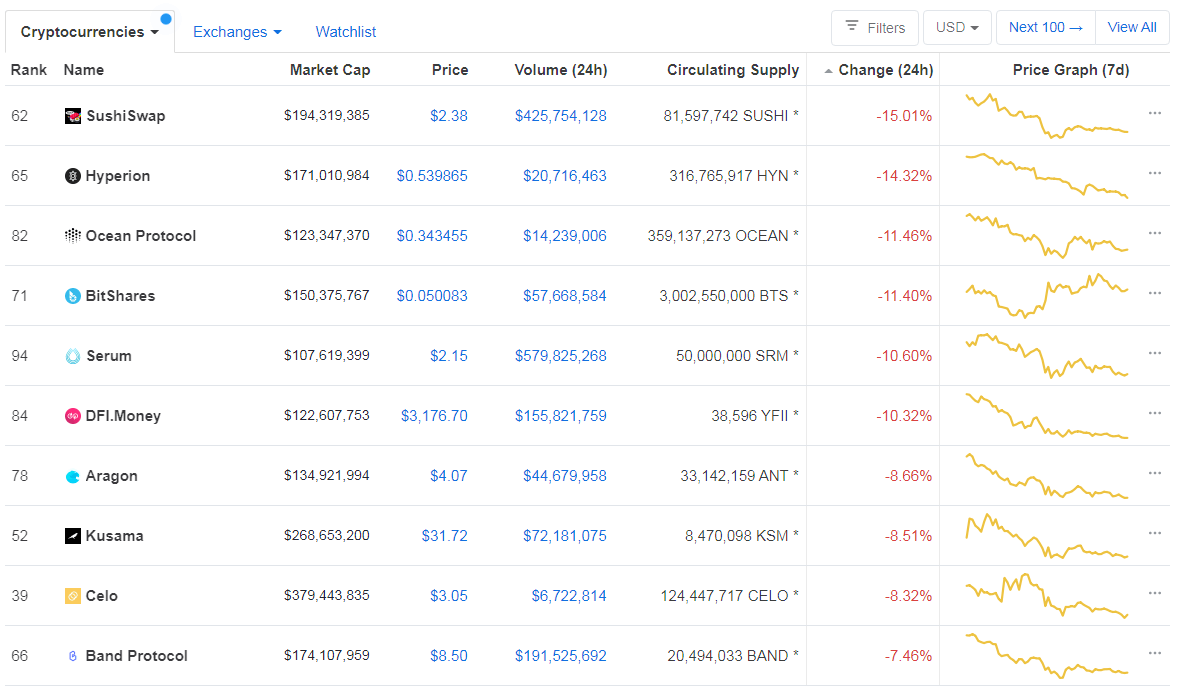
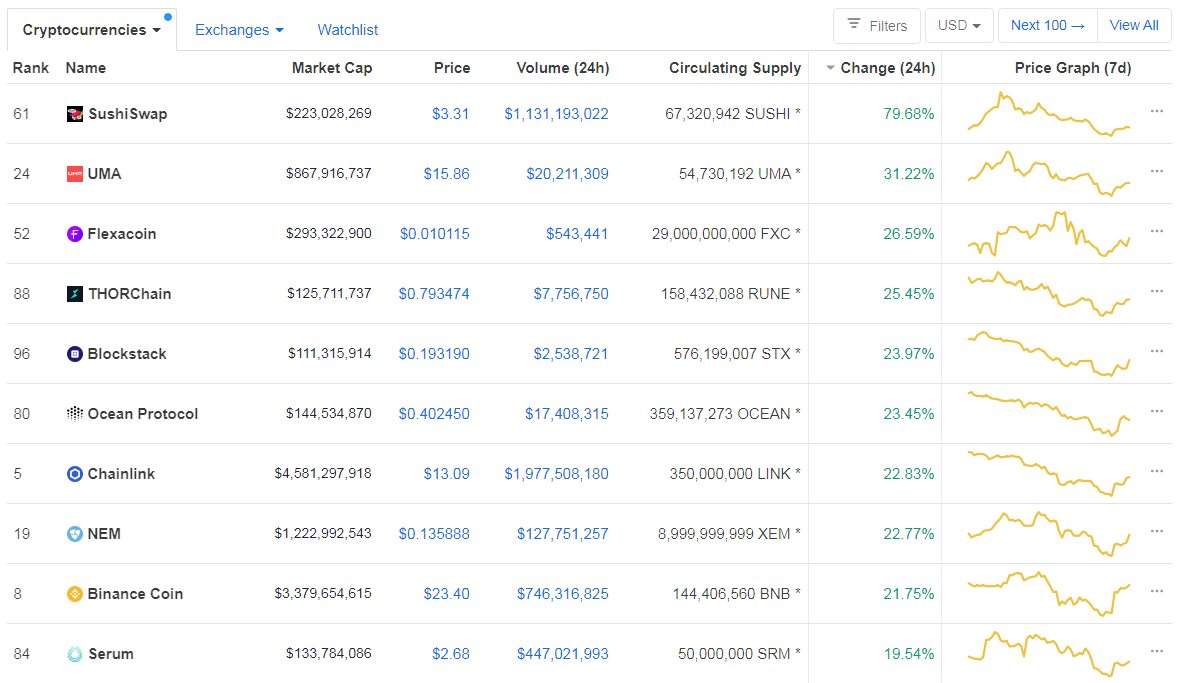
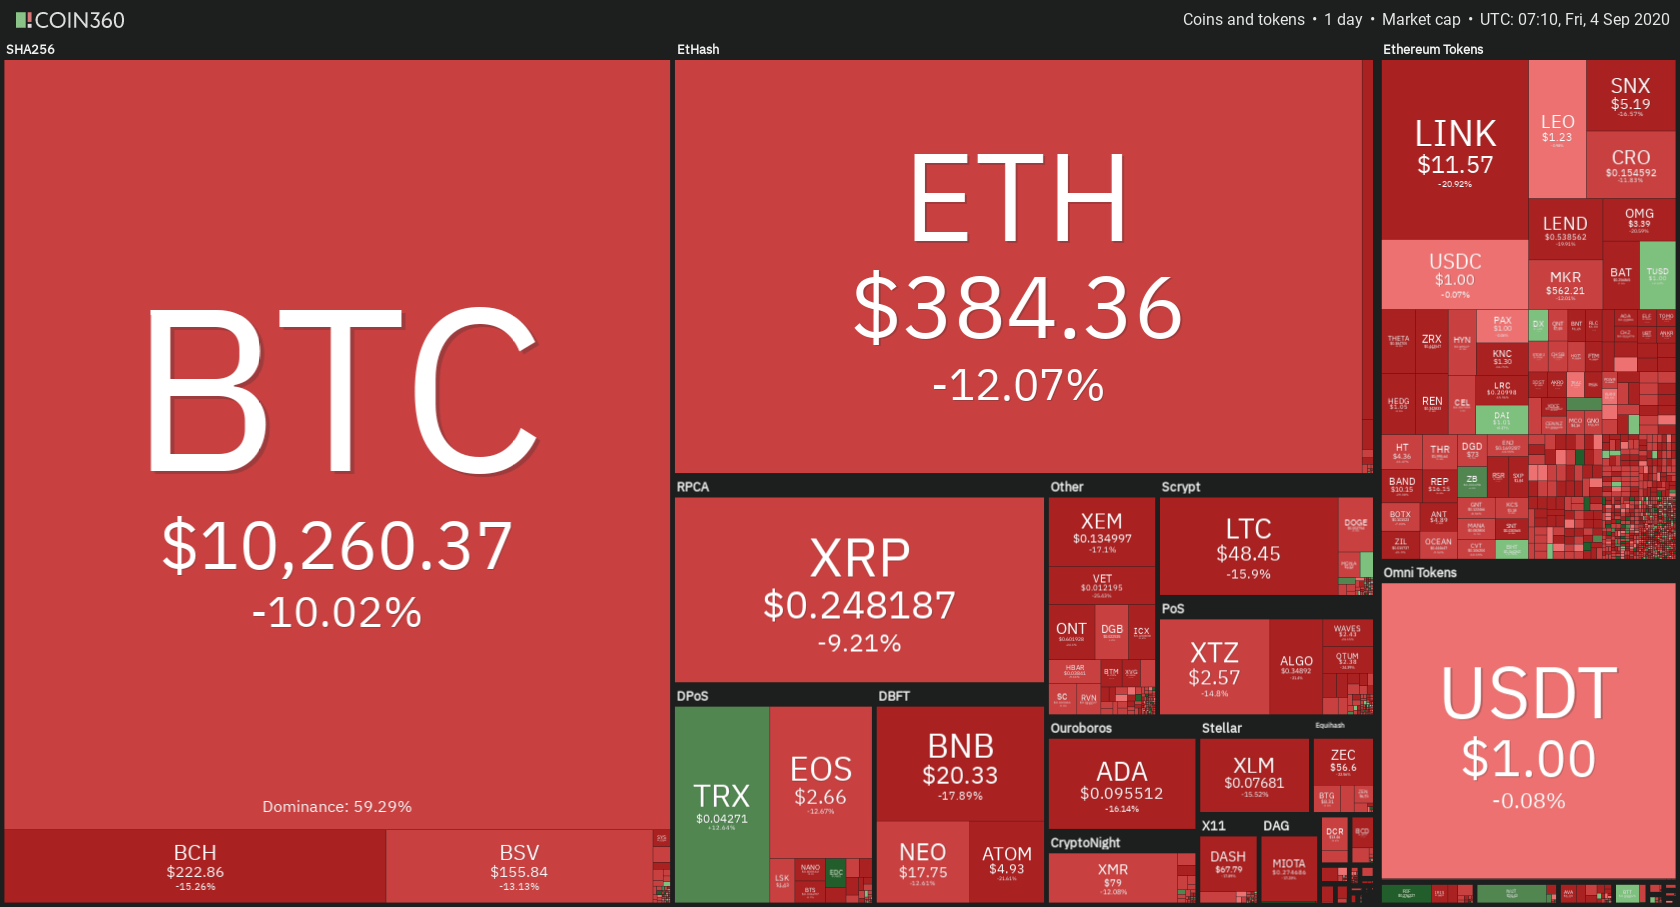
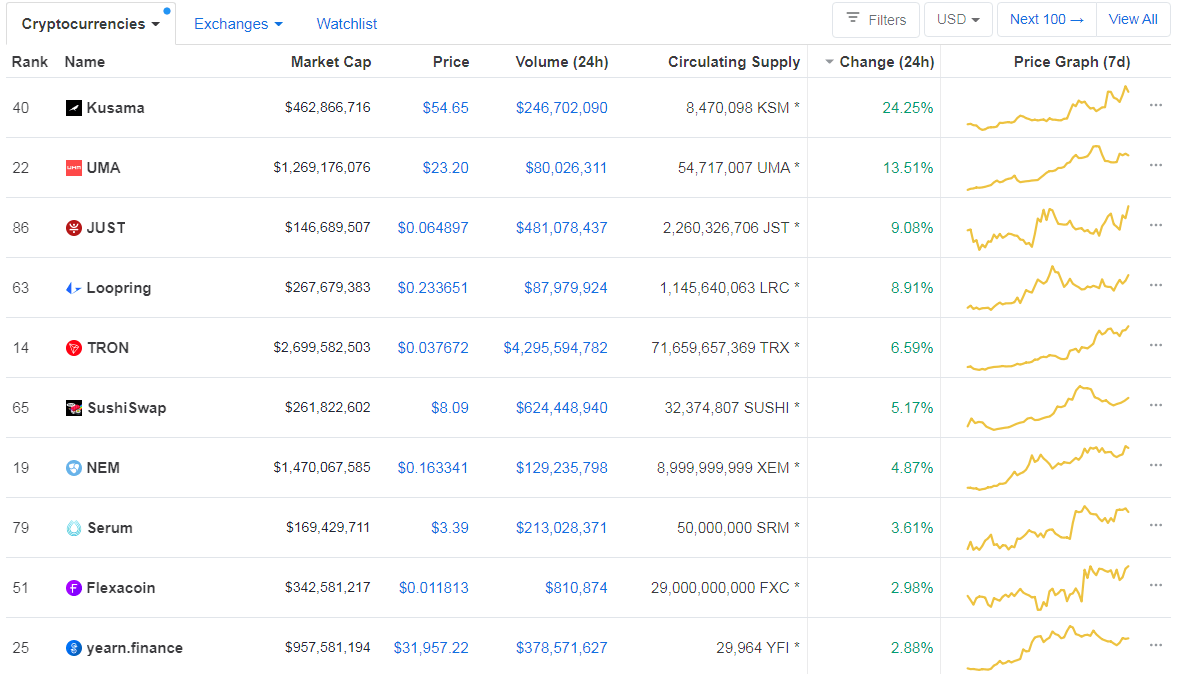
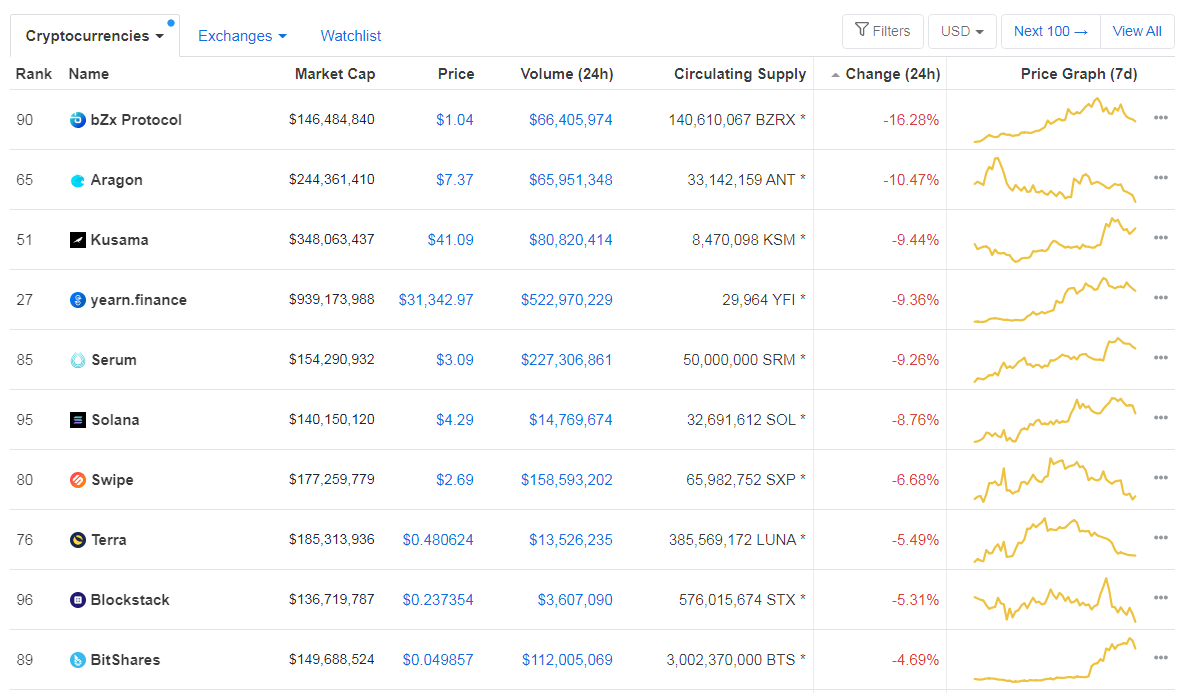
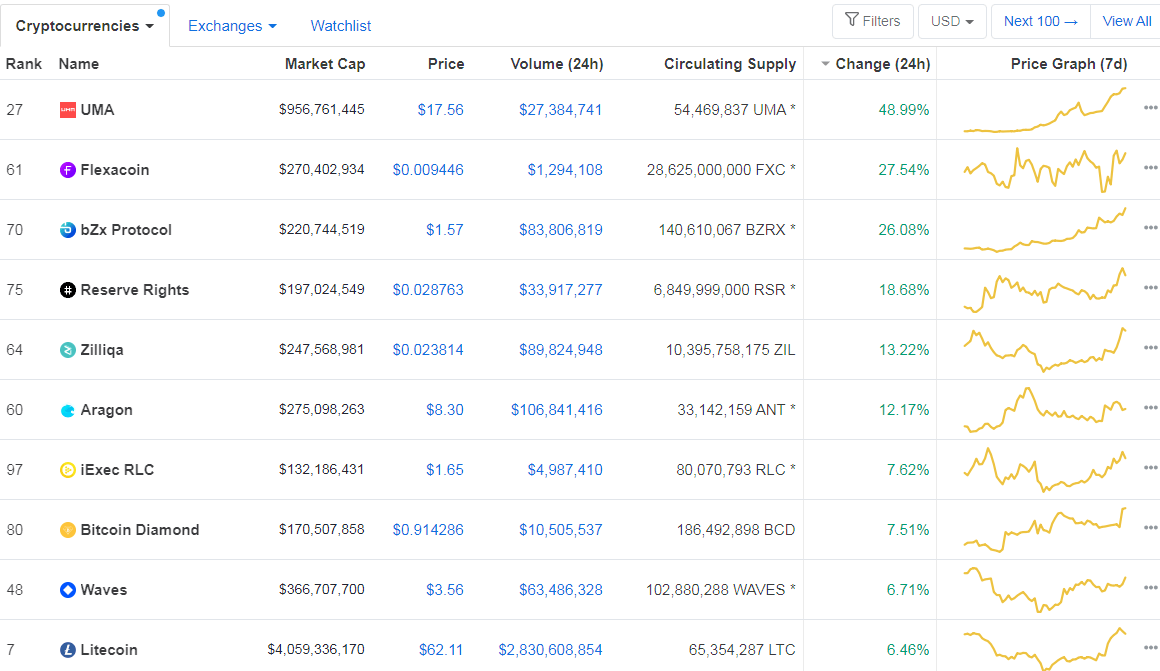
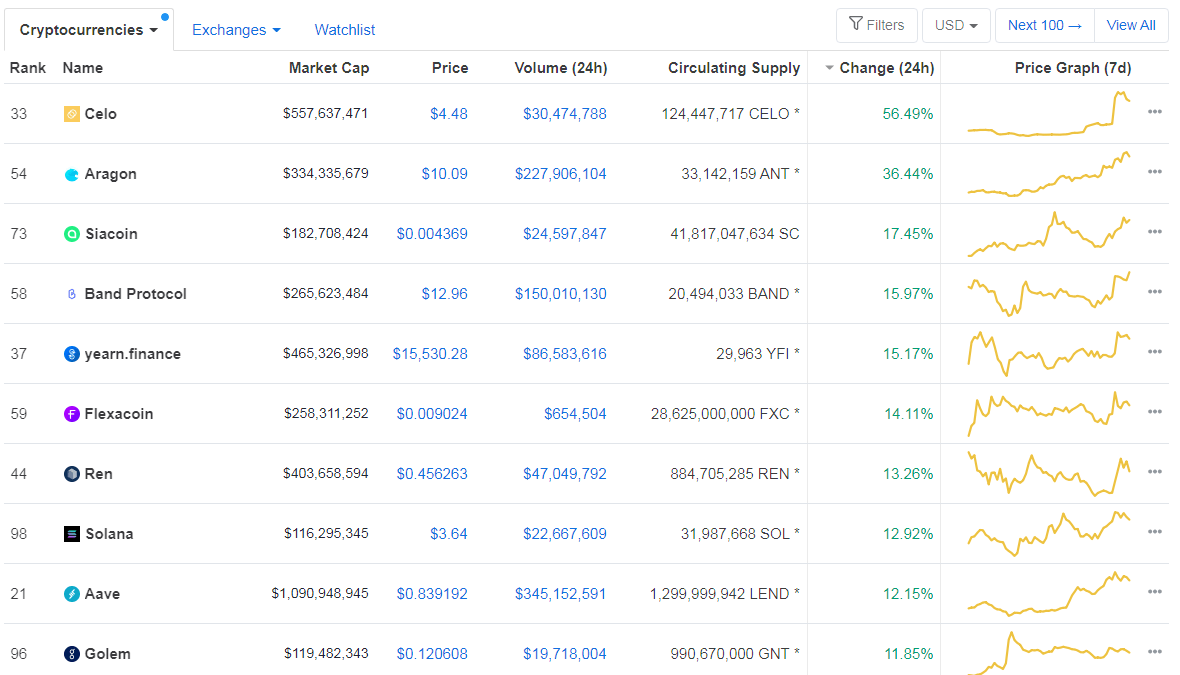
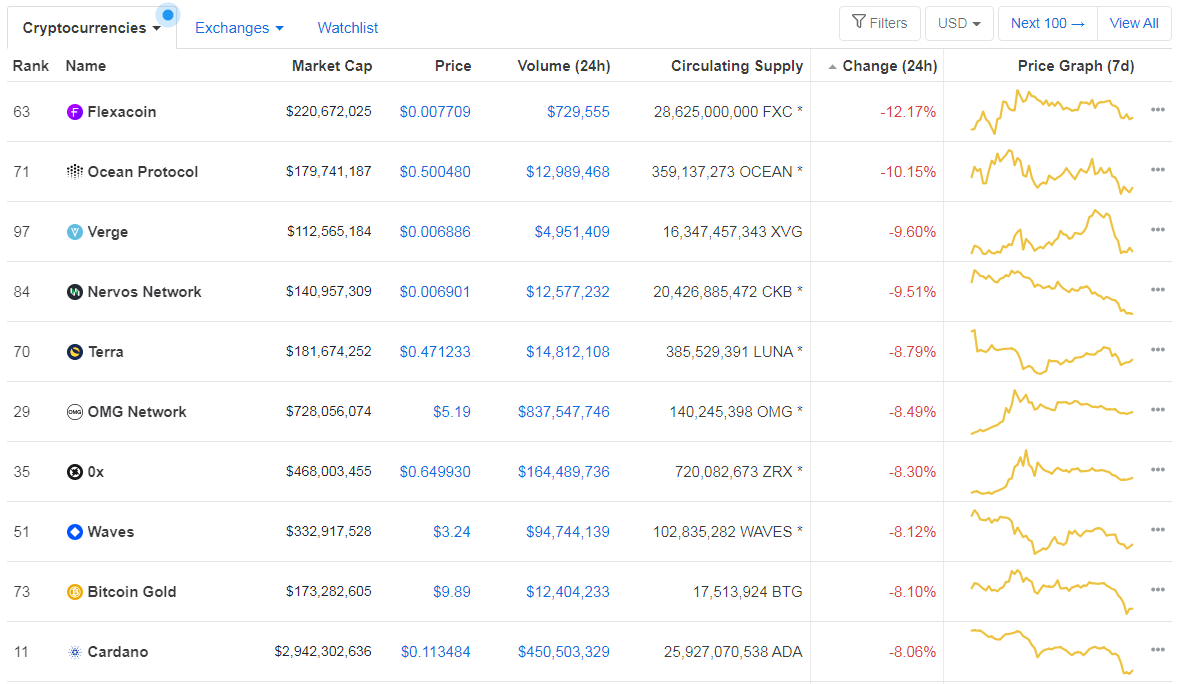
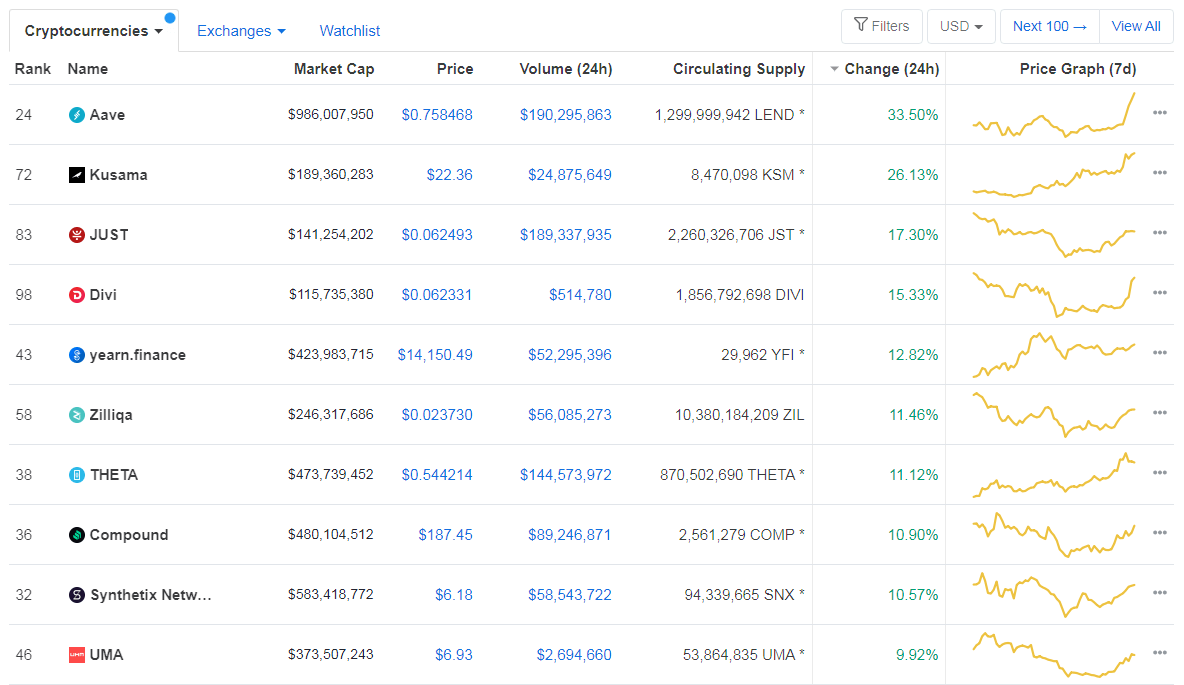
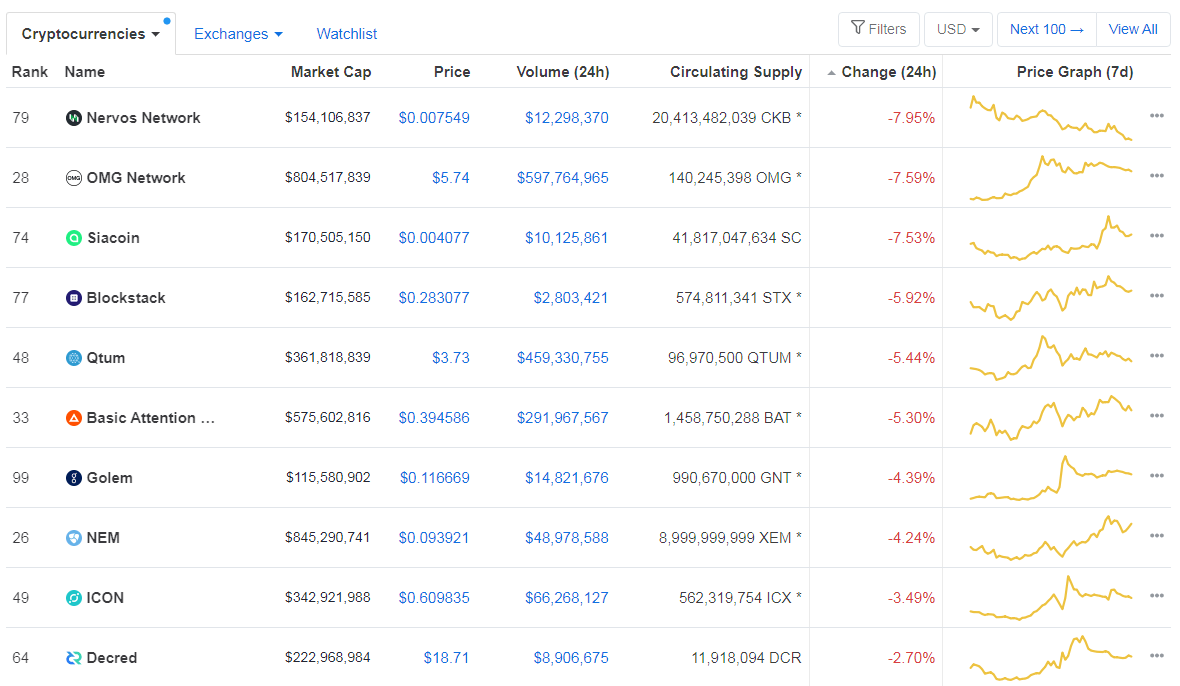
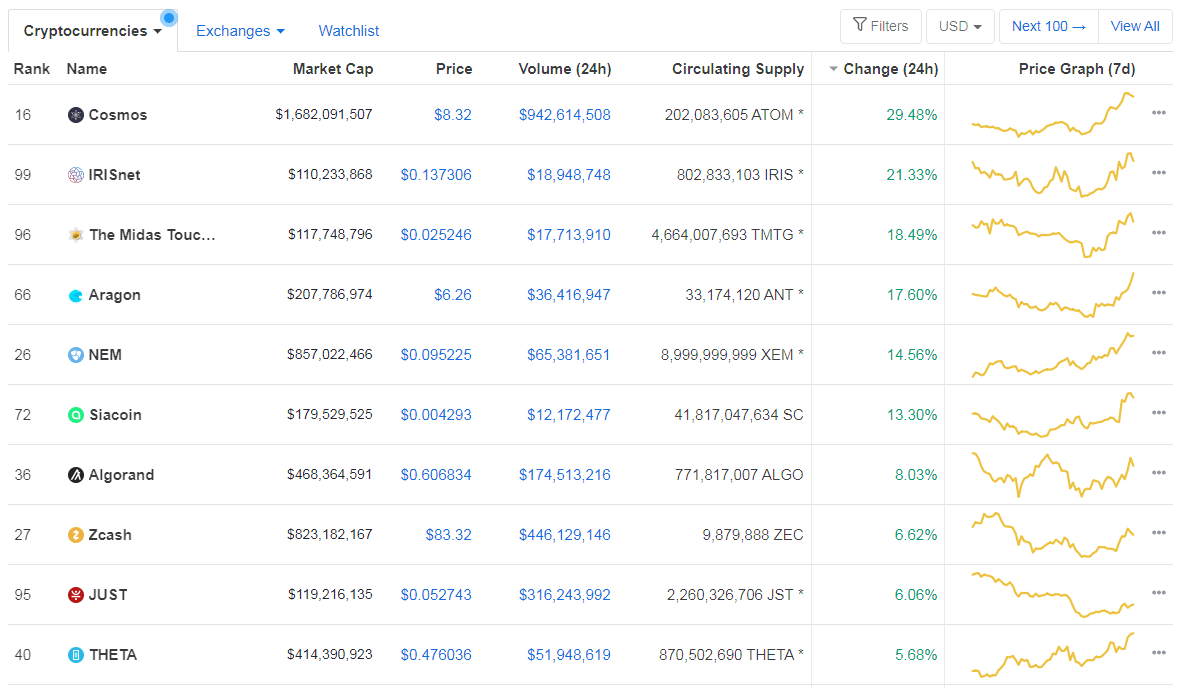
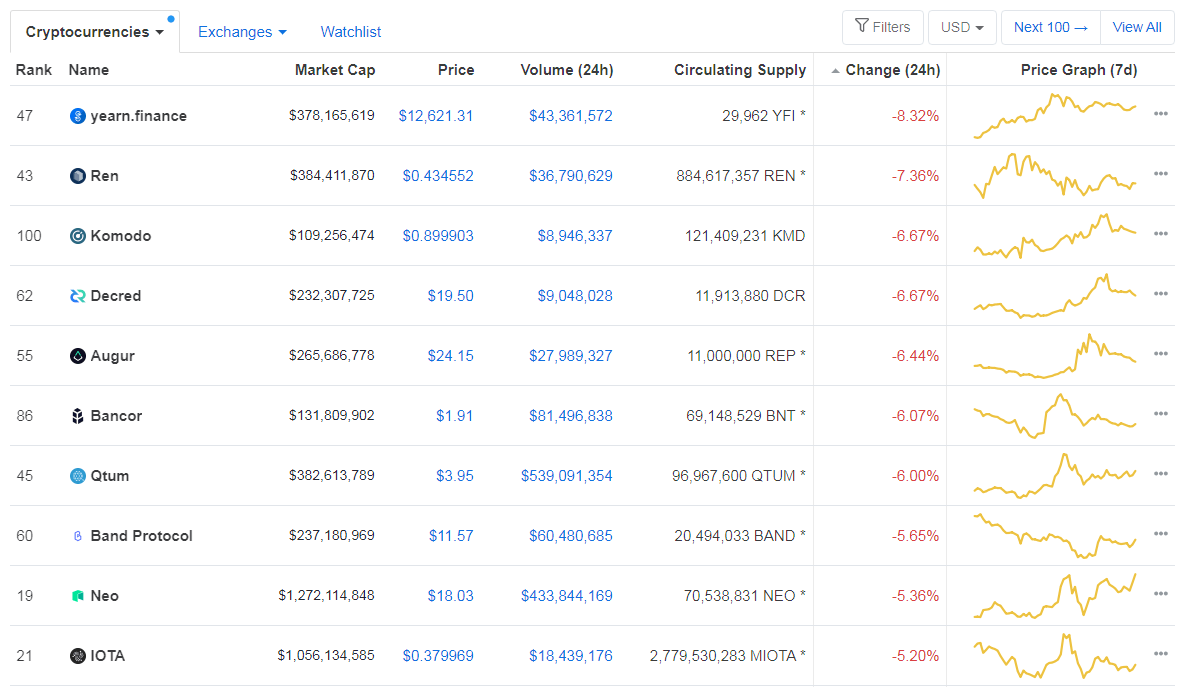
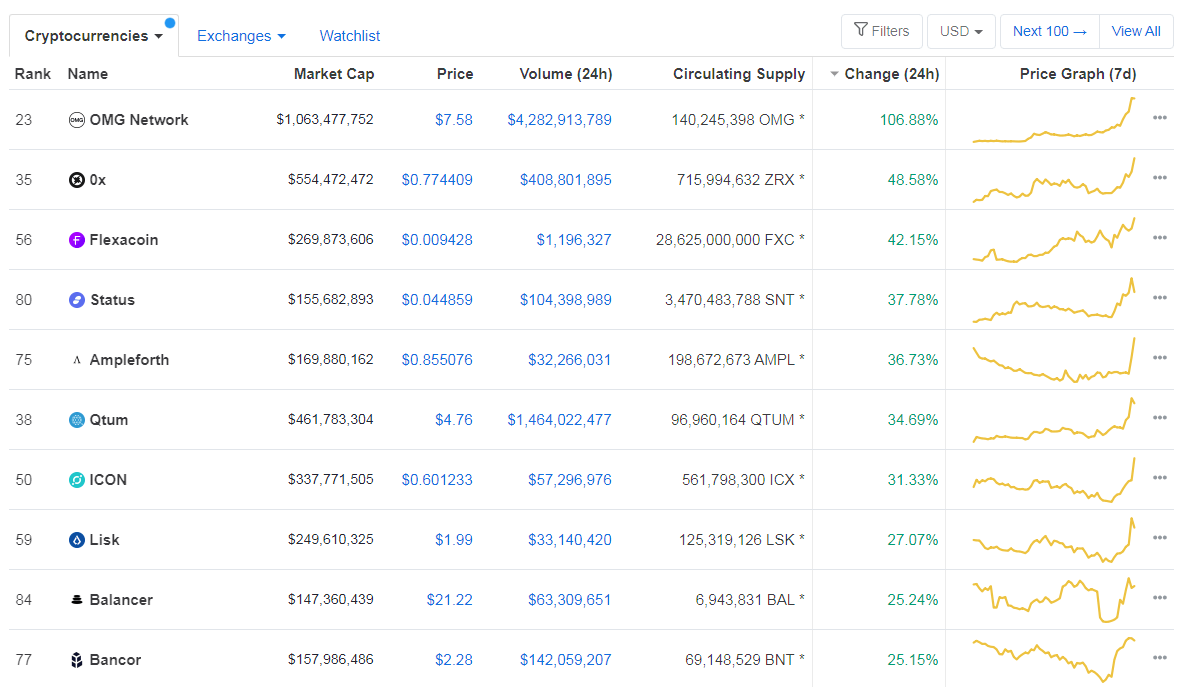
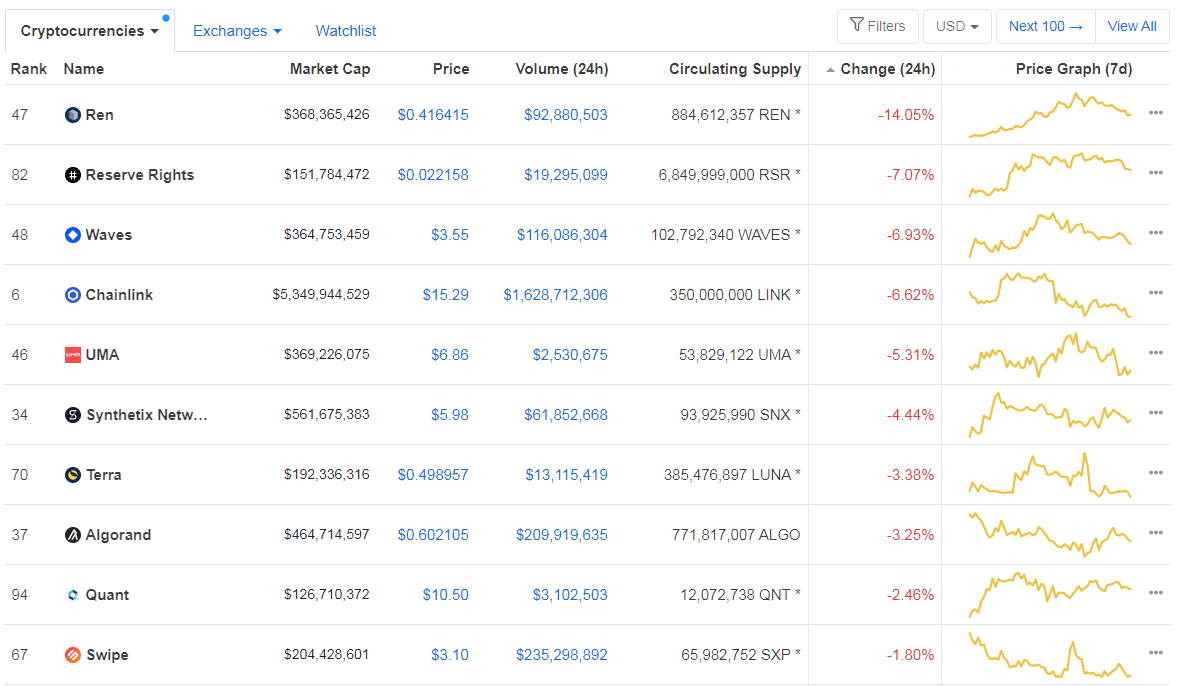
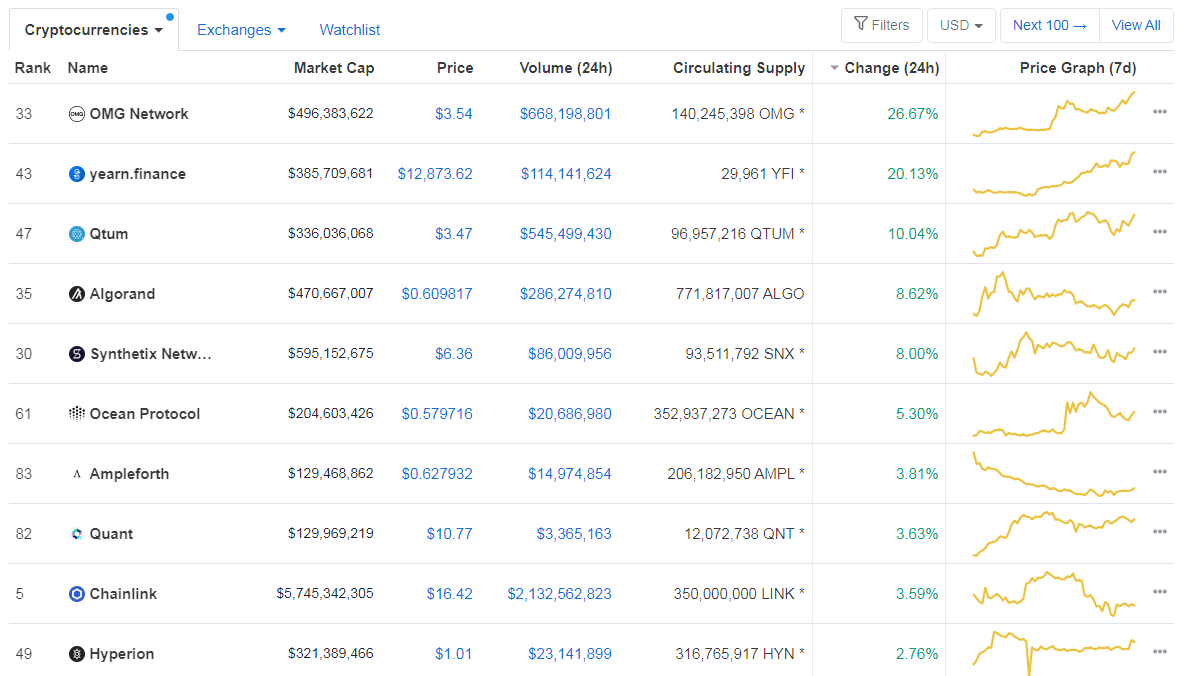
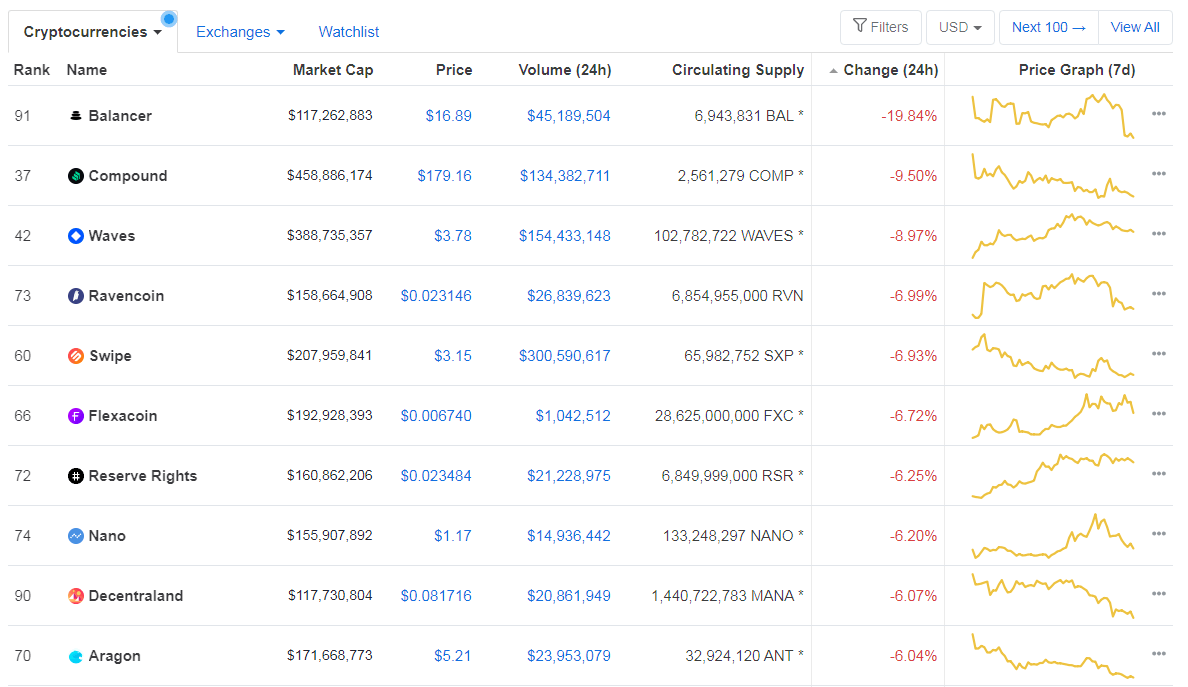
If we check out the top 100 cryptocurrencies, Flexacoin had another amazing day, gaining an astonishing 332.35% in the past 24 hours, making it the crypto to gain the most in a day. Nexo (13.94%) and Compound (13.71%) also did great. On the other hand, ABBC Coin lost 13.58%, making it the most prominent daily loser. It is followed by Reserve CyberVein’s loss of 10.32% and Quant’s loss of 7.90%.
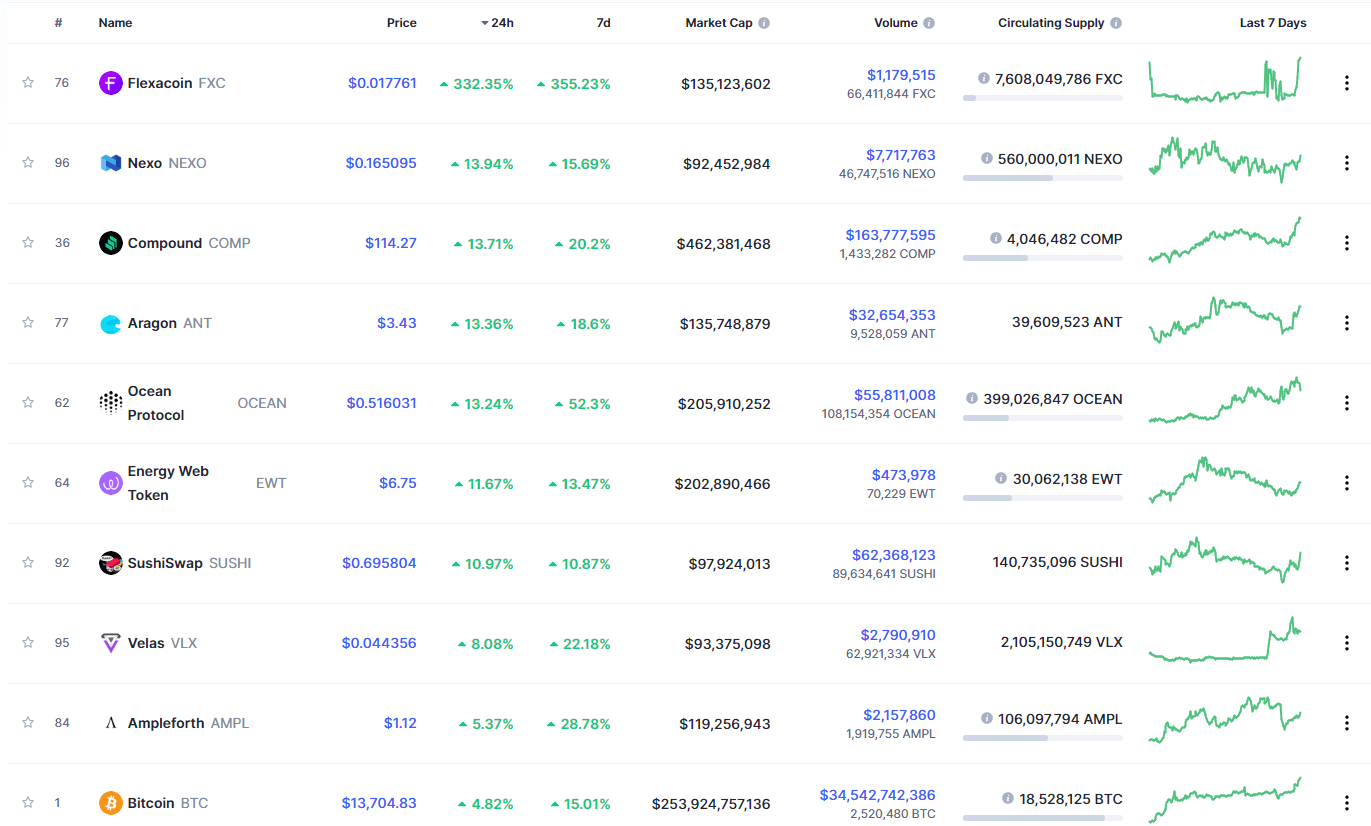
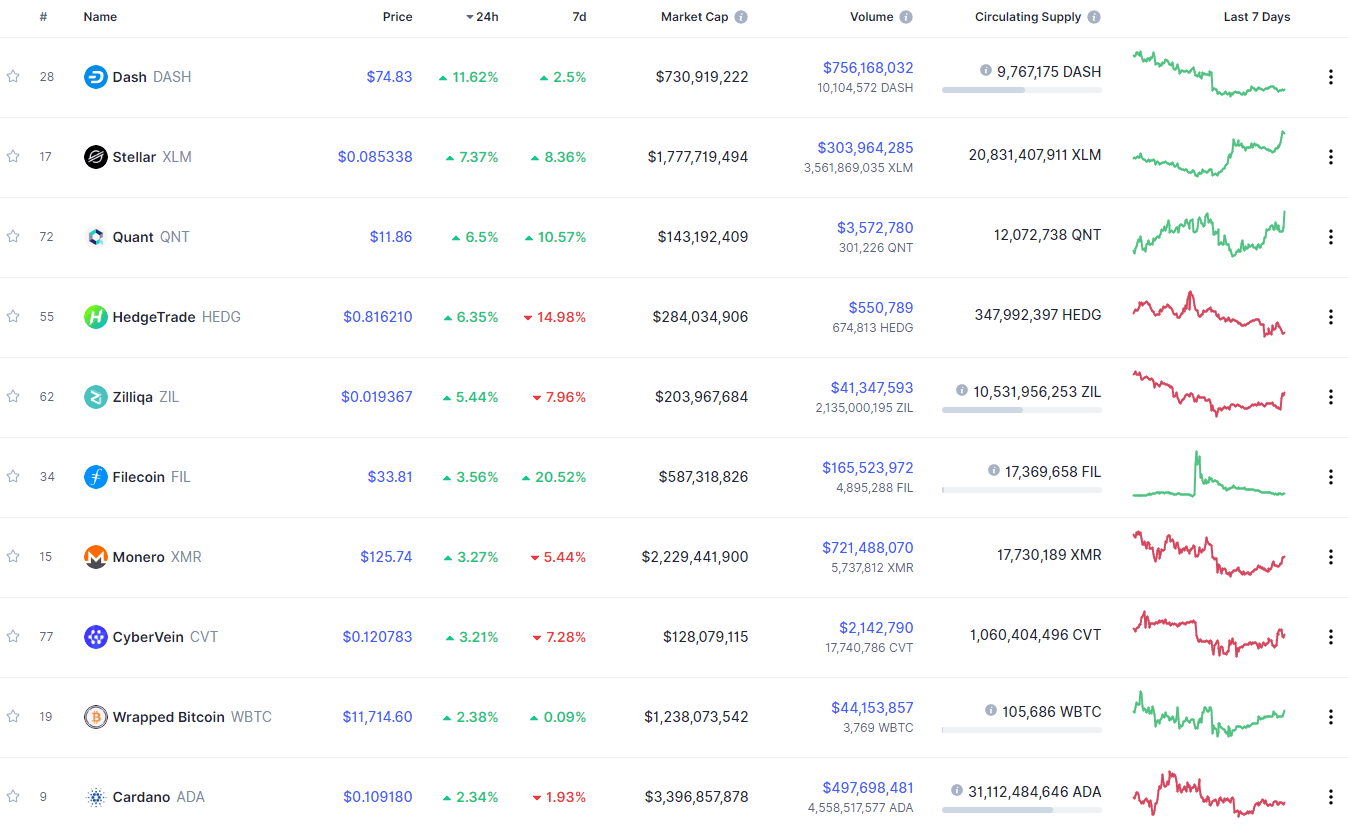
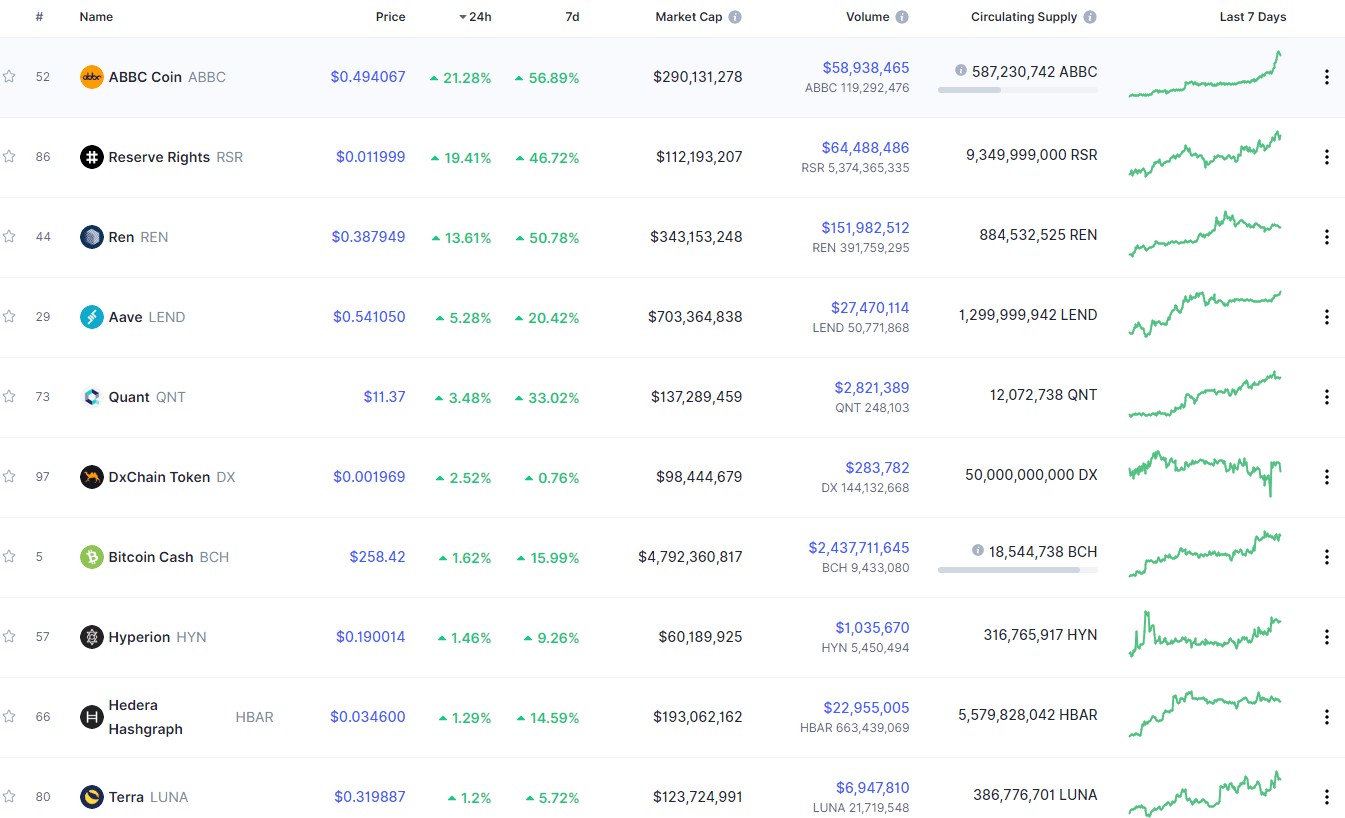
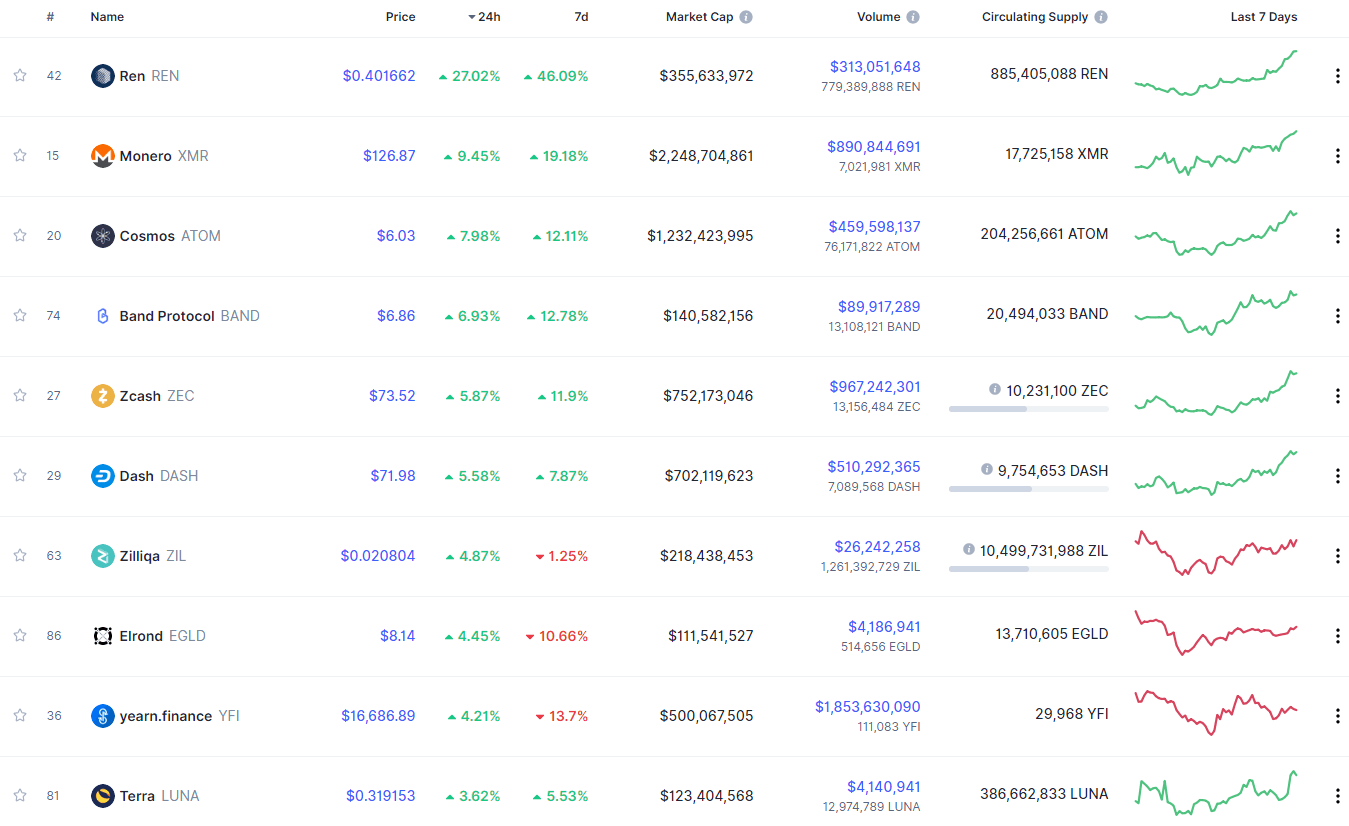
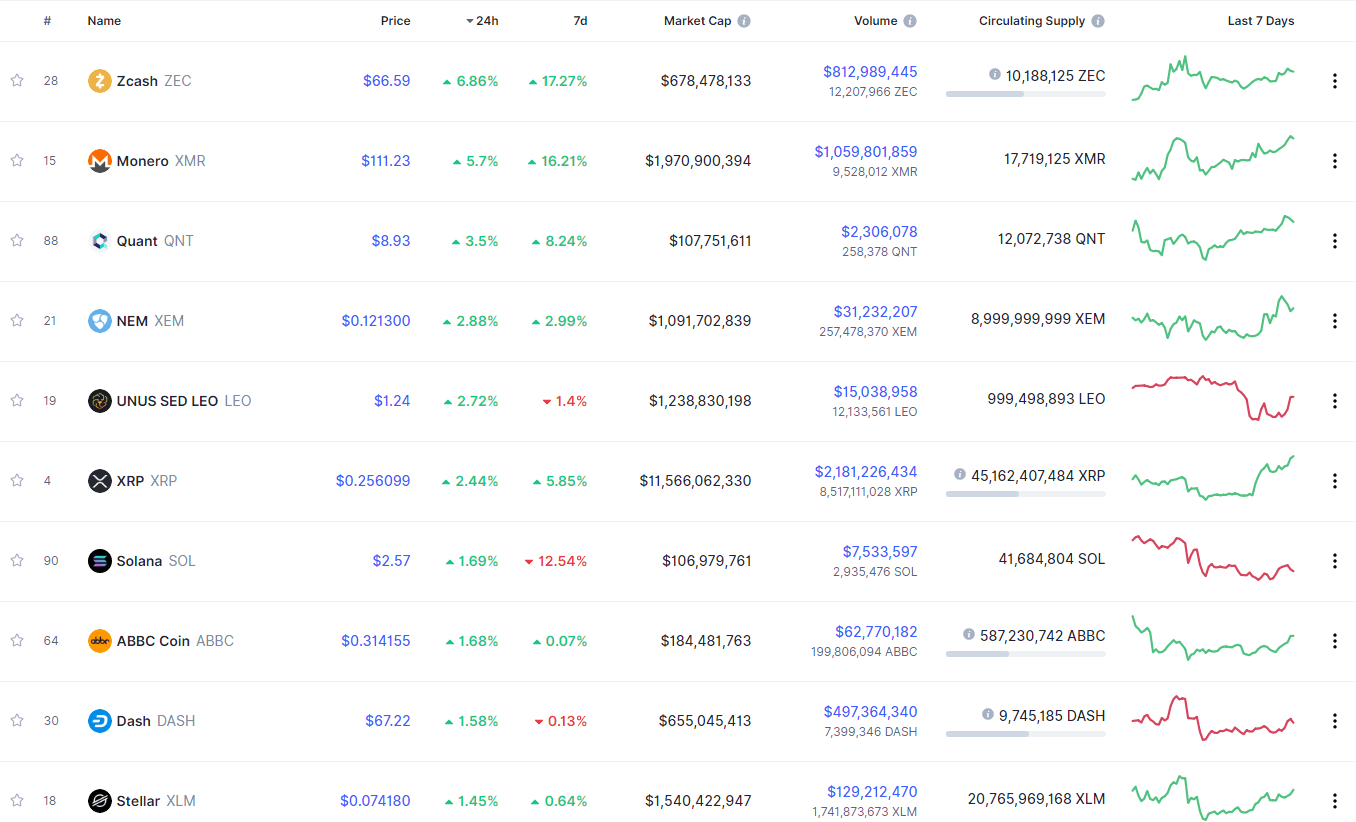
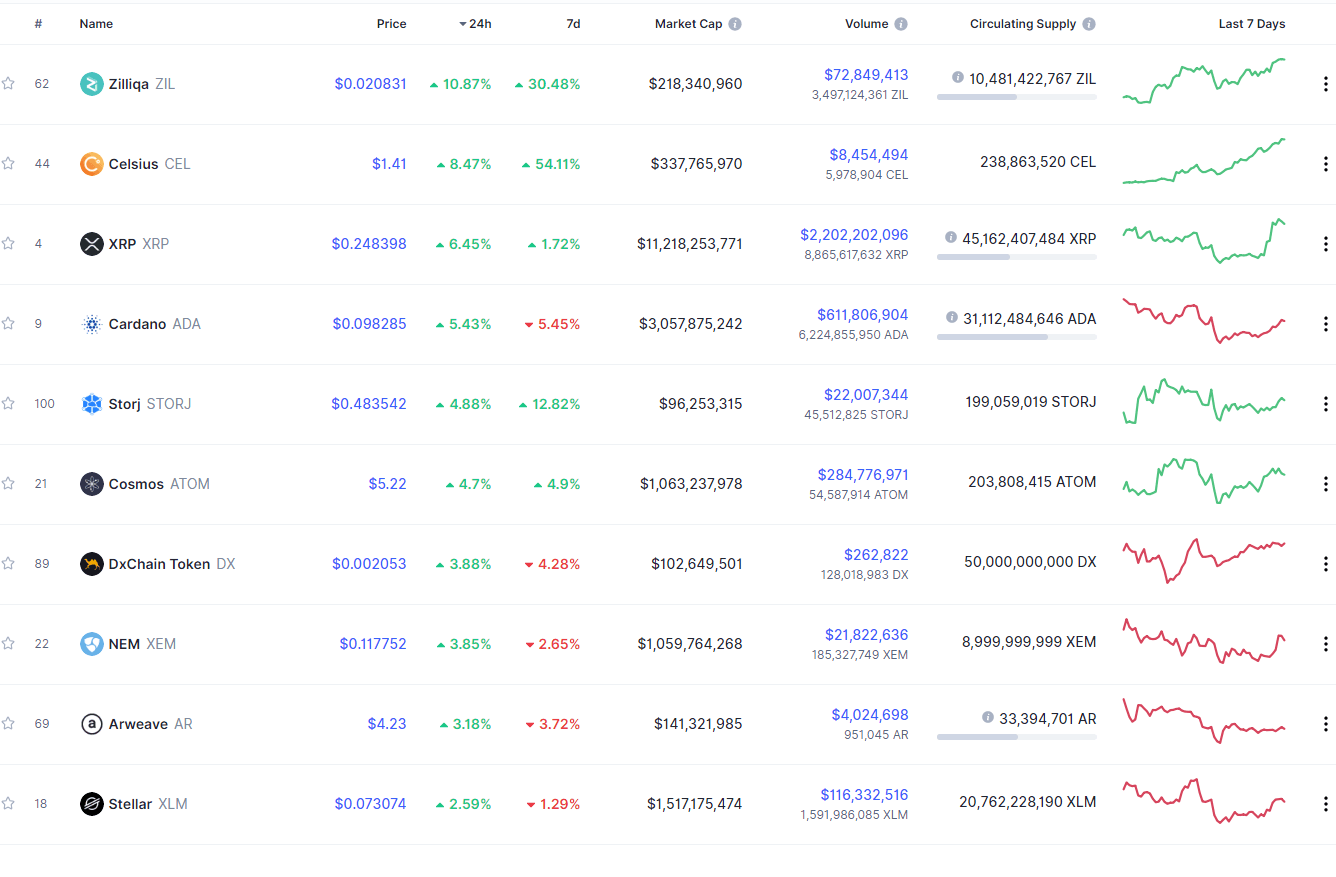
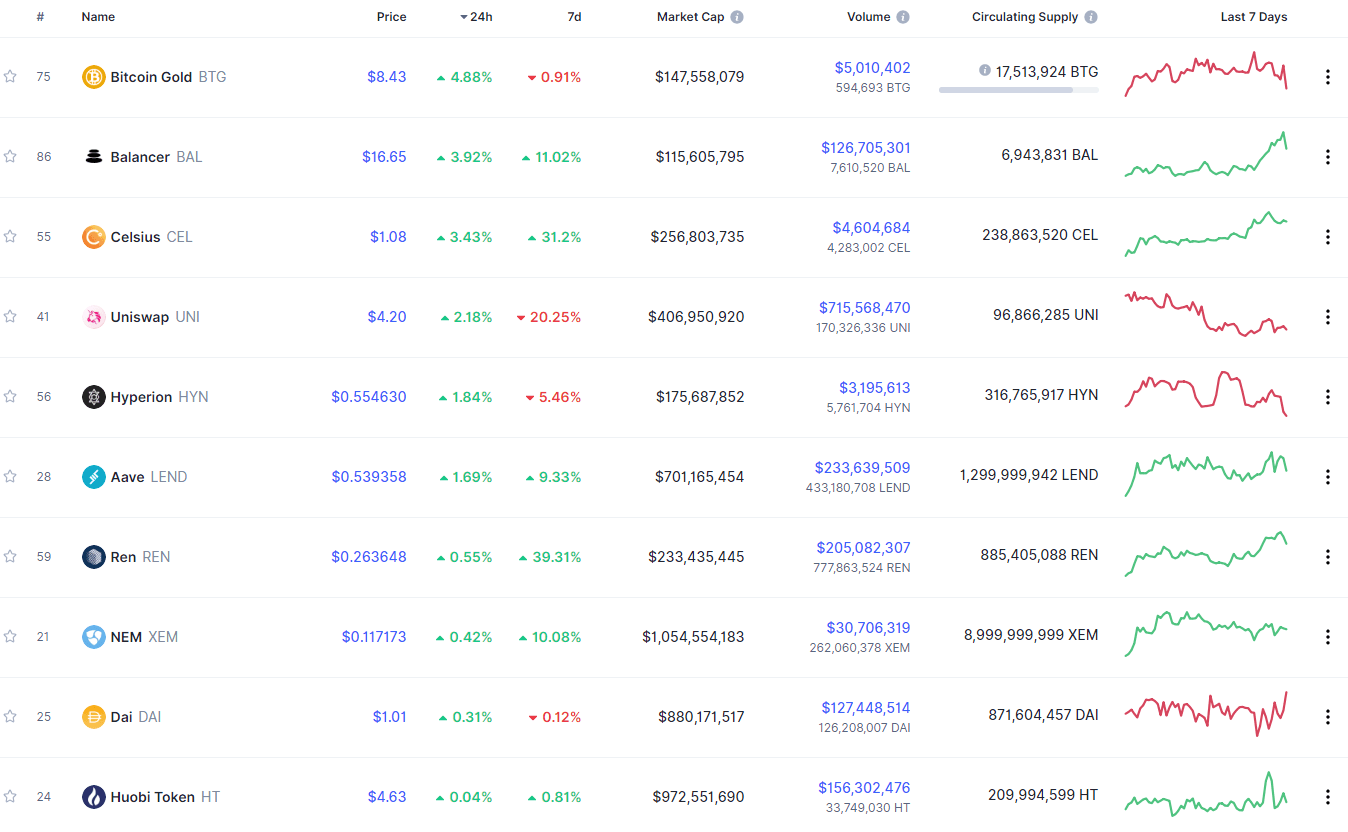
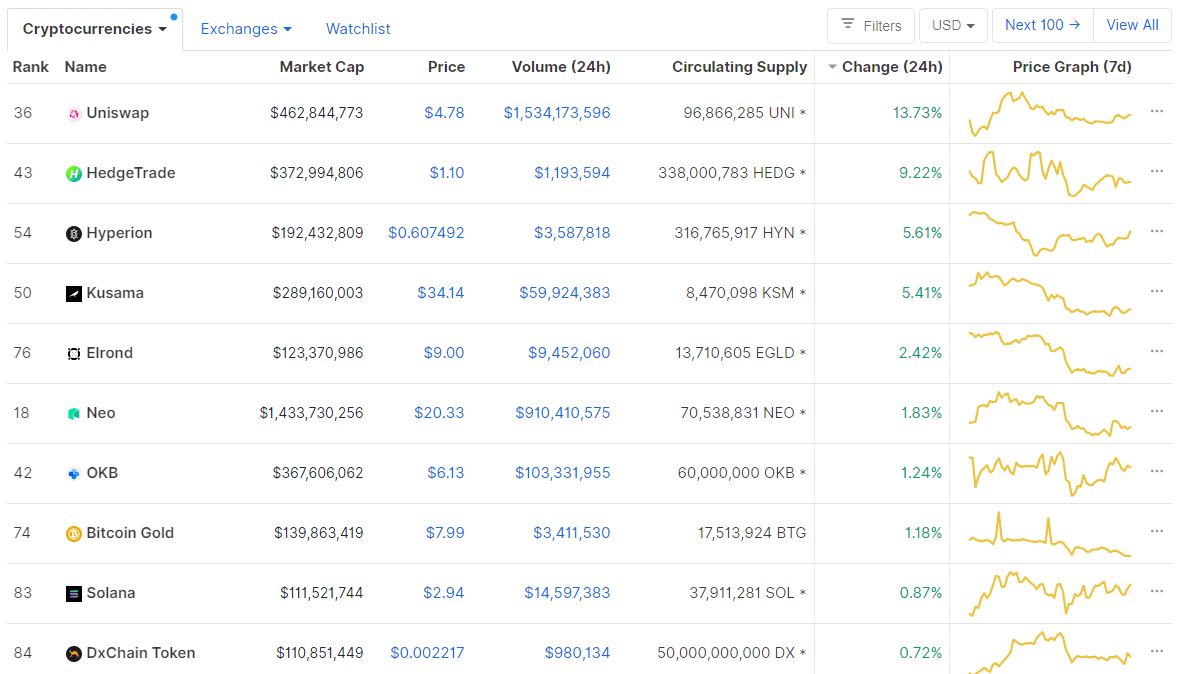
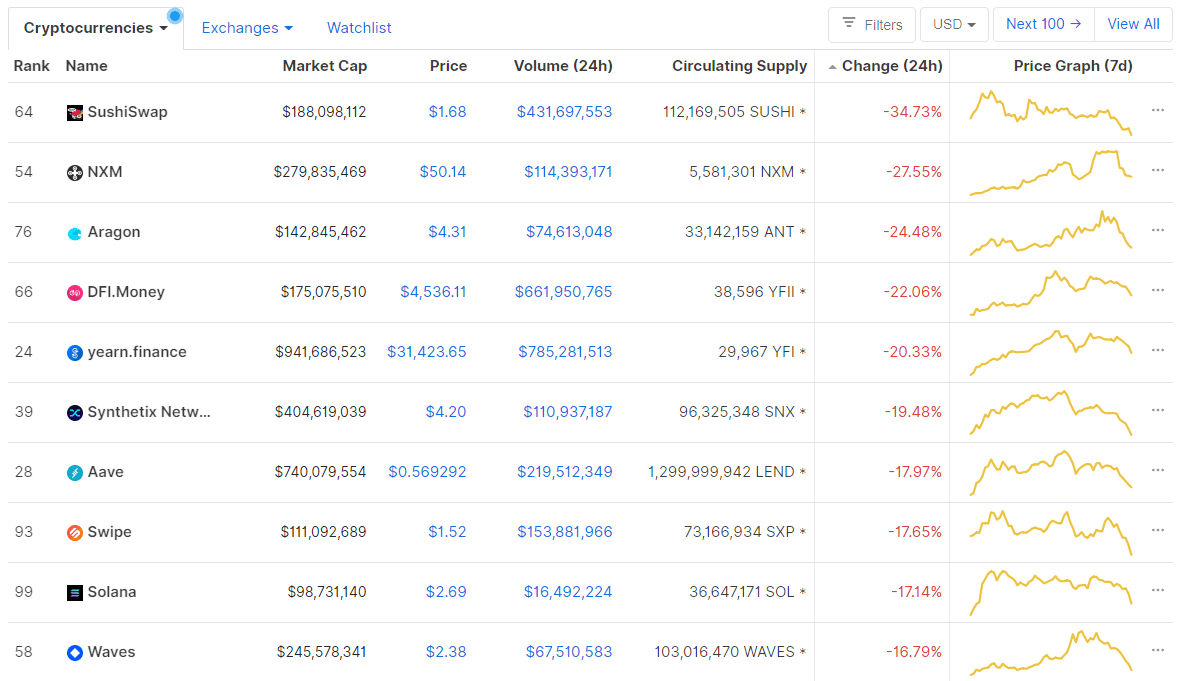
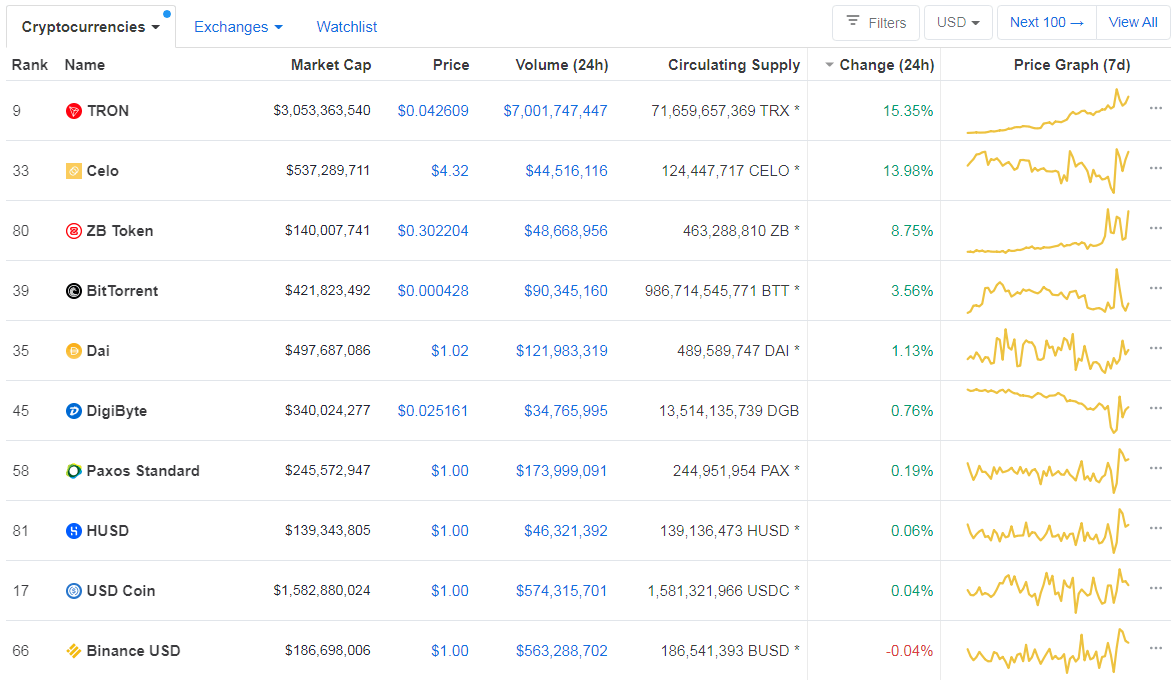
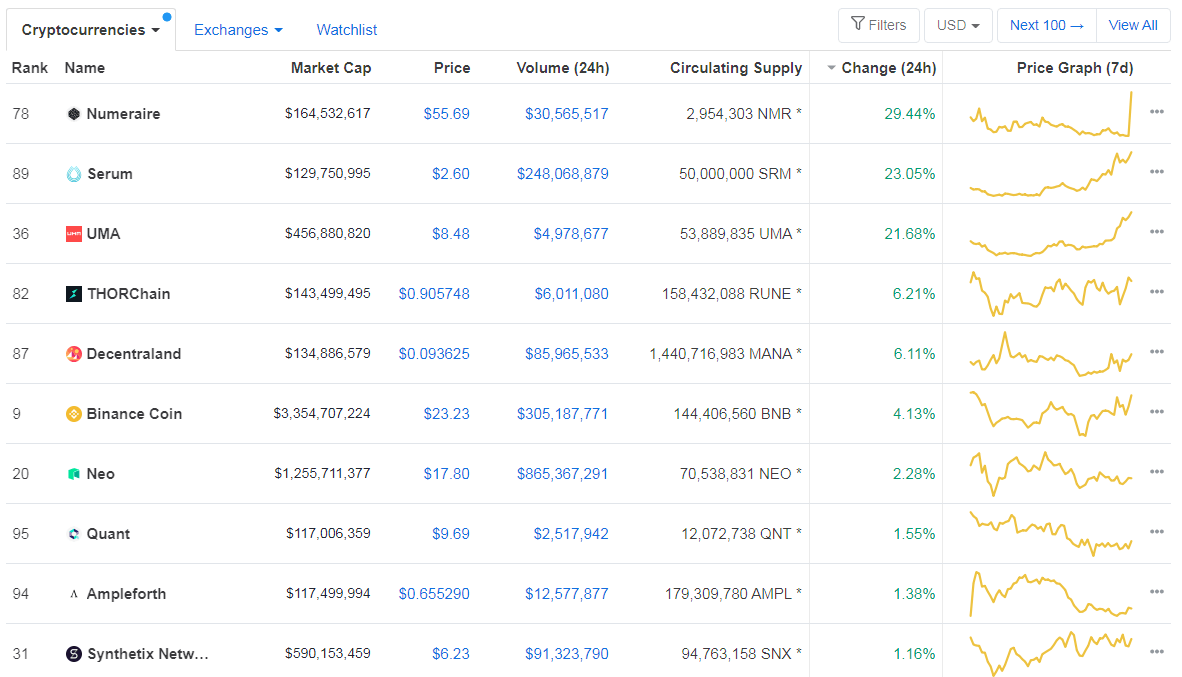
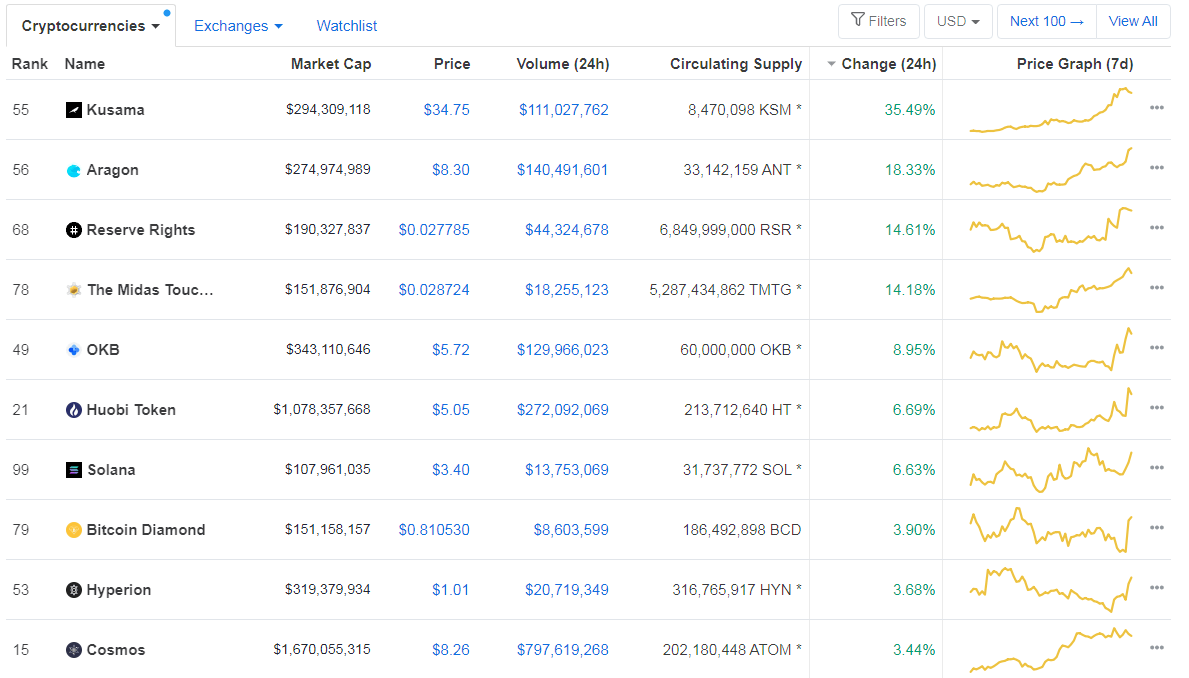
Top 10 24-hour Performers (Click to enlarge)
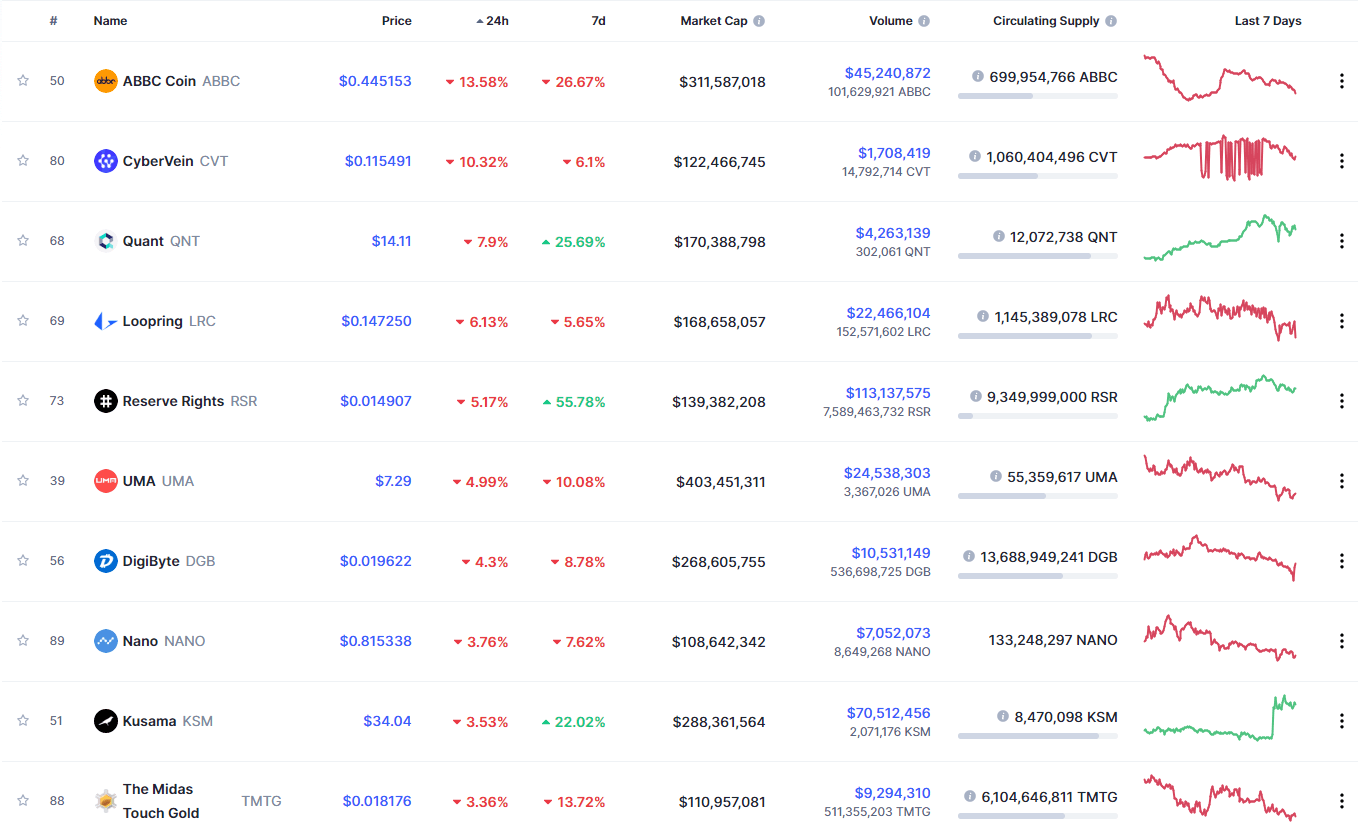
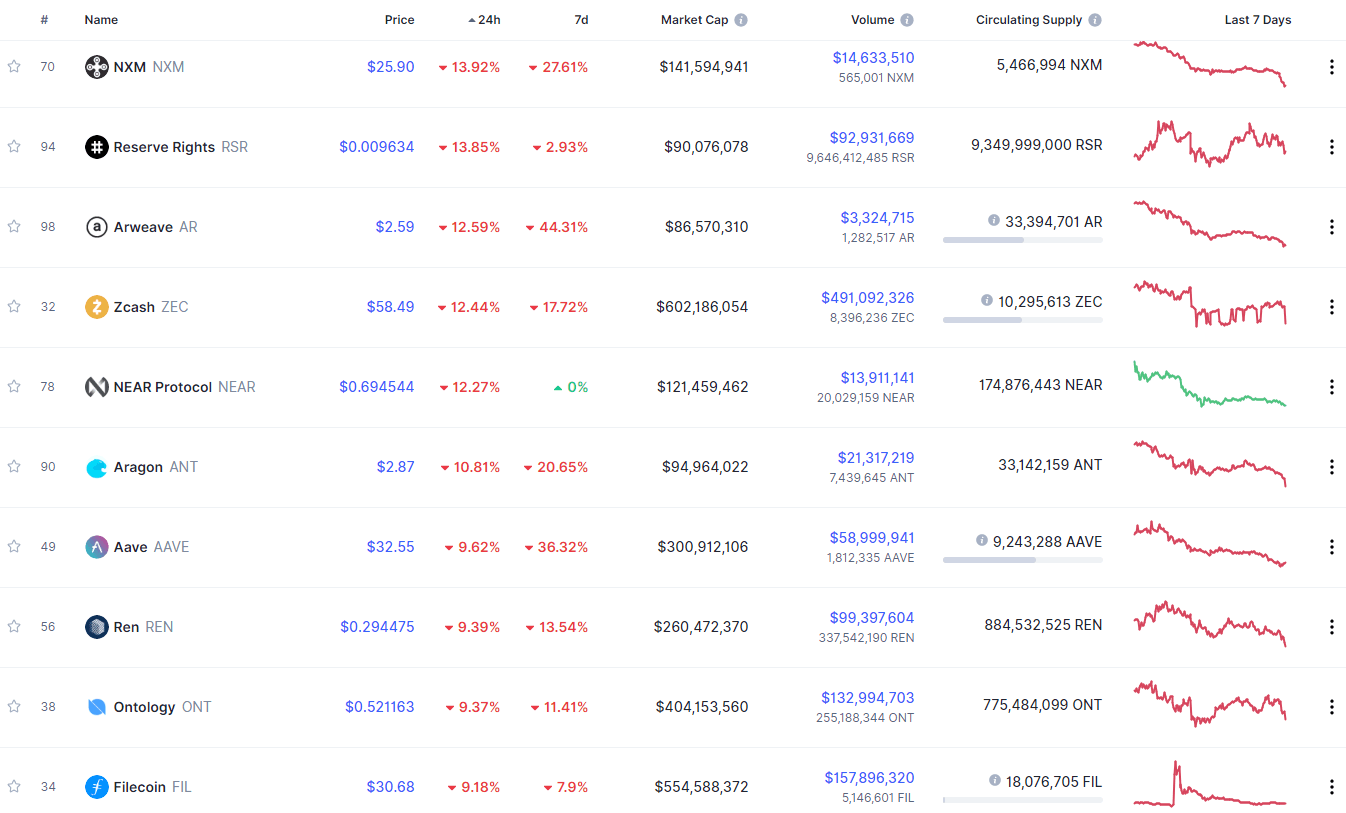
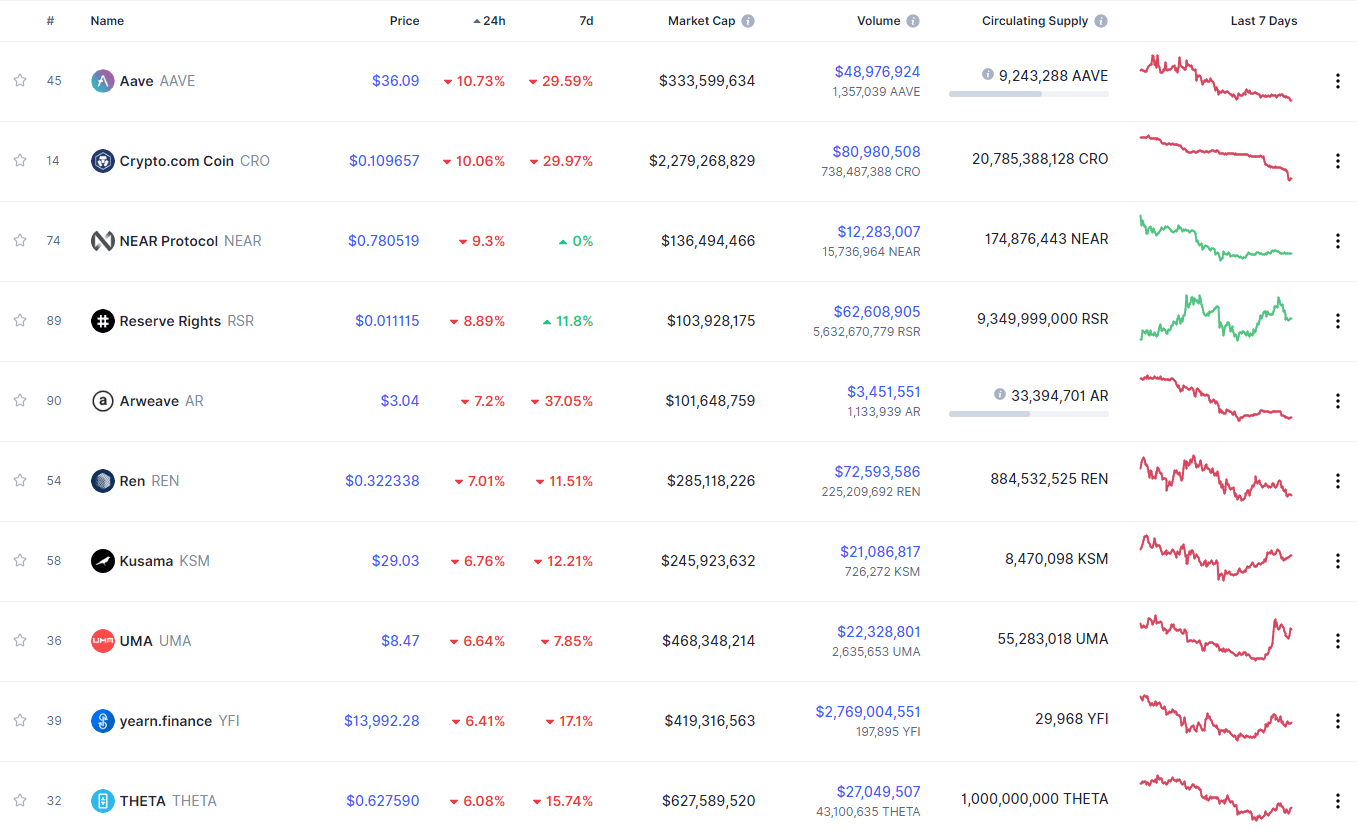
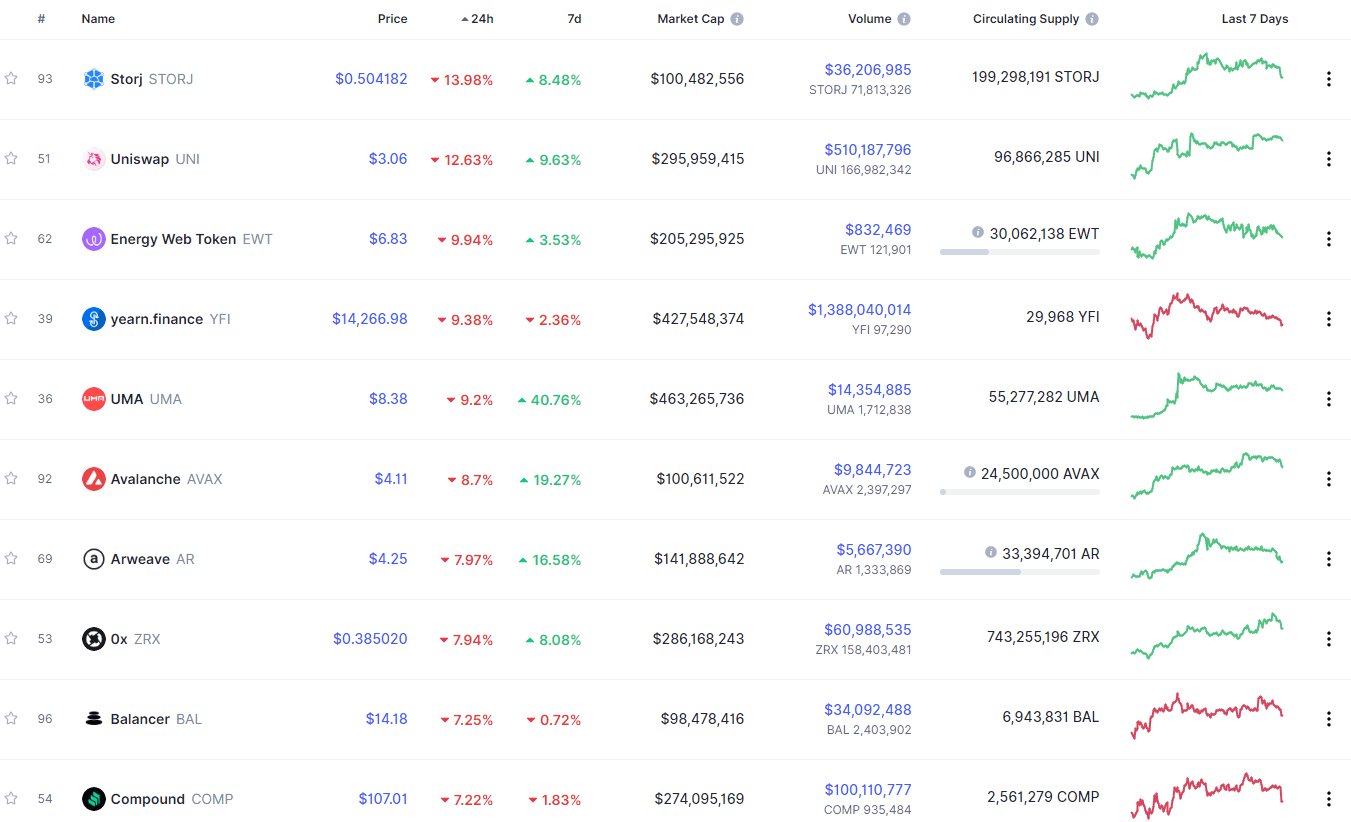
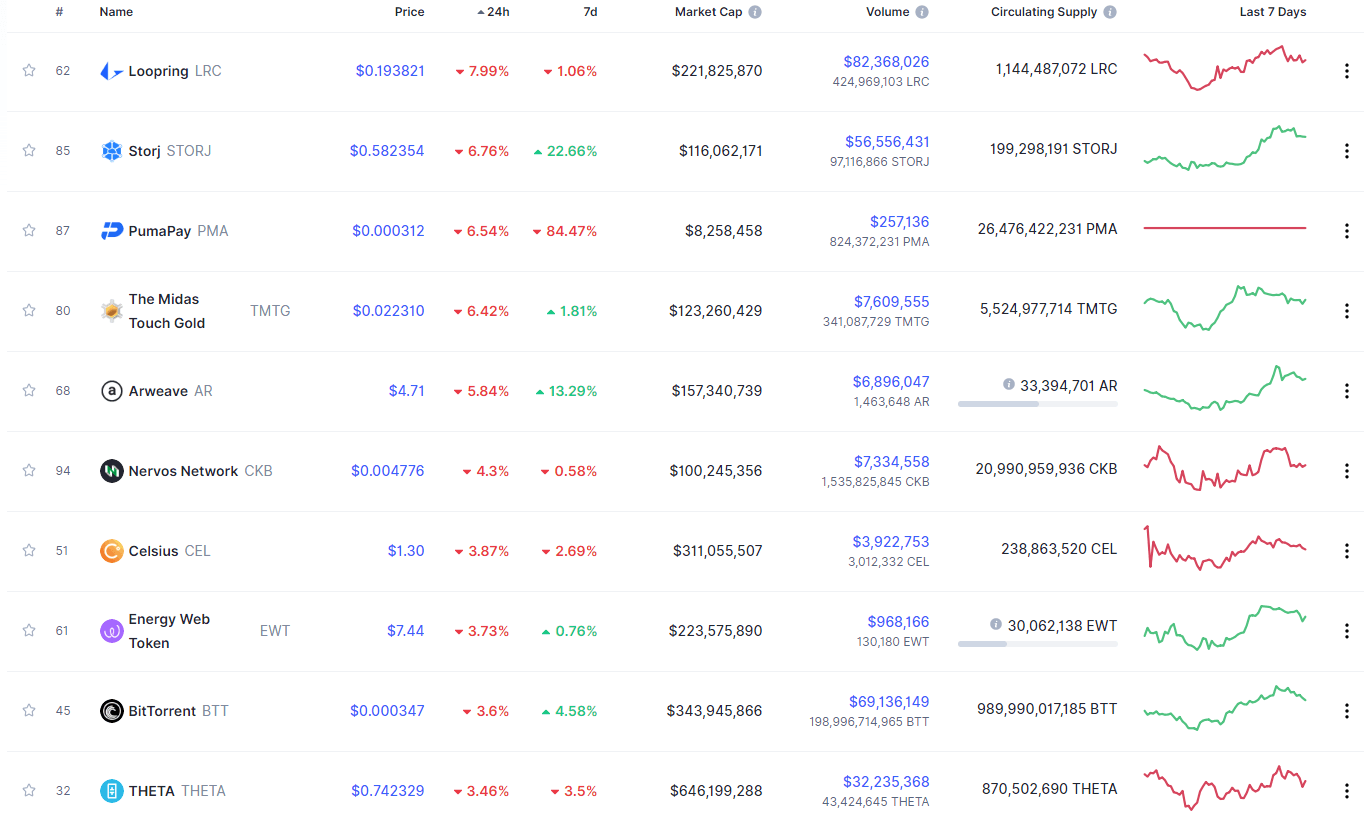
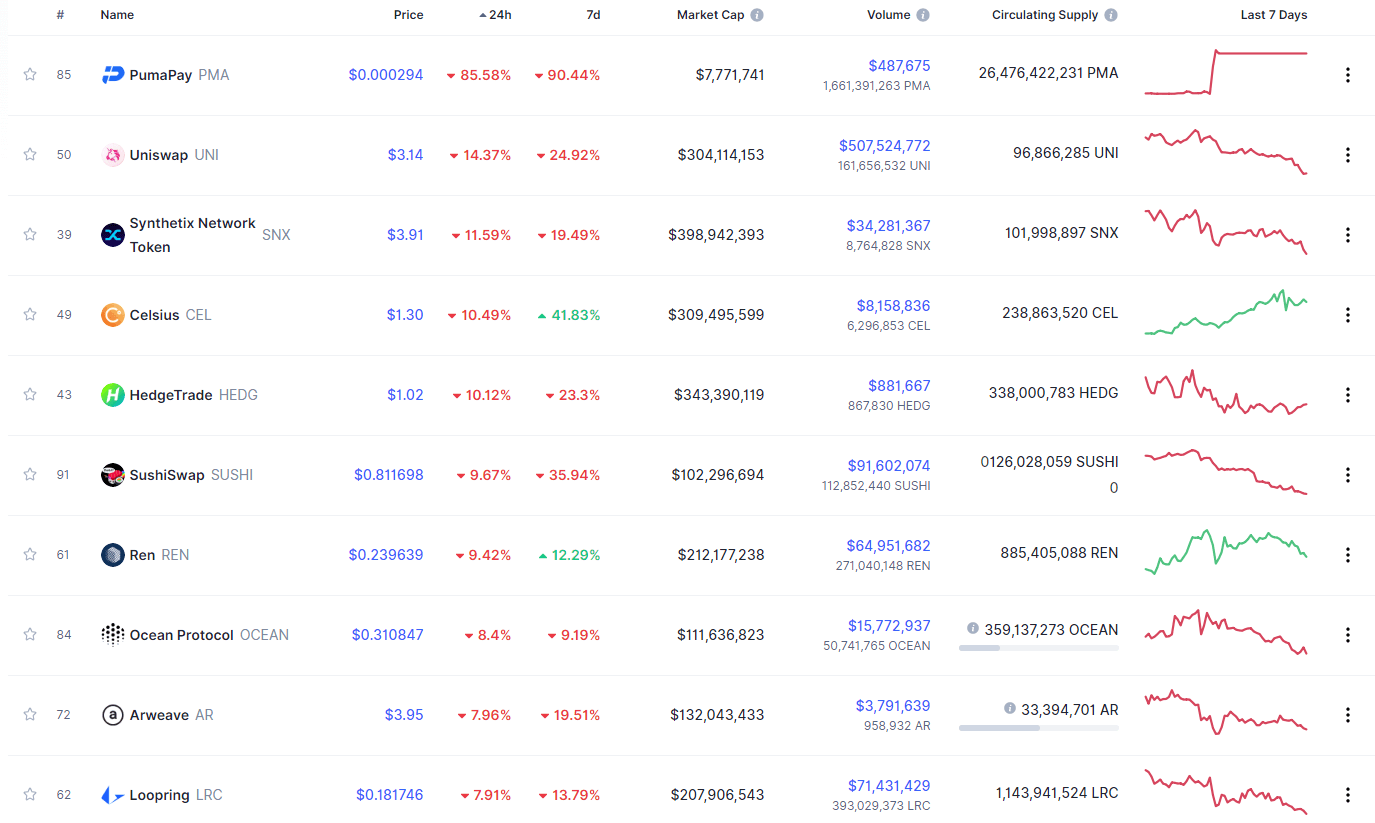
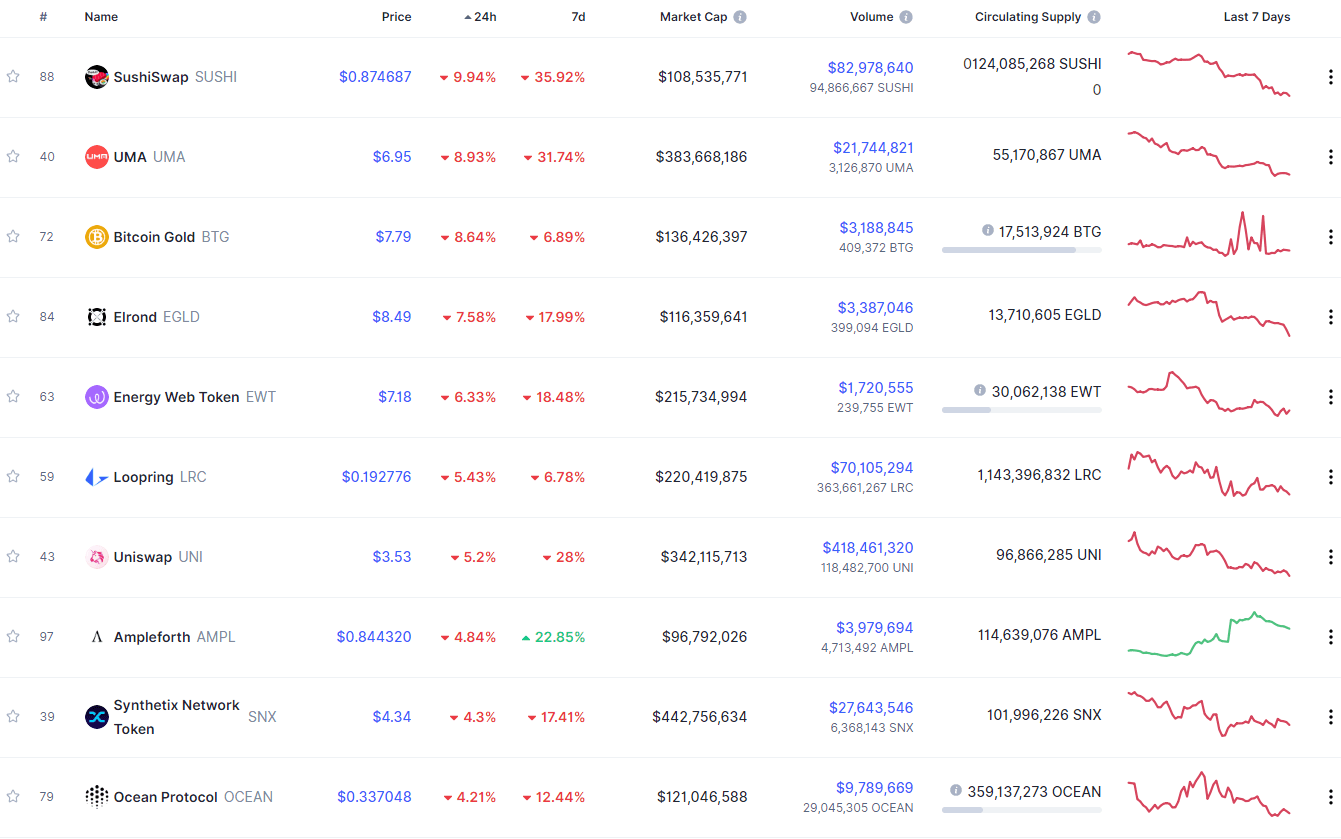
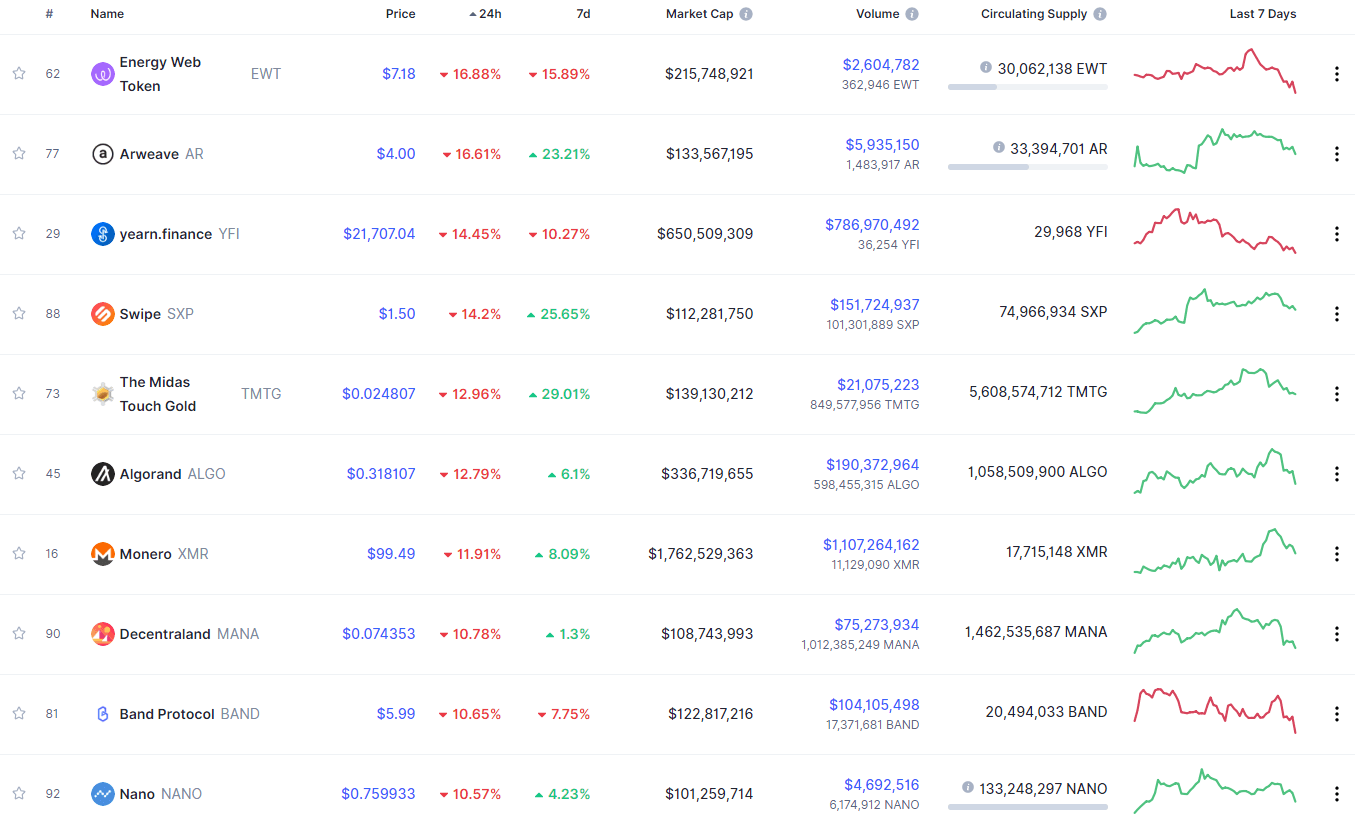
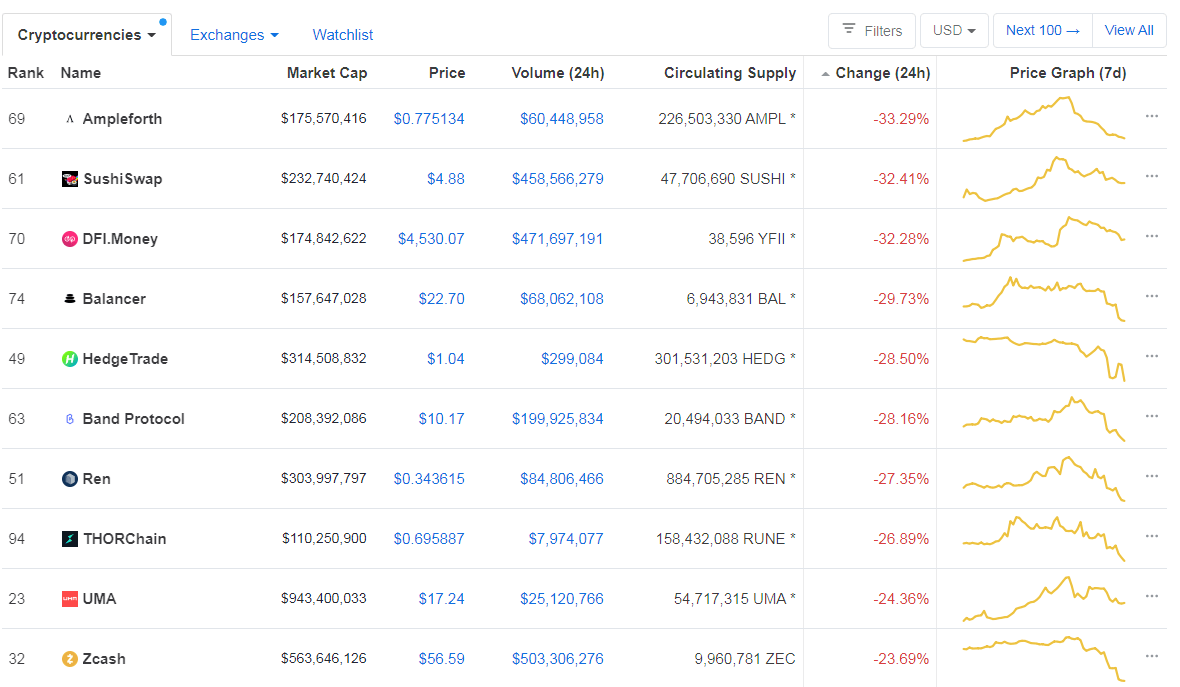
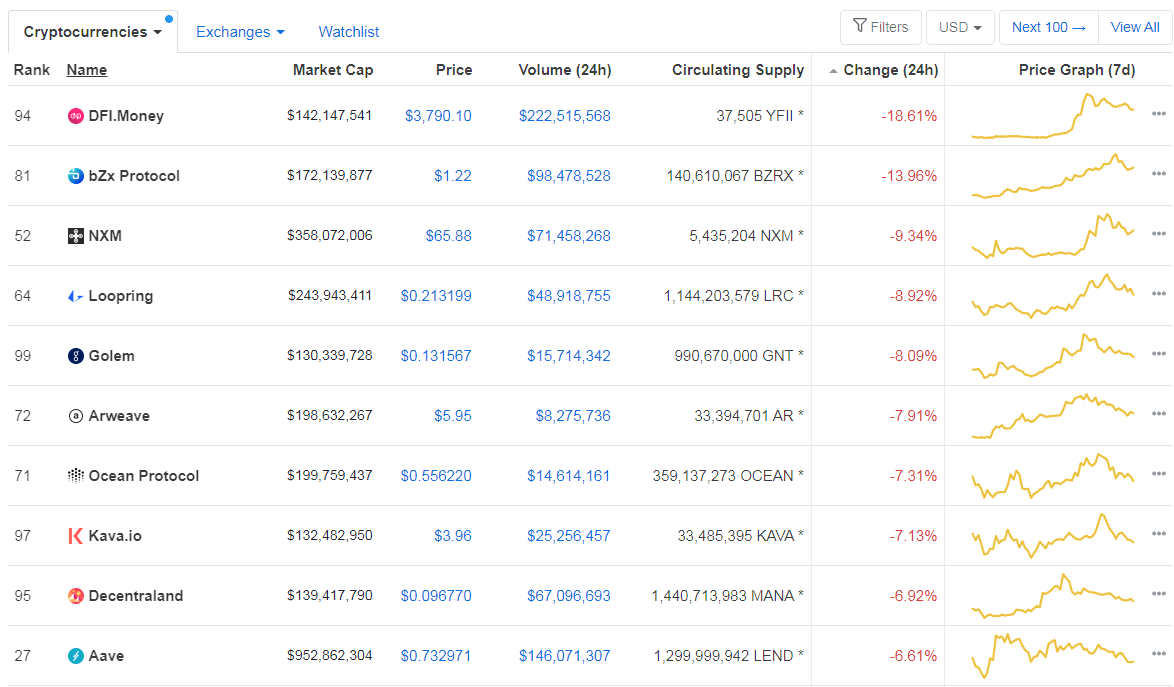
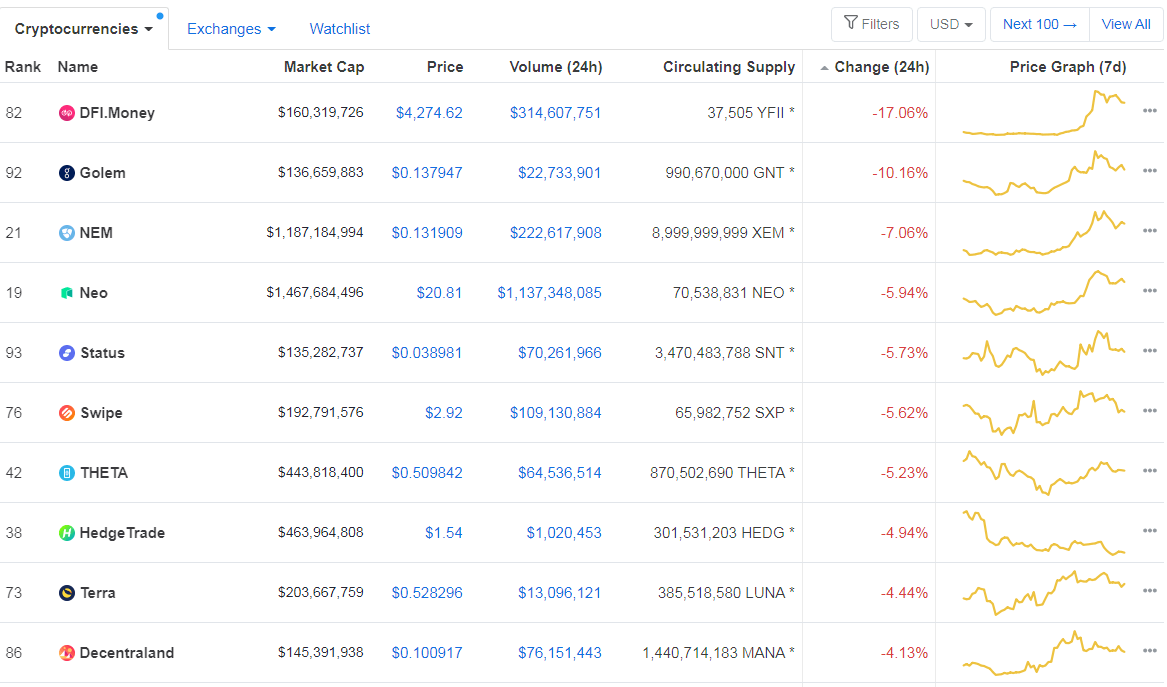
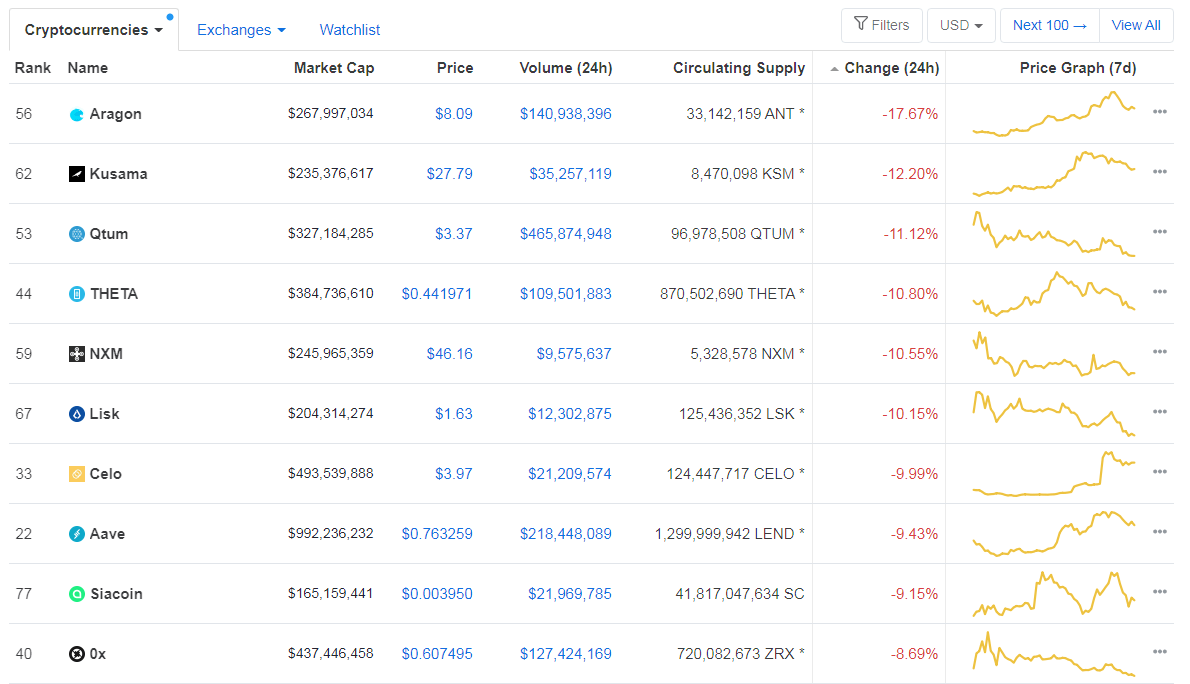
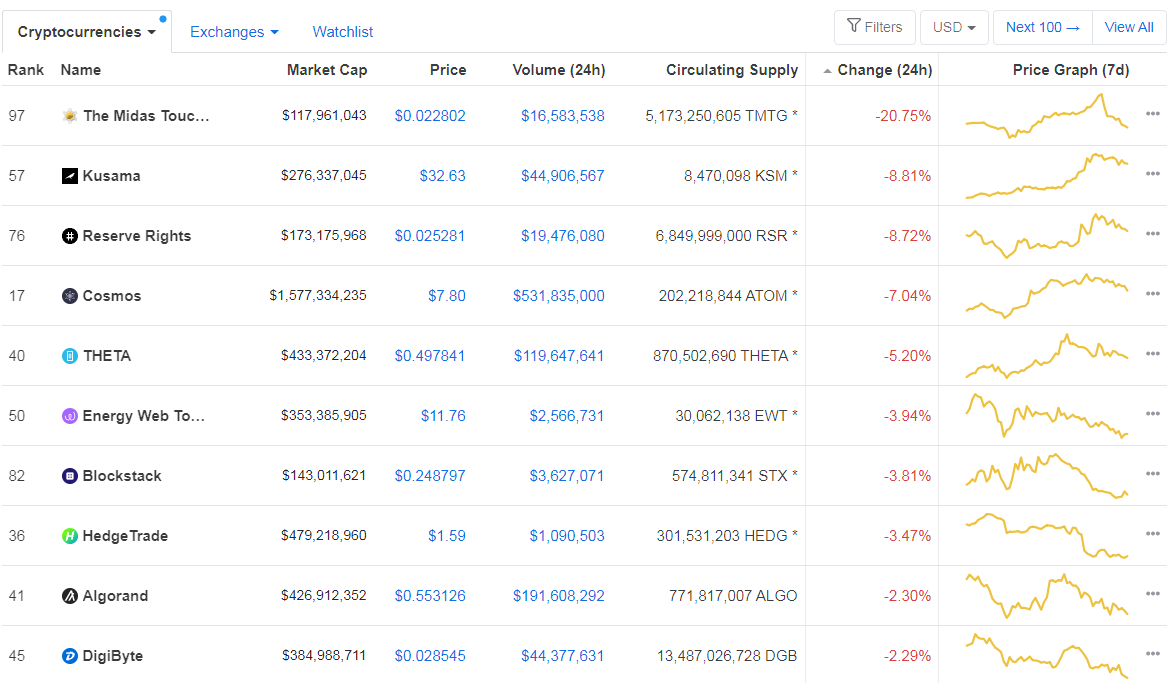
Bottom 10 24-hour Performers (Click to enlarge)
Bitcoin’s market dominance level had increased quite a bit since we last reported, with its value is currently 62.4%. This value represents a 0.8% difference to the upside when compared to when we last reported.
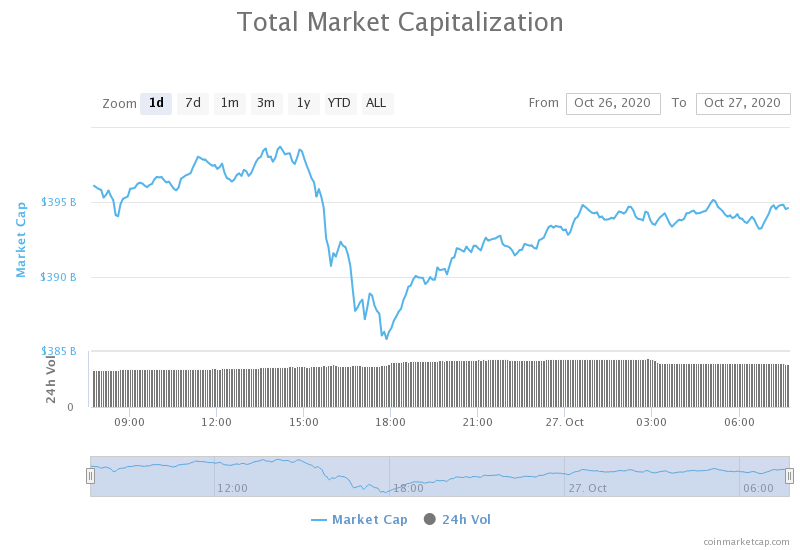
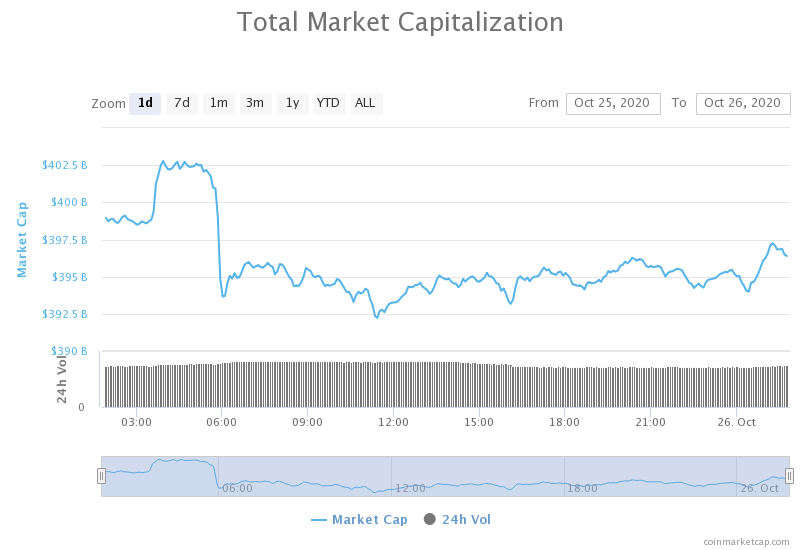
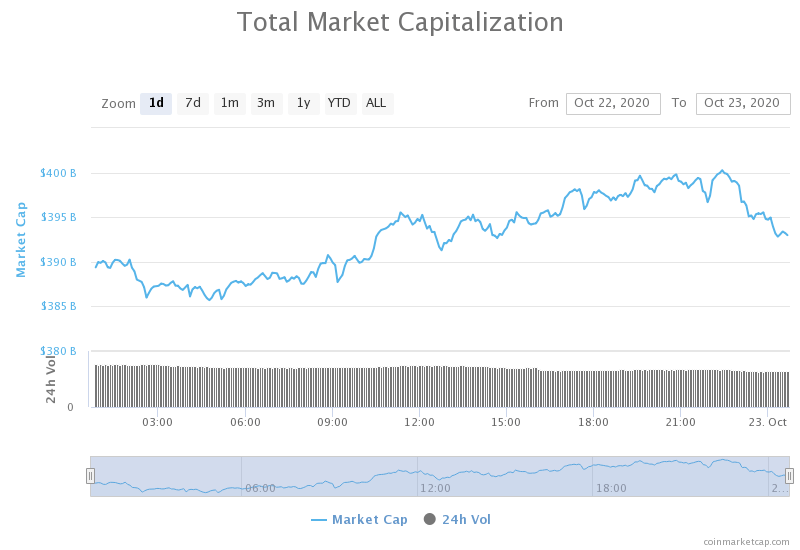
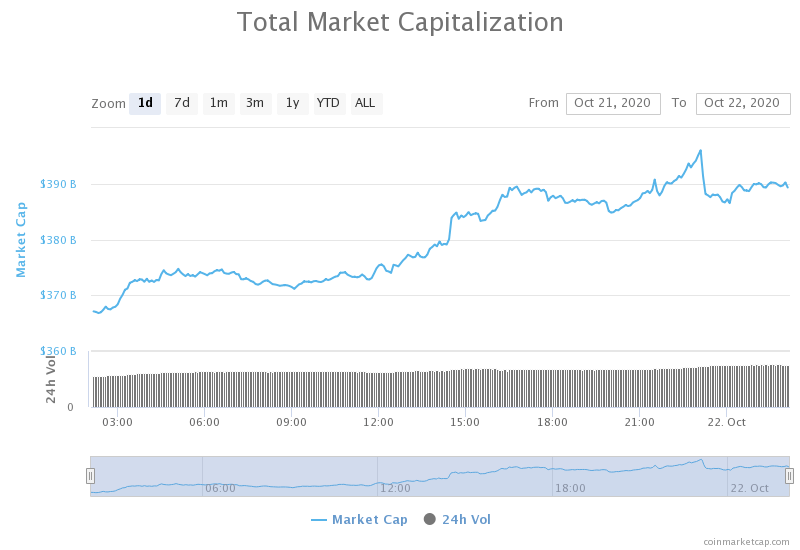
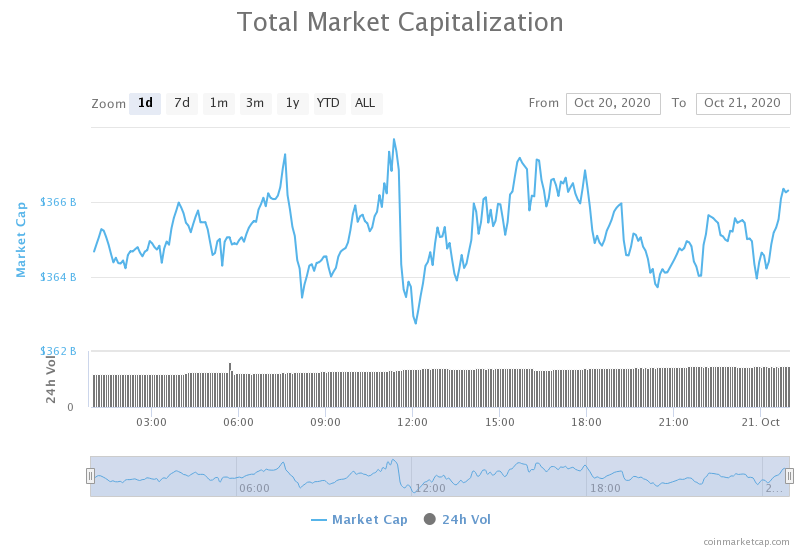
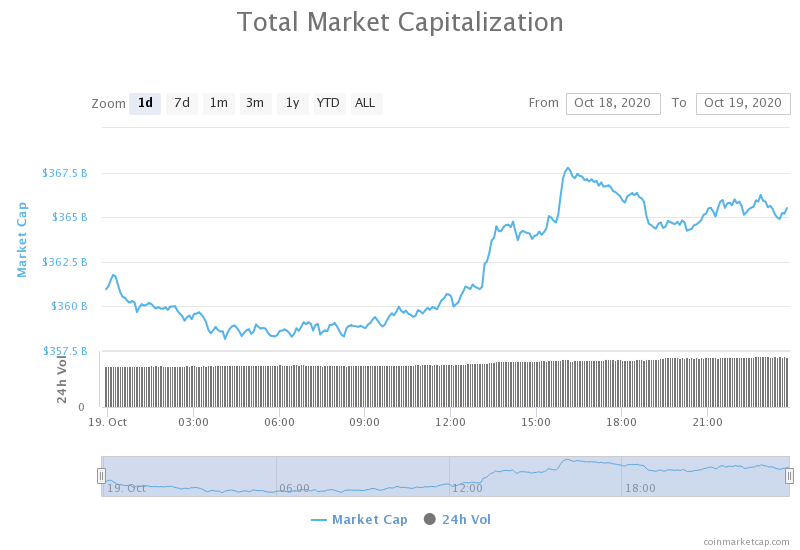
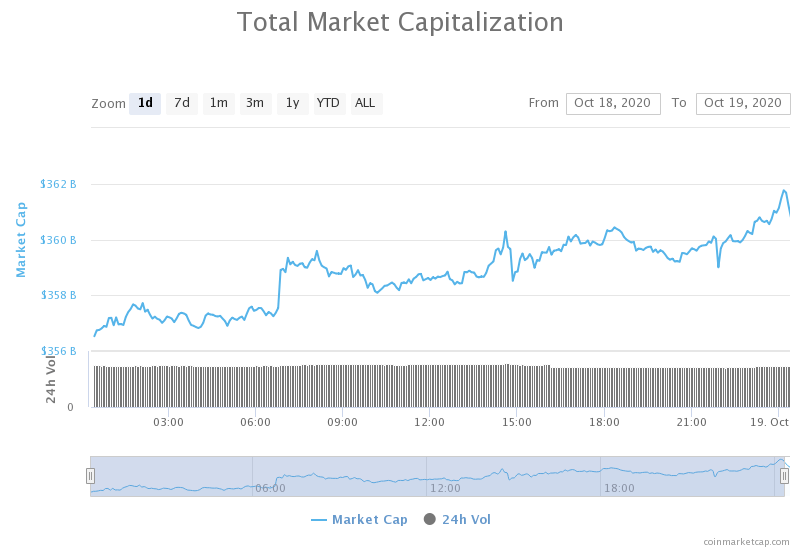
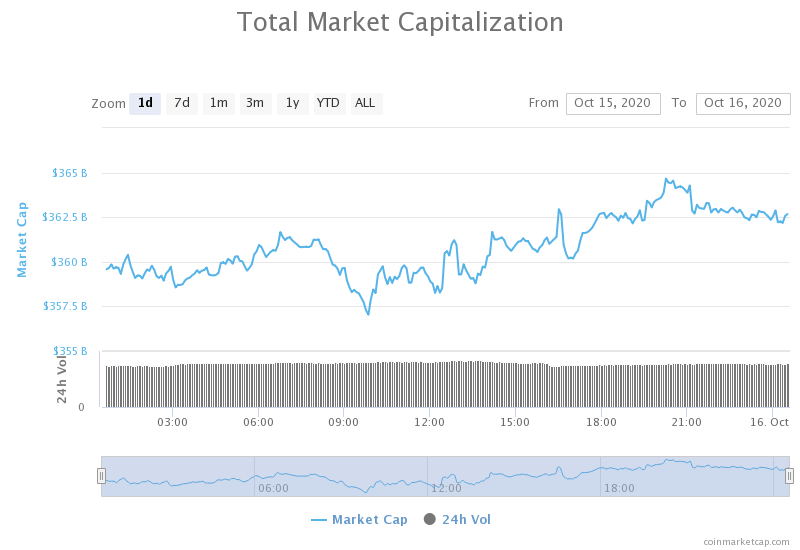
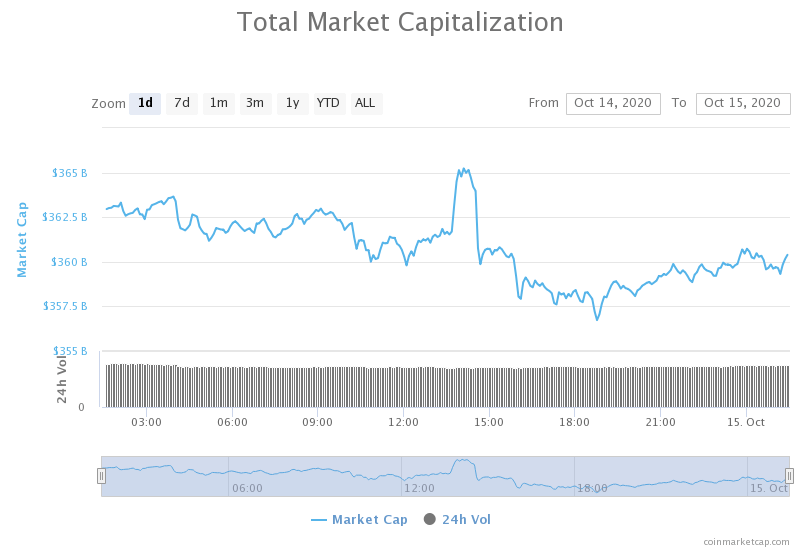
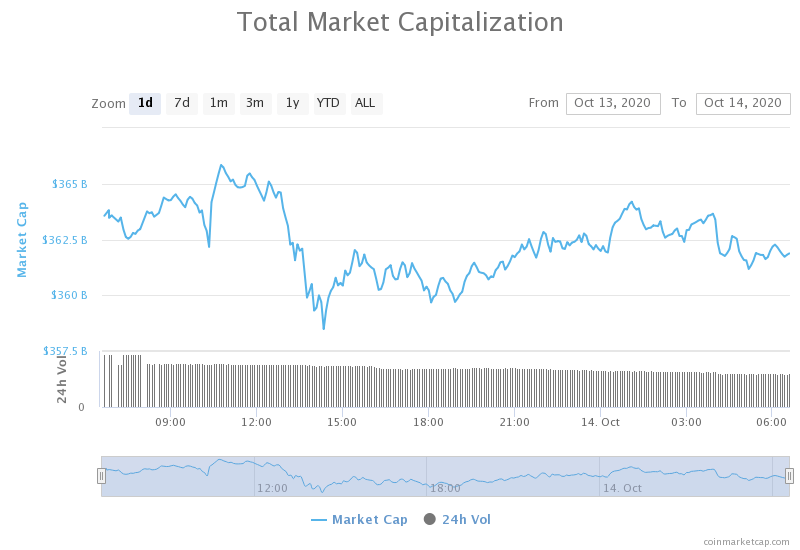
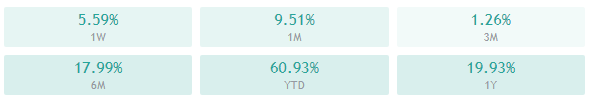
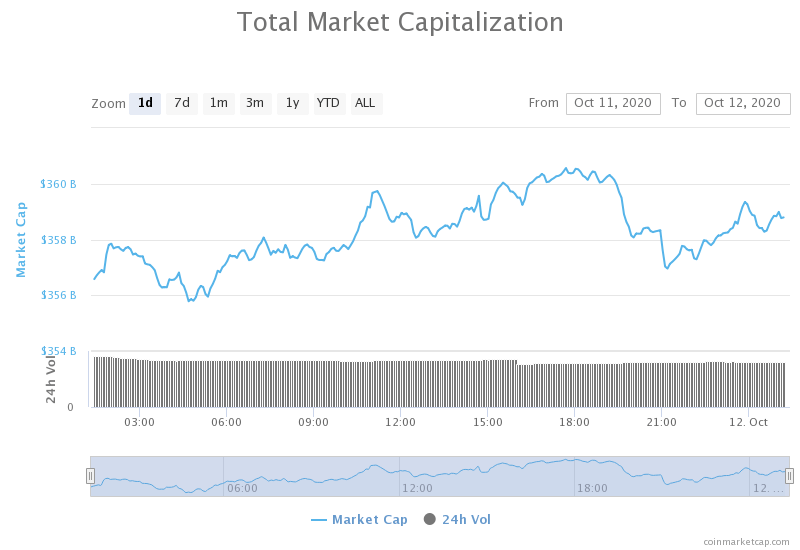
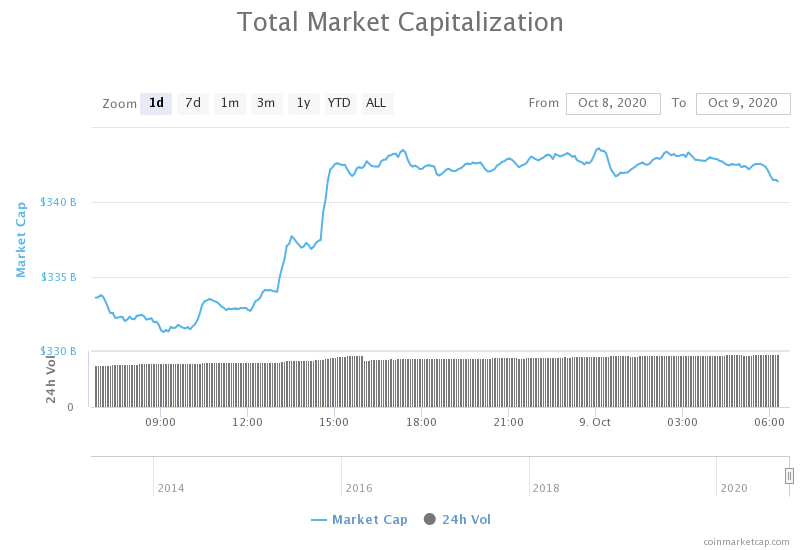
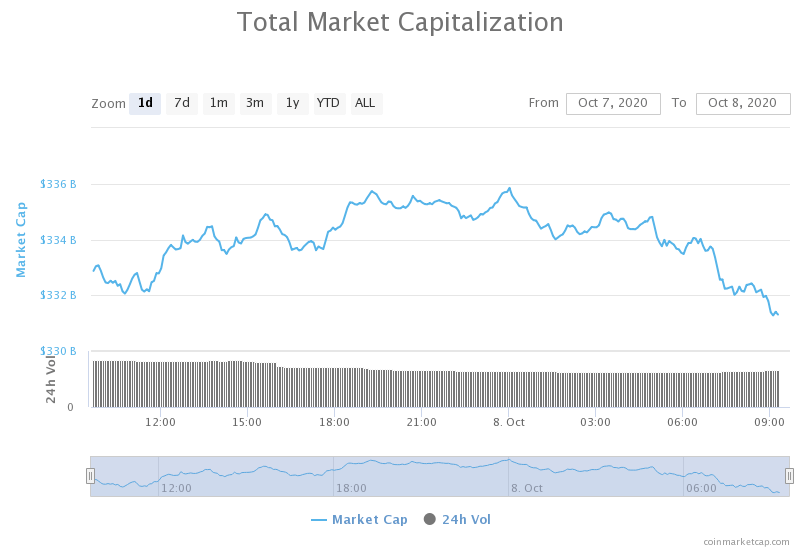
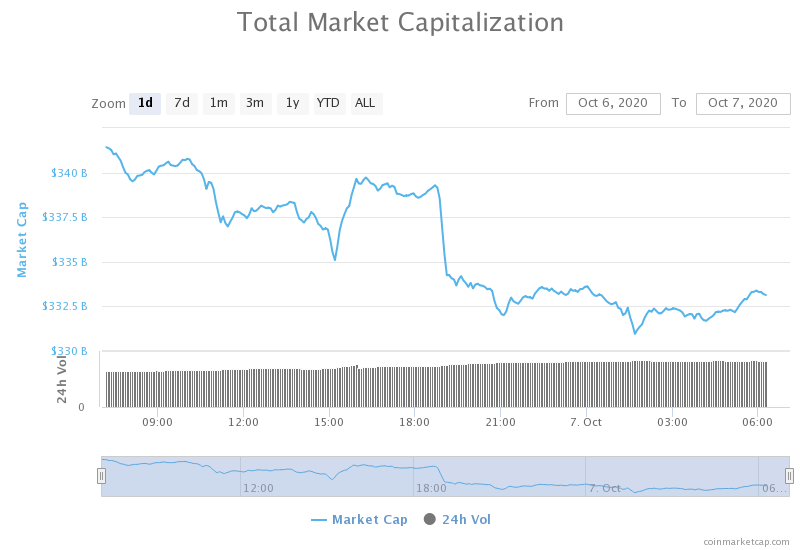
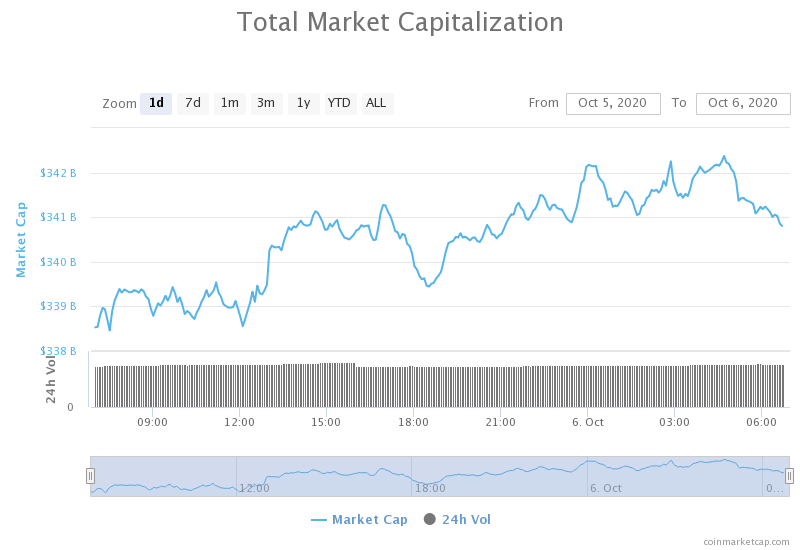
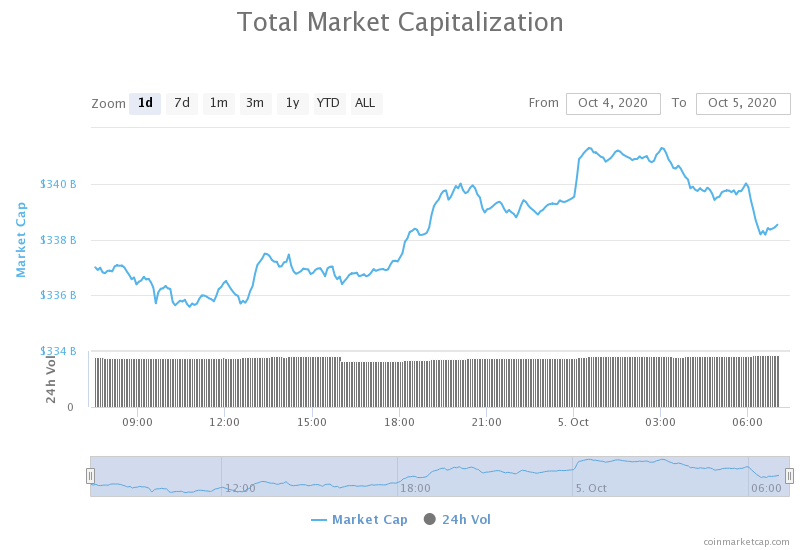
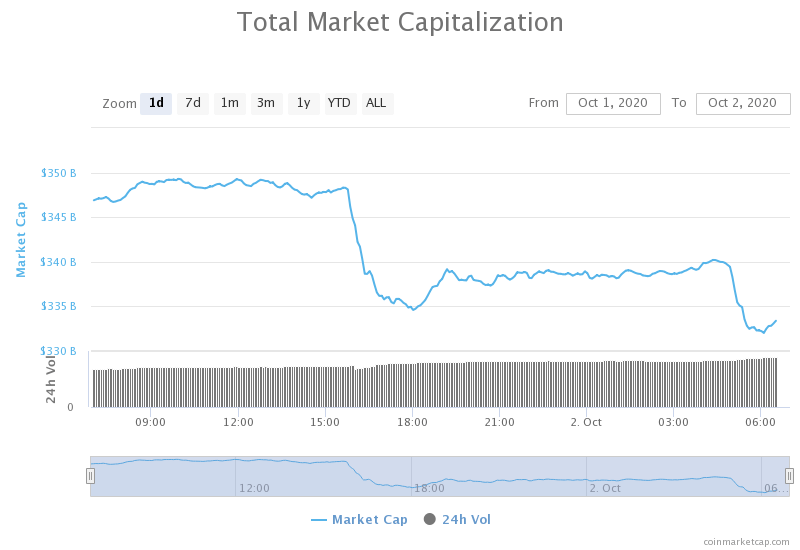
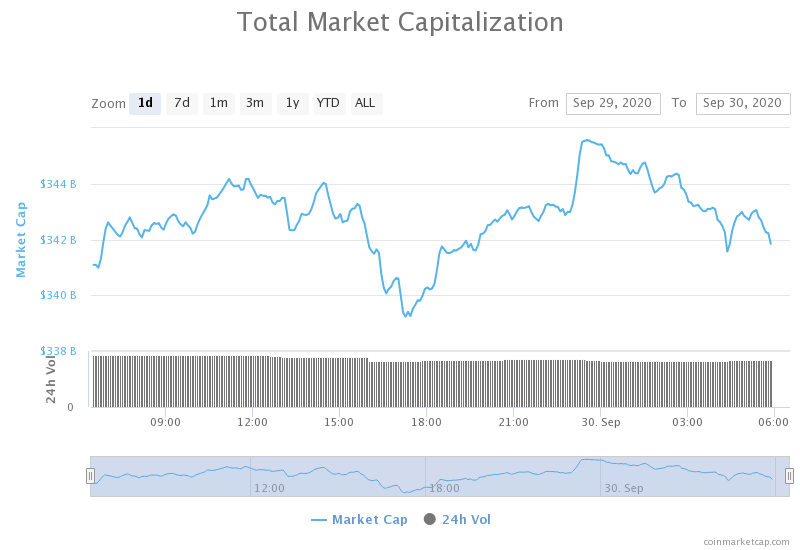
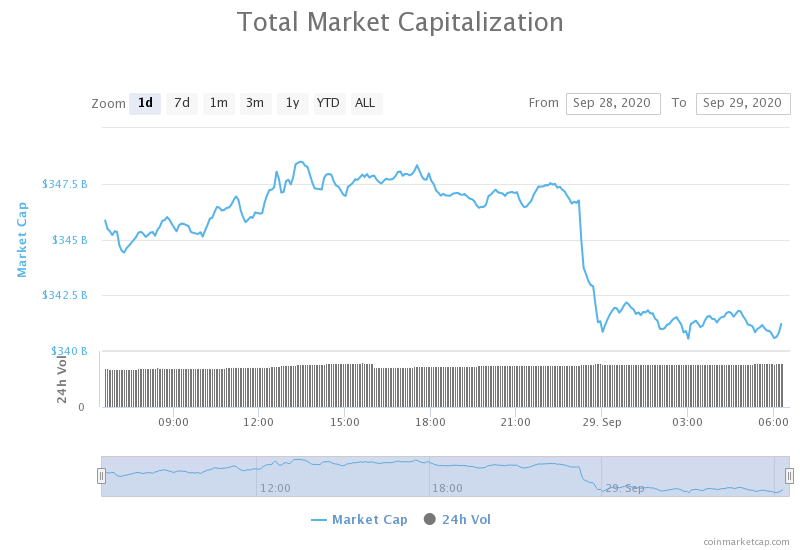
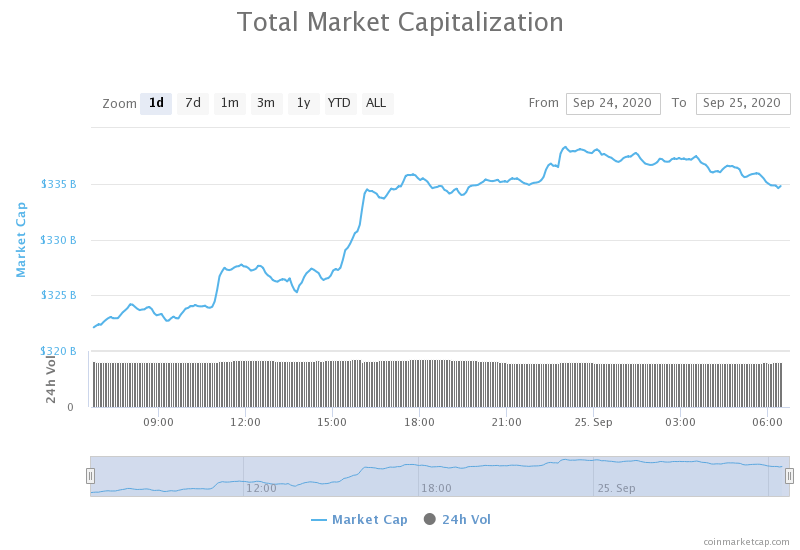
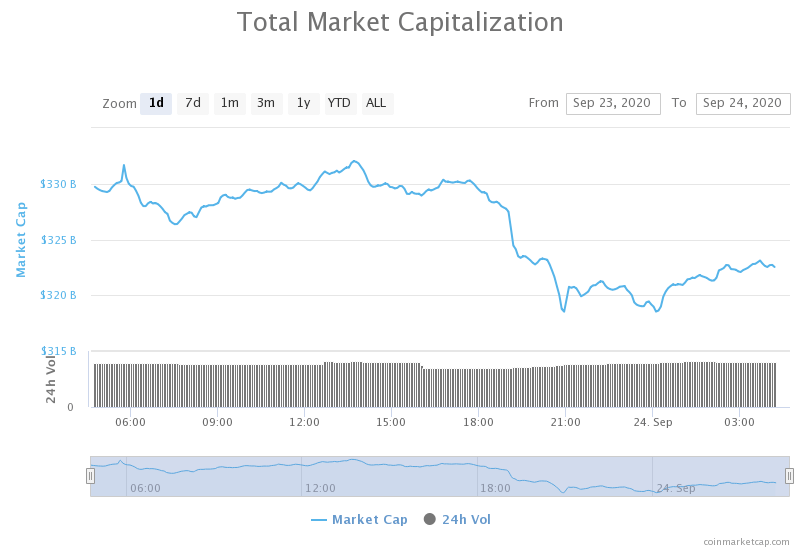
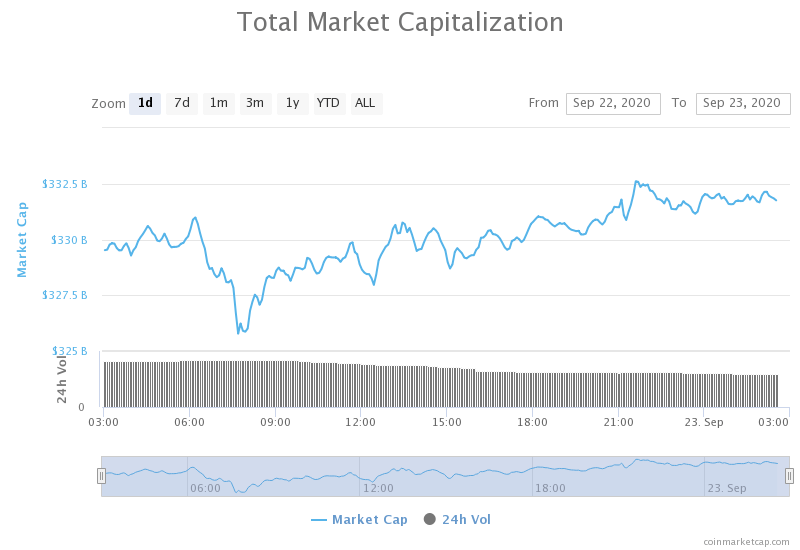
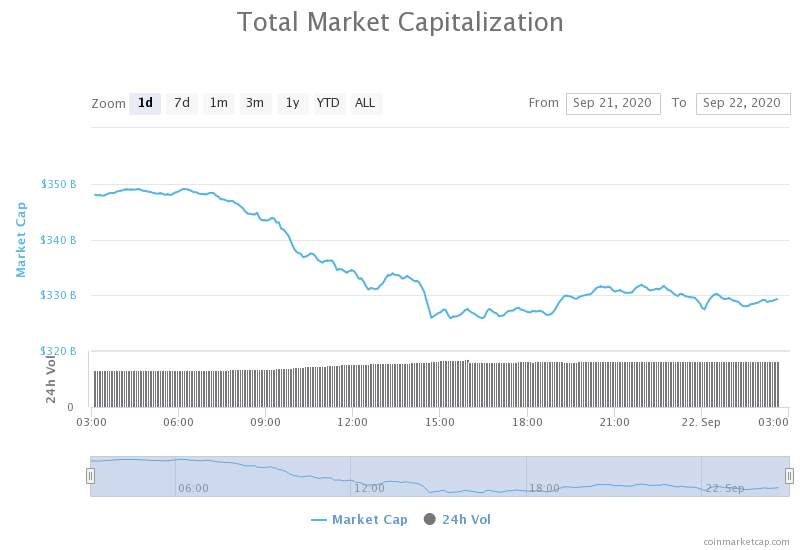
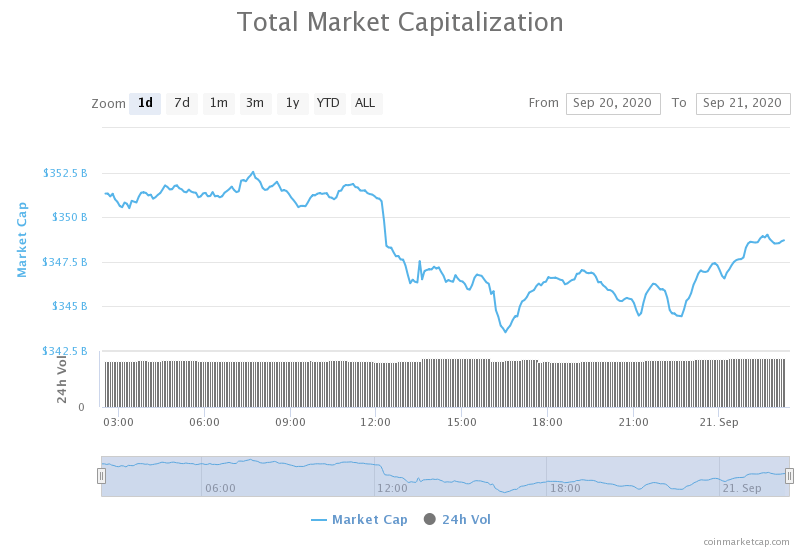
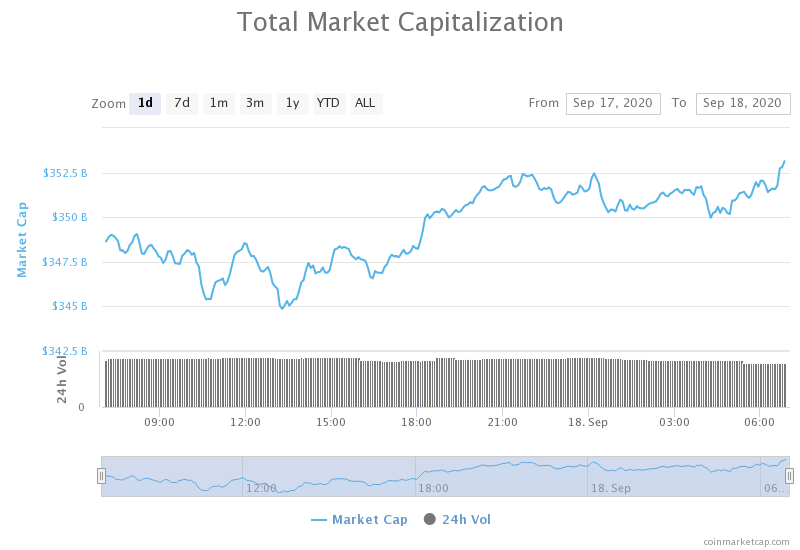
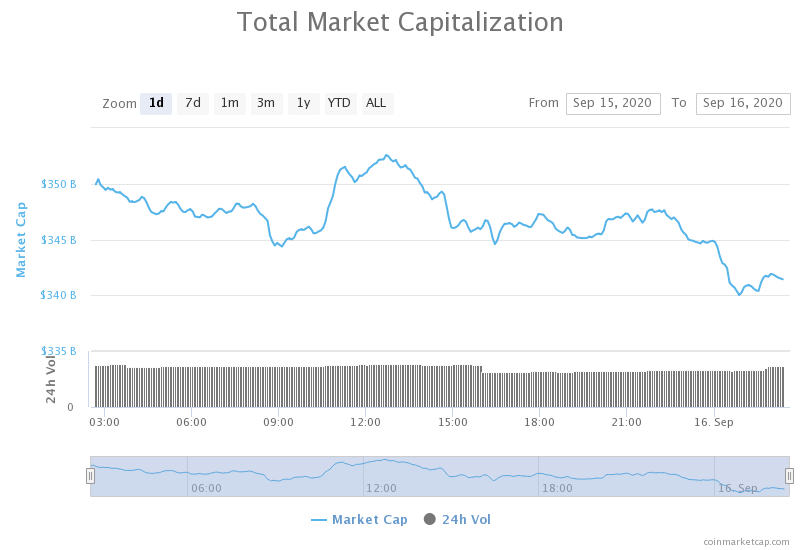
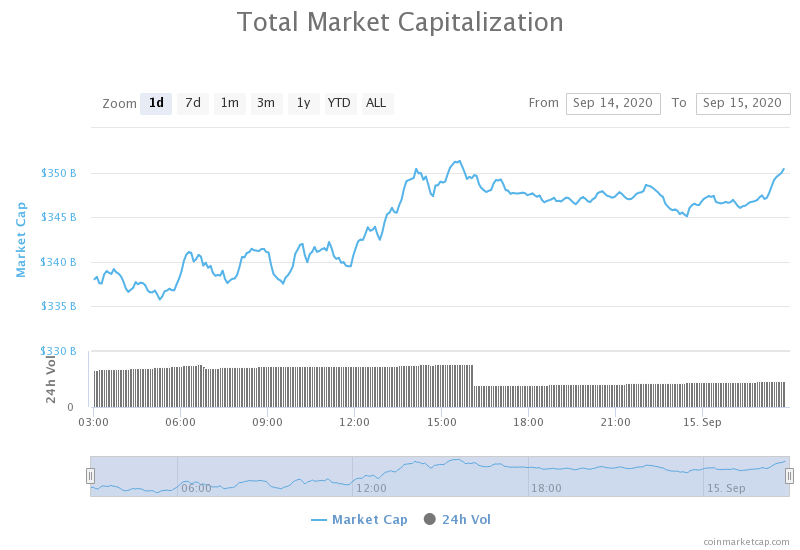
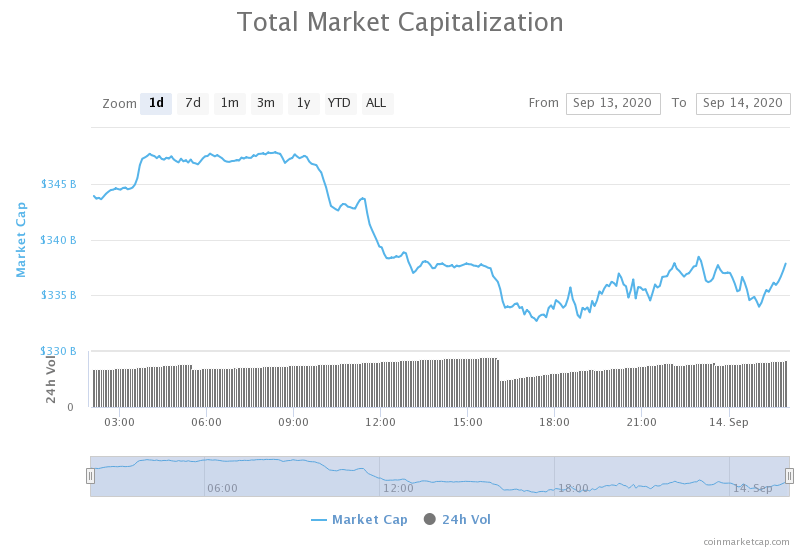
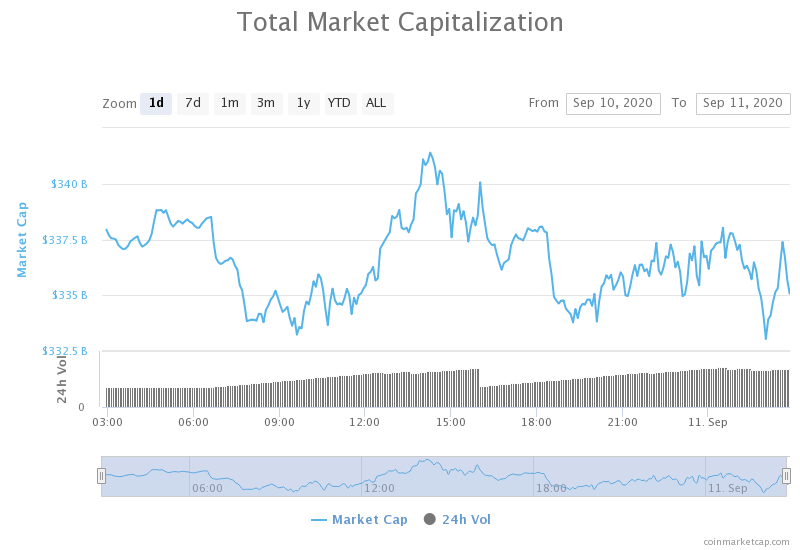
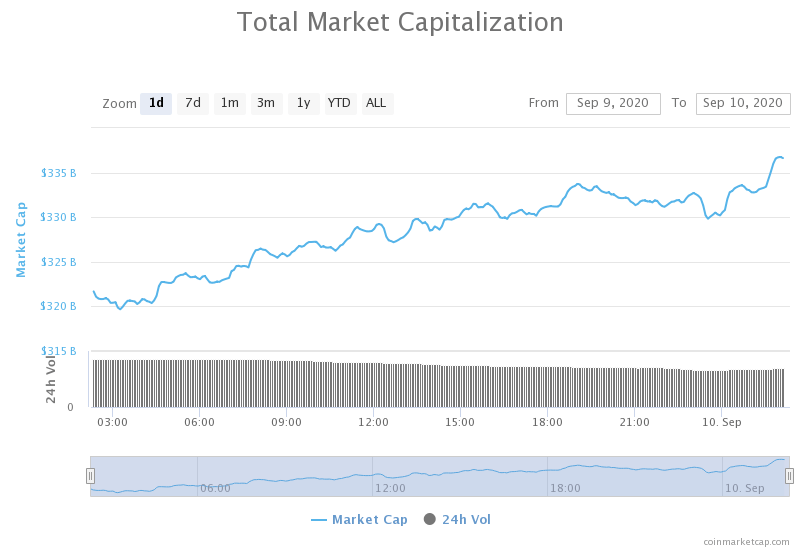
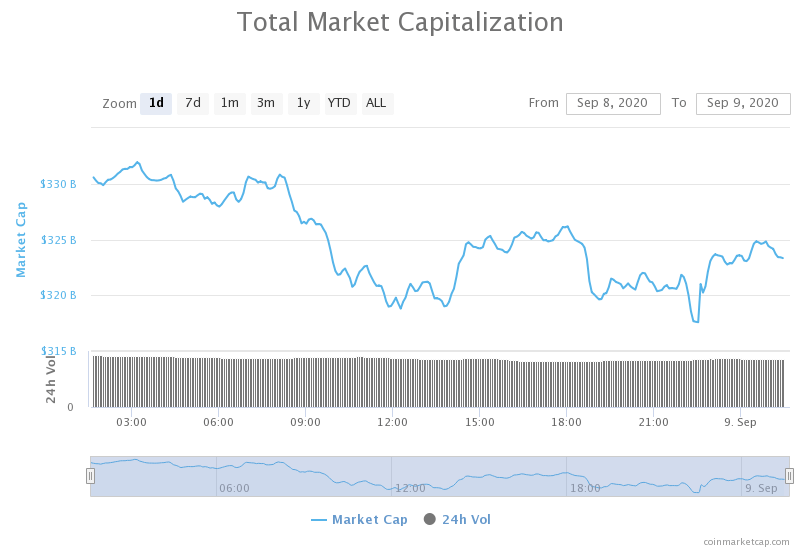
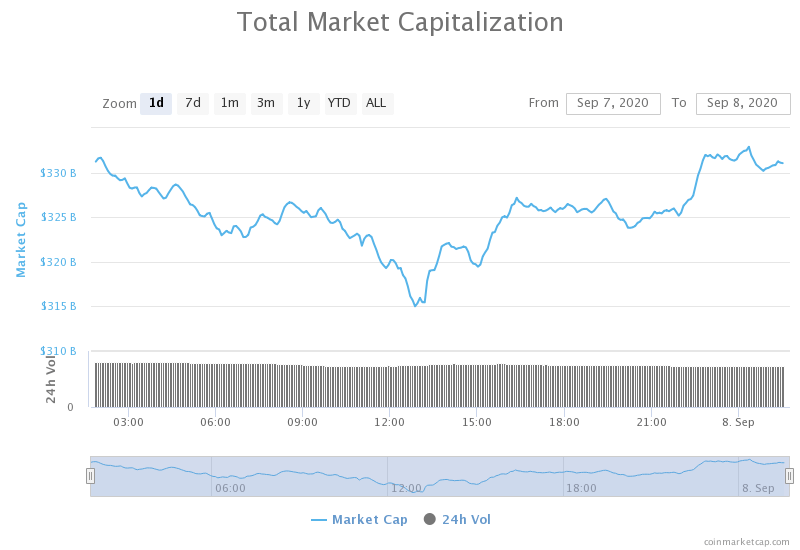
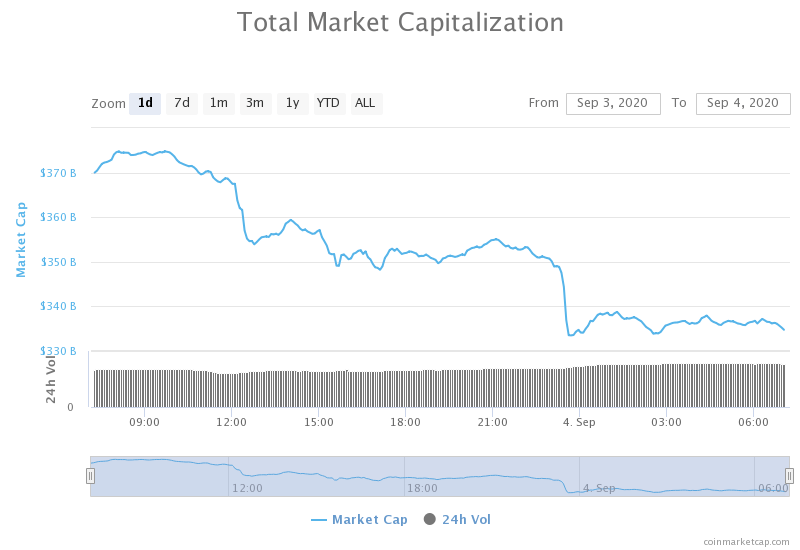
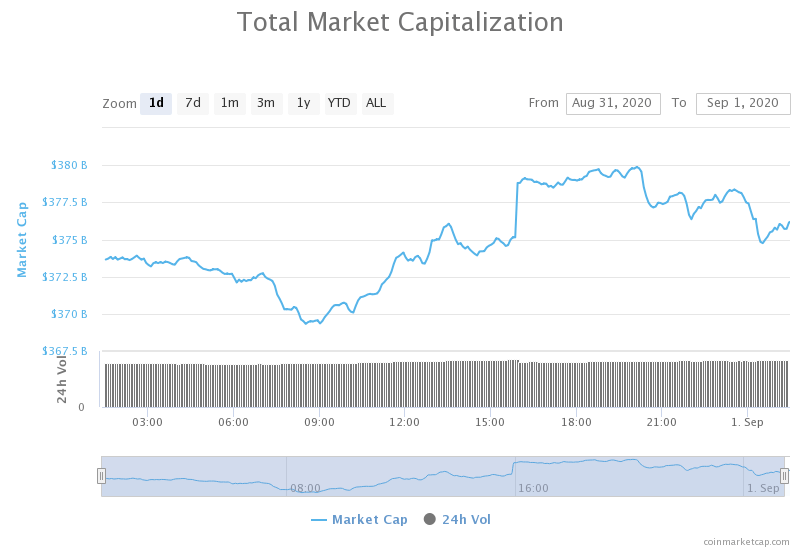
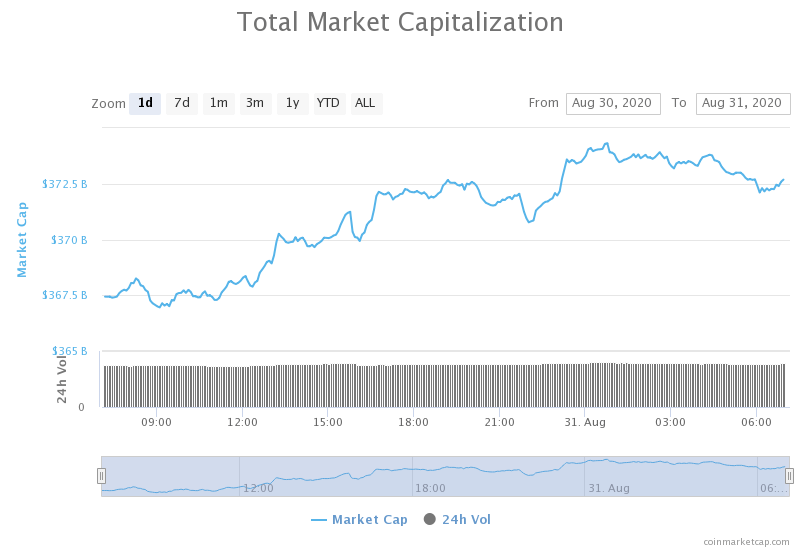
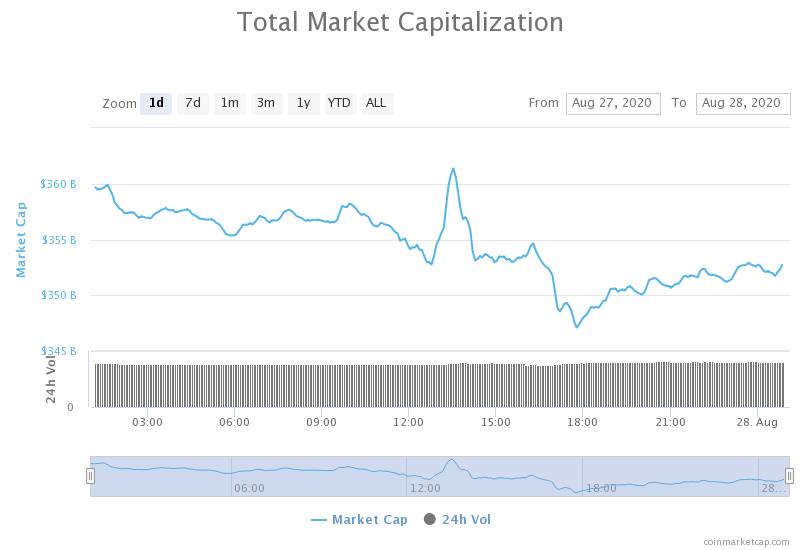
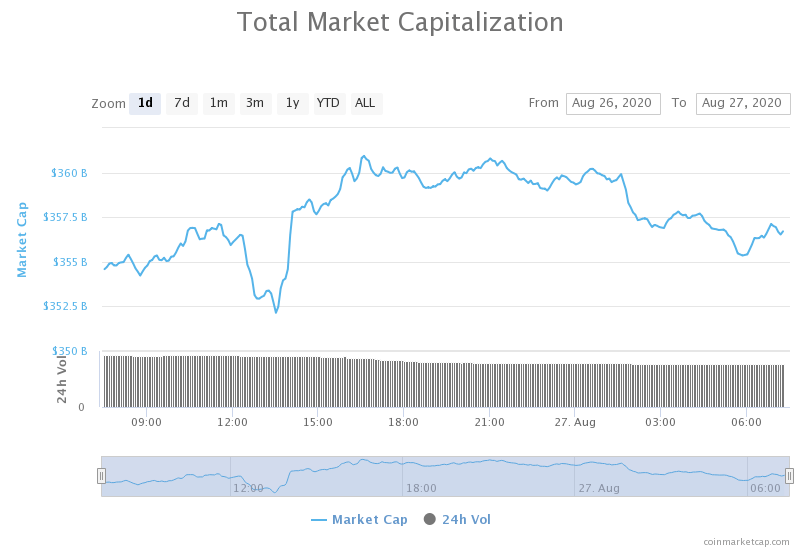
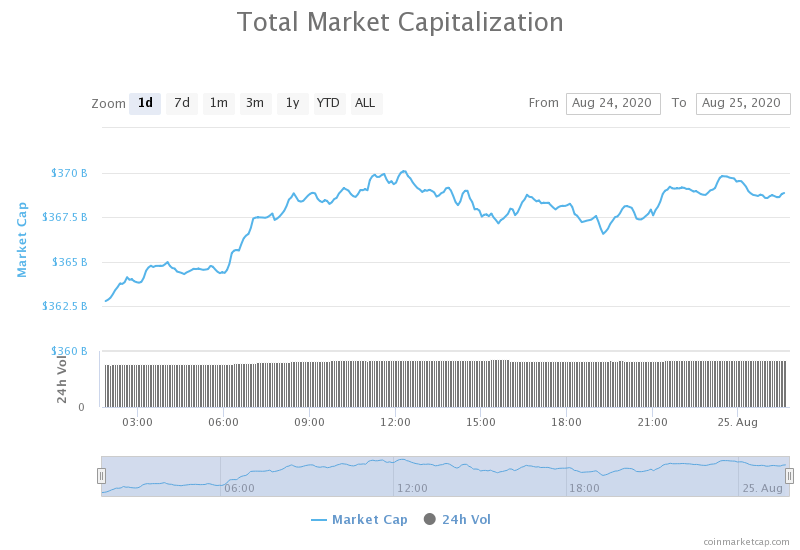
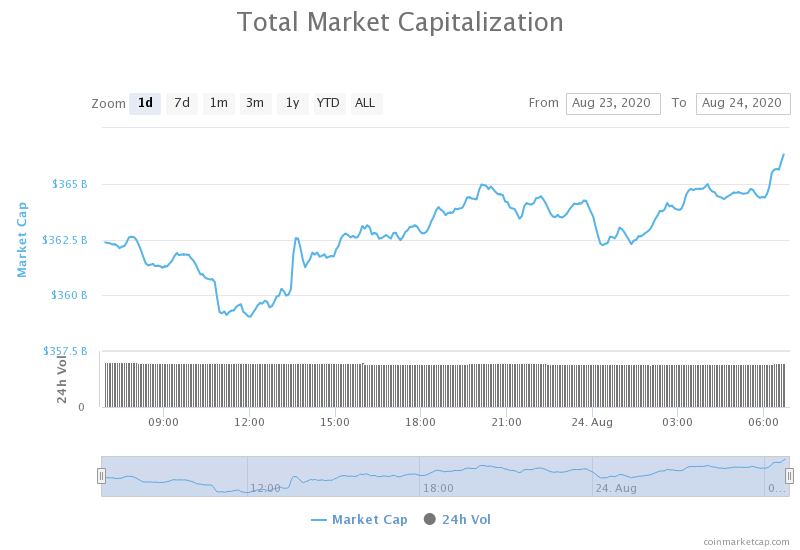
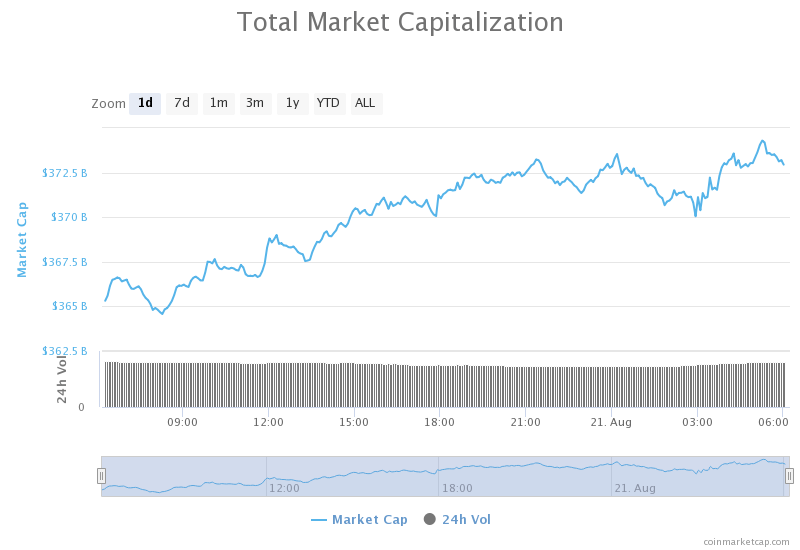
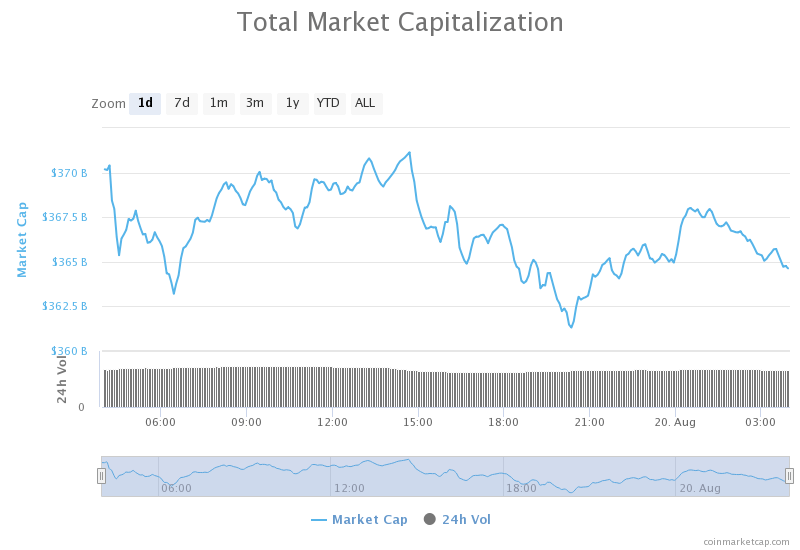
Daily Crypto Market Cap Chart
The crypto sector capitalization has increased significantly since we last reported. Its current value is $408.12 billion, representing an increase of $13.35 billion compared to our previous report.
_______________________________________________________________________
What happened in the past 24 hours?
_______________________________________________________________________
- This is the last major stop before Bitcoin price can target $20,000 (Cointelegraph)
- More Than Half of US Investors are Interested in Bitcoin, Grayscale Survey Finds (Coindesk)
- Market data indicates OKEx whales are expecting Bitcoin to spike past $14k (Cryptoslate)
- Ethereum Analytics Firm Nansen Secures $1.2 Million Seed Investment (Cryptobriefing)
- NEO Flashes Buy Signal as Crypto Market Turns Bullish (Cryptobriefing)
- Strong Fundamentals Push Bitcoin to New Yearly High (Cryptobriefing)
- Privacy Coin Zcoin Will Rebrand to Firo, Launching Key Network Upgrade (Cryptobriefing)
- Bitcoin hash rate drops over 10% as Chinese miners migrate to fossil fuel plants (The Block)
- JPMorgan is actively exploring digital asset custody, and is looking for help from crypto native firms (The Block)
- Crypto lender BlockFi now holds over 5% of Grayscale’s Bitcoin Trust shares (The Block)
_______________________________________________________________________
Technical analysis
_______________________________________________________________________
Bitcoin

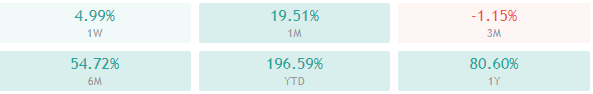
The largest cryptocurrency by market capitalization surprised the market once again by pushing even further up. Our weekly chart overview has listed a push towards $13,900 as one of the likely scenarios for this week, which is exactly what happened. Bitcoin has pushed past the descending (yellow dotted) line and above the $13,180 resistance level, all the way to $13,800.
Traders should look at how Bitcoin behaves around $13,900 and follow the next push (either a pullback below $13,570 or a break past $13,900).
BTC/USD 4-hour Chart
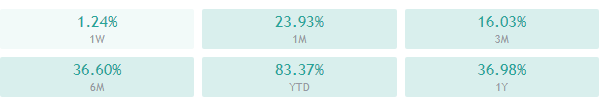
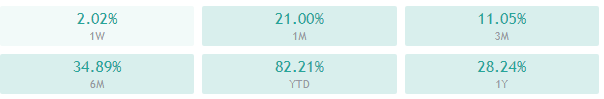
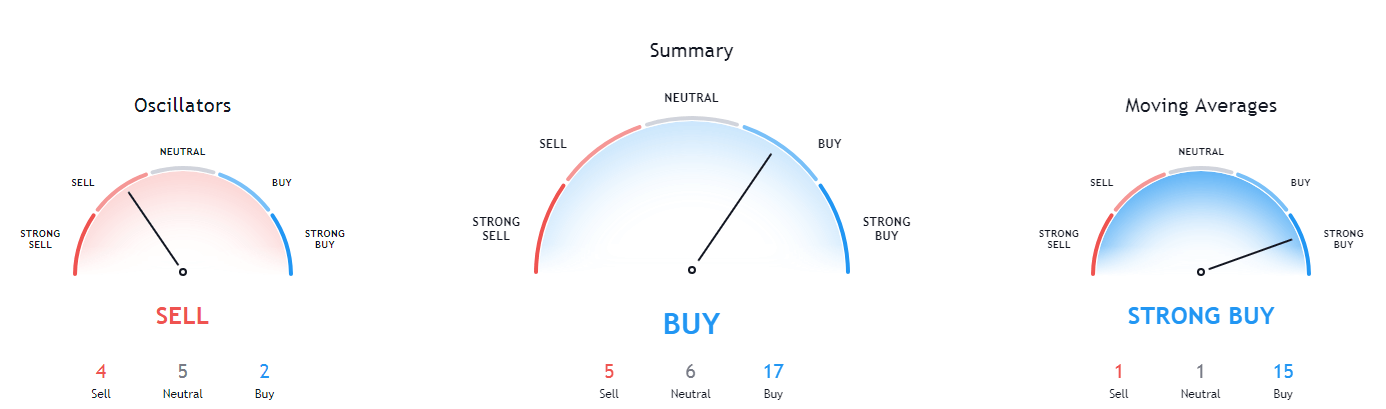
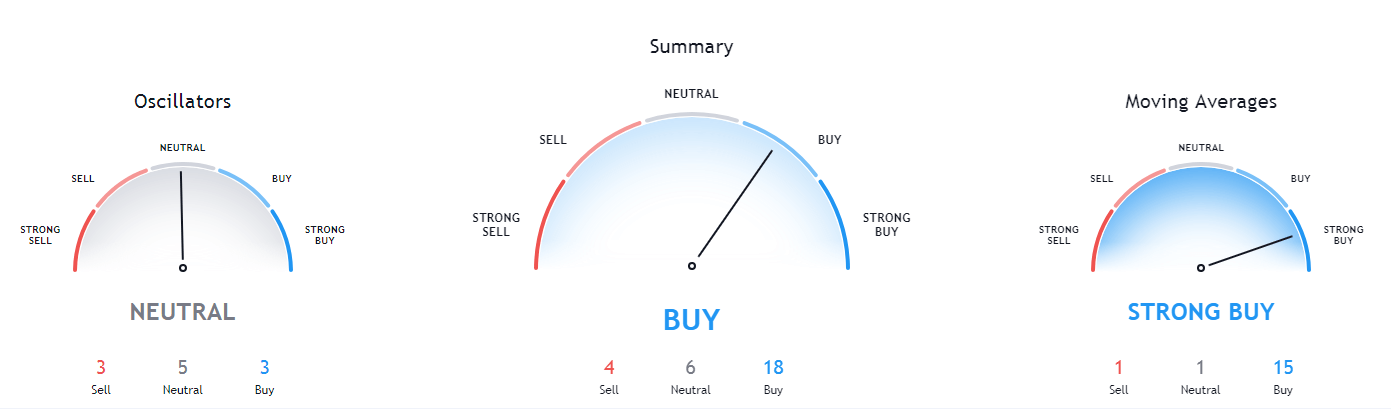
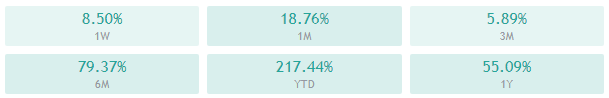
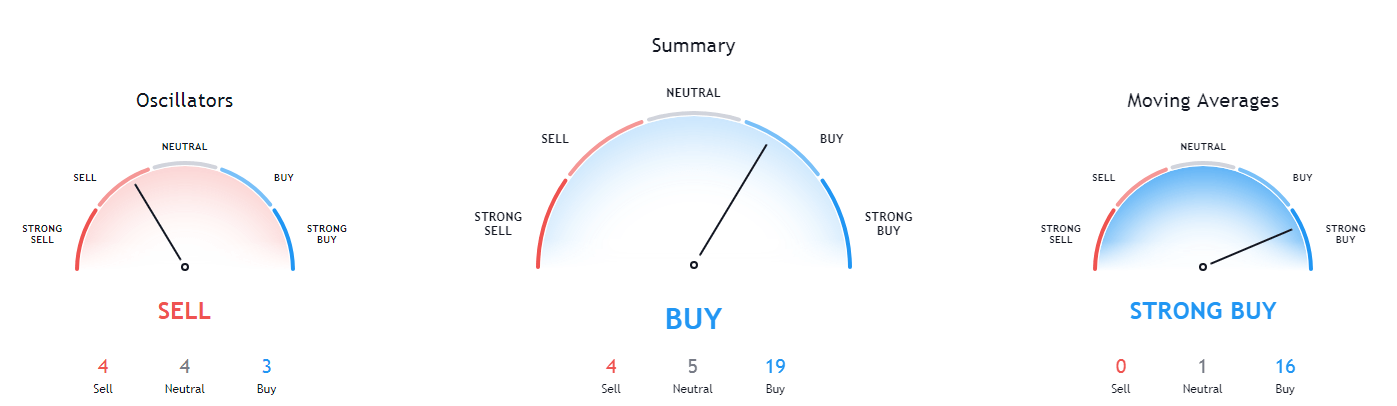
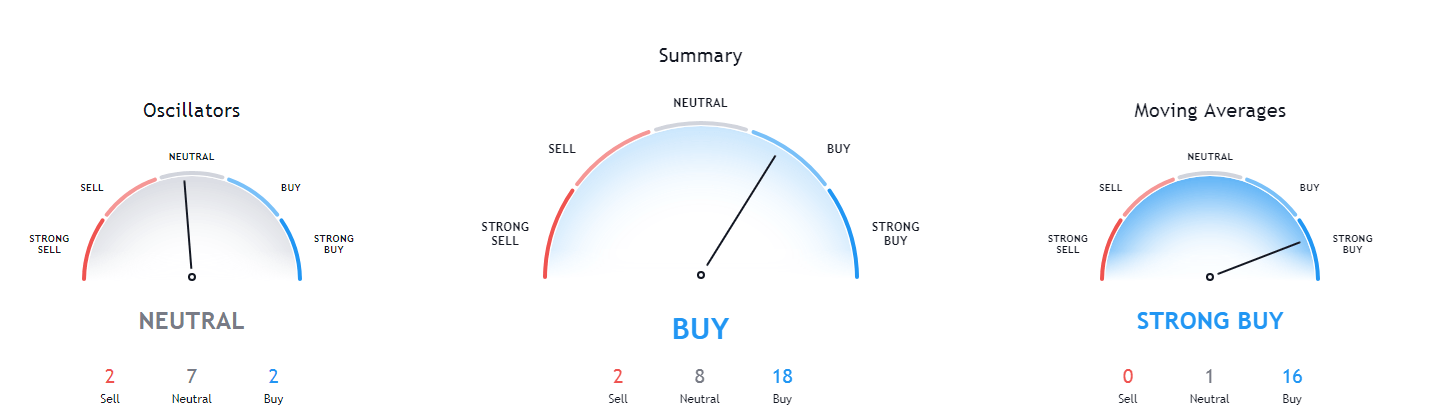
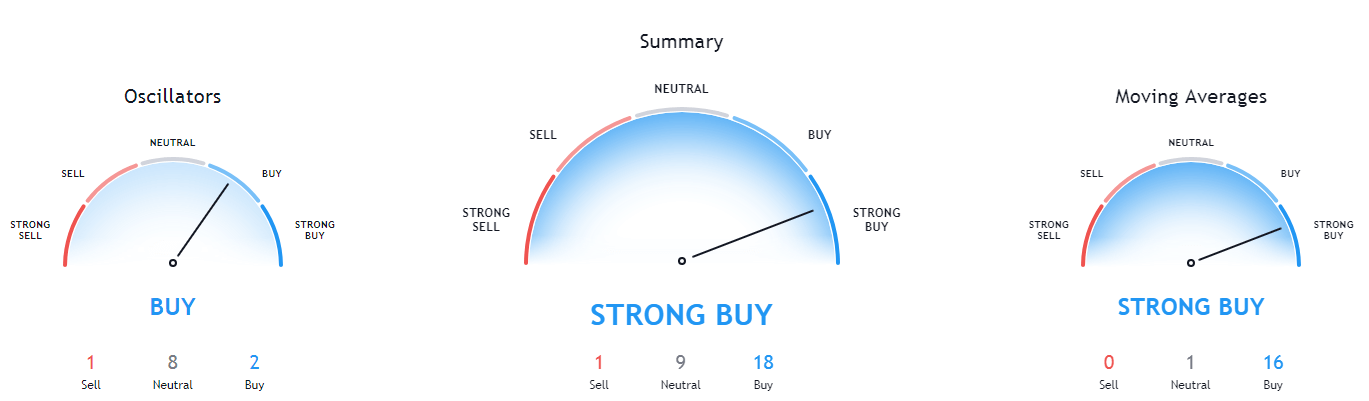
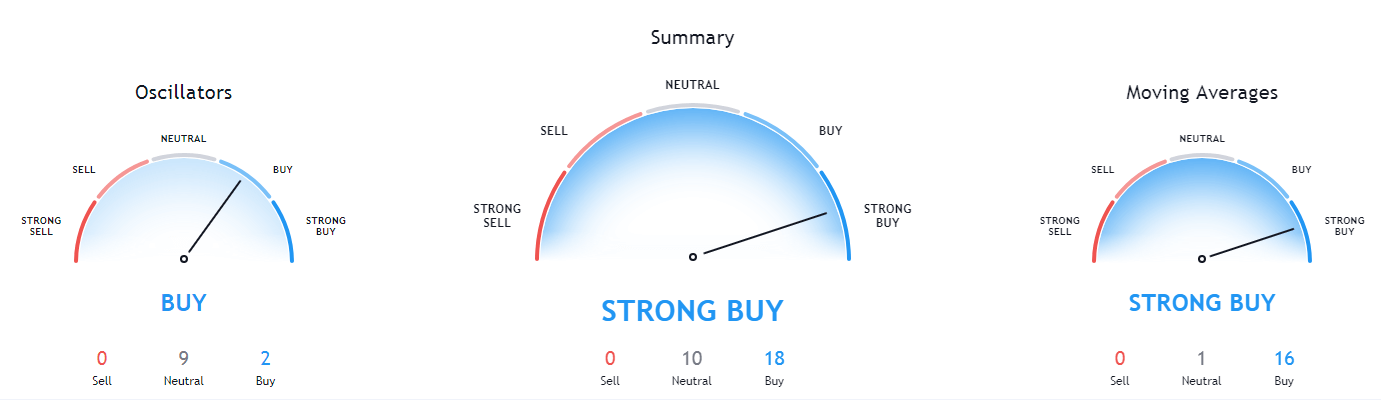
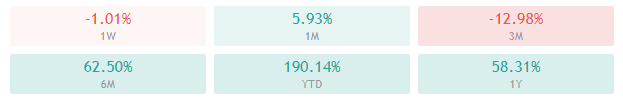
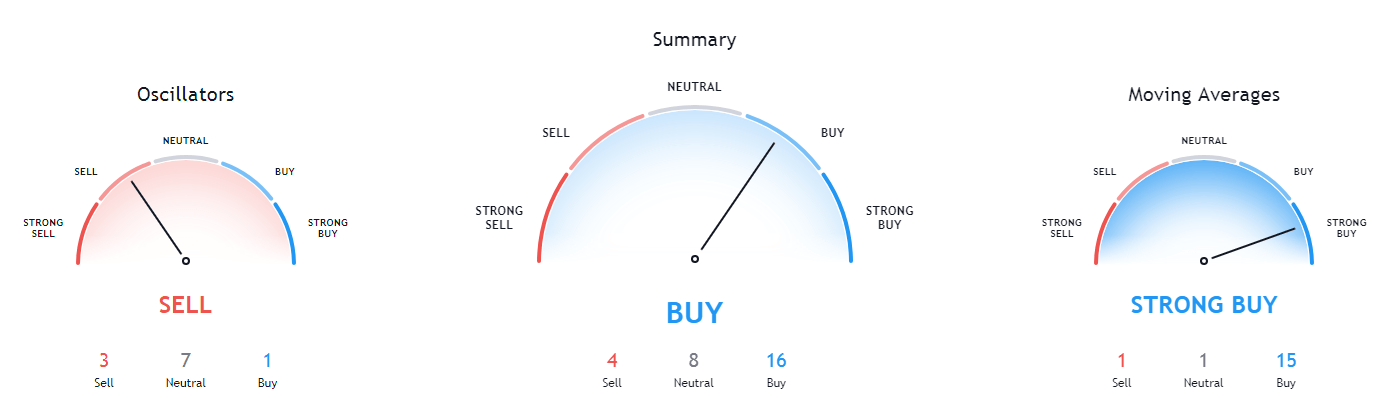
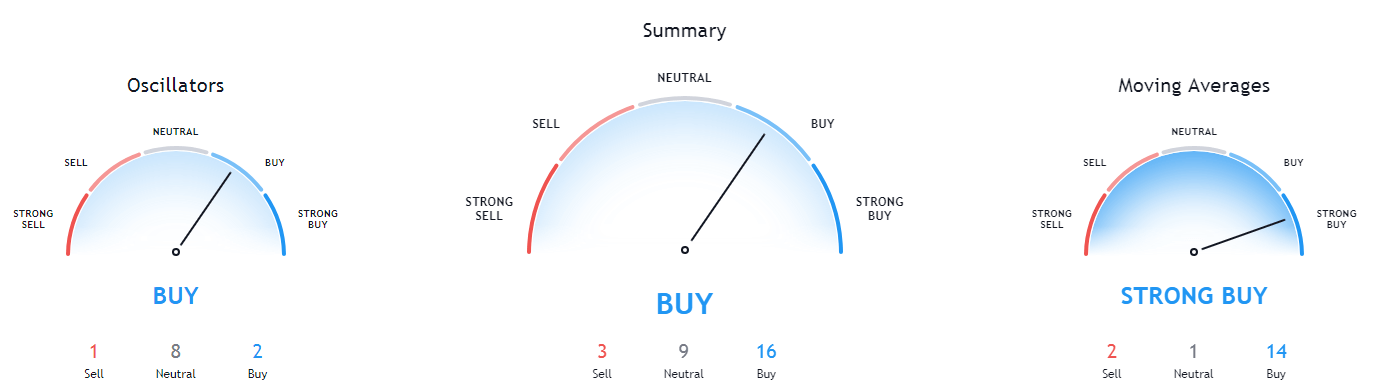
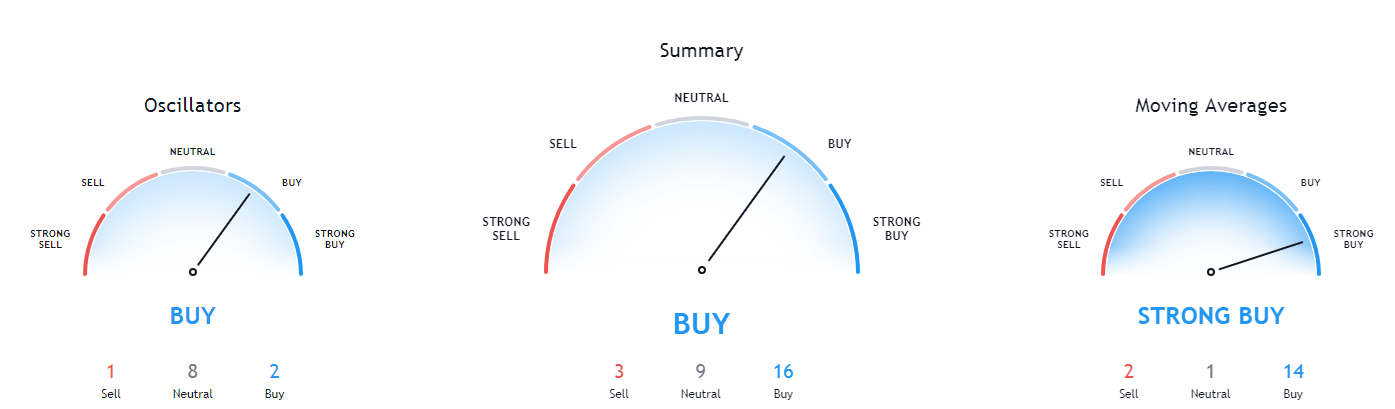
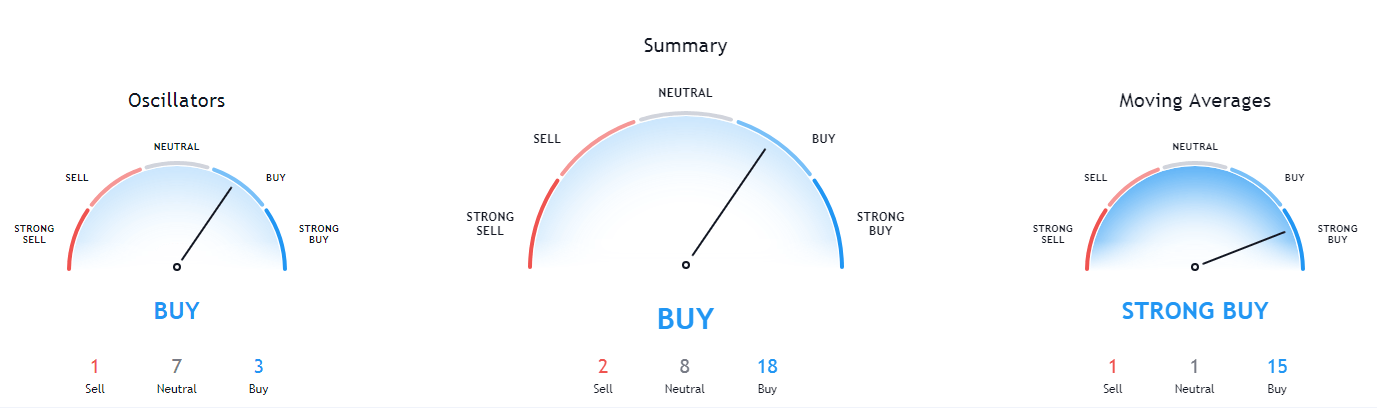
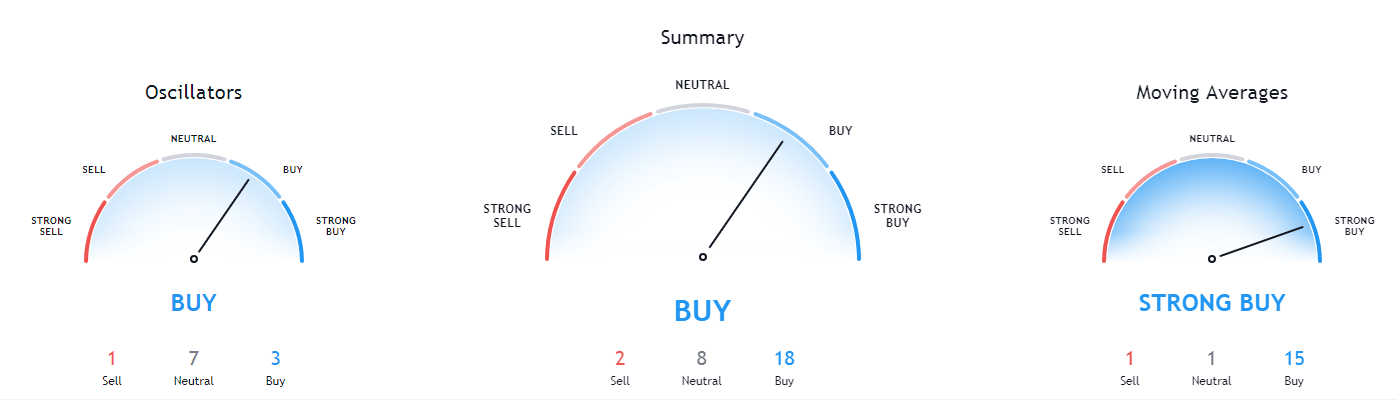
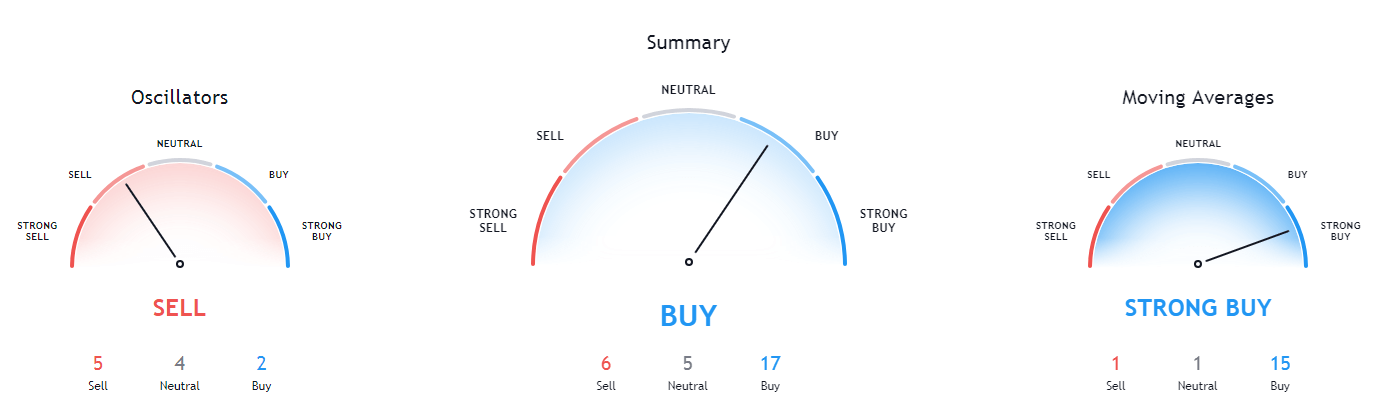
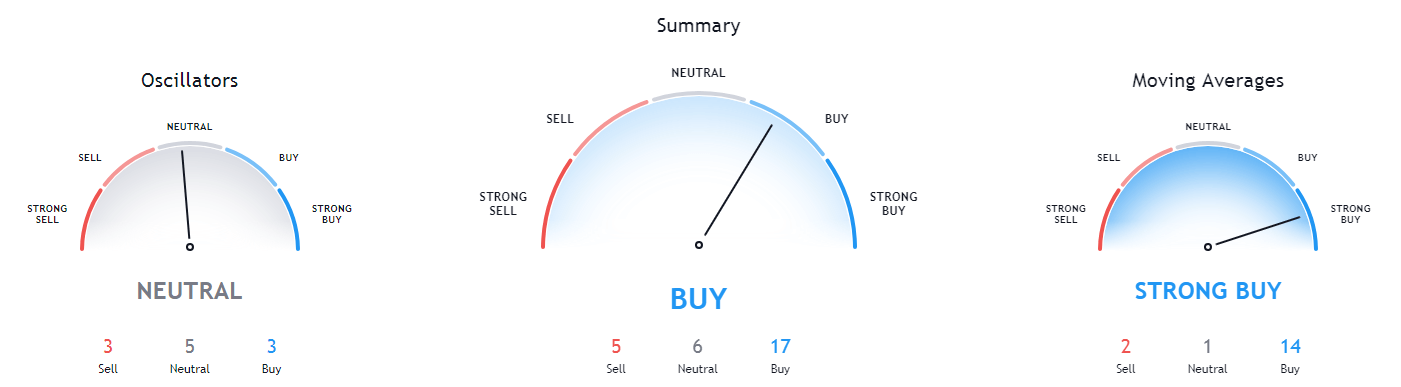
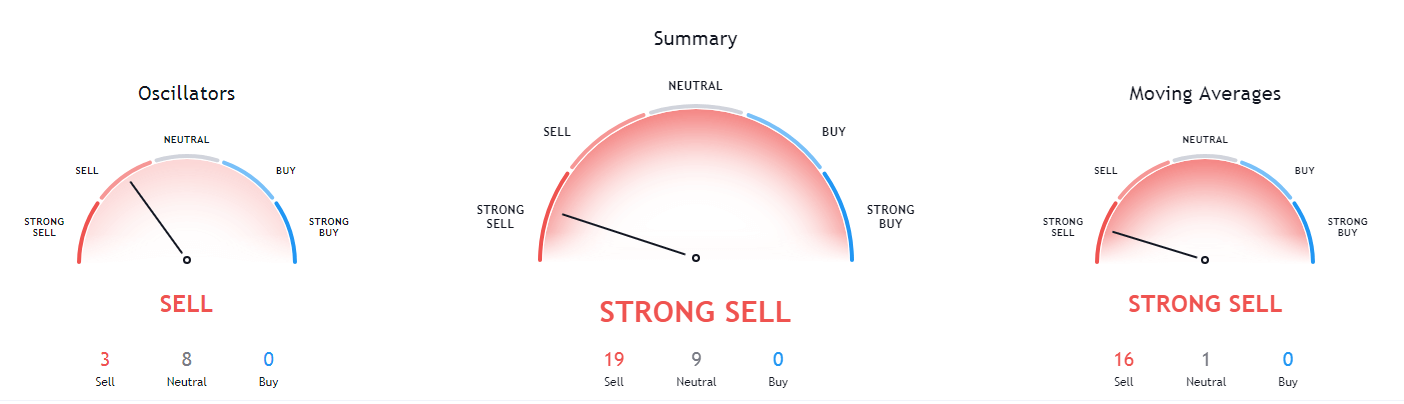
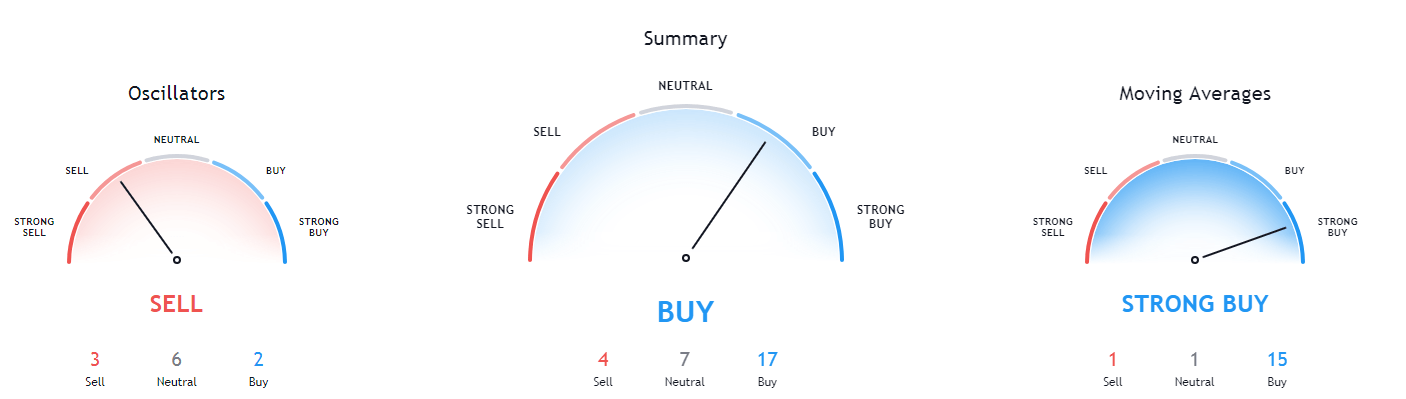
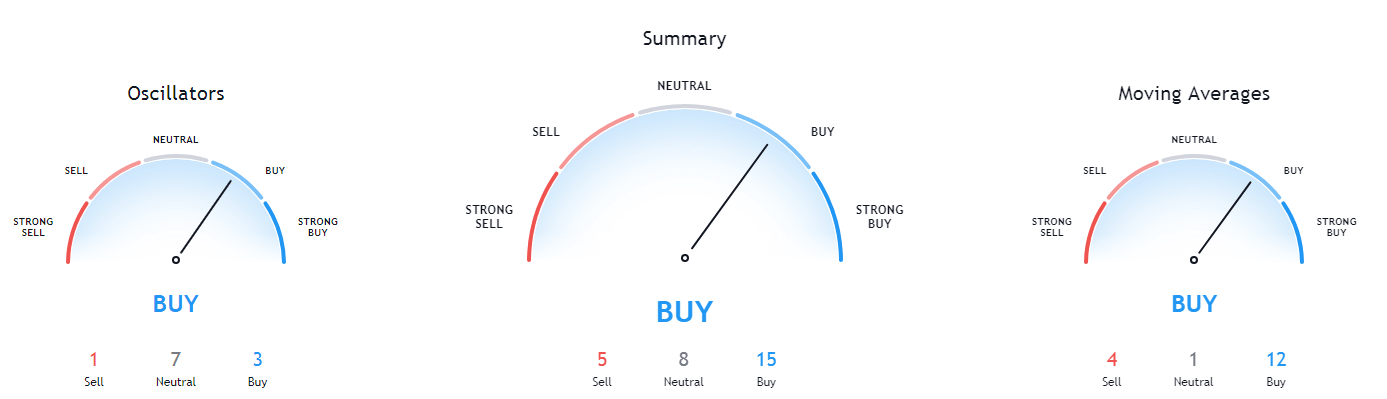
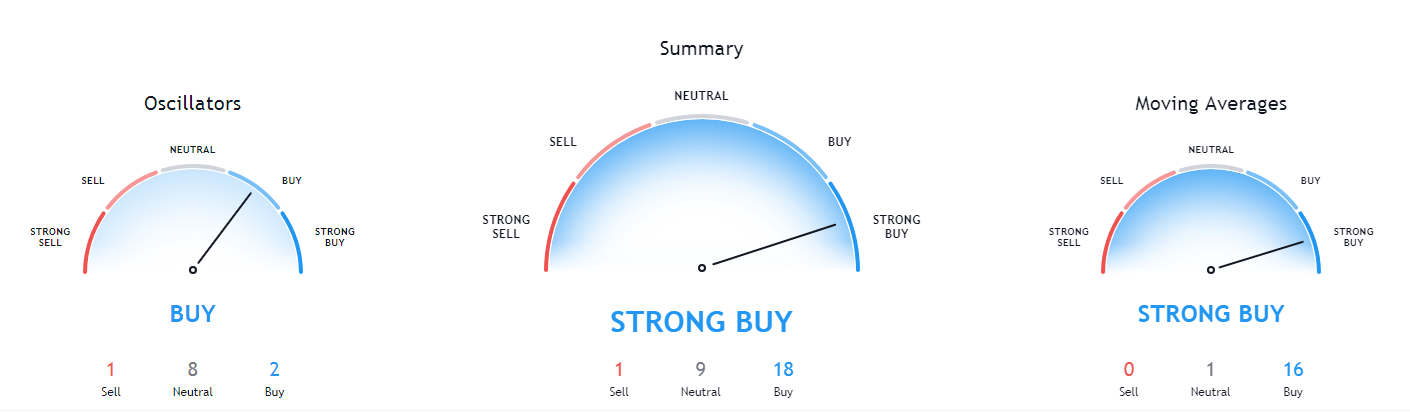
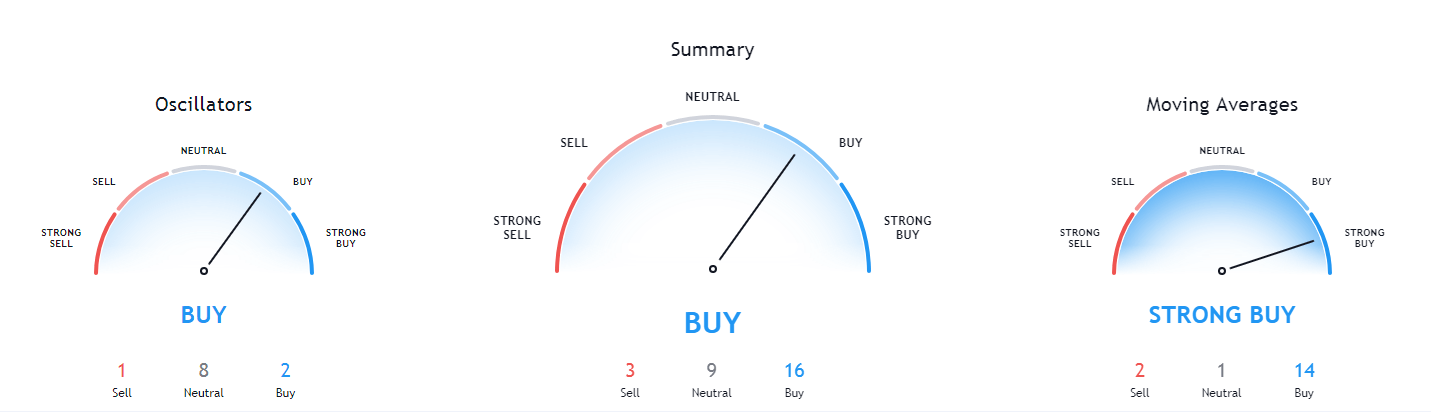
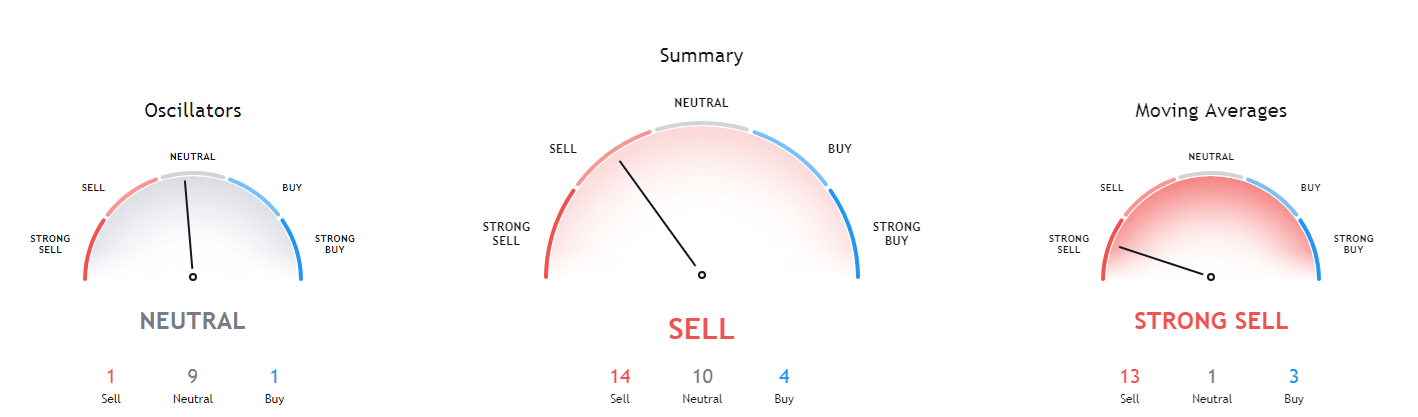
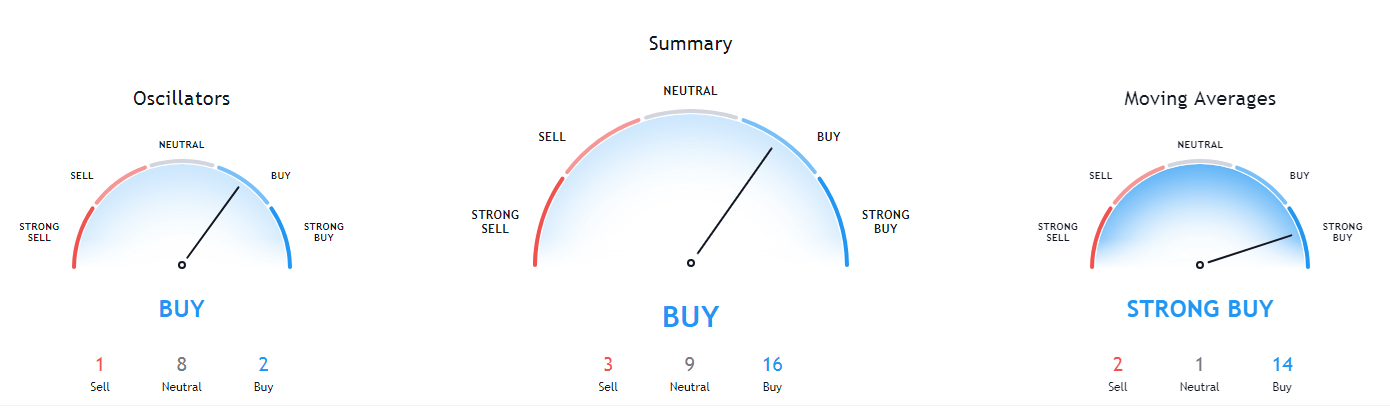
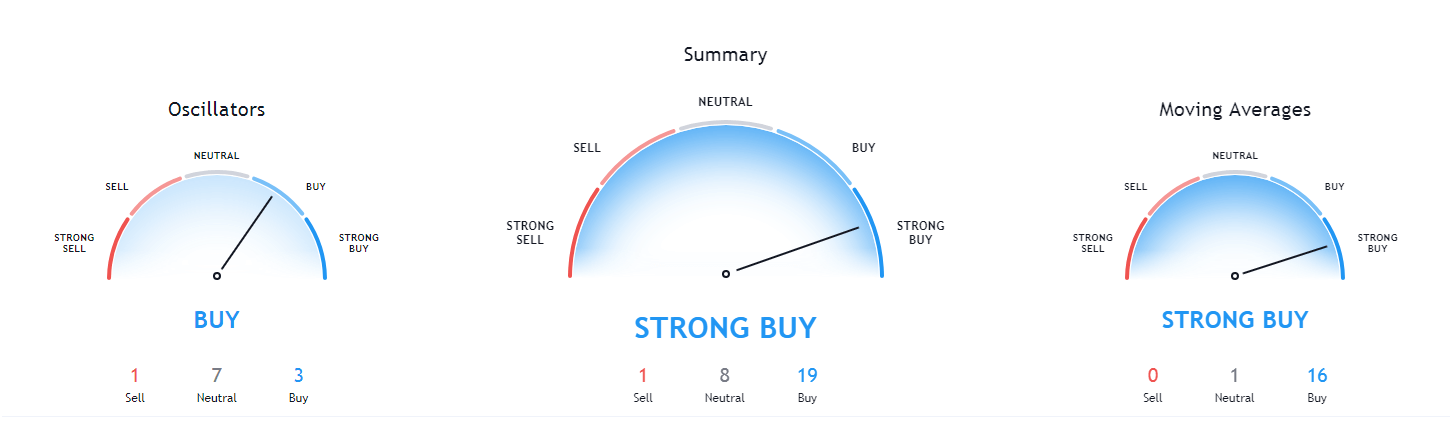
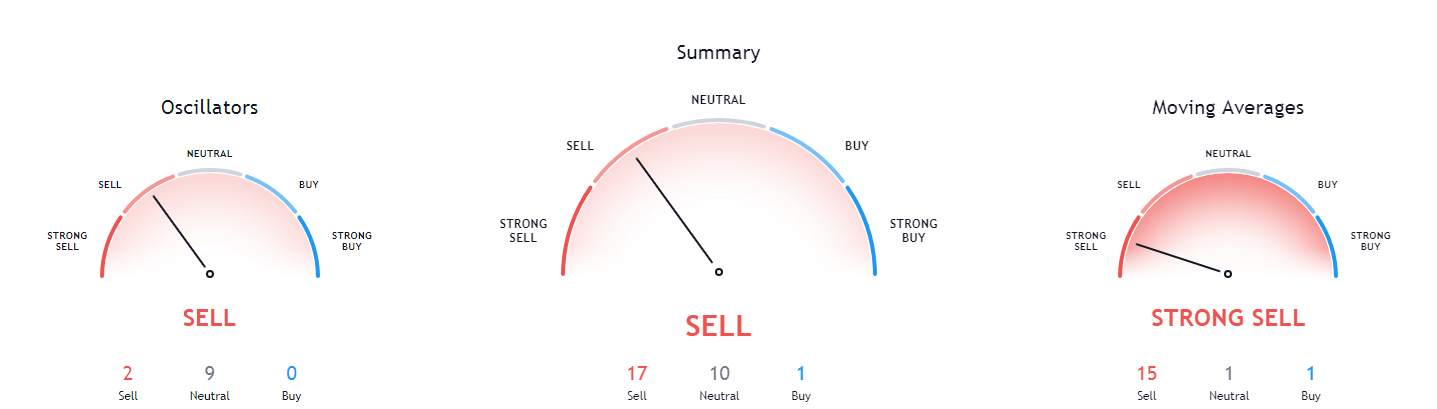
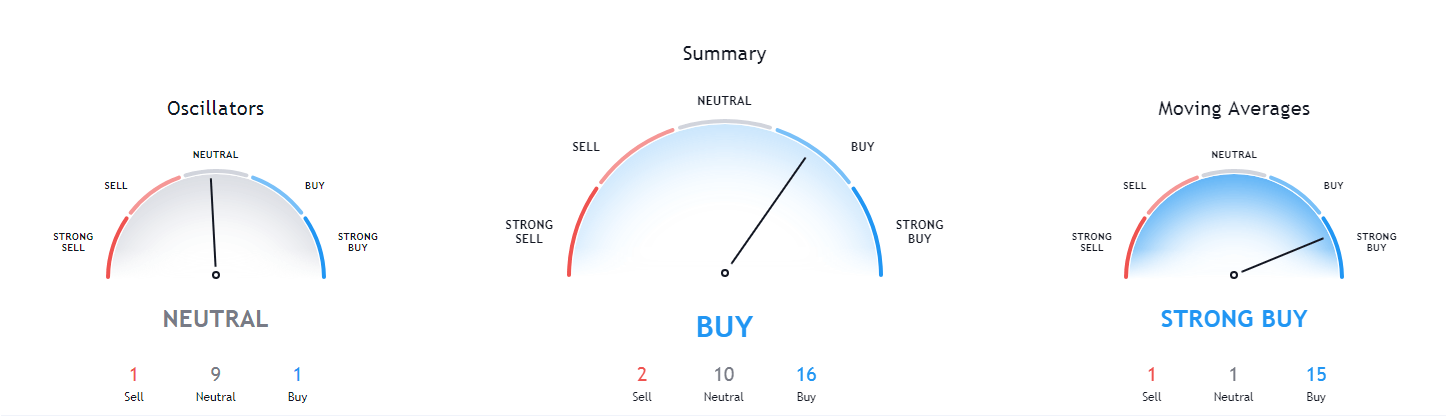
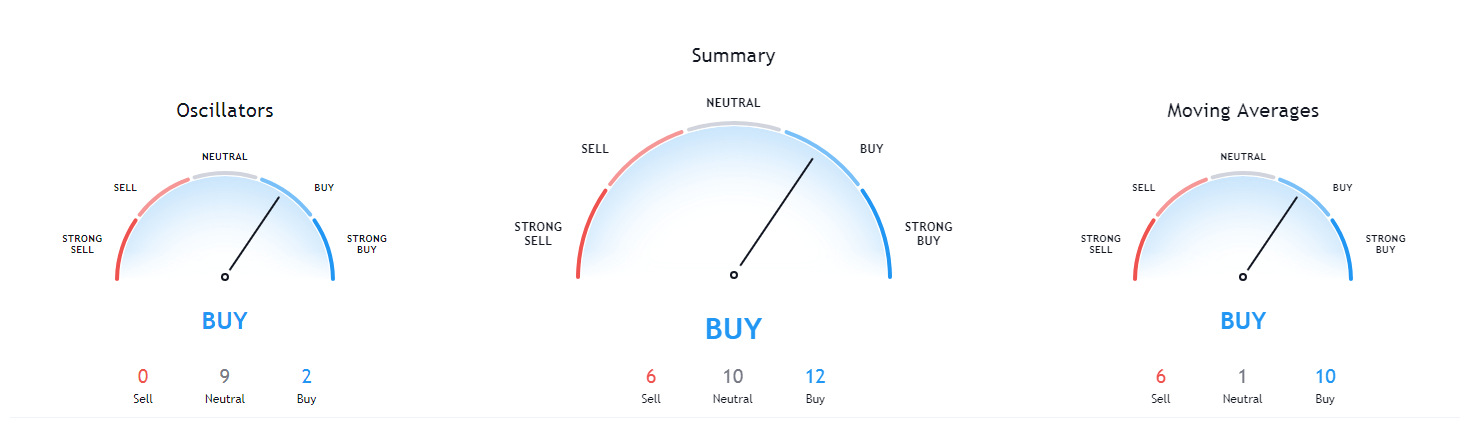
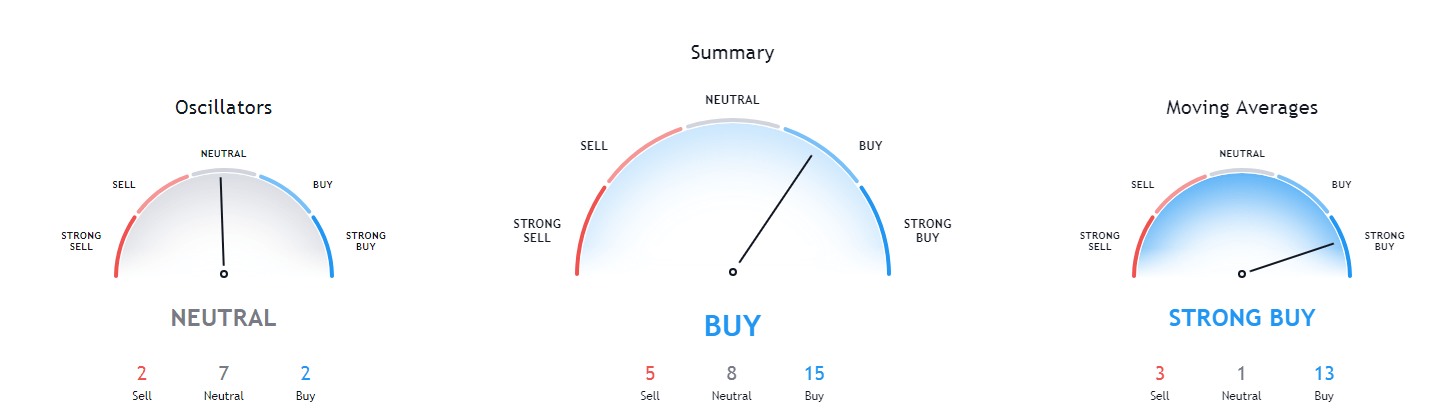
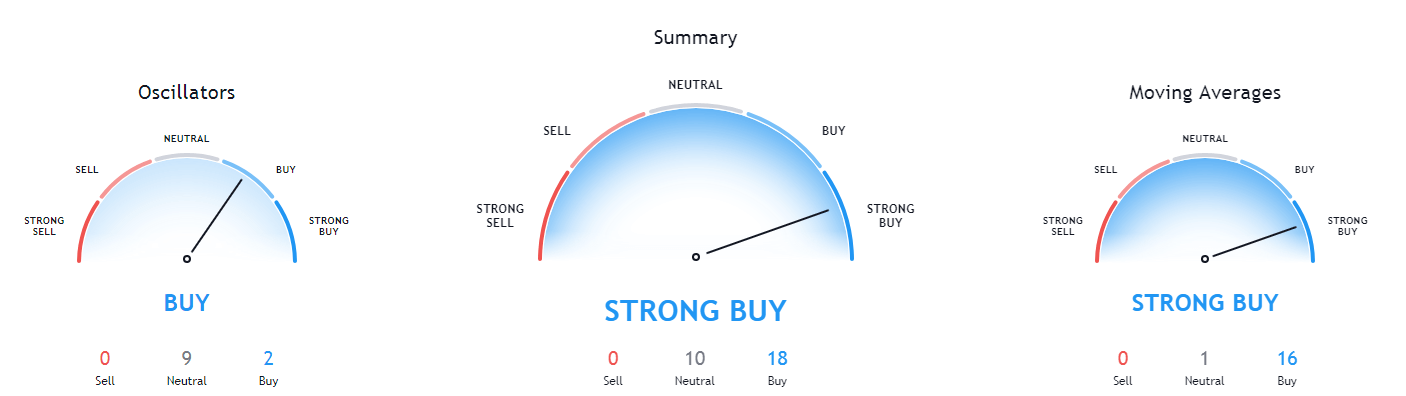
Bitcoin’s technicals have changed to extremely bullish on all time frames since yesterday, with only the 4-hour chart oscillators showing some signs of a tilt towards the sell-side.

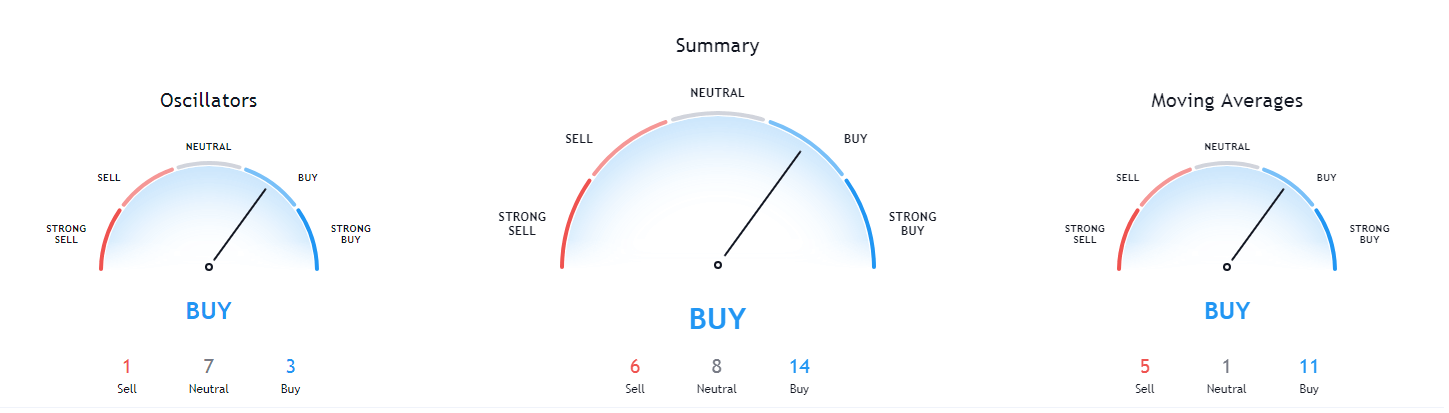
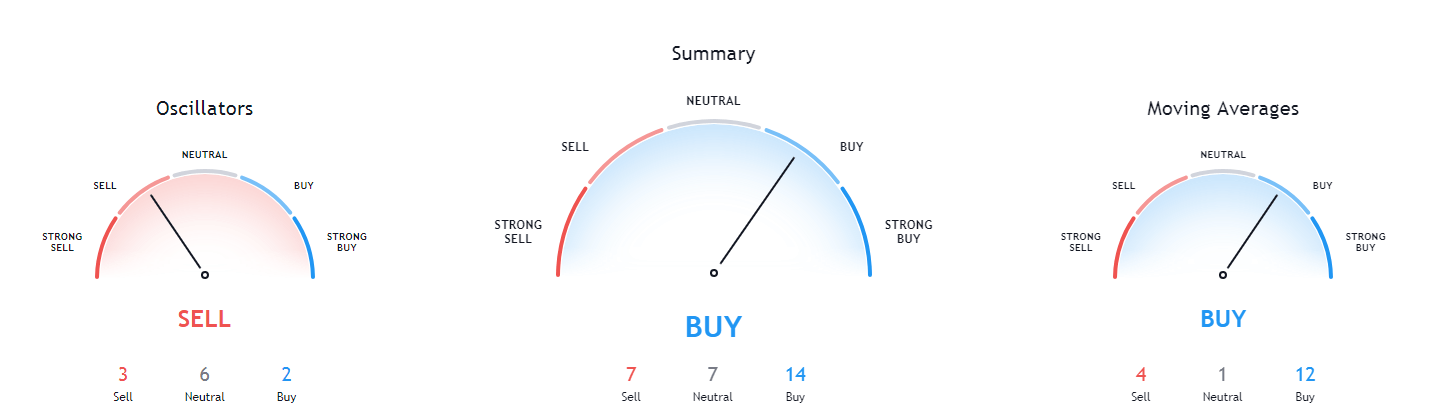
BTC/USD 1-day Technicals
Technical factors (4-hour Chart):
- Price is far above both its 50-period EMA and its 21-period EMA
- Price is at its top Bollinger band
- RSI is overbought (74.76)
- Volume is above average
Key levels to the upside Key levels to the downside
1: $13,570 1: $13,200
2: $13,900 2: $12,870
3: $14,000 3: $12,500
Ethereum
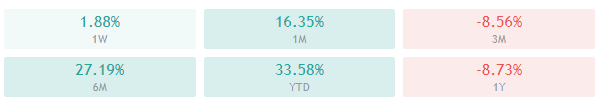
Ethereum has spent the day bouncing off of the support level dating back from early September. While Ether had a slightly bigger chance of continuing its path down the projected path towards the bottom of the channel, Bitcoin’s rise sparked up Ether’s bounce. Its price is now hovering slightly above $400, with a solid chance of testing $415 again.
Traders should watch for how Ethereum plays out in the next few days to evaluate if it pushes towards $415-$420 or goes below $400.
ETH/USD 4-hour Chart
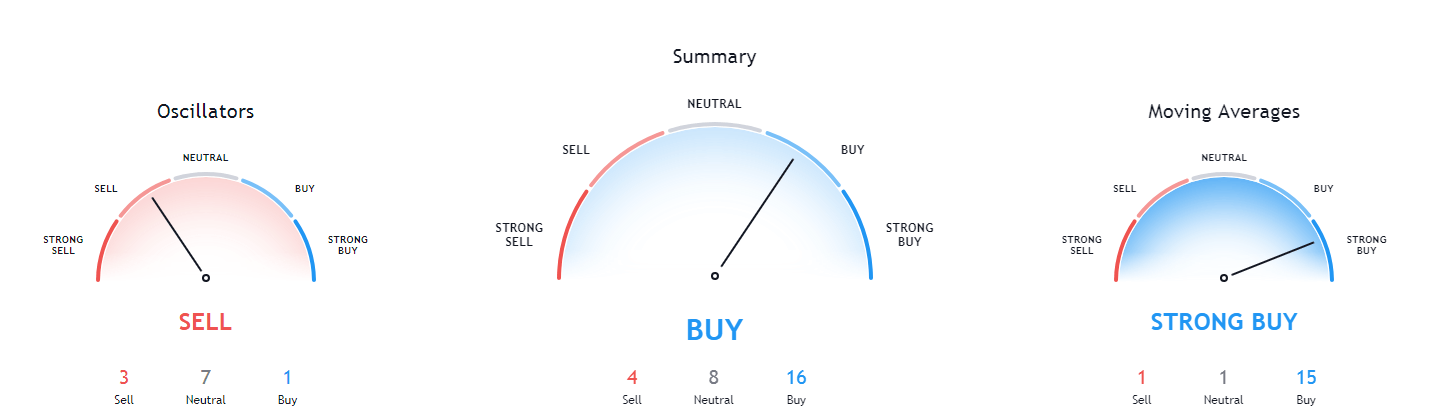
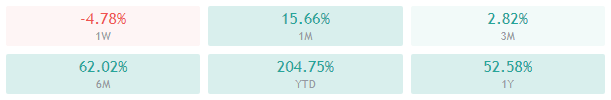
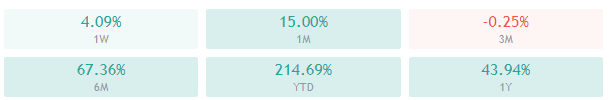
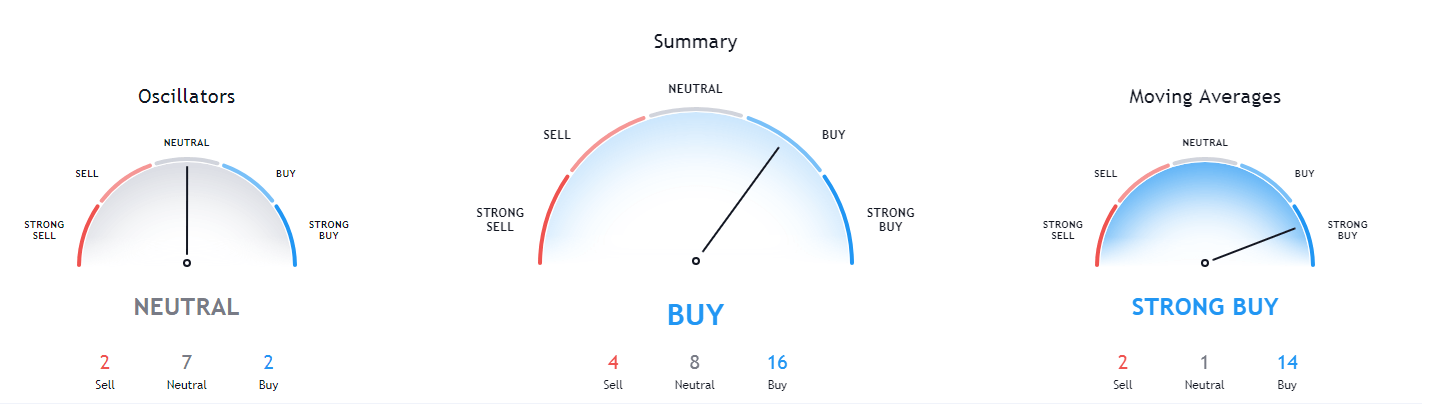
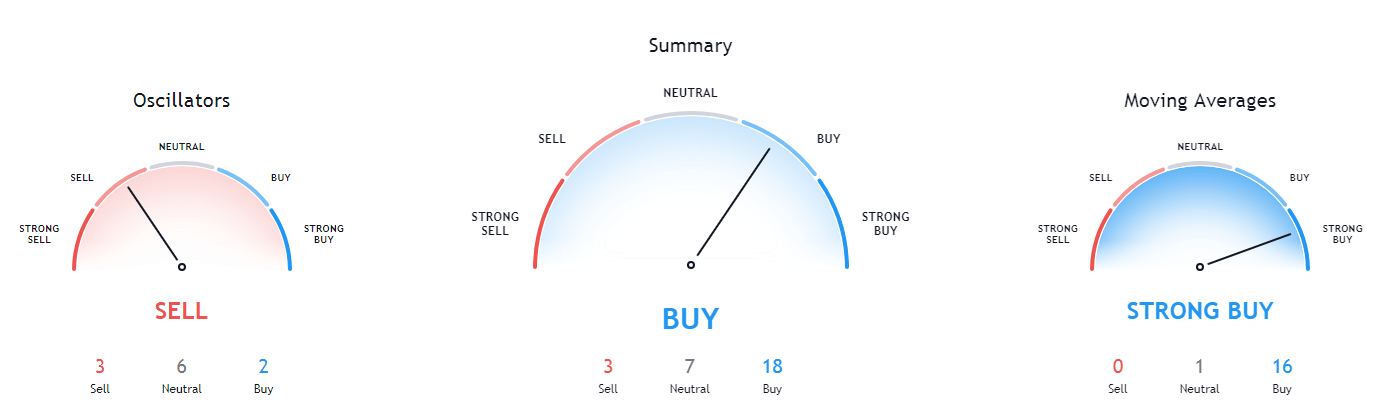
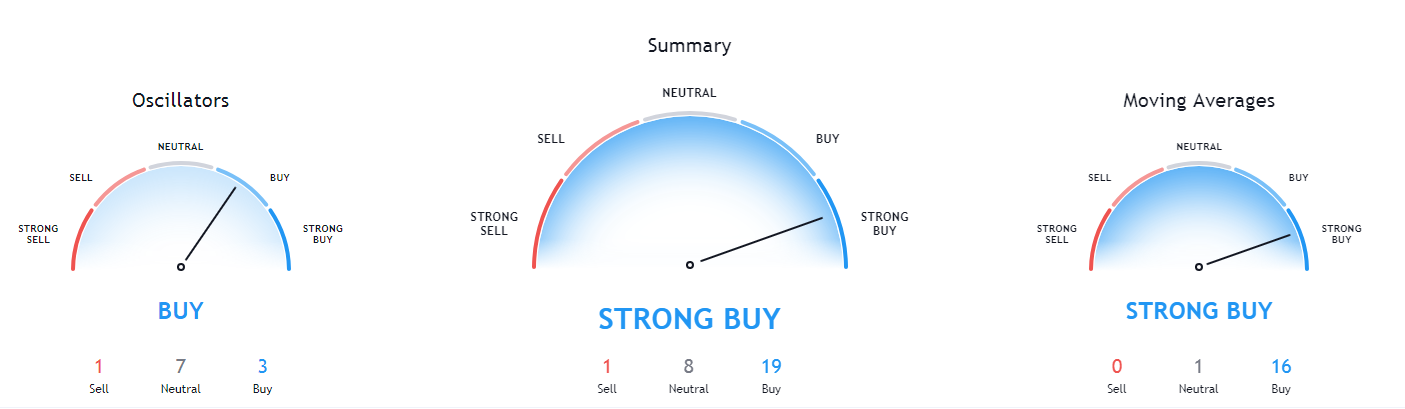
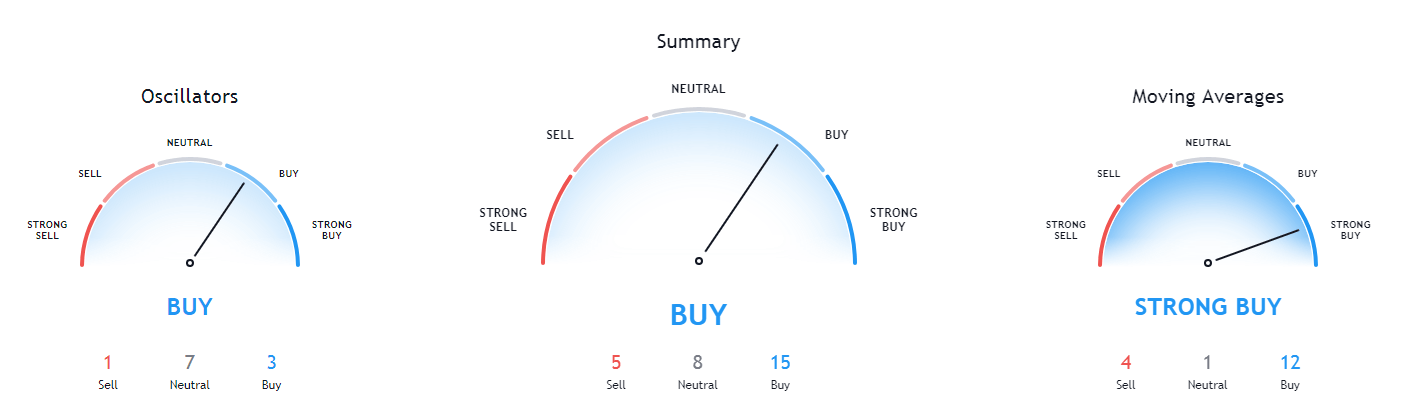
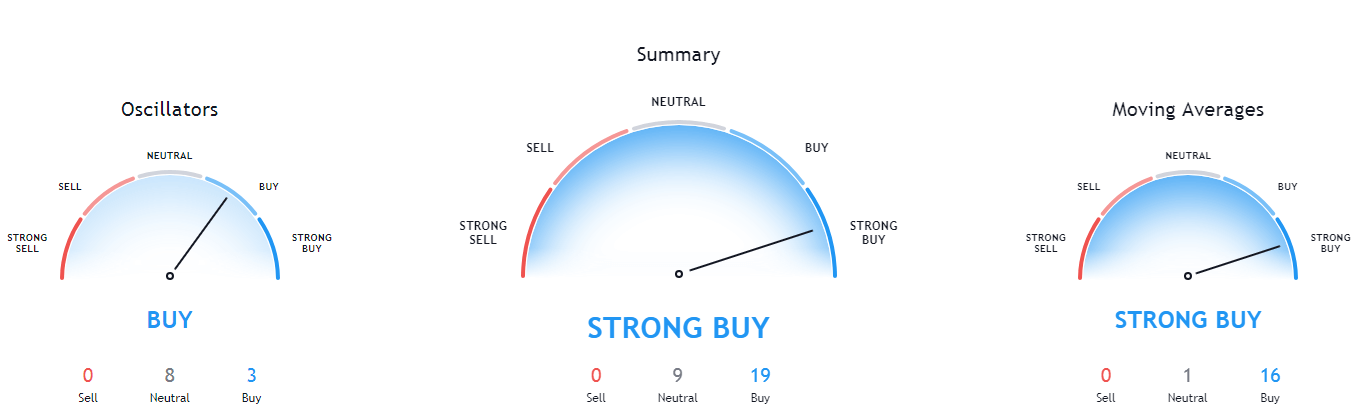
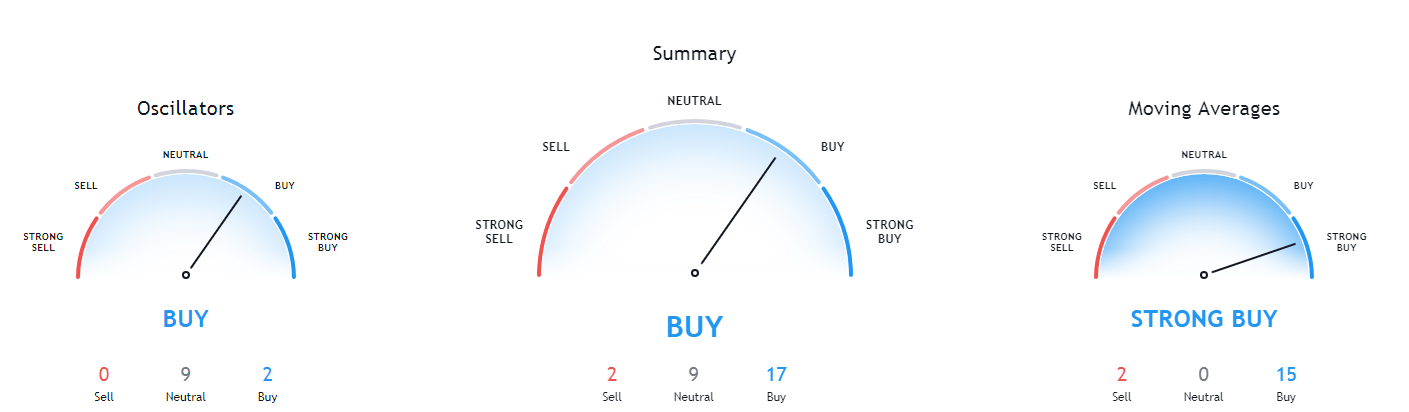
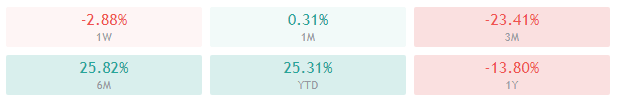
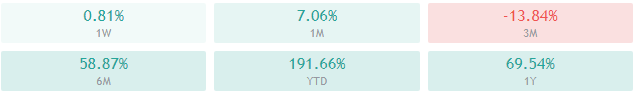
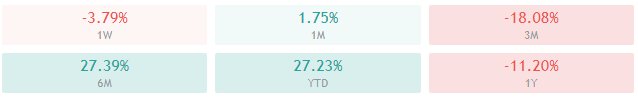
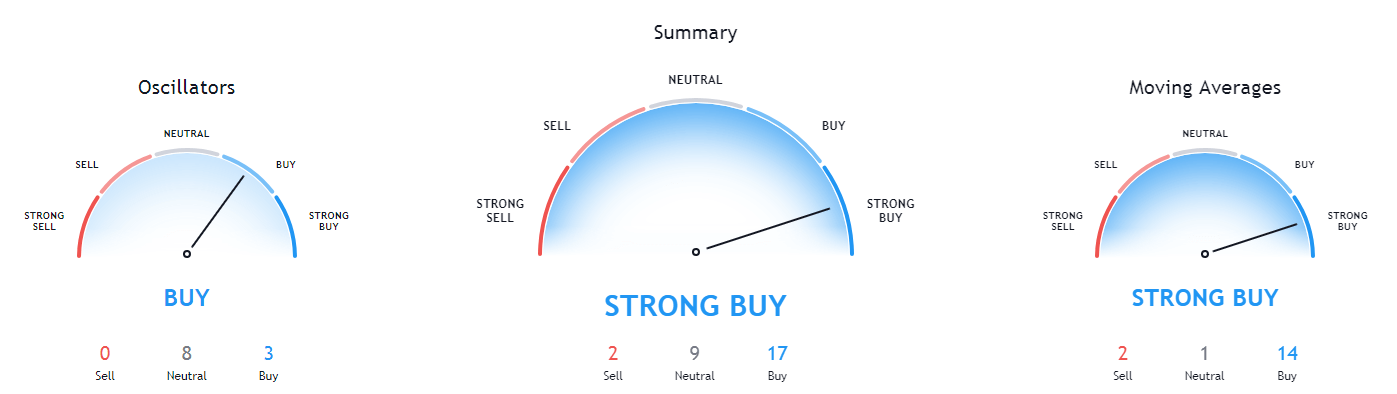
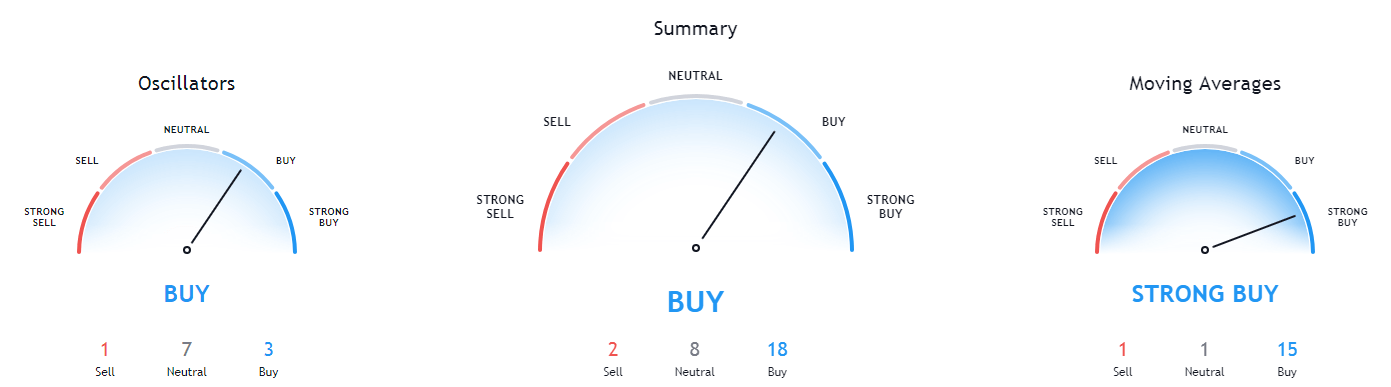
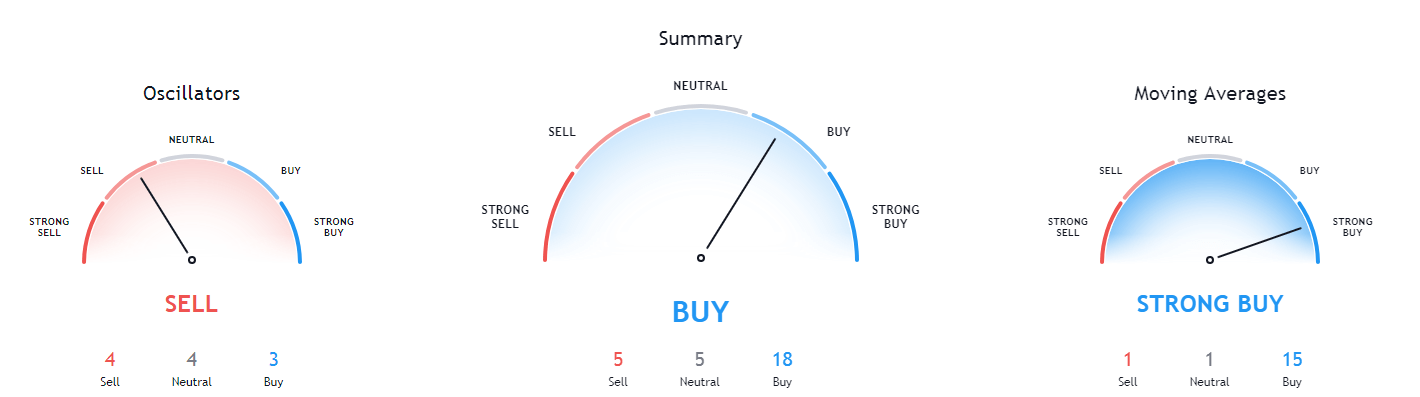
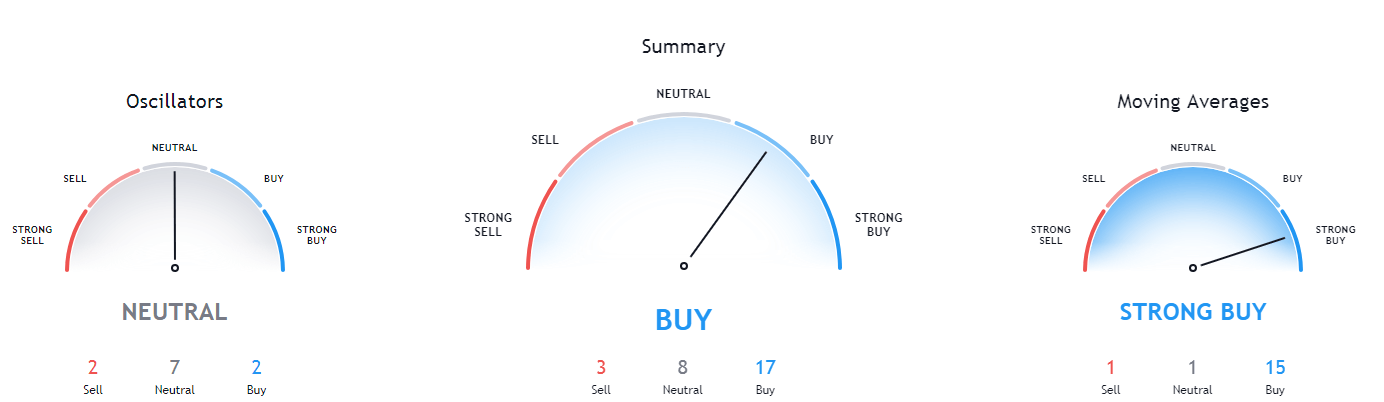
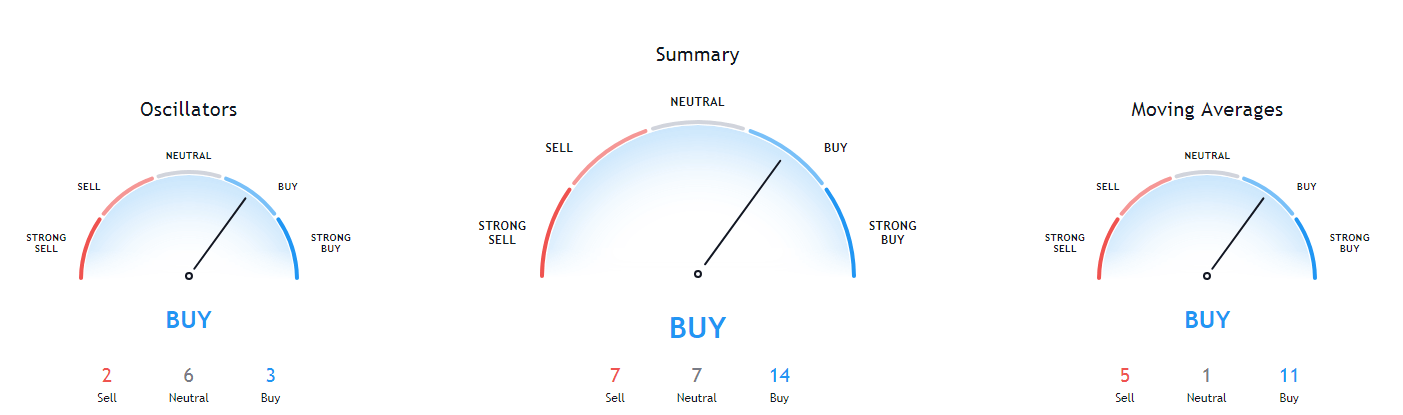
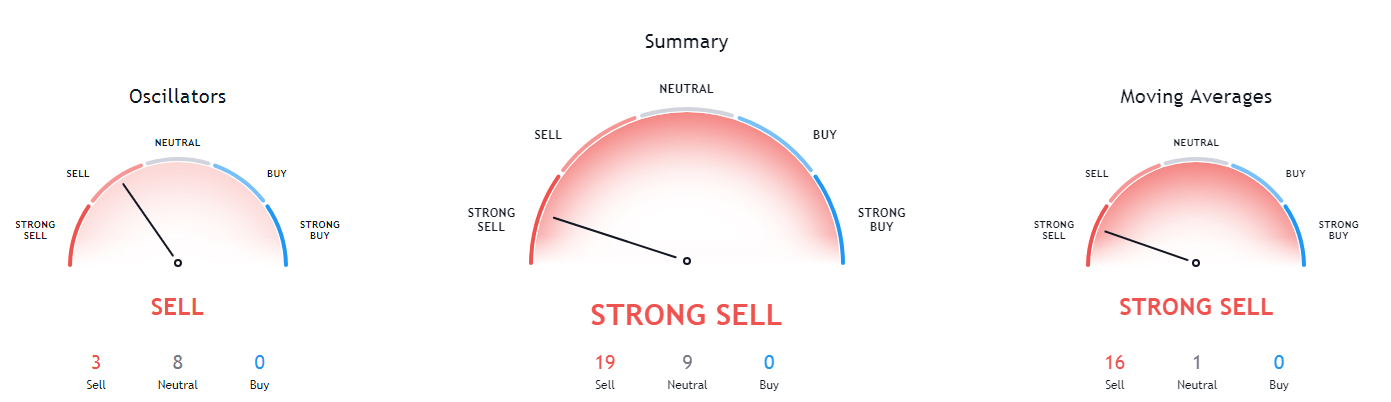
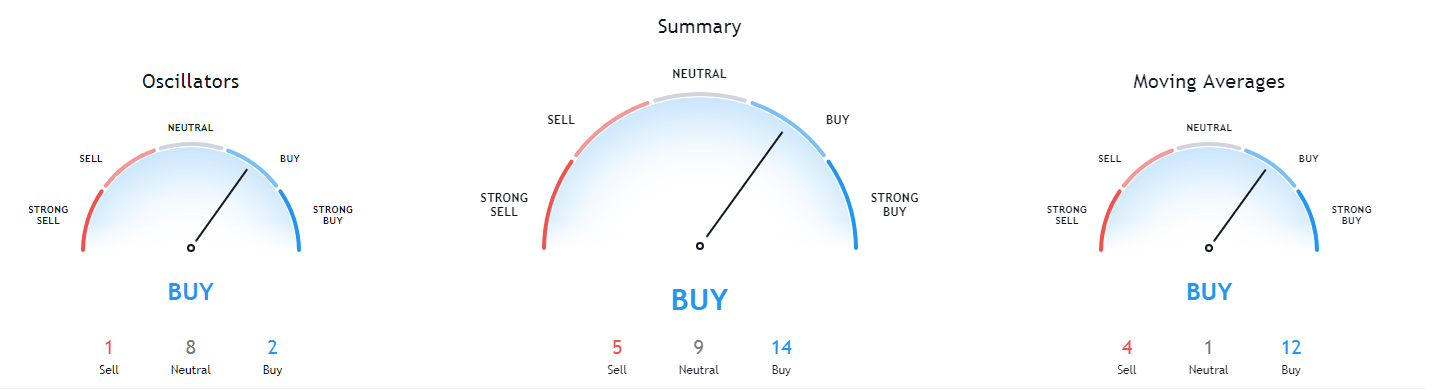
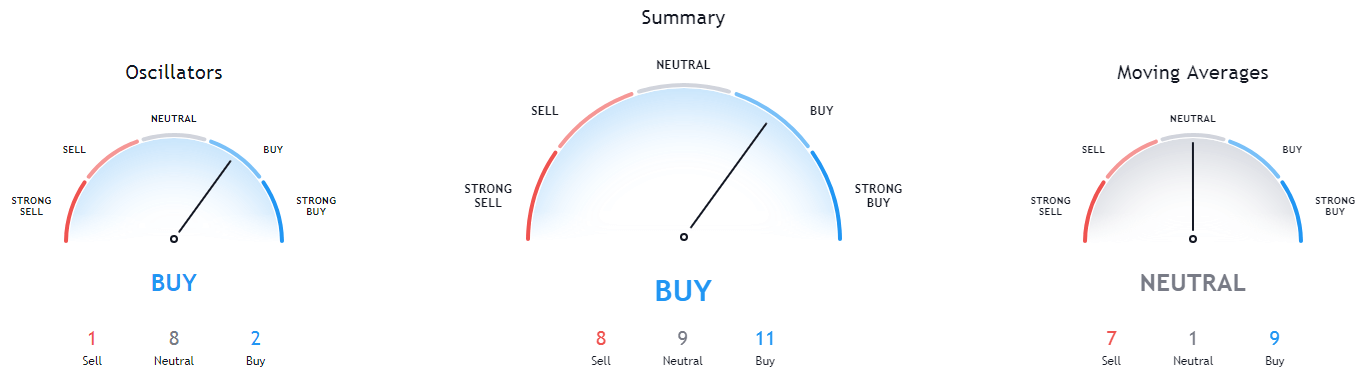
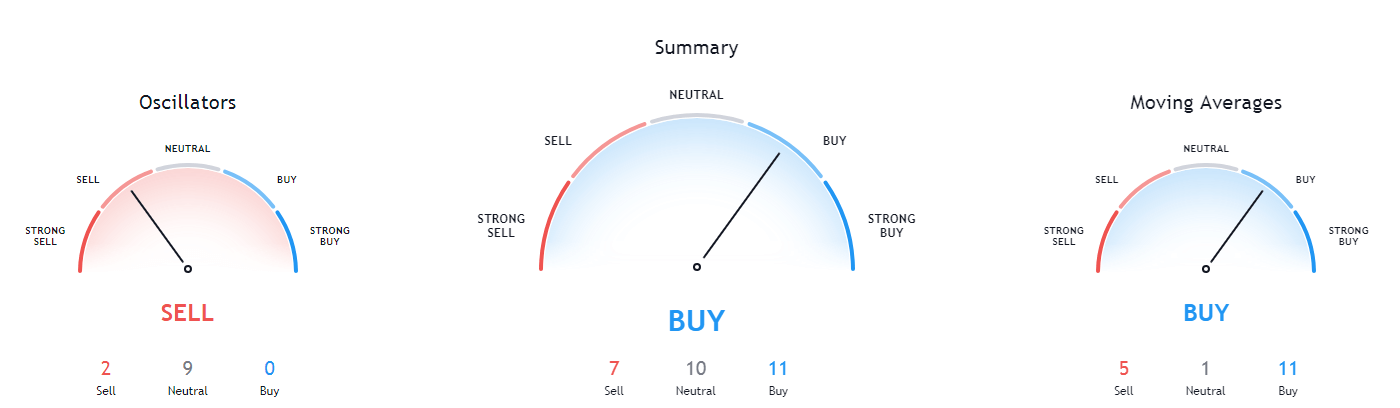
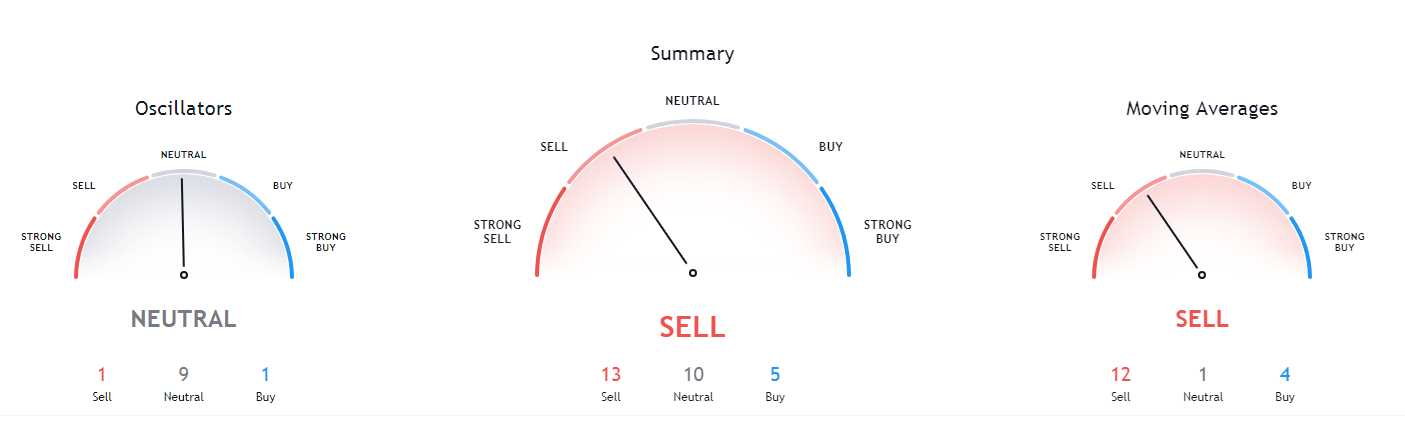
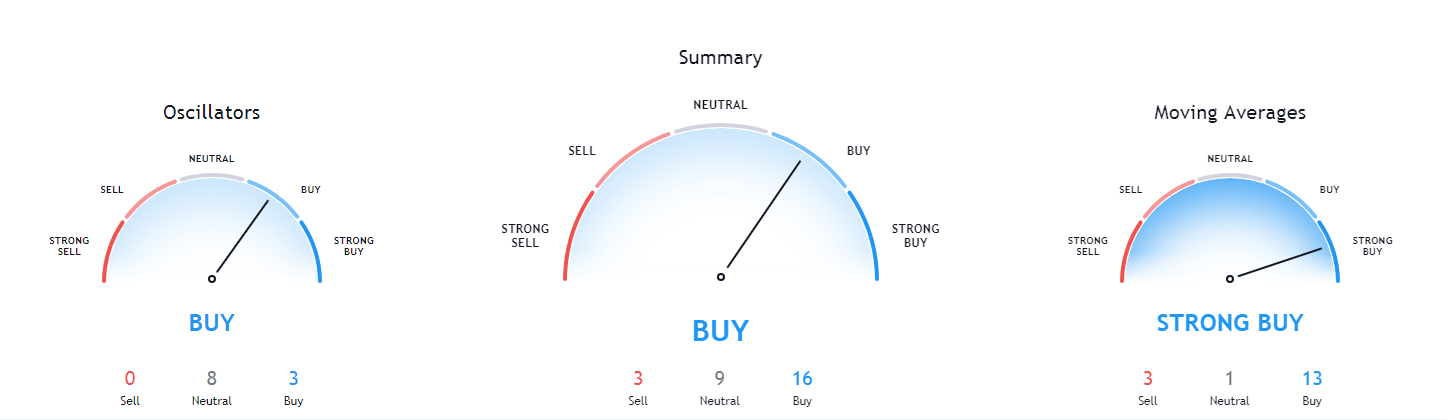
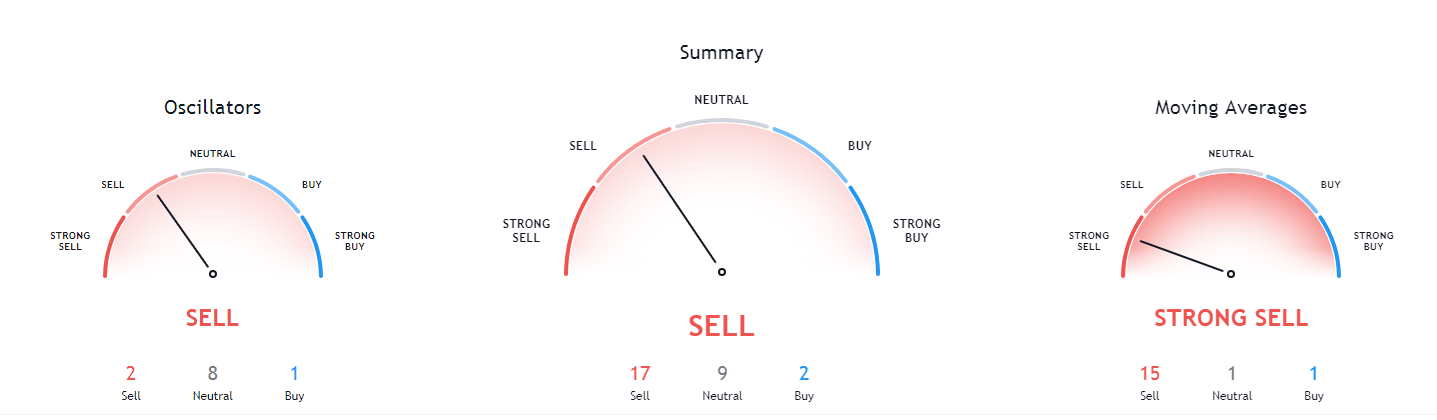
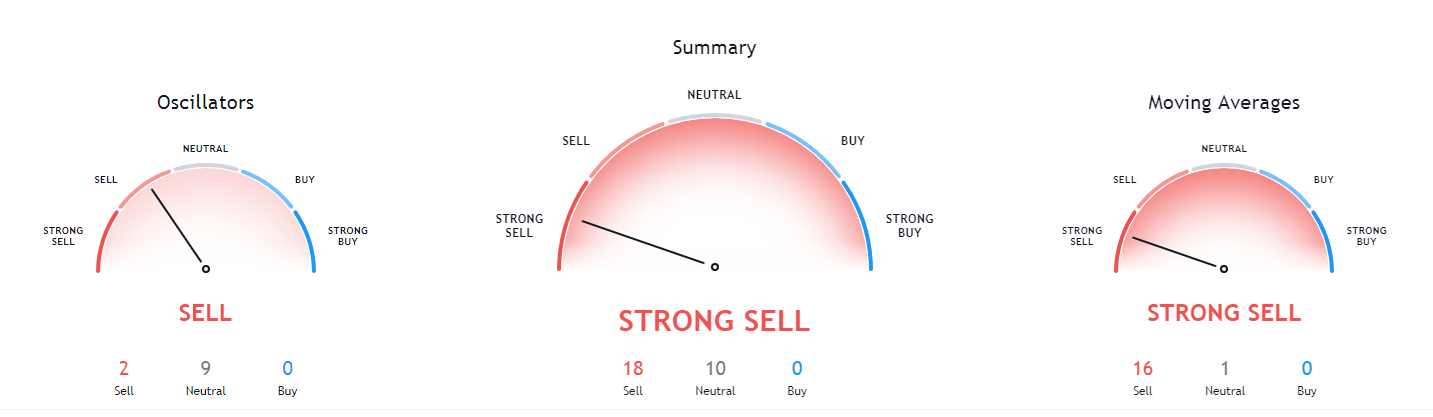
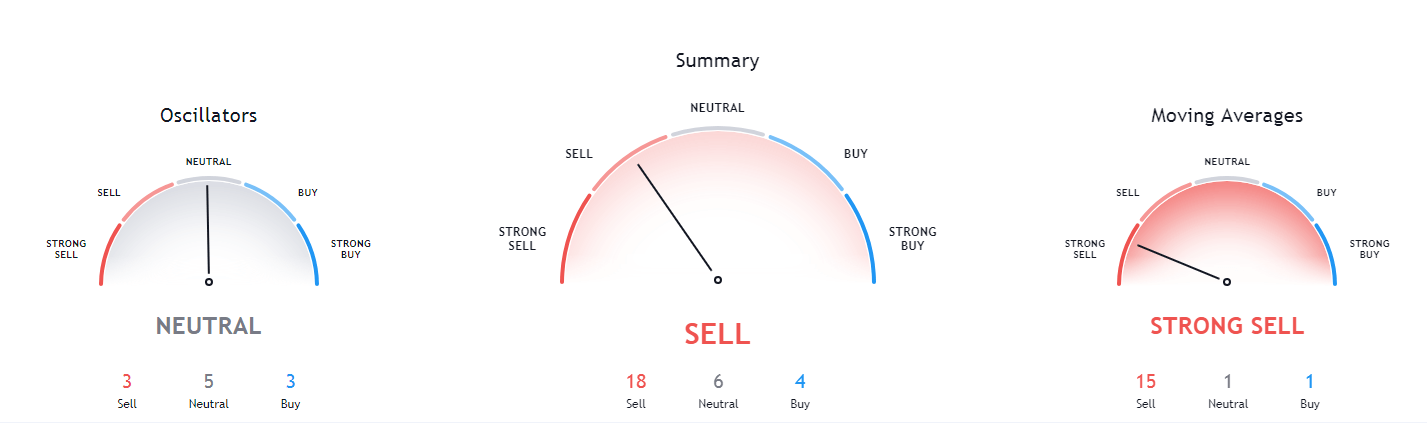
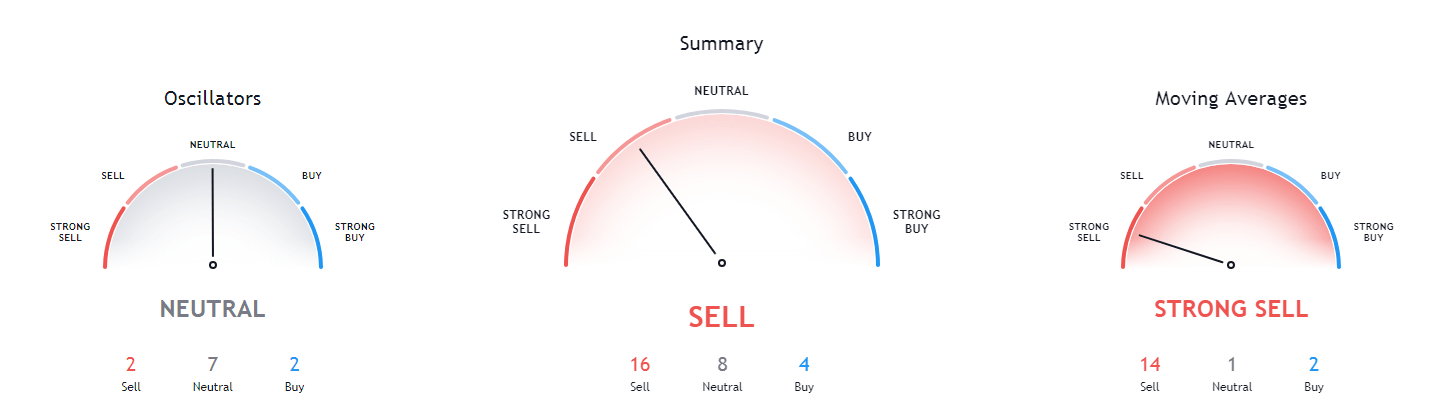
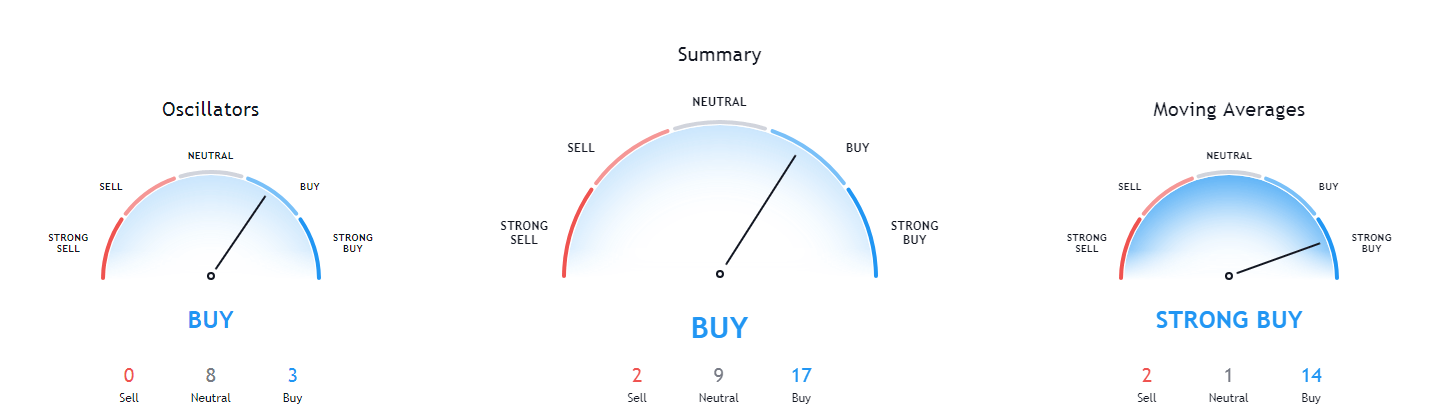
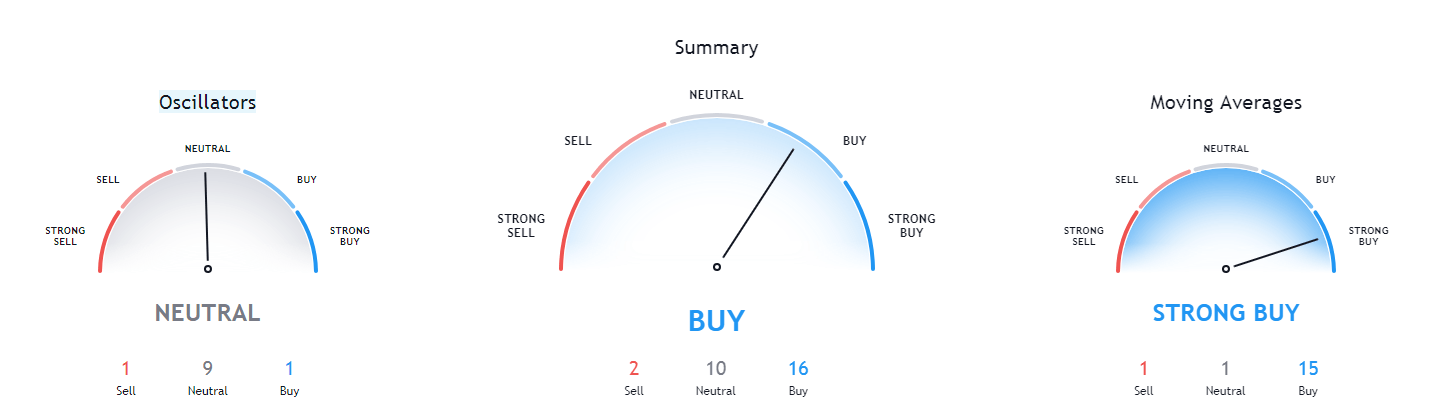
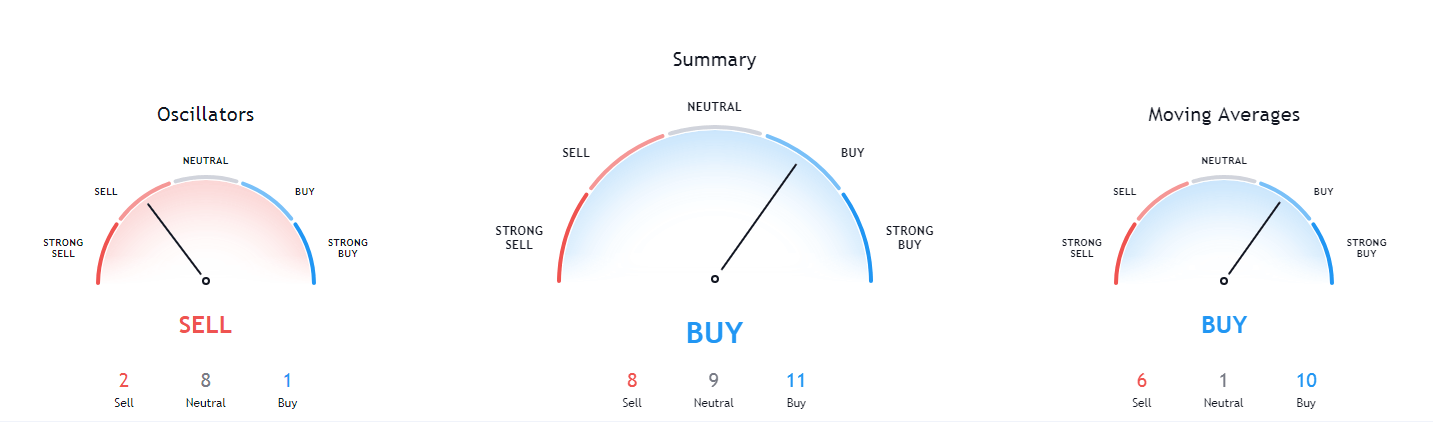
Ethereum’s technicals are tilted towards the buy-side on all time-frames, but only the daily time-frame is completely bullish. On the other hand, the 4-hour, weekly, and monthly overviews have signs of neutrality, mostly when it comes to oscillators.
ETH/USD 1-day Technicals
Technical Factors (4-hour Chart):
- The price is above its 50-period and slightly above its 21-period EMA
- Price is at its middle Bollinger band
- RSI is neutral (55.78)
- Volume is average
Key levels to the upside Key levels to the downside
1: $415 1: $400
2: $420 2: $378
3: $435 3: $371
Ripple
The fourth-largest cryptocurrency by market cap has stayed at the same place over the course of the past 24 hours, possibly preparing itself for a move towards the yellow ascending line. Even if it keeps following it, XRP will gain a significant boost in price and an opportunity to test $0.26 once again.
Traders should look for a trade when XRP reaches $0.26, as they can enter a trade on either the pullback or the push above.
XRP/USD 4-hour Chart
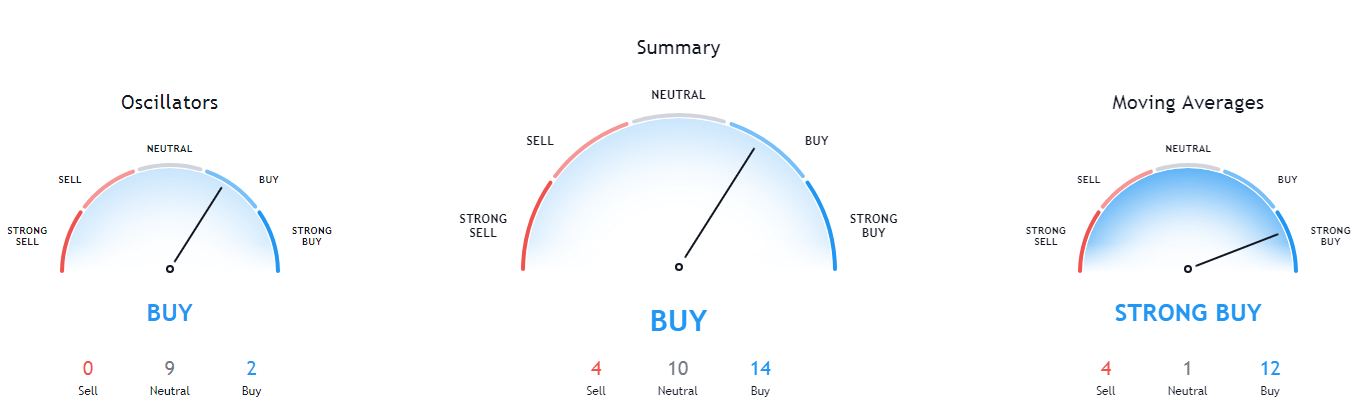
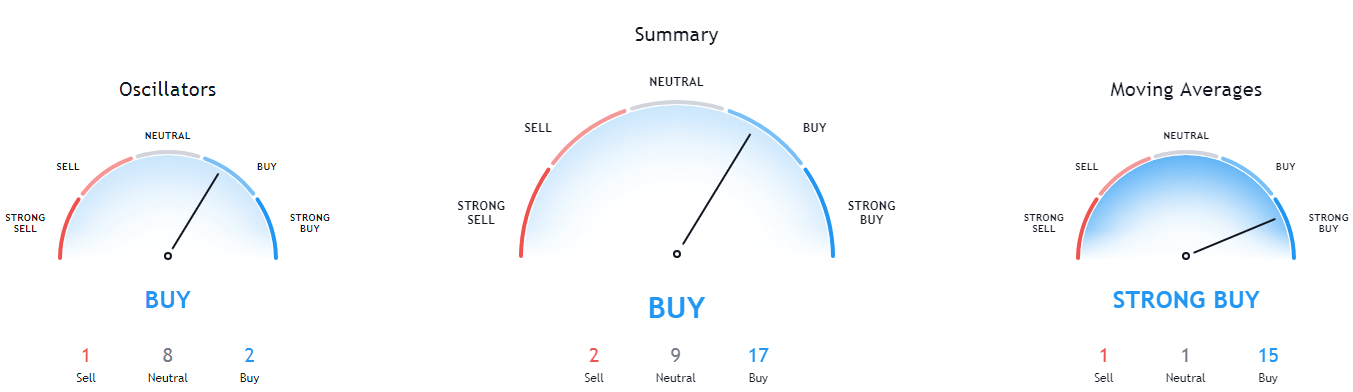
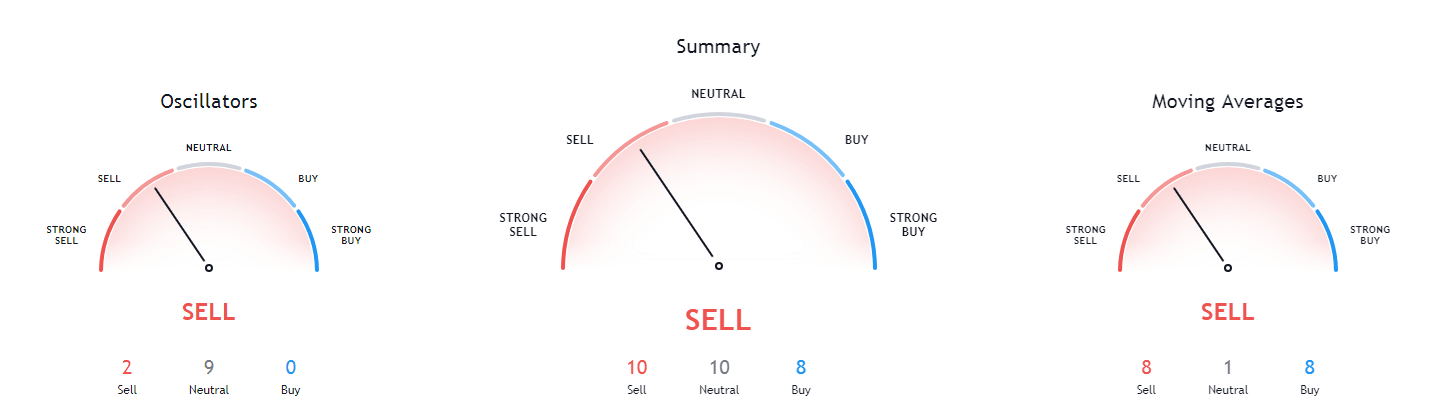
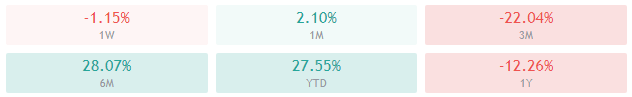
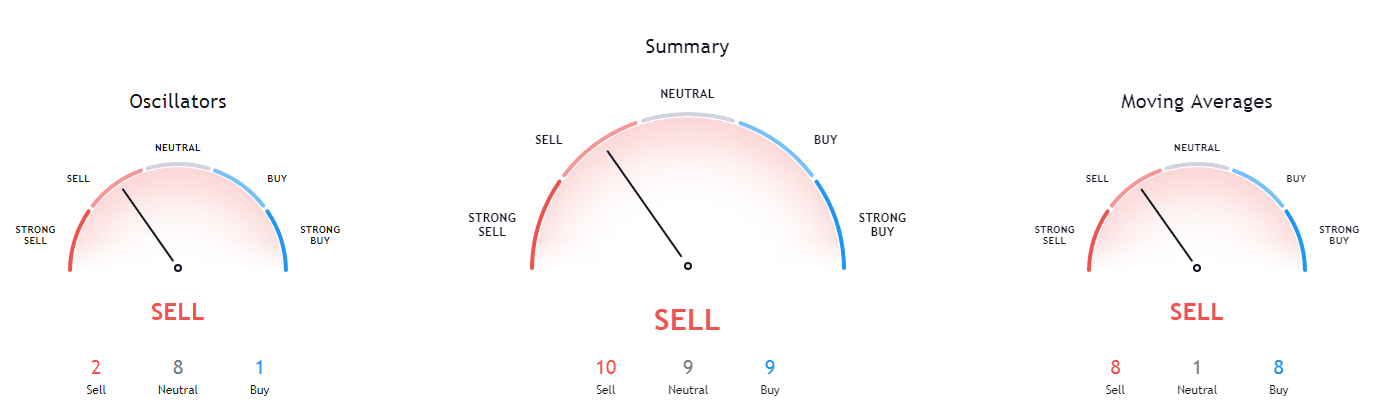
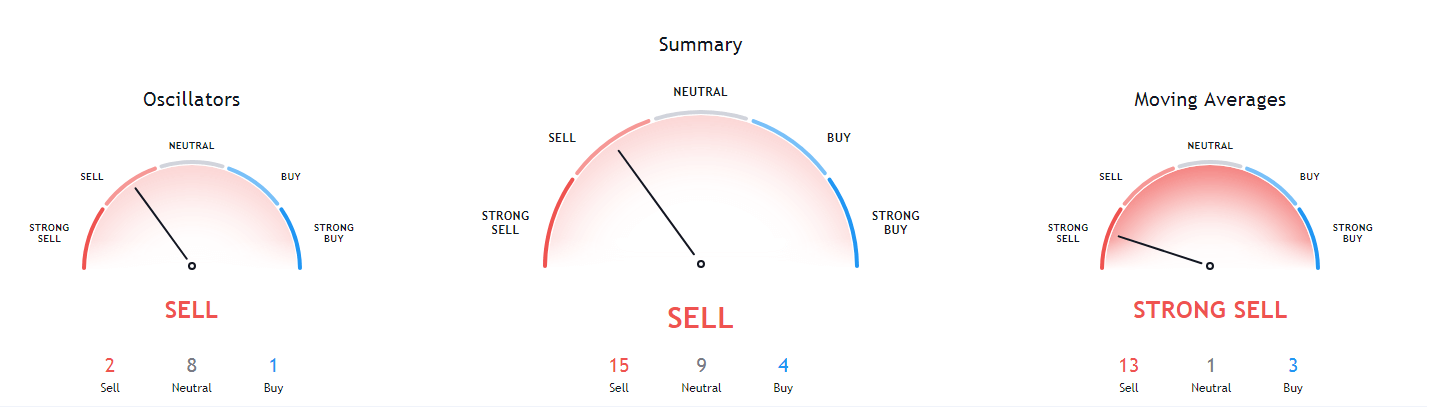
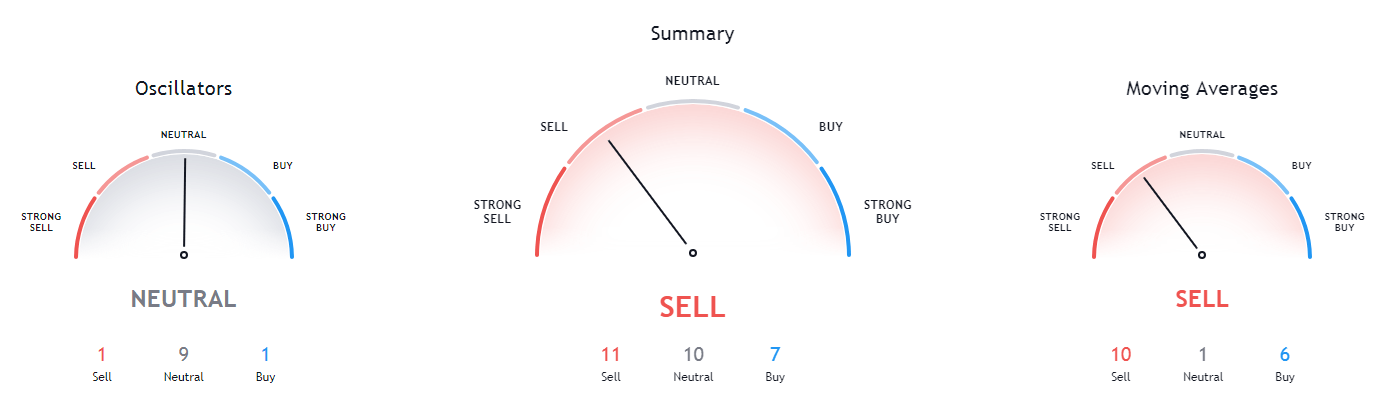
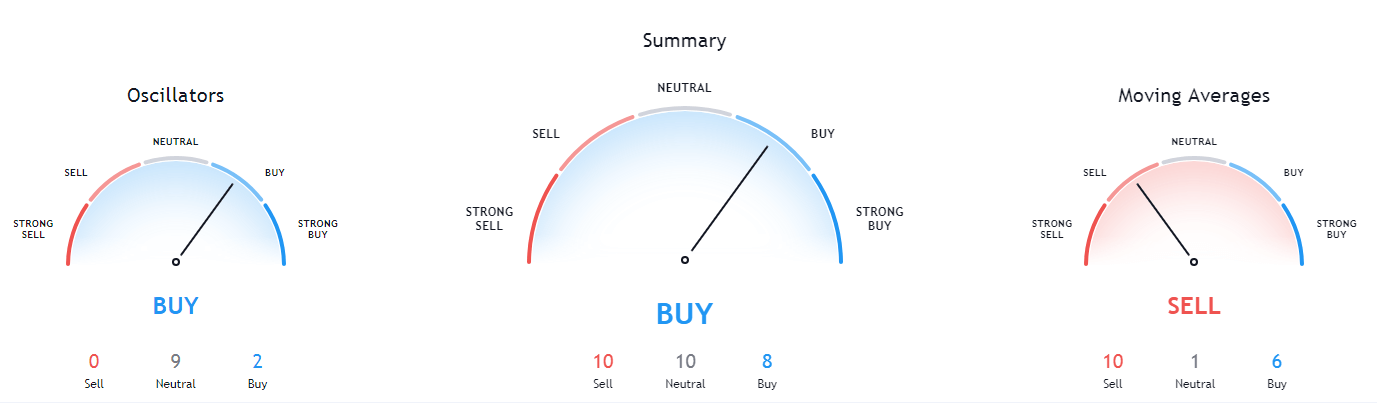
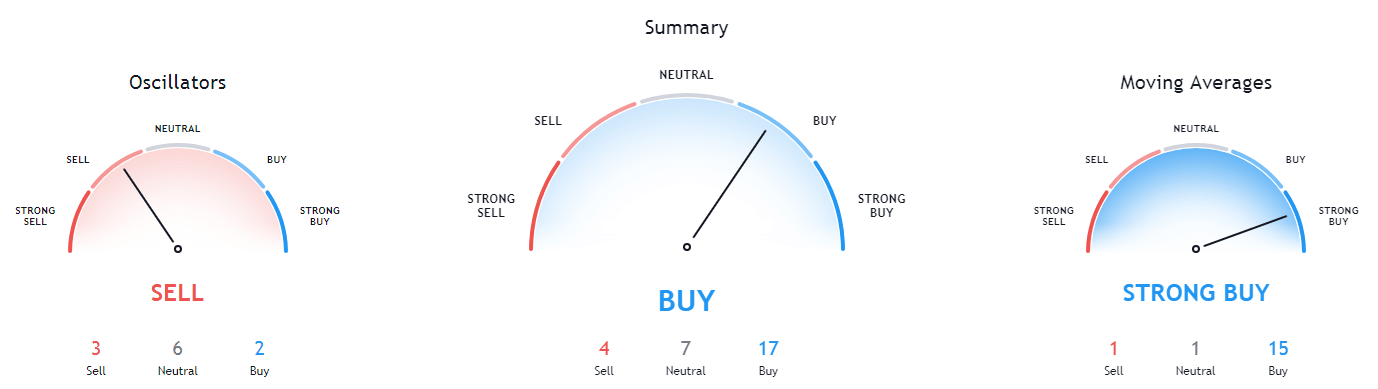
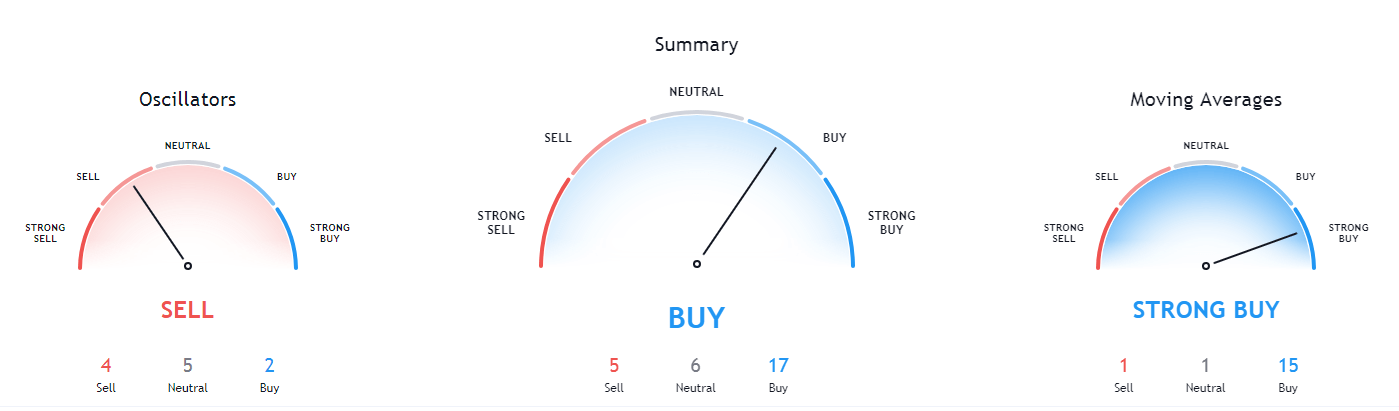
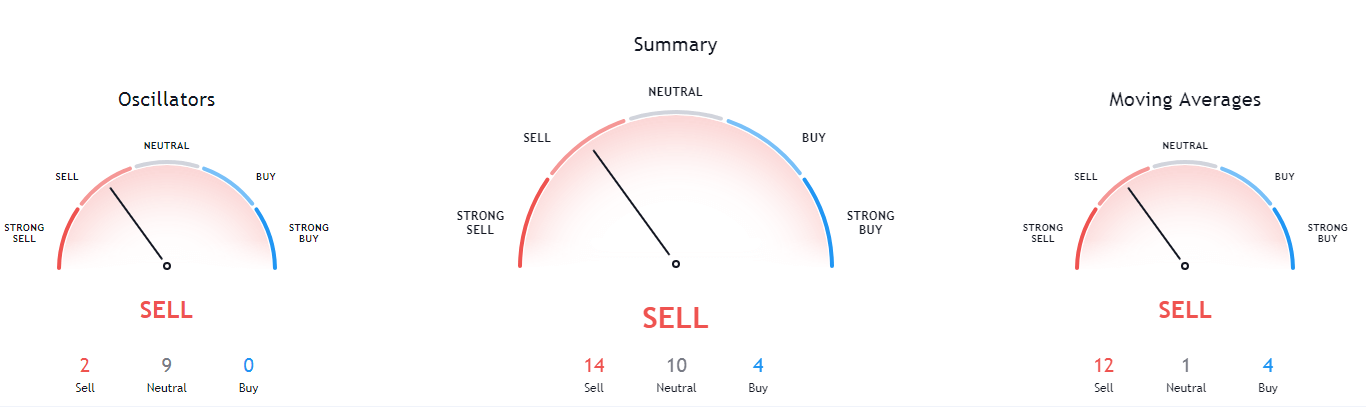
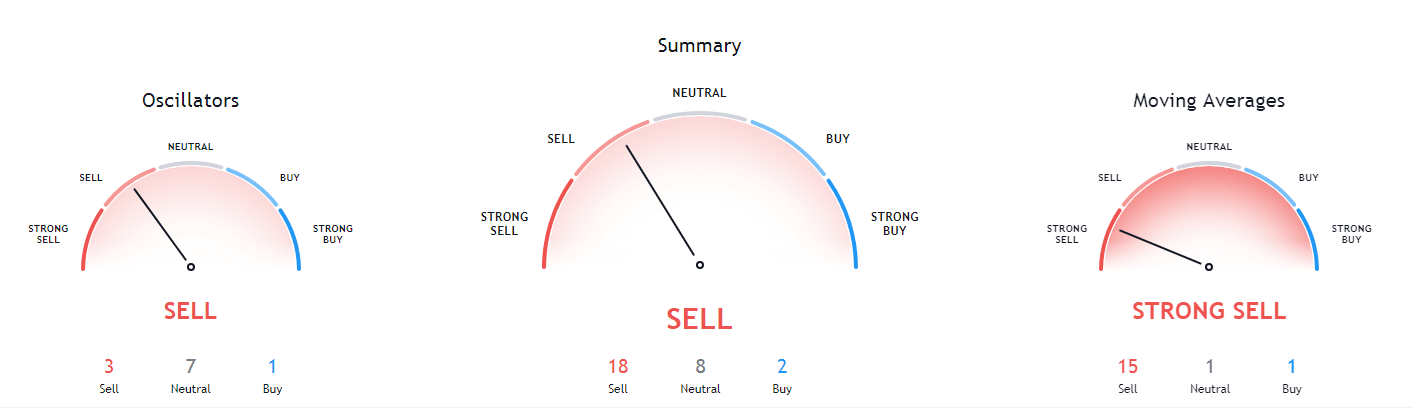
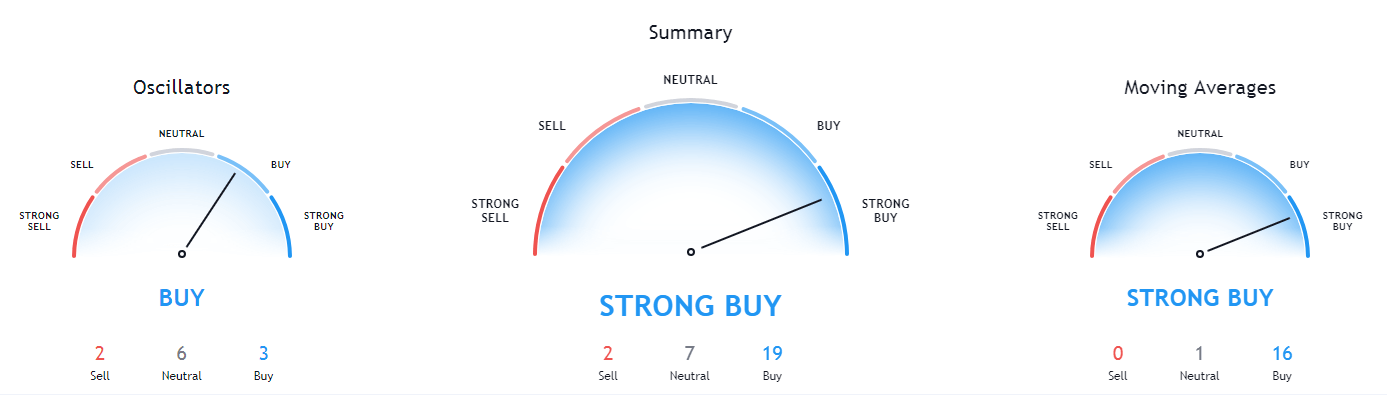
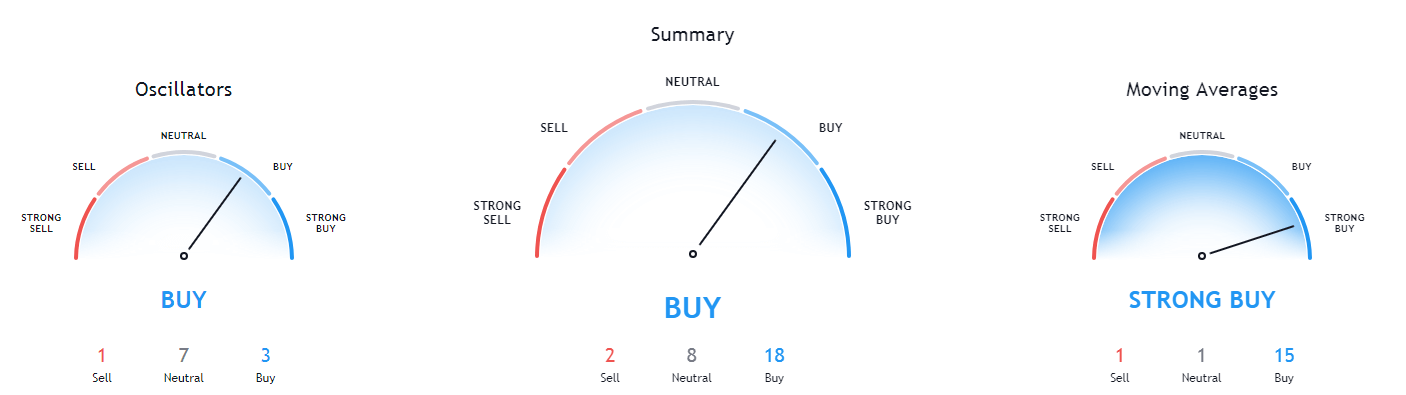
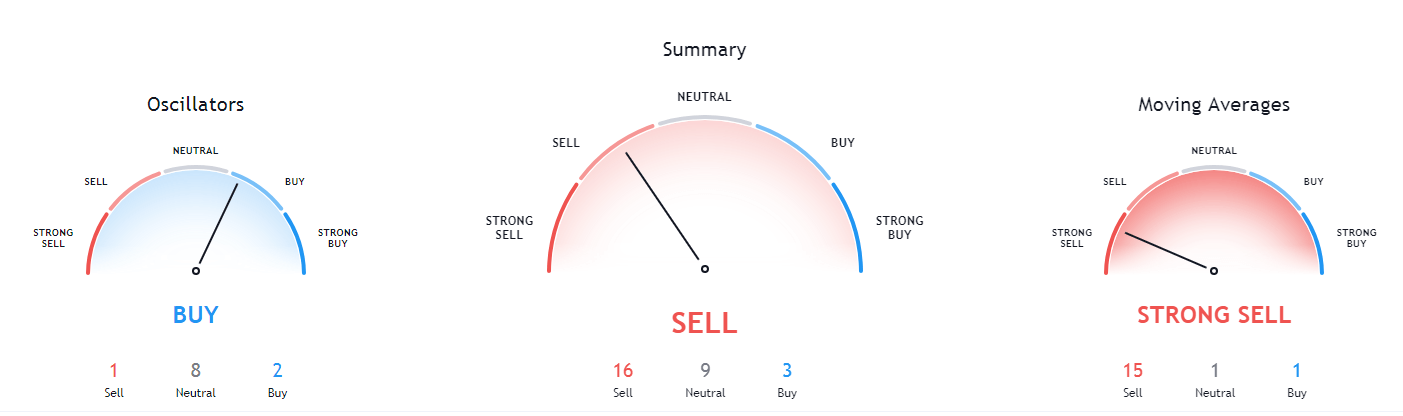
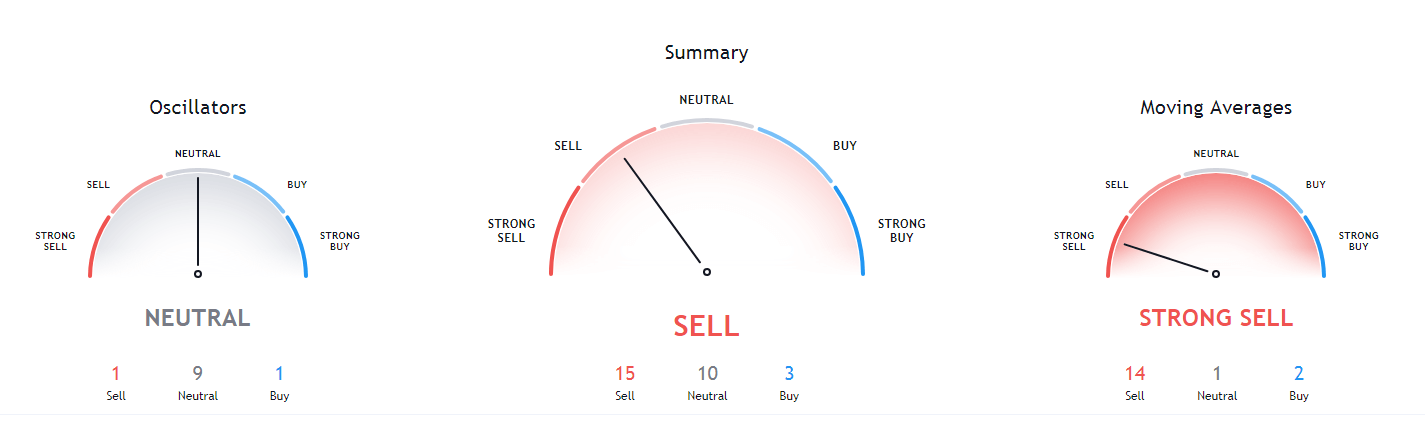
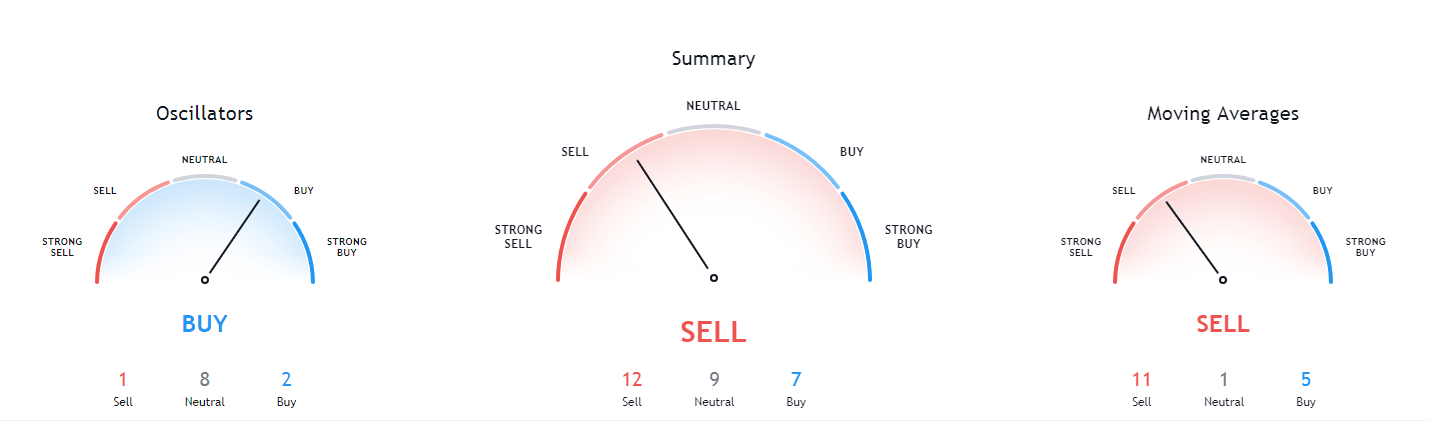
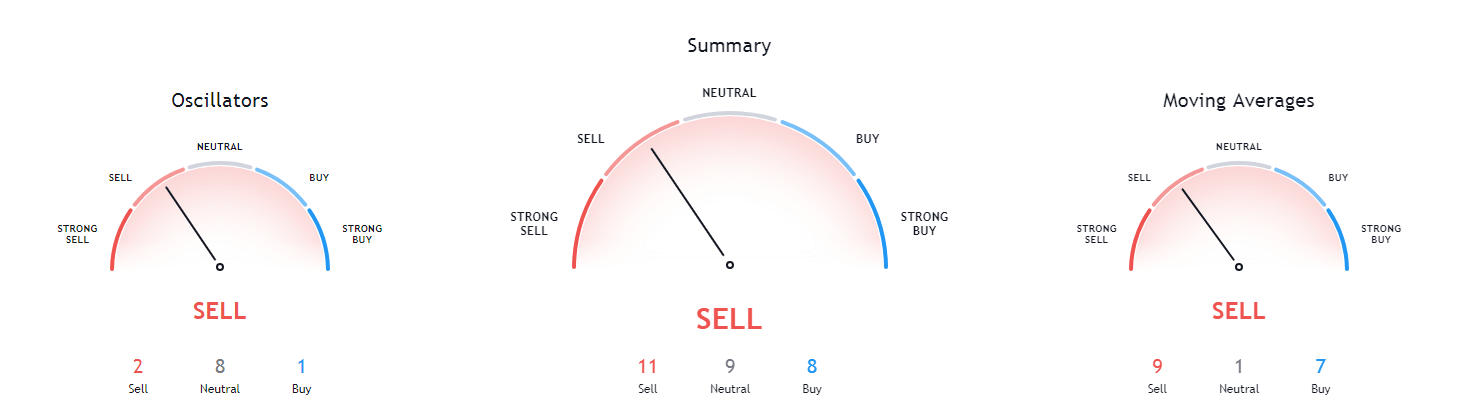
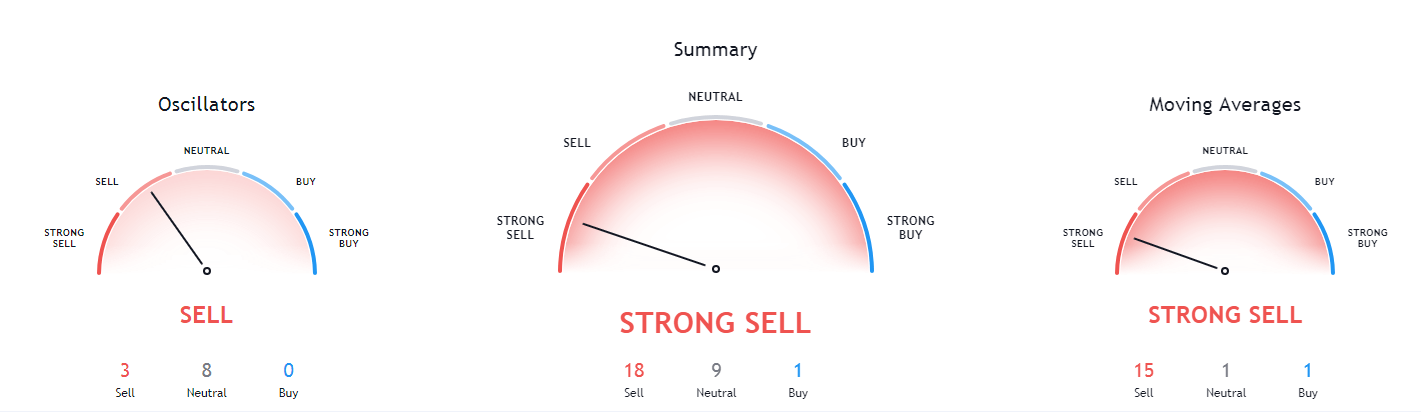
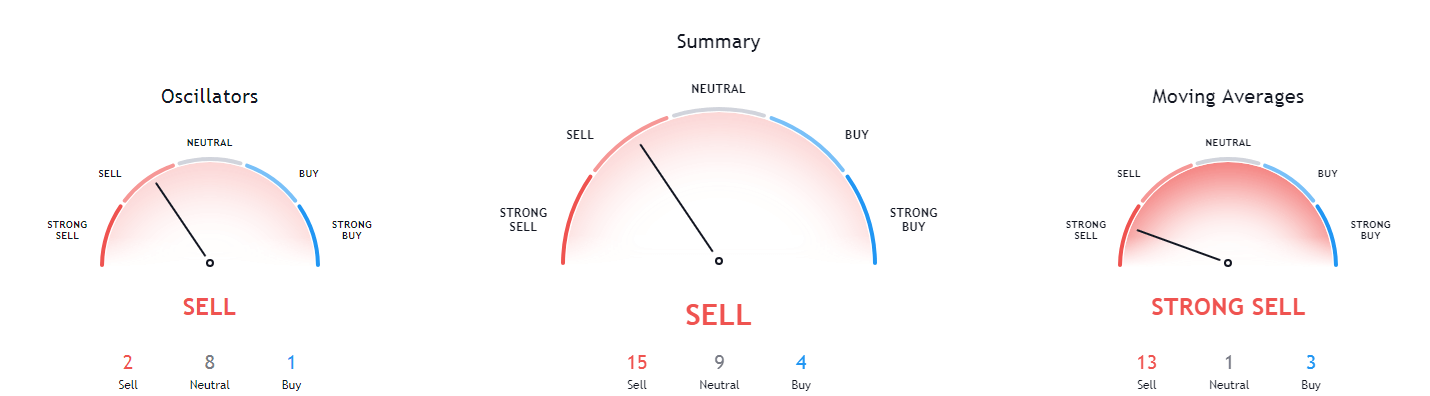
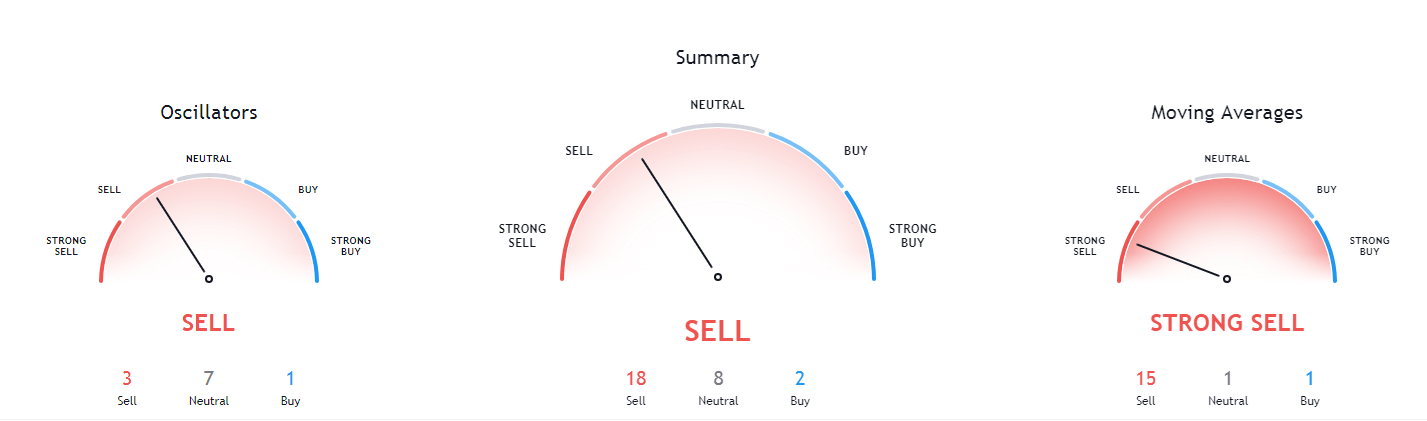
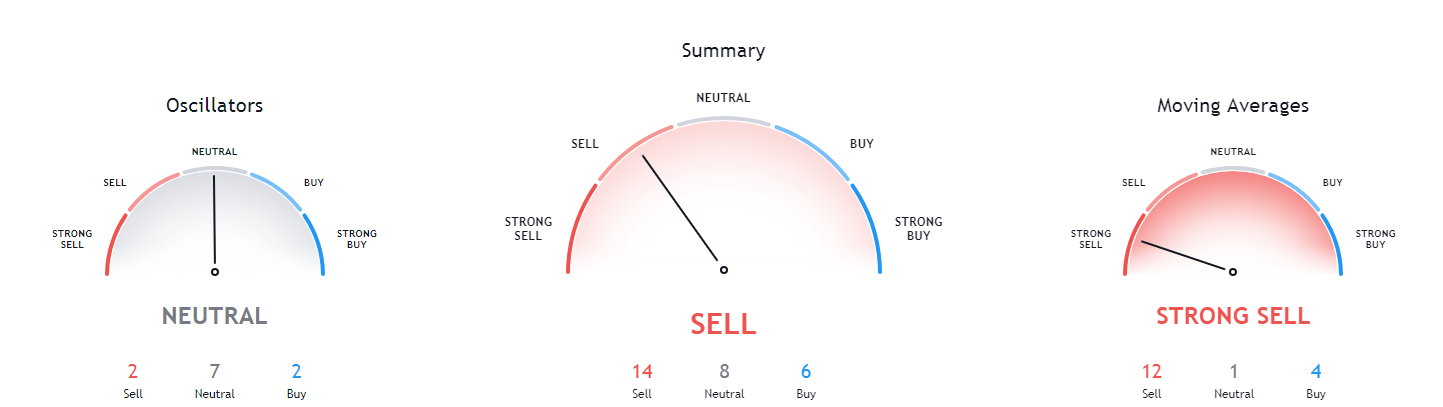
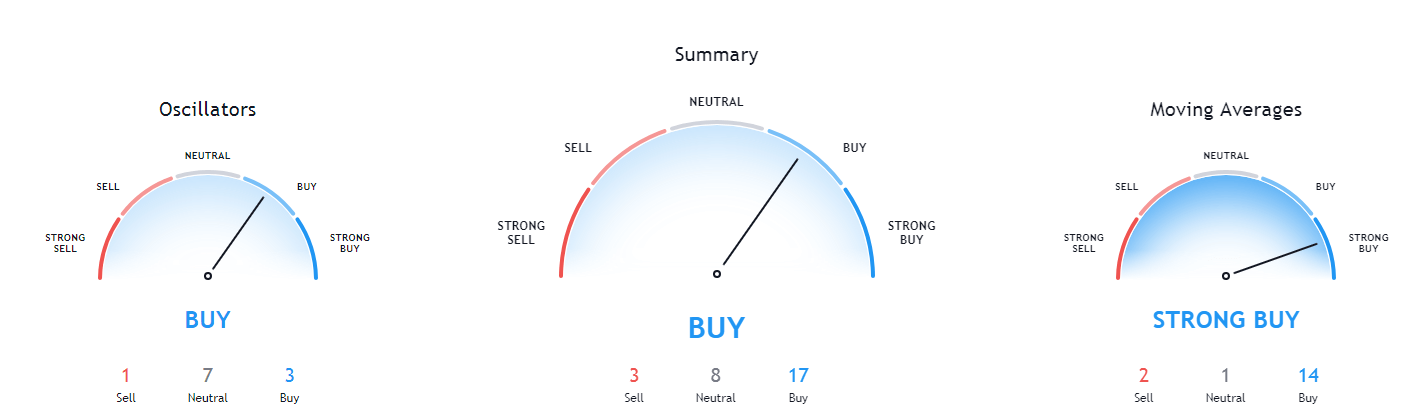
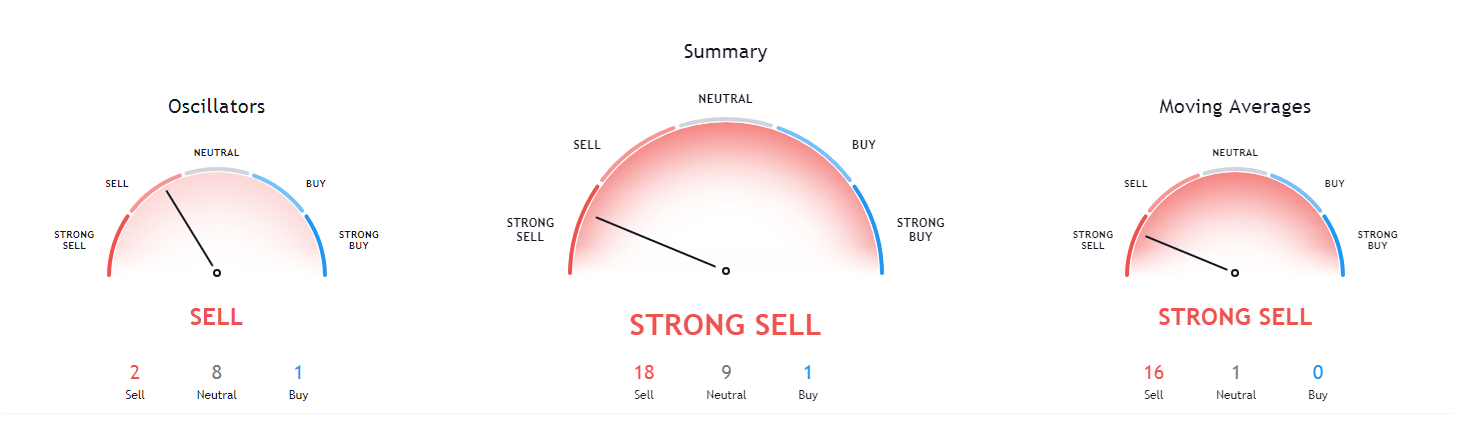
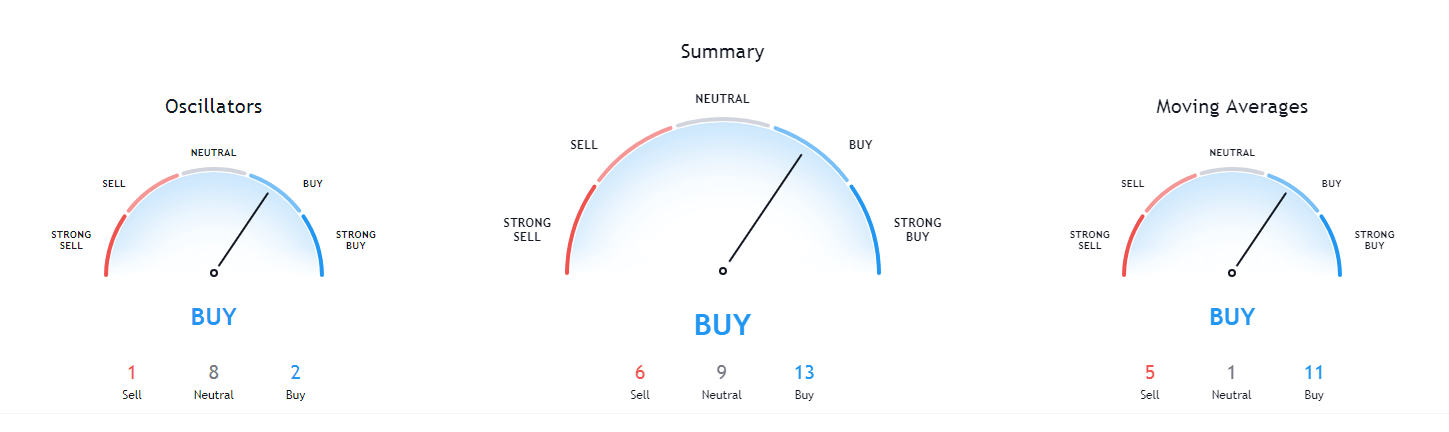
XRP’s technicals are slightly tilted towards the buy-side, but the 1-day, as well as 4-hour and weekly technicals, show slight neutrality. On the other hand, its monthly overview is still bearish.

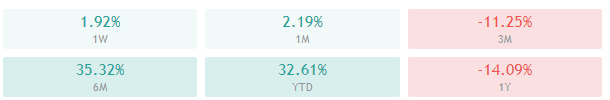
XRP/USD 1-day Technicals
Technical factors (4-hour Chart):
- The price at both its 50-period EMA and its 21-period EMA
- Price is at its middle Bollinger band
- RSI is neutral (50.04)
- Volume is average
Key levels to the upside Key levels to the downside
1: $0.26 1: $0.2454
2: $0.266 2: $0.235
3: $0.2855 3: $0.227