Trading the markets is an art, which is hard to master but very fruitful in the long run. There are various tools that traders can use to time the market such as Candlestick patterns, Indicators, Trading patterns, Price action tools, etc. Traders who decided to master these tools always end up generating huge money from the market. In this beginning, it is advisable to pick only one or two trading tools and use them in conjunction with others to master the markets. Here in this article, we choose the Bollinger Bands indicator with the Rectangle Pattern to successfully time the markets.
RECTANGLE PATTERN
The rectangle is a technical chart pattern that appears during an ongoing trend in an asset. This pattern is known as the continuation pattern used by the traders to anticipate the ongoing trend. The rectangle pattern is easily identifiable by two comparable highs and two comparable lows. Connect the highs and lows to form the two parallel lines that make up the bottom and top of the pattern. The qualify as a continuation pattern, the markets must be trending. Look for two equivalent highs and lows to have a pattern on the price chart. The pattern appears on all the trading timeframes, and ideally, the higher timeframes sometimes take nearly 3 to 4 months to form a pattern, and on the lower time frame the pattern prints very often. There are various ways to trade the pattern, some like to trade it after the breakout, and some like to trade it before the breakout, and for trading it before the breakout, we must use the Bollinger band to time it successfully.
BOLLINGER BANDS
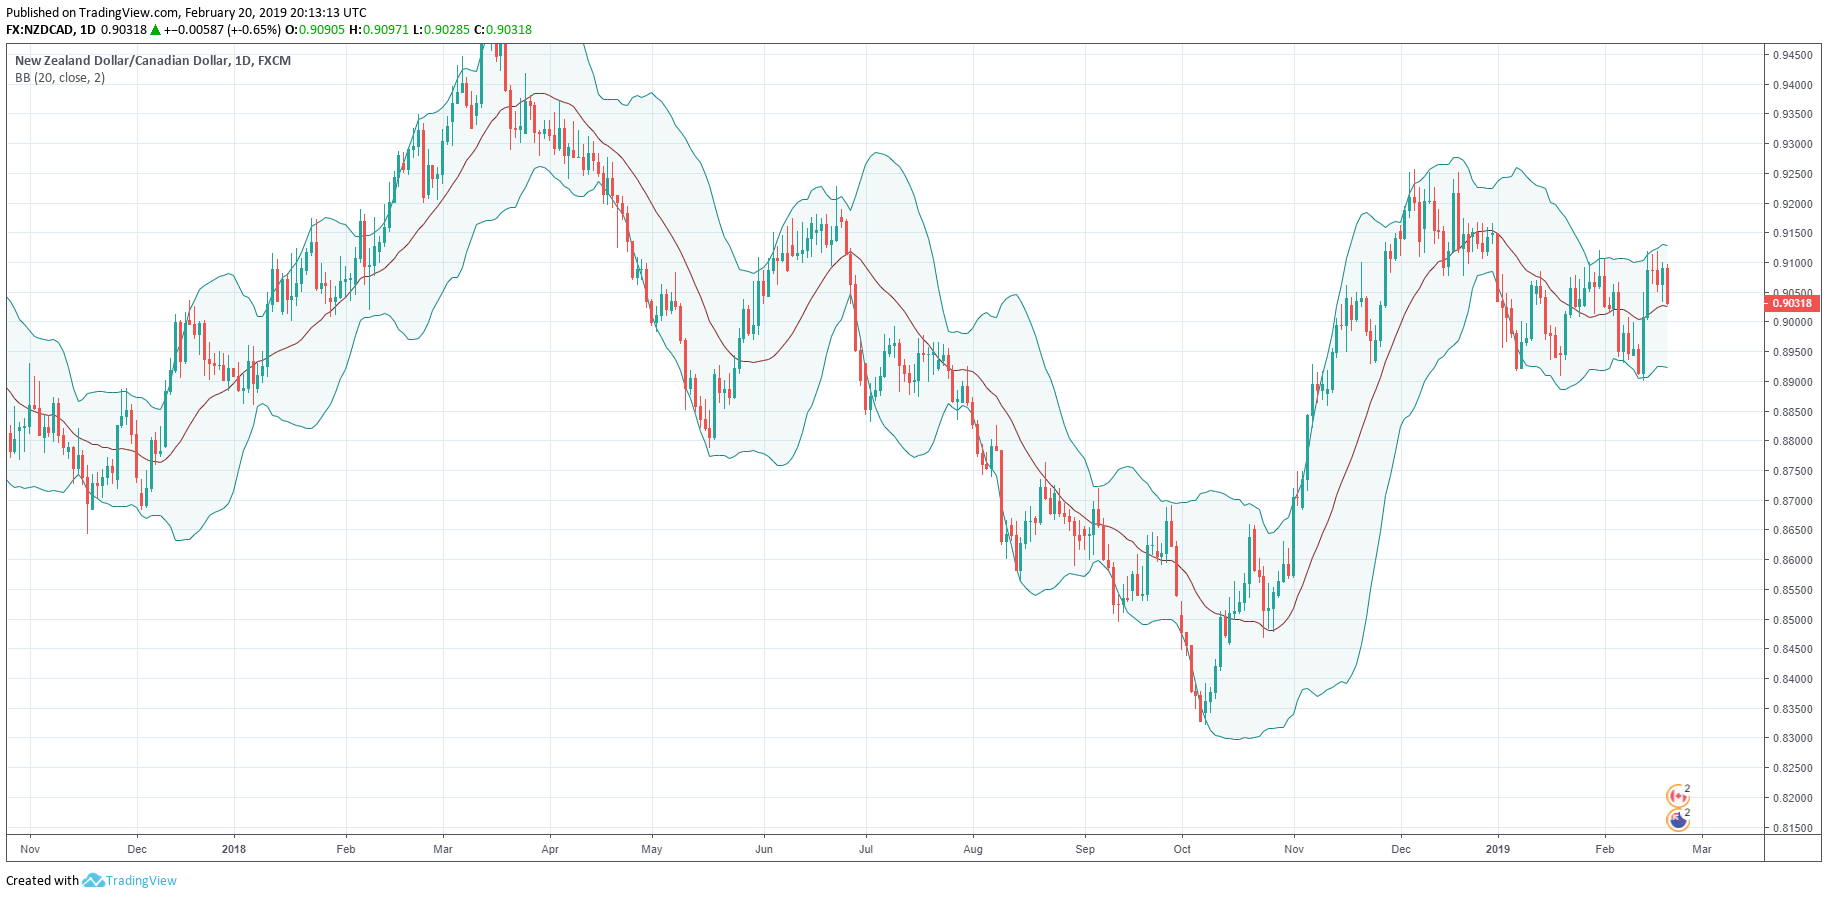
Bollinger Bands are a price envelope developed by John Bollinger. The indicator consists of 20 periods SMA and upper and lower band. When the bands tighten, it is an indication of low volume, and the wider pattern is a sign of high volume. Sometimes prices immediately go in the opposite direction and reverse before the proper trend begins, watch out for all of these fake moves before taking an entry. The price action touches the upper band, it’s a sign of selling trade, and when it touches the lower band, it is an indication to go long. When the prices continually touch the upper band, it means the markets are overbought, and when it keeps touches, the lower band is a sign of the oversold market conditions.
TRADING STRATEGIES
FOR BUYING
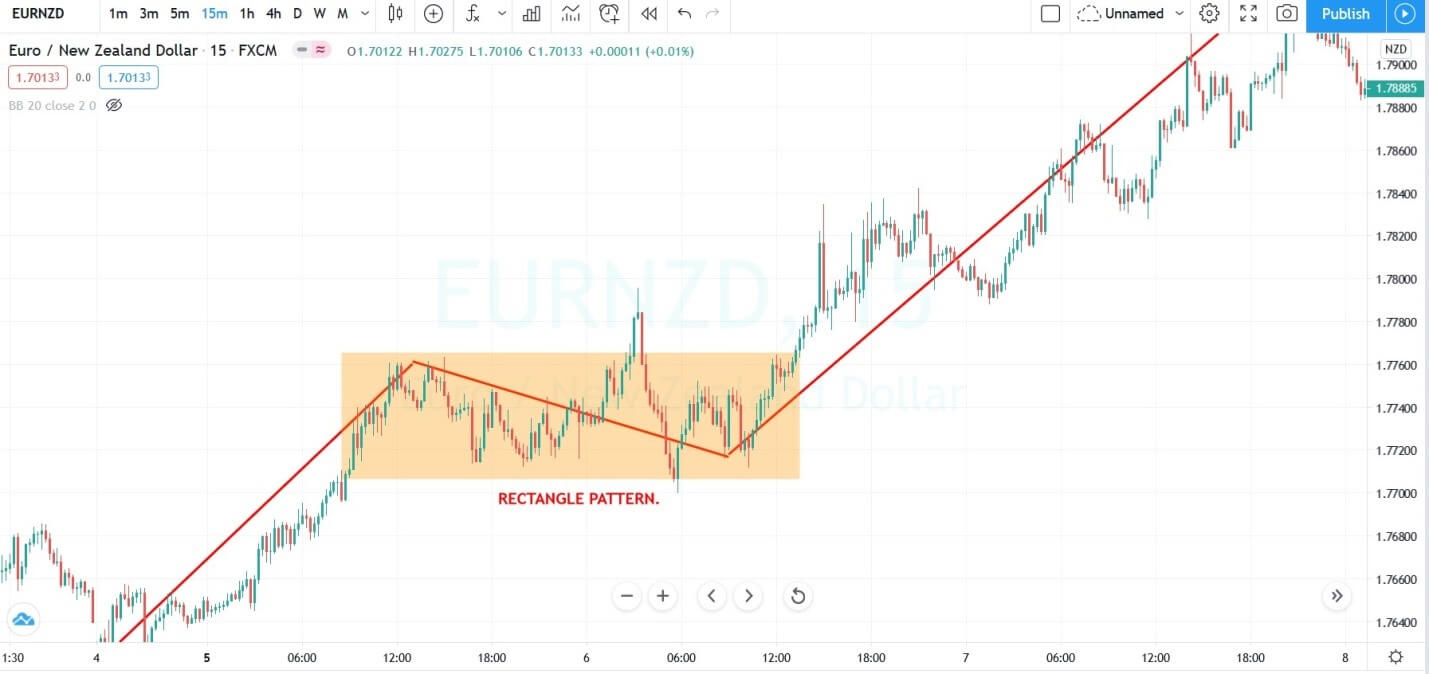
The image below represents the rectangle pattern in the EURNZD forex pair.
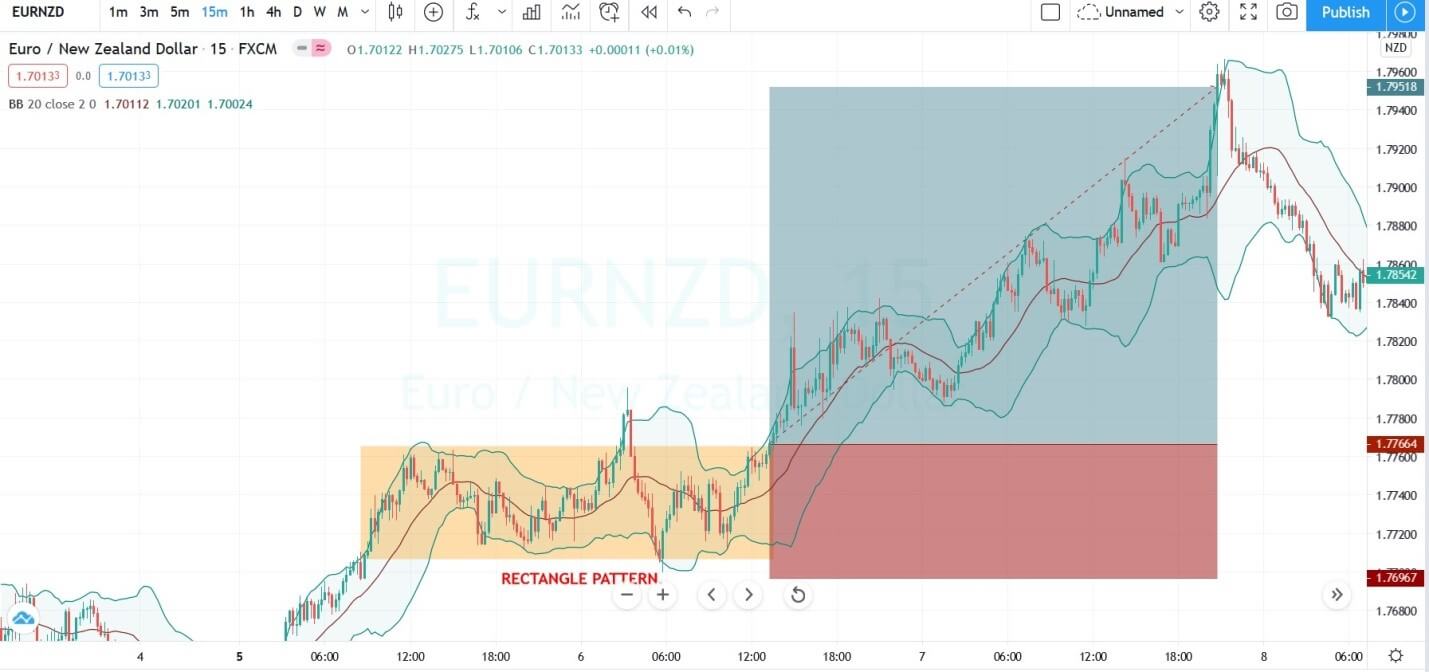
The image below represents the buying entry in the EURNZD pair. We witnessed the rectangle pattern in an uptrend, and after the pattern was a sign to go long. The price action touched the upper band; it was a clear sign that the buyers are gaining momentum, and soon we are going to witness the brand new higher high. On the other hand, Bollinger band traders were preparing to go short just because the prices approach the upper band. This is not a good approach, always uses the indicator in context with the trading pattern, and follows what the pattern is saying, and made decisions accordingly.
FOR SELLING
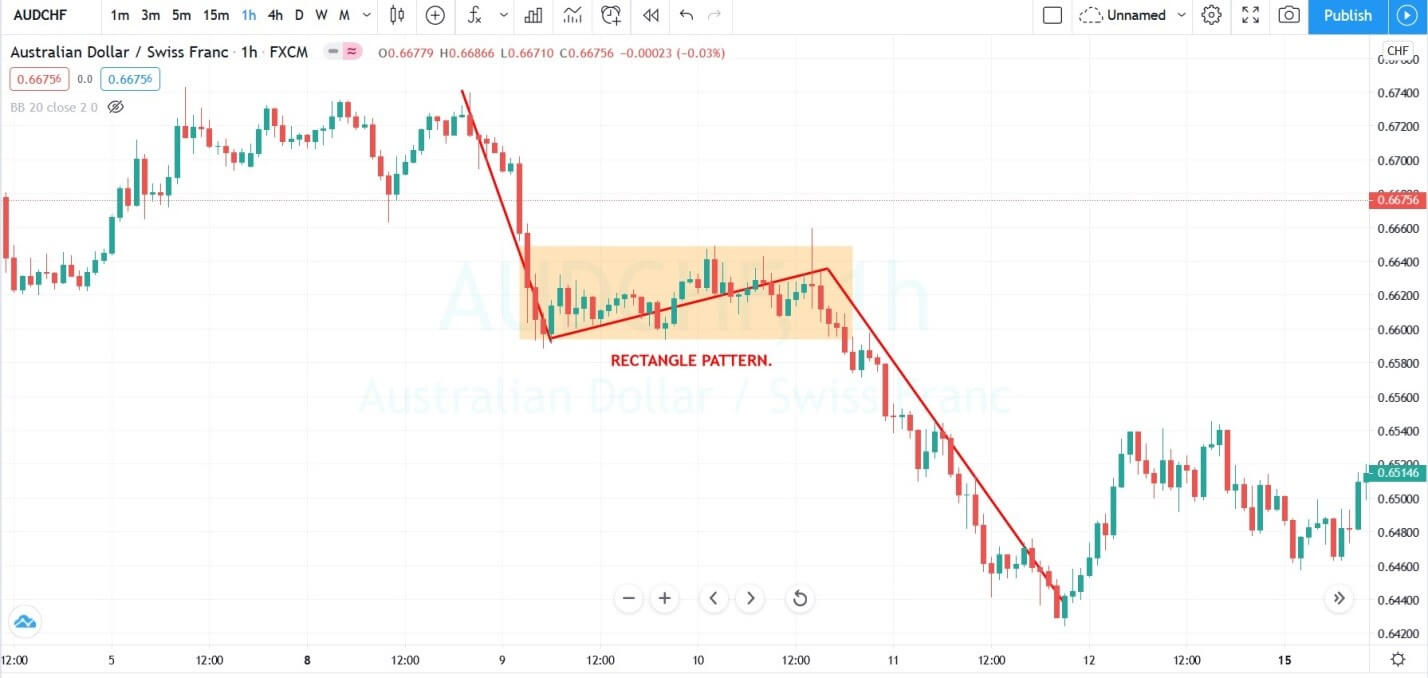
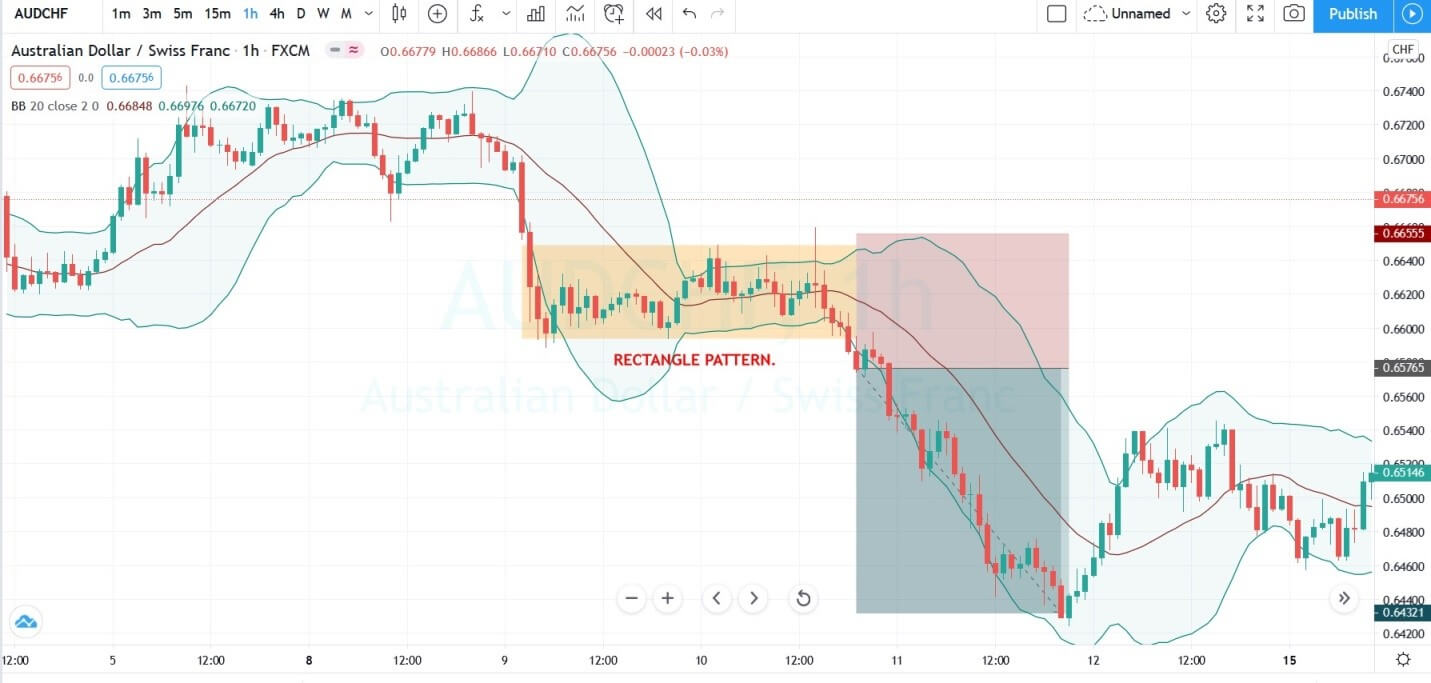
The image below represents the Rectangle pattern in the AUCHF forex pair.
The currency was in an overall downtrend, and during the pullback phase, the appearance of the rectangle pattern is a sign for us to look for the selling trade. After the breakout of the pattern when the price action touches the lower Bollinger band, we choose to go short. Some traders believe when the prices touch the lower band, it means to go long, and when the prices touch the upper band, it means go short. That’s not the right approach. In reality, if the prices keep touching the lower band, it means the downtrend is gaining momentum, and going short will be a good idea.
USING THE BOLLINGER BAND TO TRADE THE PATTERN BEFORE COMPLETION
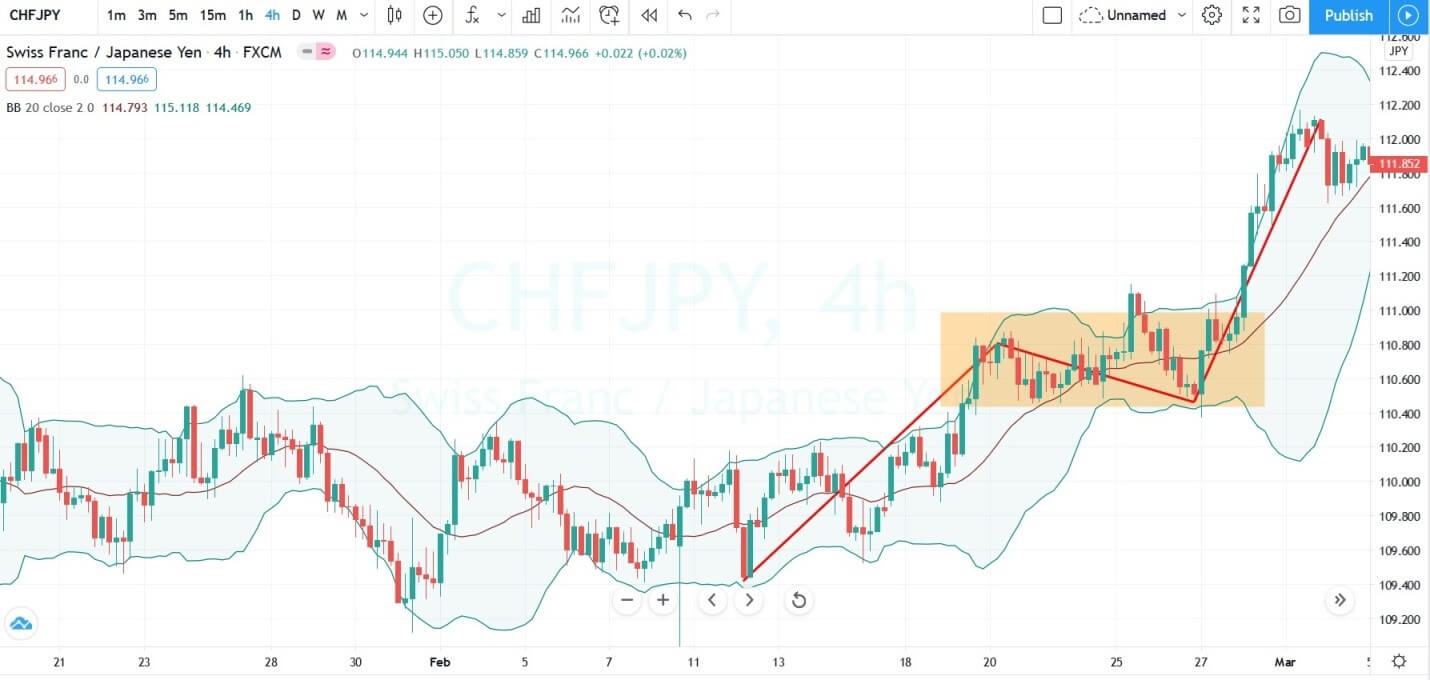
The idea is to let the price for printing half of the rectangle pattern first, and when the prices touch the lower band and go above the center line, it is a sign to go long. The center line breakout is an indication of the buyers gaining momentum, and soon we can expect the breakout of the pattern.
The image below represents the buying trade in the CHFJPY forex pair.
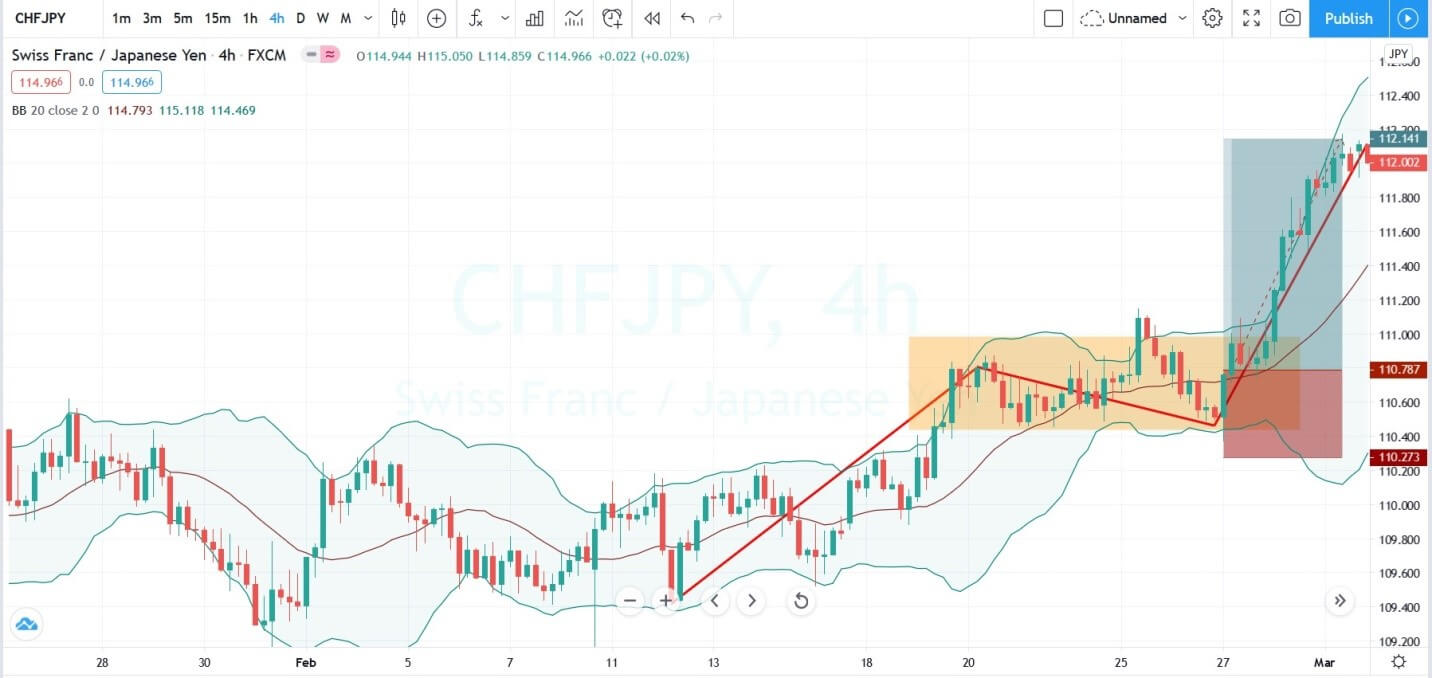
As you can see in the image below when half of the pattern was completed, and the prices go above the center line aggressively, we choose to go short with the stops below the pattern. The stronger buyers break the pattern, and it prints the brand new higher high. In this way we can easily time our trades well and often we got a better risk to reward ratio trades.
LOOKING FOR THE FAKEOUTS TO TRADE THE RECTANGLE PATTERN
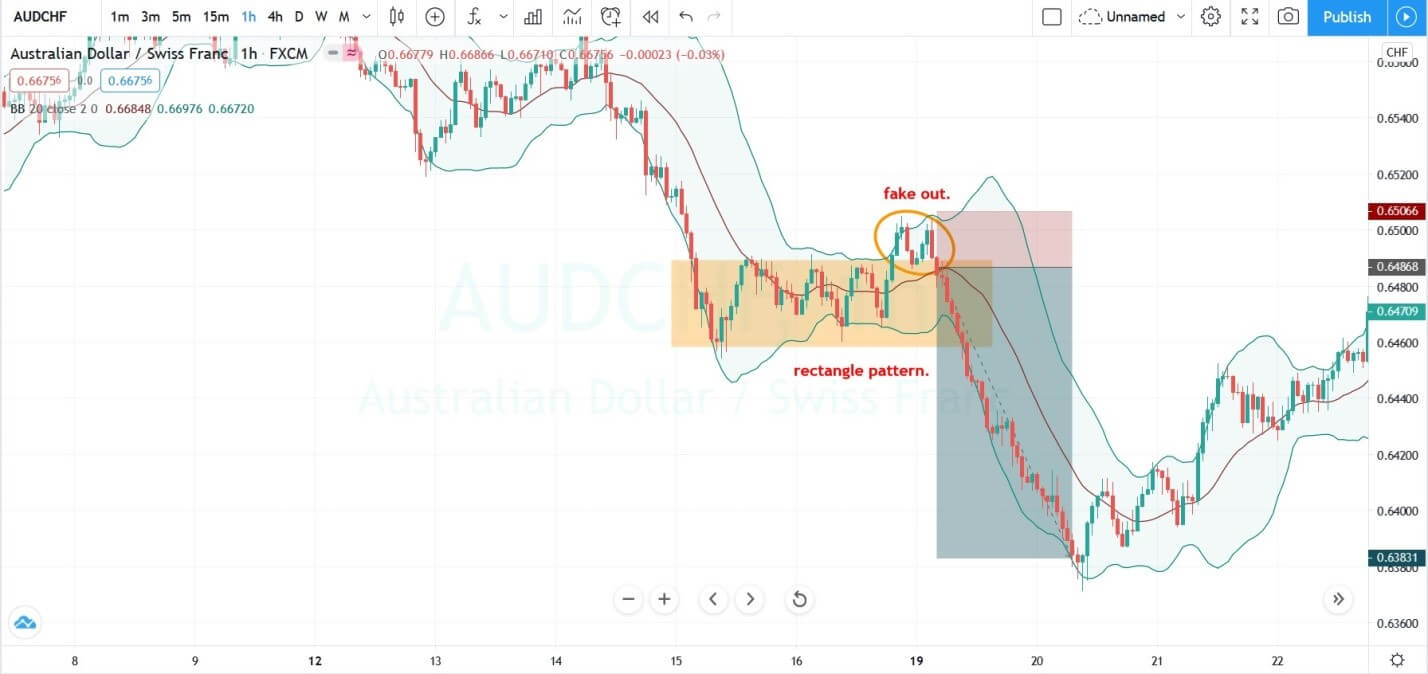
Sometimes the price action prints the fake-out first before moving to the original direction. These fake-outs are the signs that the original trend is trying to trap more and more of the opposite party to move in the original direction. When you identify any fake-out where the prices go above the pattern and immediately came back, it is a sign for us to anticipate in the market.
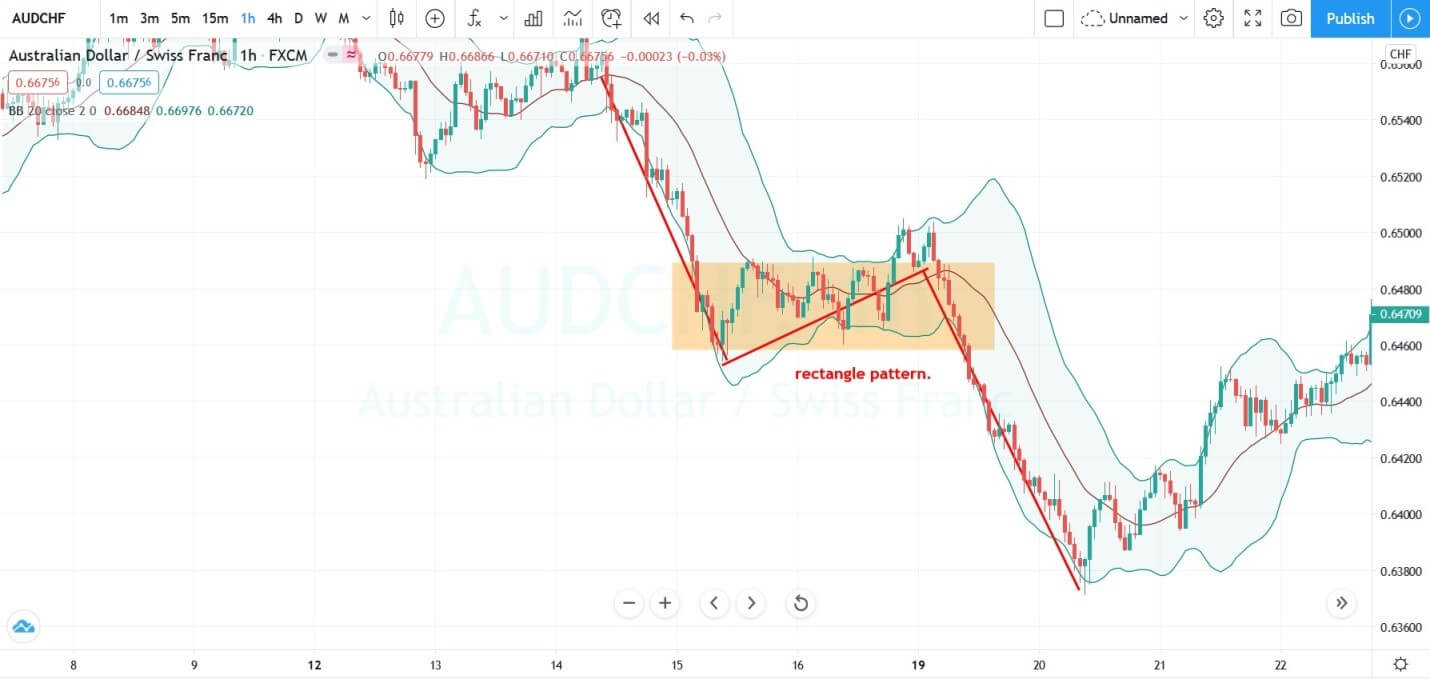
The image below represents the rectangle pattern in the ADUCHF forex pair.
In the image below, when the price forming the rectangle pattern, the buyers just went out and touched the upper band of the Bollinger. By acting as a support area, the upper band immediately pushed the prices back into the rectangle pattern. The failure of the buyers to break above the pattern is a sign to go short. We use the smaller stop loss above the Bollinger because the rectangle upper line and upper Bollinger band line was a strong level to hold the prices.
CONCLUSION
Bollinger and rectangle both are different trading tools that help the trader to identify the different market conditions and trading opportunities. One can use these two tools alone, or we can pair them with one another. If the traders use the rectangle pattern alone to trade the markets, it will give you good trades, but pairing it with the Bollinger band will give you the extra edge to time the market even before the pattern formation. Most often you will find this pattern only in the trending market conditions, and it is advisable to go big when both of these tools to lining up in one direction.

