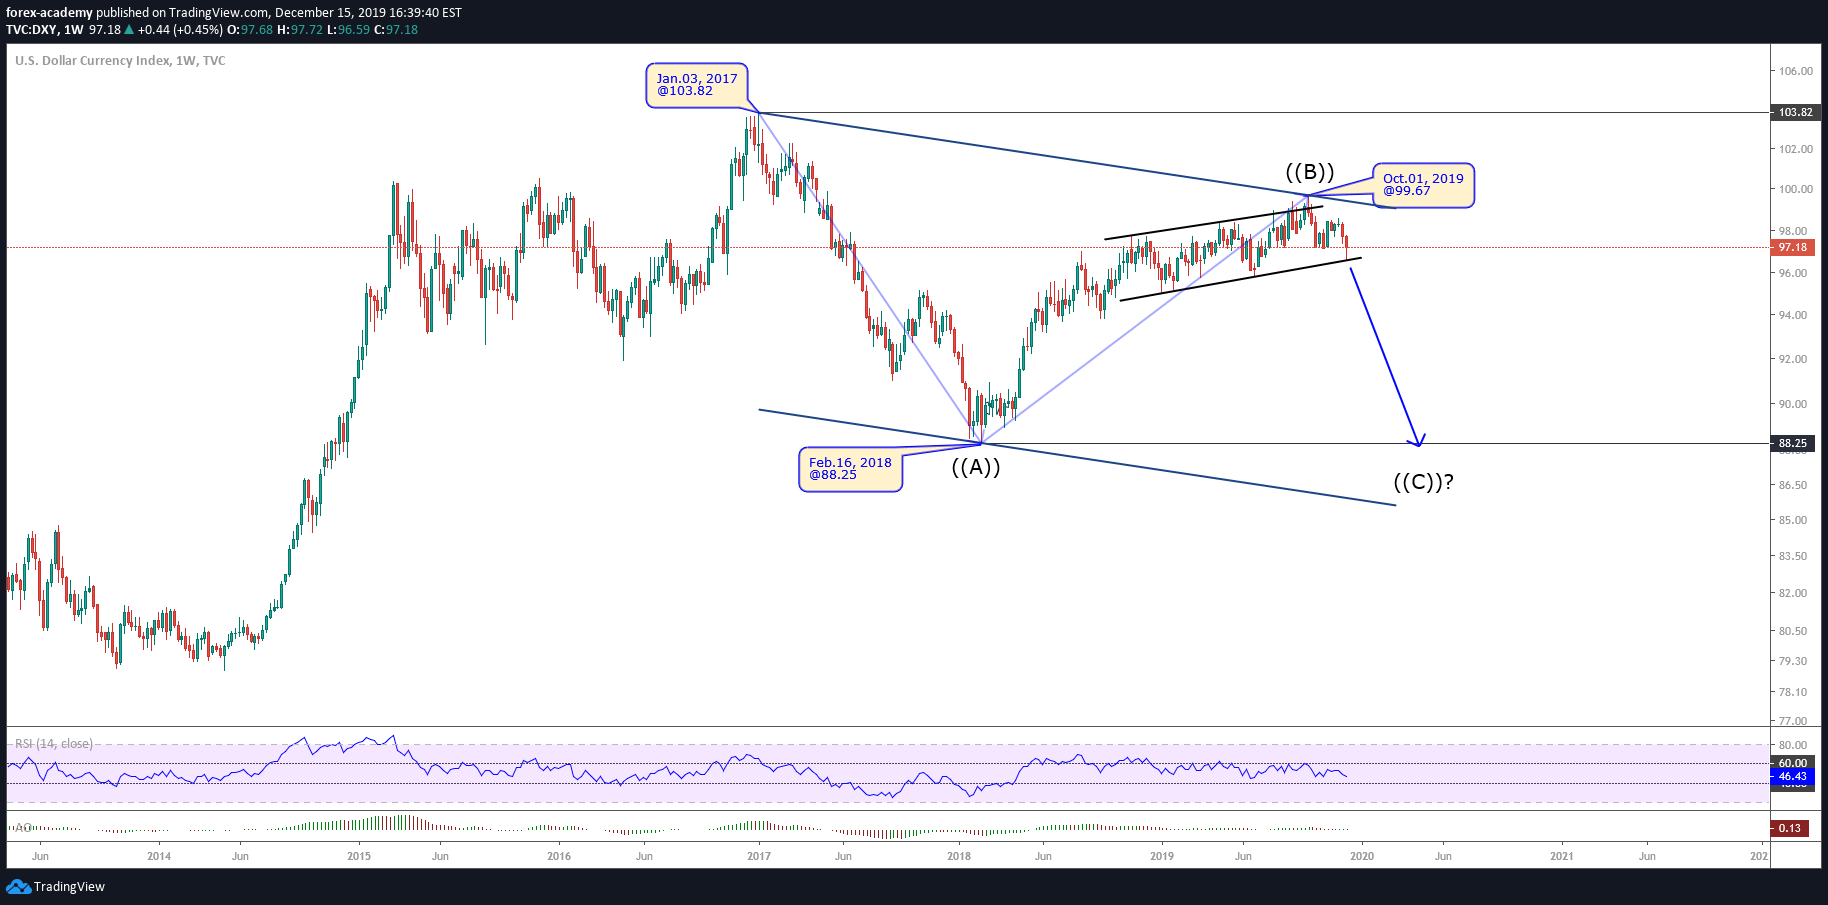
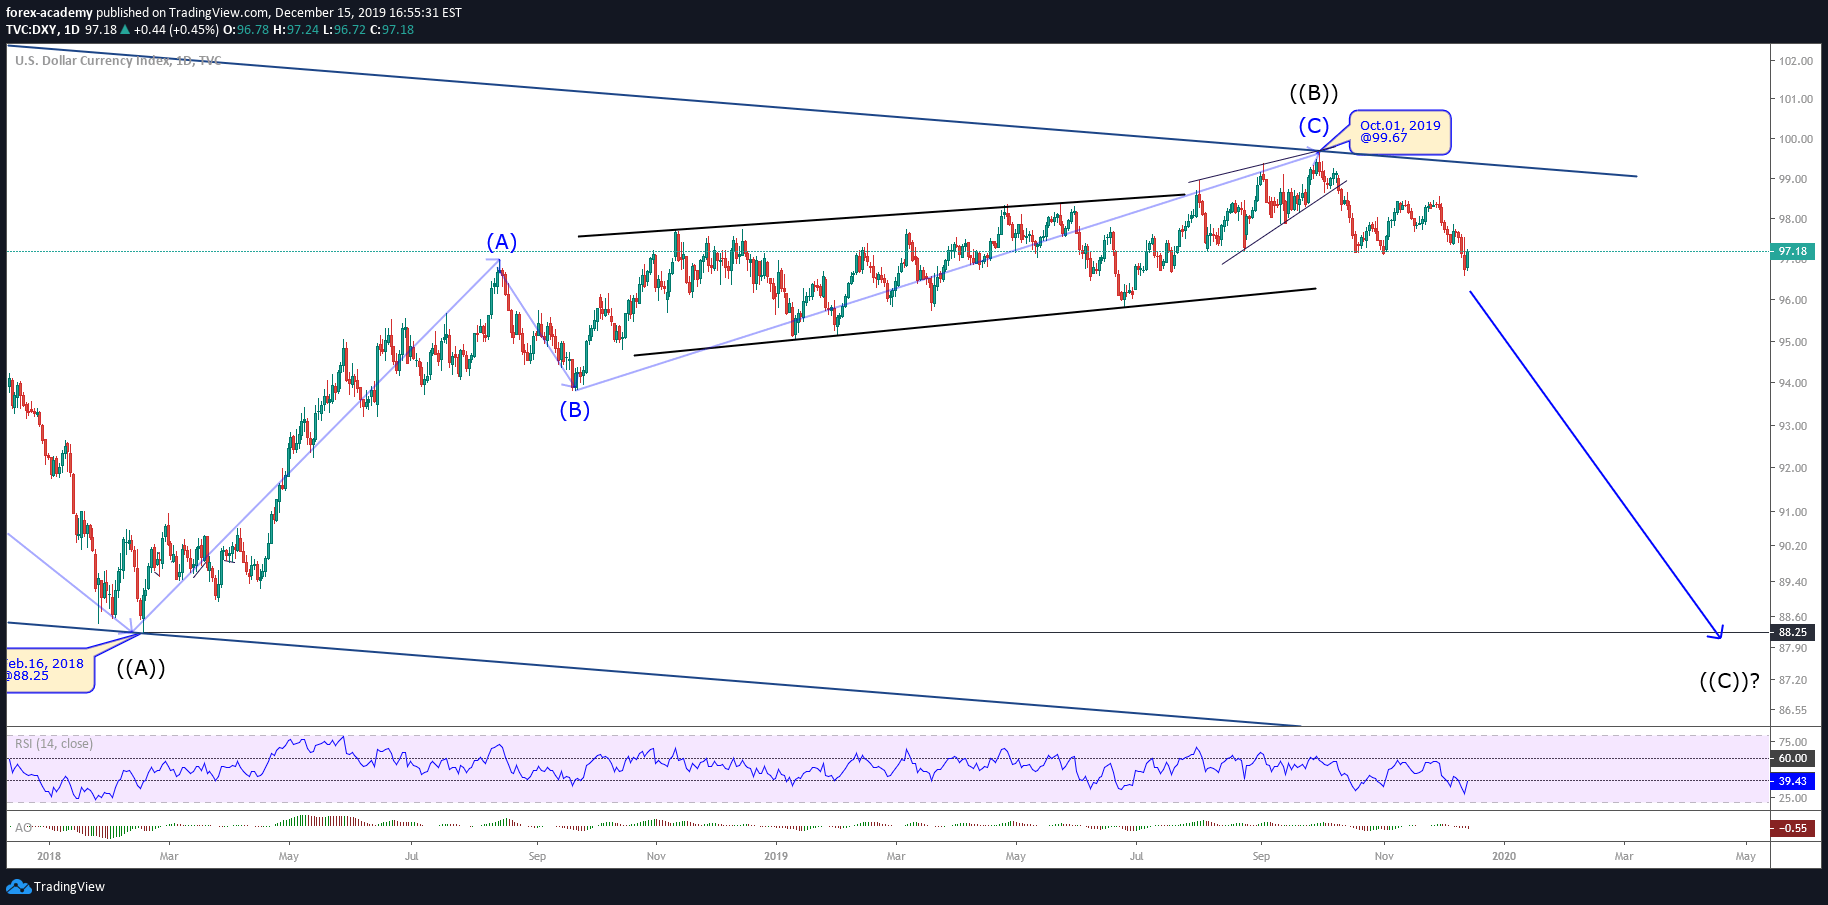
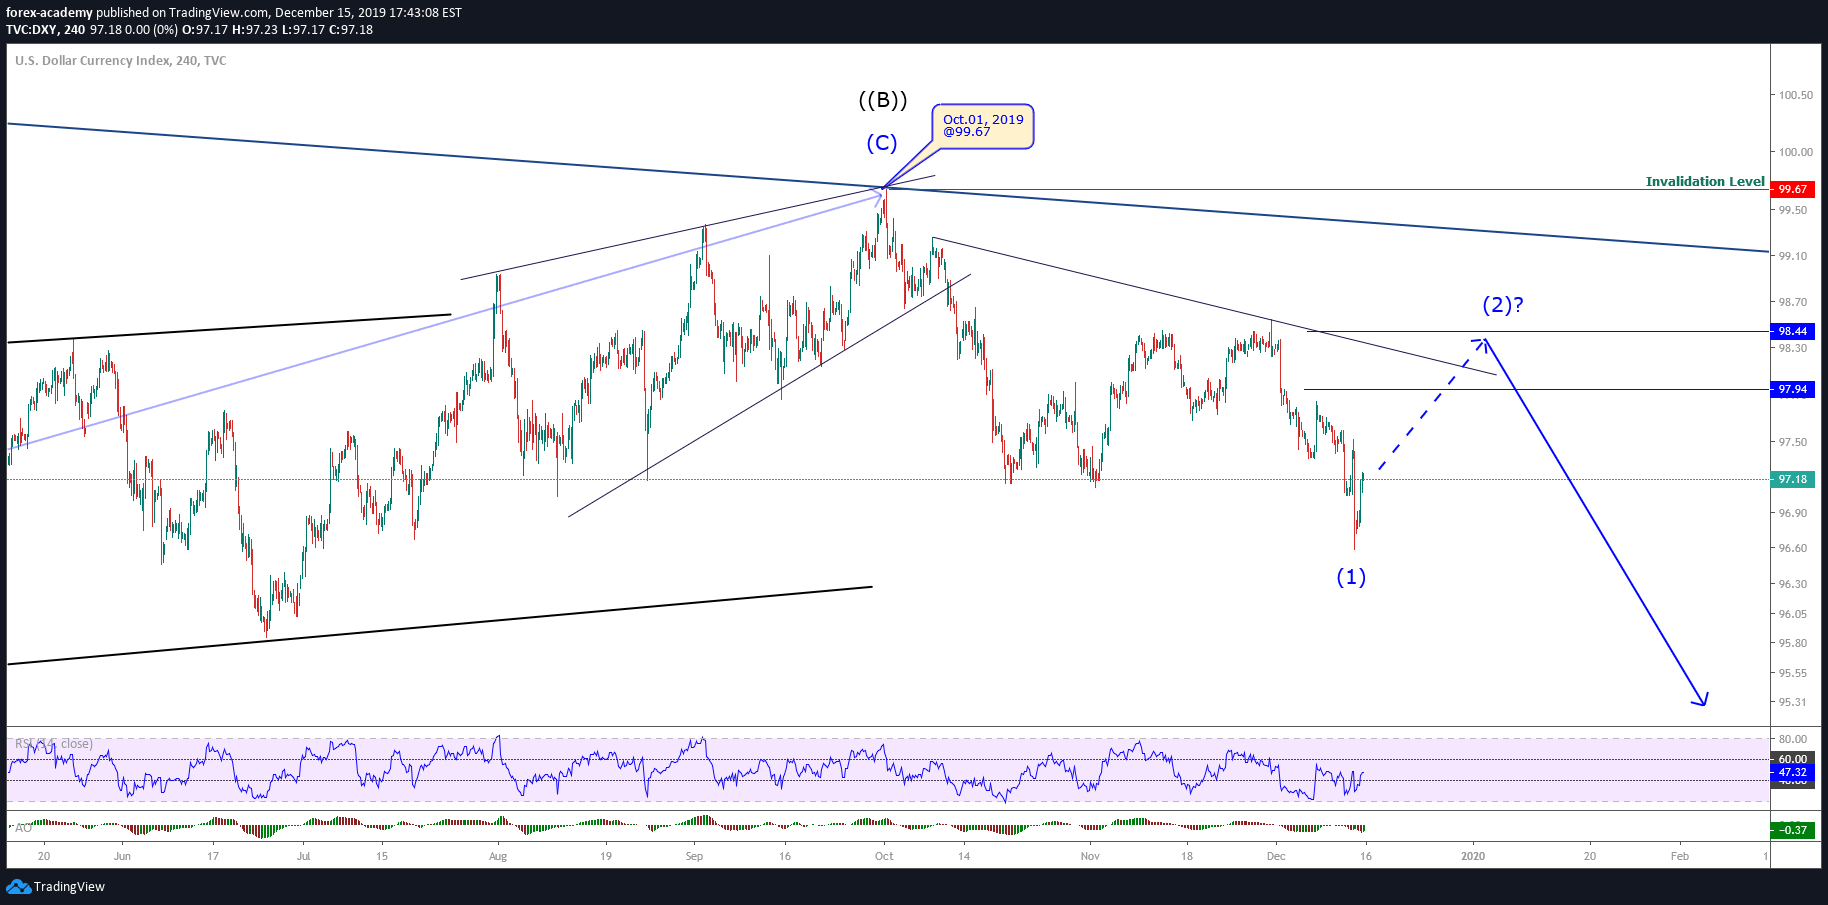
On the forex front, the U.S. Dollar Index rose 0.3% to 97.68. The euro slipped 0.4% to $1.1079. The German GfK Consumer Confidence Index slipped to 9.6 for January (9.8 expected) from 9.7 in December.
The British pound was little changed at $1.3004. U.K. House of Commons voted 358 to 234 in support of Prime Minister Boris Johnson’s Brexit deal.
Regarding U.S. economic data, third-quarter GDP growth was confirmed at an annualized rate of 2.1% on the quarter (as expected). Meanwhile, personal income rose 0.5% on month in November (+0.3% expected) and personal spending grew 0.4% (as expected). Later today, economists expect durable goods orders to rise 1.5% on month in November, while new home sales are anticipated to fall to 730,000 units.
Economic Events to Watch Today
Let’s took at these fundamentals.
EUR/USD – Daily Analysis
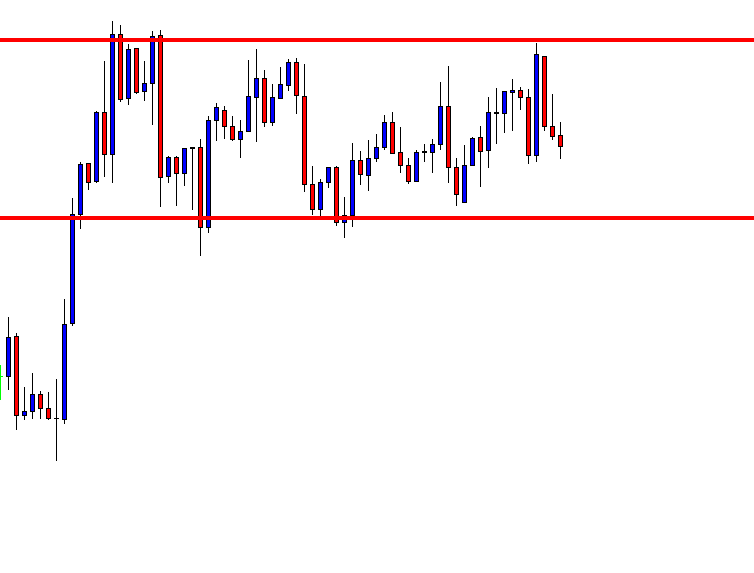
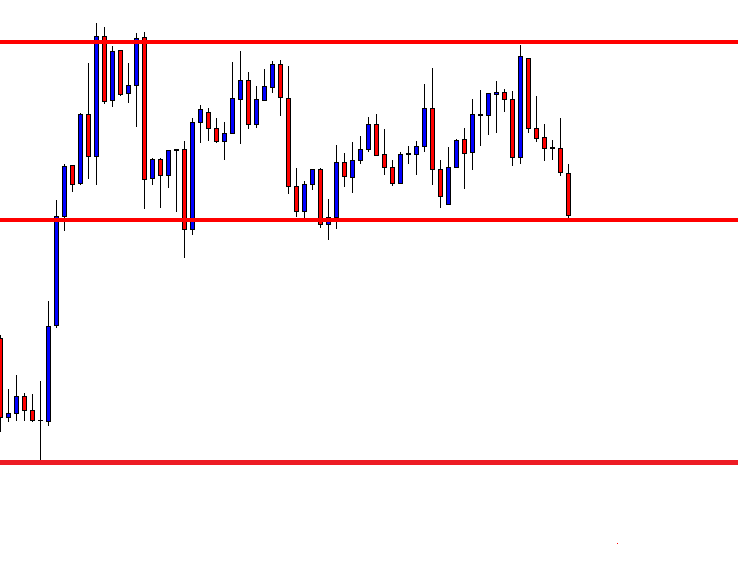
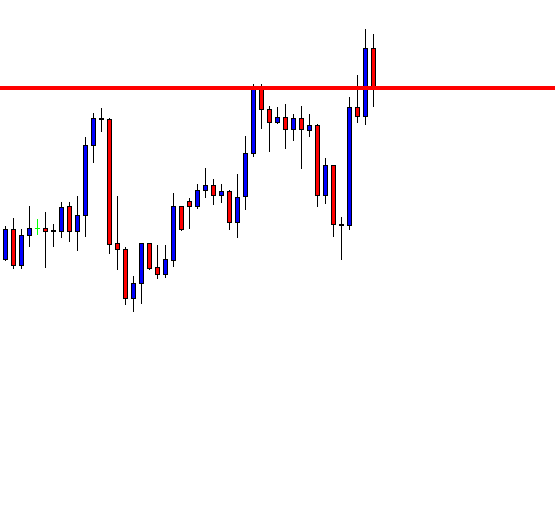
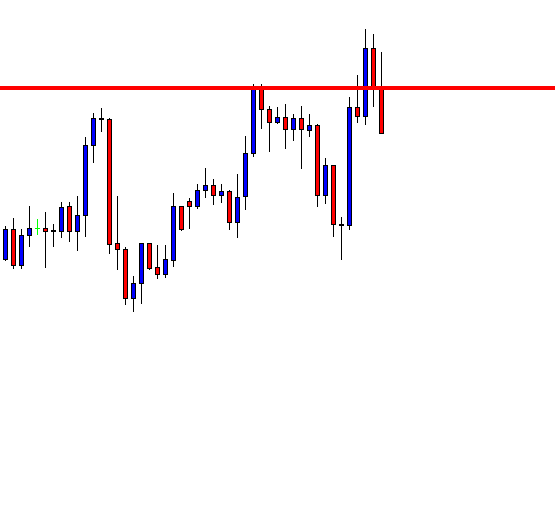
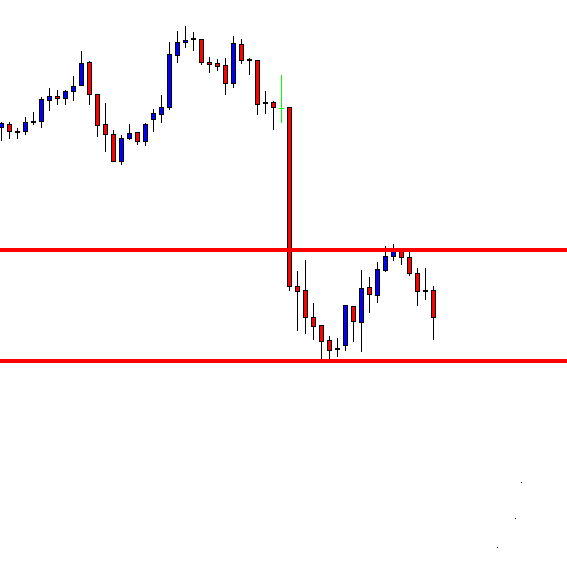
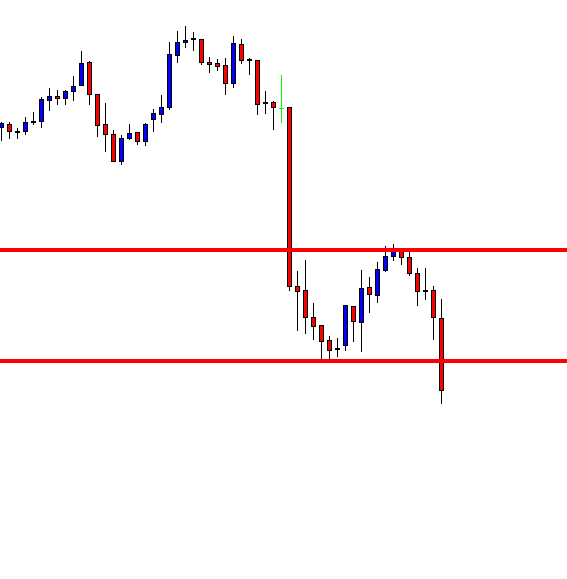
The EUR/USD currency pair flashing red and dropped to 1.1080 and failed to extend Friday’s declines from 100- Day Moving Average. As of writing, the EUR/USD currency pair is currently trading at 1.1078 and consolidates in the range between the 1.1073 – 1.1083.
At the yearly front, the EUR/USD currency pair has lost a significant part of the gains during the January 2017 – February 2018 period and trading bearish while ending 2019. As of now, the pair is trading near the 1.1082, representing a 3.17% decline on a year-to-date basis. Notably, the pair dropped by 14.14% during 2018.
The greenback strength held ground against the EUR currency over intensifying trade tensions, which pushed Germany to the recession. Besides this, the European Central Bank further delivered the rate cut into the negative territory during September and declared a fresh bond-buying program.
The market is expecting that the EUR/USD currency pair may pick up the strong bullish buying in 2020. Whereas, the continued gains could remain difficult if the Eurozone economic data do not show any substantial progress.
Daily Support and Resistance
- S3 1.0974
- S2 1.1031
- S1 1.1053
Pivot Point 1.1089
- R1 1.1111
- R2 1.1146
- R3 1.1203
EUR/USD– Trading Tips
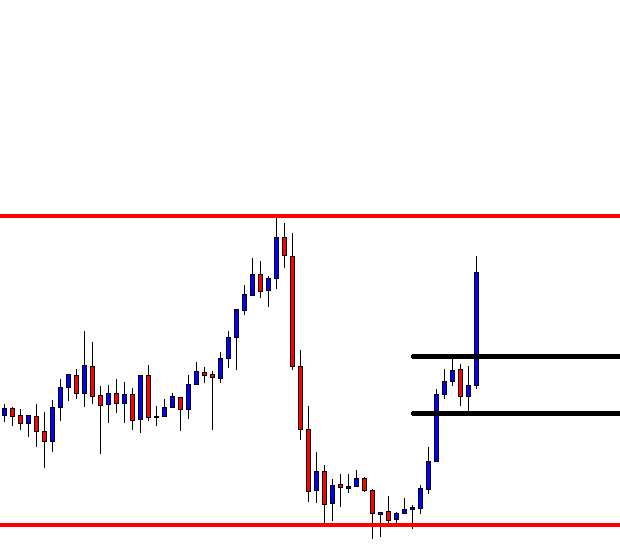
The EUR/USD is trading with the slightly bearish sentiment, and it’s very likely to test the next support area around 1.1110 on the 4-hour chart. The bearish breakout of this level can trigger further selling until 1.1085. Conversely, the bullish bias can lead the EUR/USD to 1.1125 and 1.1160 resistance levels. Let’s wait for the sell trade below 1.1110 today.
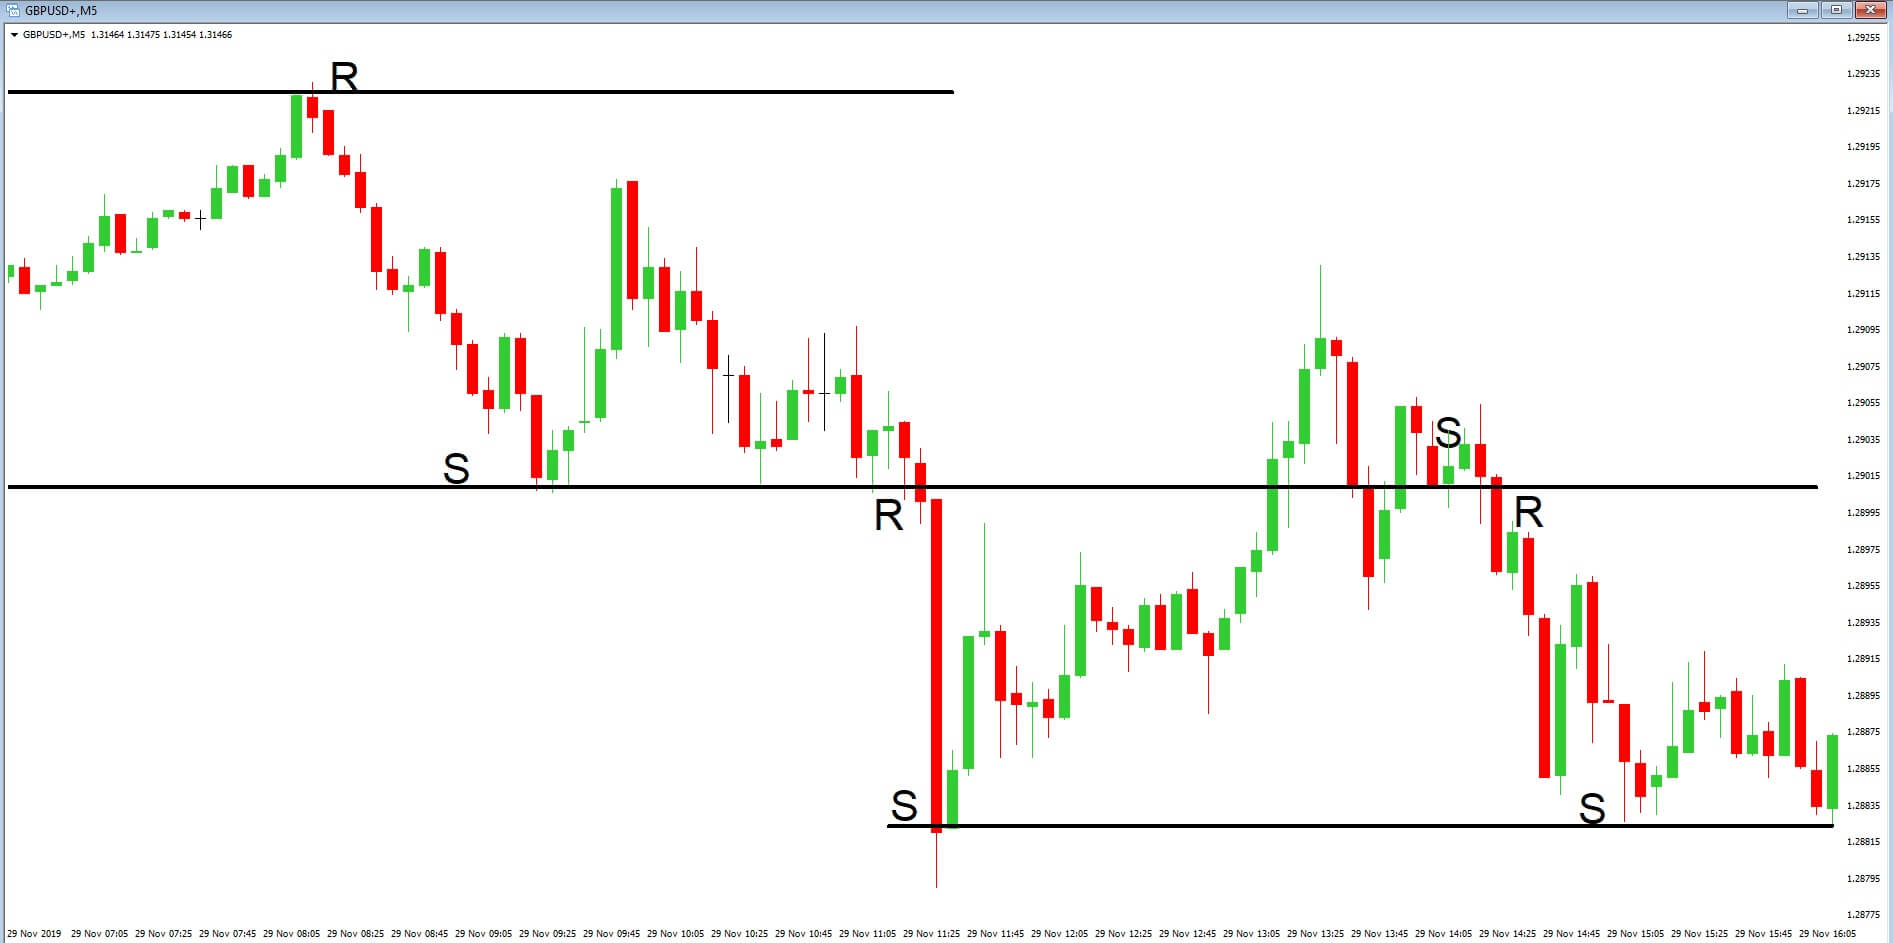
GBP/USD– Daily Analysis
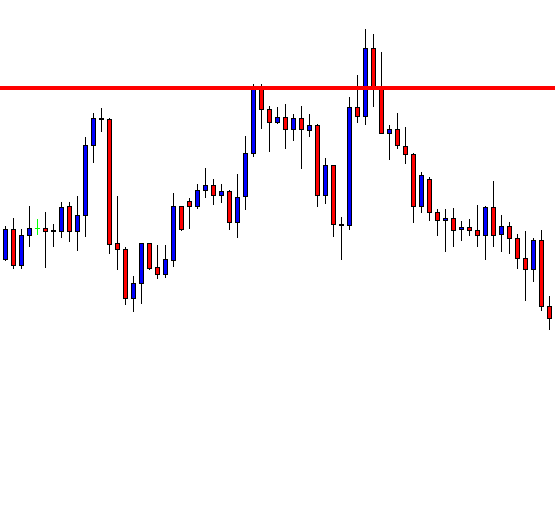
The GBP/USD currency pair failed to extend its bearish weekly streak despite the United Kingdom’s political uncertainty. As of writing, the GBP/USD currency pair is currently trading at 1.3013 and consolidates in the bearish range between the 1.2990 – 1.3017. Moreover, the cables traders seem to avoid declining political optimism in the United Kingdom.
The British pound was little changed at $1.3004. U.K. House of Commons voted 358 to 234 for Prime Minister Boris Johnson’s Brexit deal.
The United Kingdom Prime Minister Boris Johnson succeeded in getting his European Union Withdrawal agreement bill passed from the new Parliament. Whereas, the House of Common has not passed the bill so far, but will have lesser stops considering the Tories majority.
The U.S. Commerce Department will release November durable goods orders (+1.5% on month expected) and new home sales (730,000 units expected). The Federal Reserve Bank of Chicago will post November National Activity Index (-0.31 expected).
Daily Support and Resistance
- S3 1.2757
- S2 1.2901
- S1 1.2955
Pivot Point 1.3044
- R1 1.3099
- R2 1.3188
- R3 1.3331
GBP/USD– Trading Tip
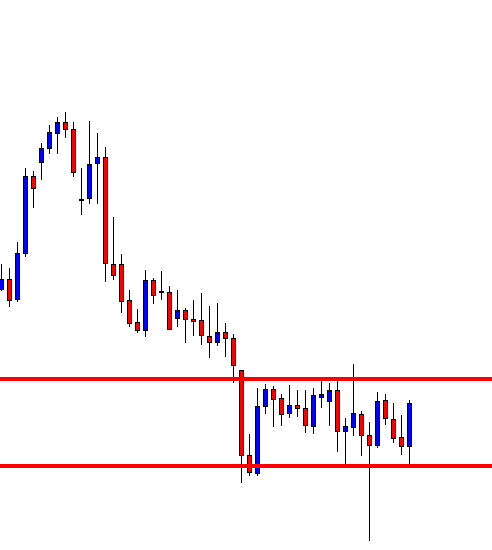
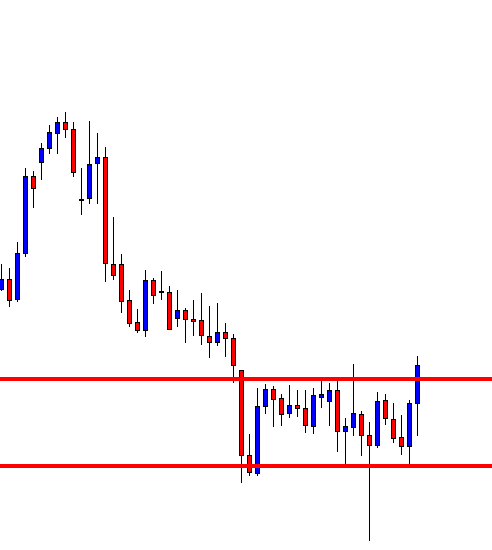
The GBP/USD has broken the support mark of 1.3060, and currently, this level is expected to serve as a resistance for the GBP/USD. On the downside, the GBP/USD can exhibit further selling until the next target level of 1.2940.
The RSI and MACD have now crossed over 50 and 0 zone, suggesting odds of a bullish reversal in the GBP/USD pair. Consider staying bullish above 1.2995 and bearish below 1.3100 today.
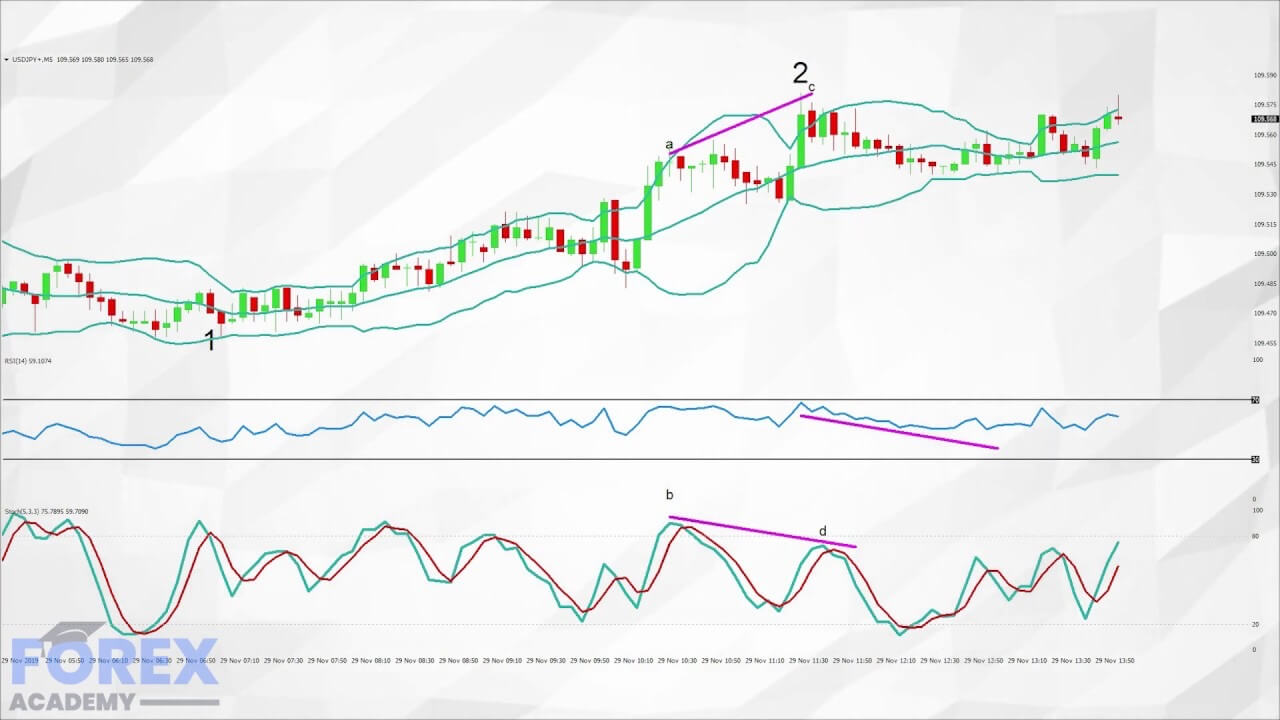
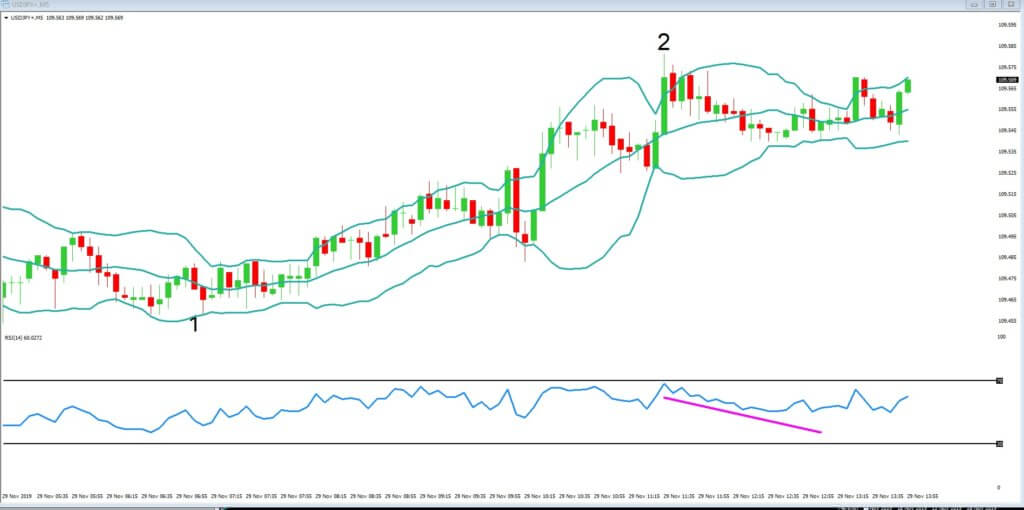
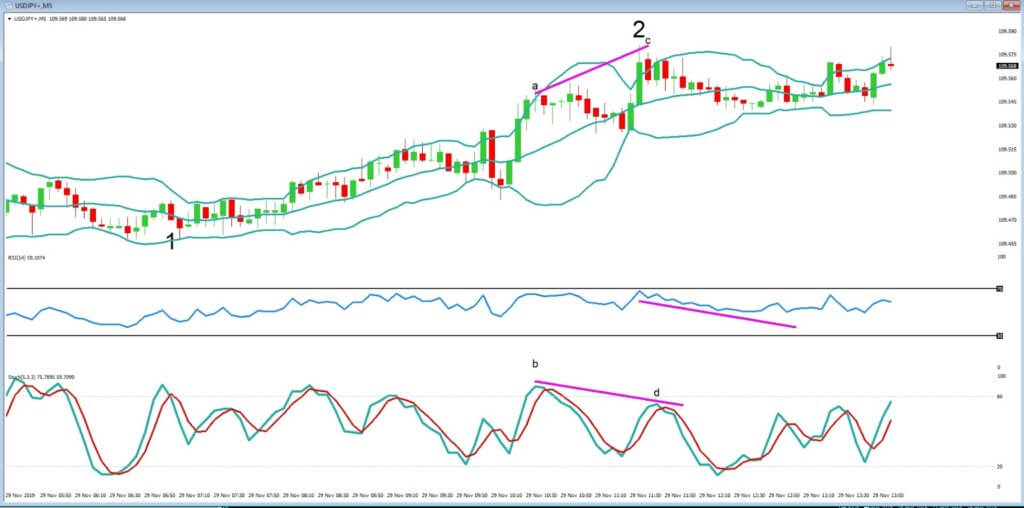
USD/JPY – Daily Analysis
The USD/JPY was broadly flat at 109.44. The USD/JPY currency pair flashing green and picked up the bids to 109.50, mainly due to the United States President Donald Trump Weeknd’s positive comments. The pair also got support from the United States upbeat data, which turned the market risk-on.
On the Weekend holidays, the United States President Donald Trump said: “We have just achieved progress on the trade deal, and we will be signing it very soon. The same motivates the risk-takers to start the holiday-shortened week on a positive side.
It is worth to mention that the Fridays strong United States GDP hit down the talks of the slowdown. Moreover, the reason behind the greenback strength was the upbeat data from the U.S., including Personal Consumption Expenditure and the Michigan Consumer Sentiment Index.
Looking forward, the market traders will take note of the November month U.S. Durable Goods Orders, up for publishing on Monday, to verify the fresh, positive data from the U.S. The report of Durable Goods Orders is anticipated to increase by 1.9% from downwardly revised 0.5% previous.
Besides this, the November month Chicago Fed National Activity Index, as well as New Home Sales, will also entertain traders before spreading the holiday mood. Whereas the activity gauge is anticipated to recover to -0.09 against -0.71 earlier, the housing data could soften to 0.728M against 0.733M prior.
Daily Support and Resistance
- S3 108.56
- S2 108.97
- S1 109.17
Pivot Point 109.38
- R1 109.58
- R2 109.8
- R3 110.21
USD/JPY – Trading Tips
The USD/JPY has already completed the 38.2% Fibonacci retracement around 109.200 level. Now, this level is supporting the safe-haven pair along with an immediate resistance around 109.350.
The RSI and MACD are suggesting chances of further selling in the USD/JPY pair. The pair may trade bearish below 109.50 to target 109.200 and even below to 108.950 today.
All the best!

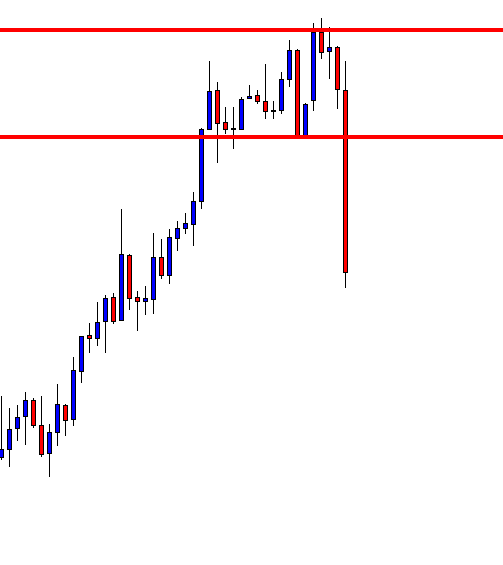
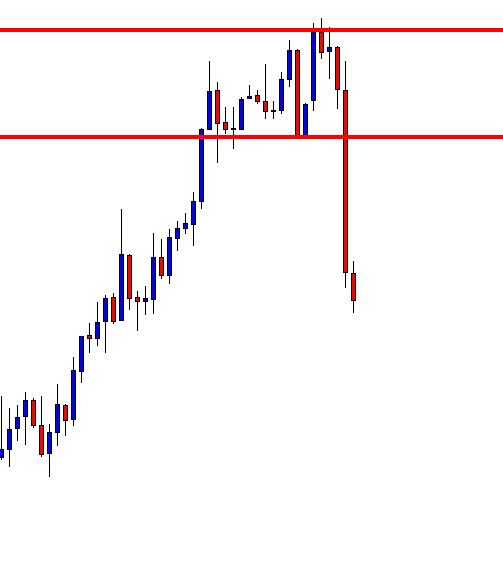
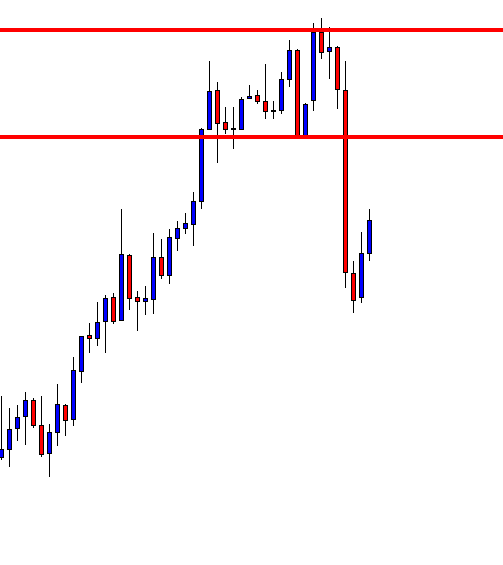
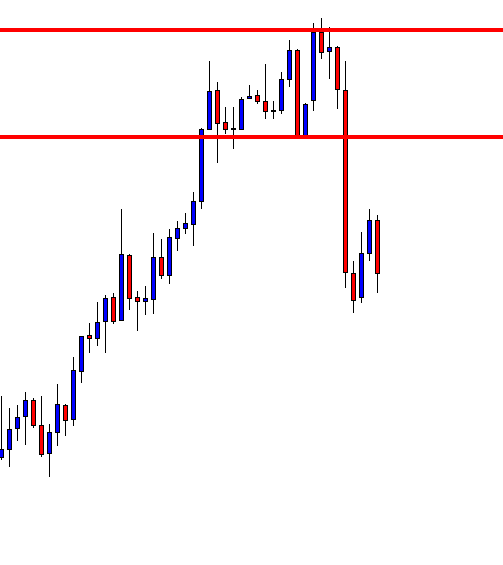


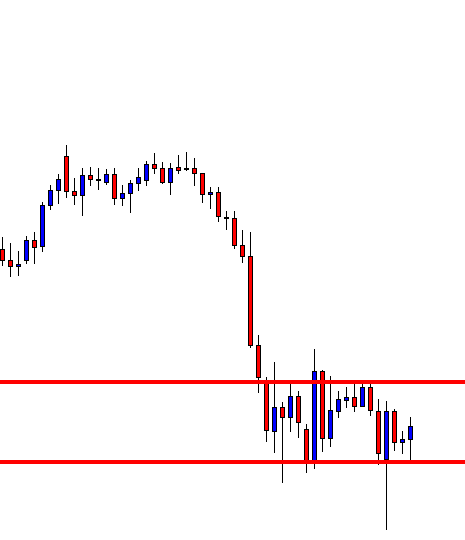


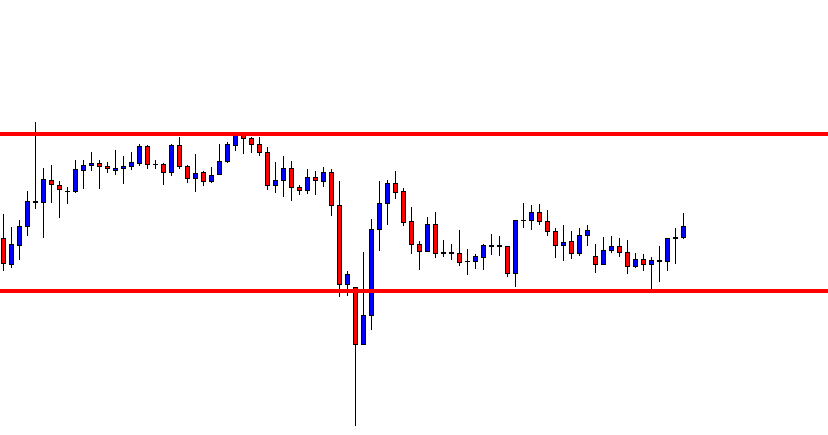
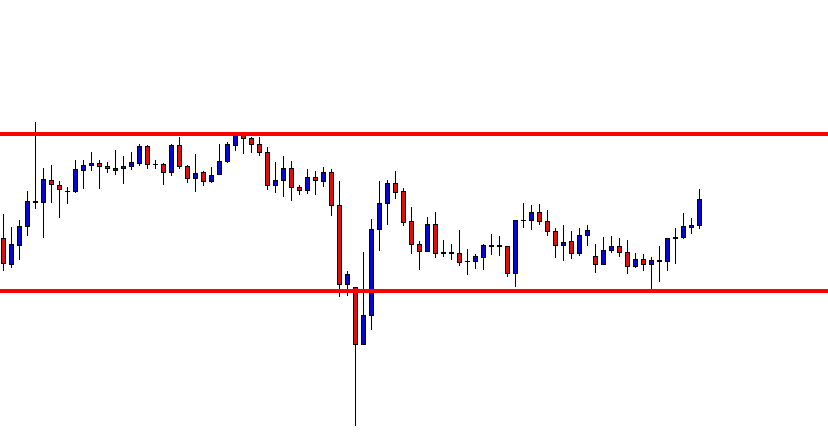
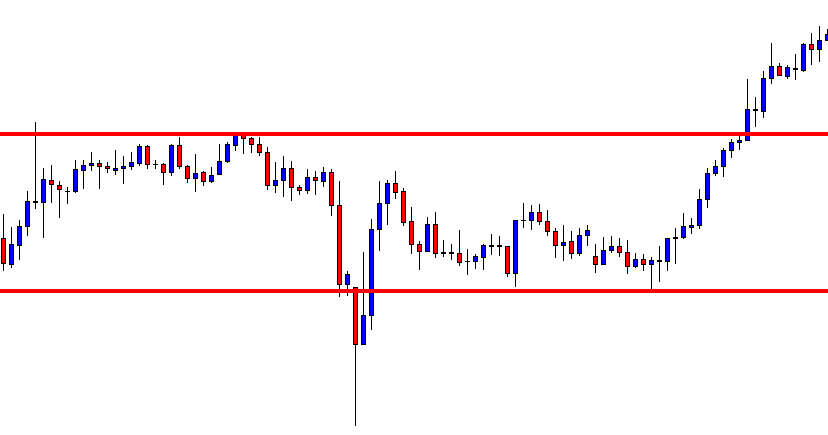


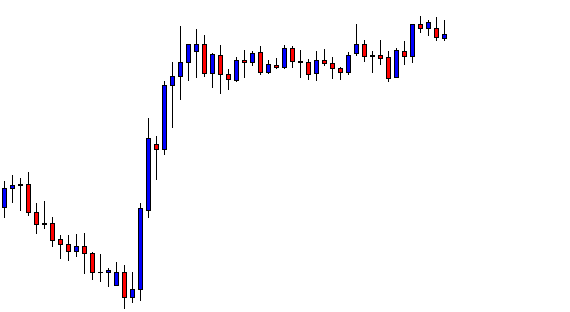
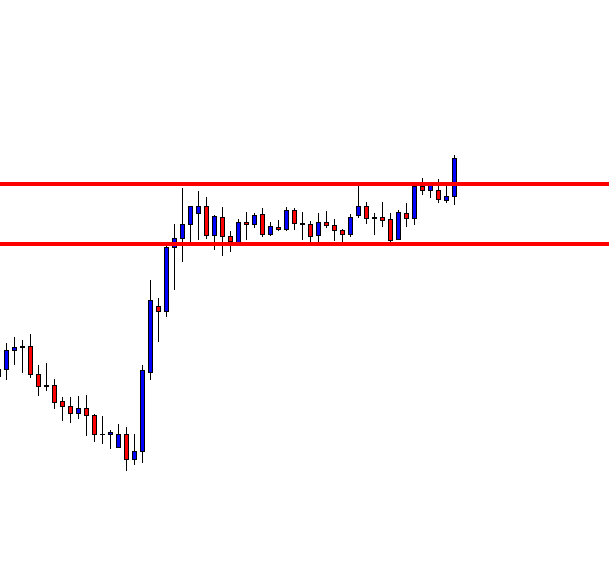

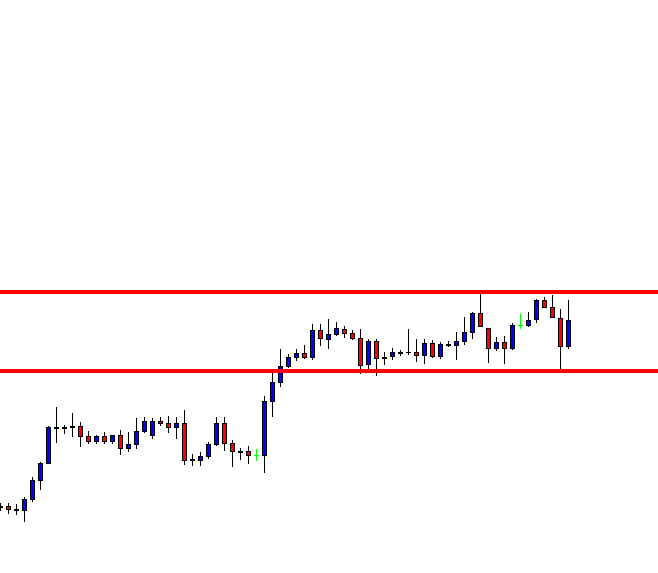
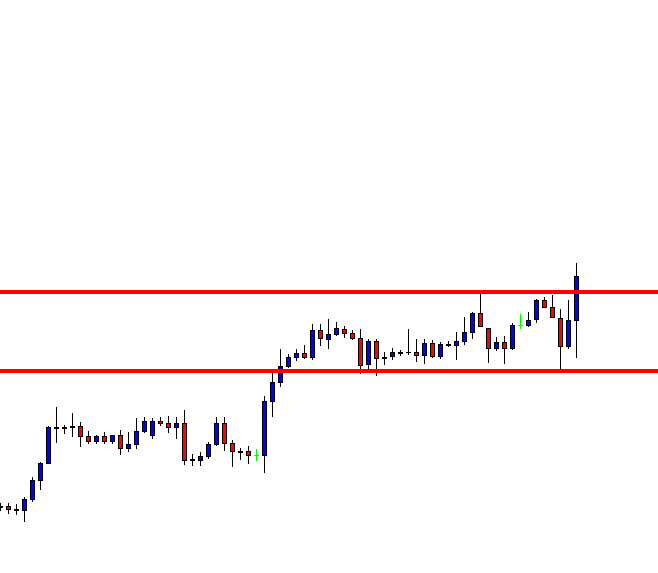
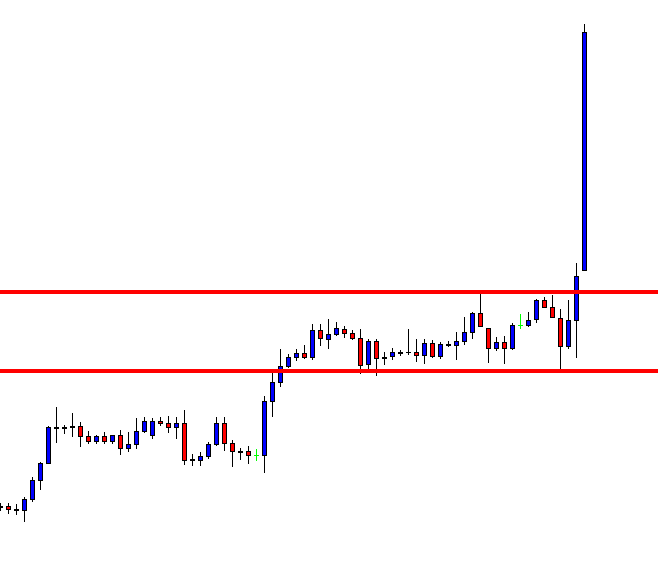
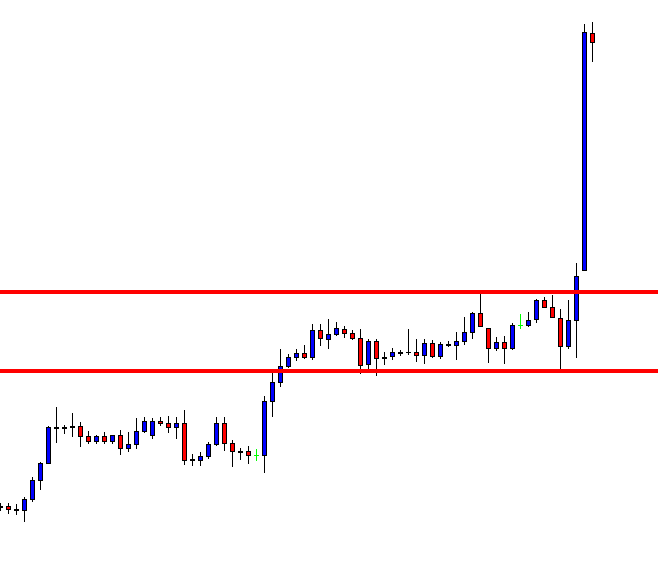


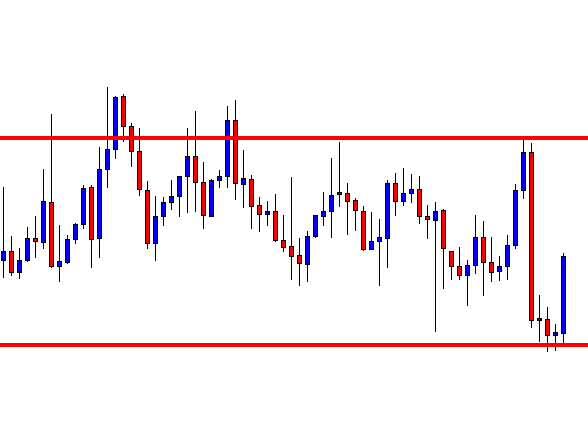
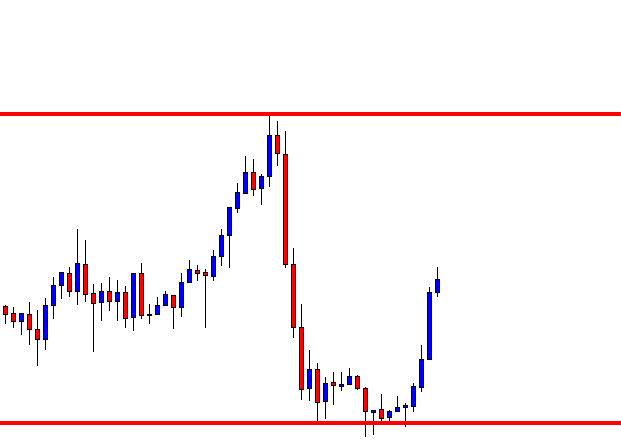
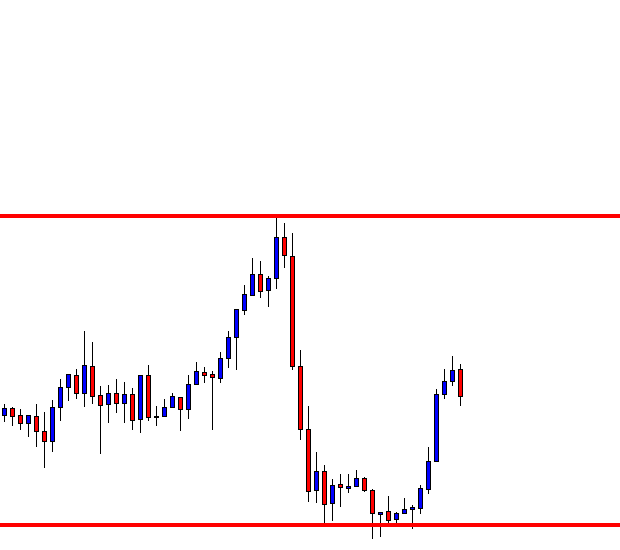
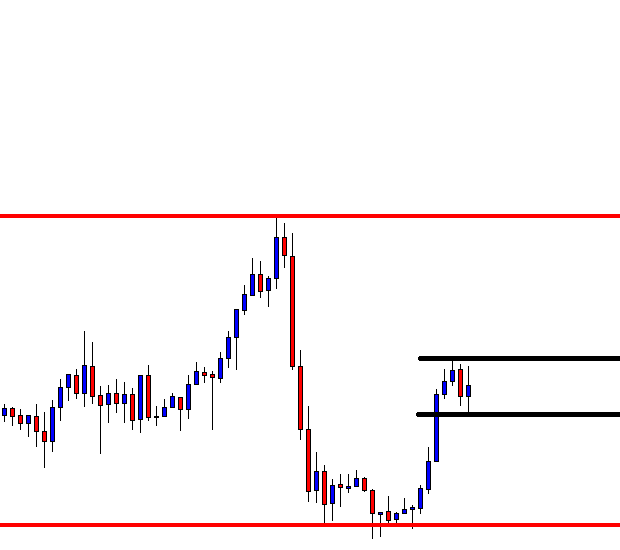


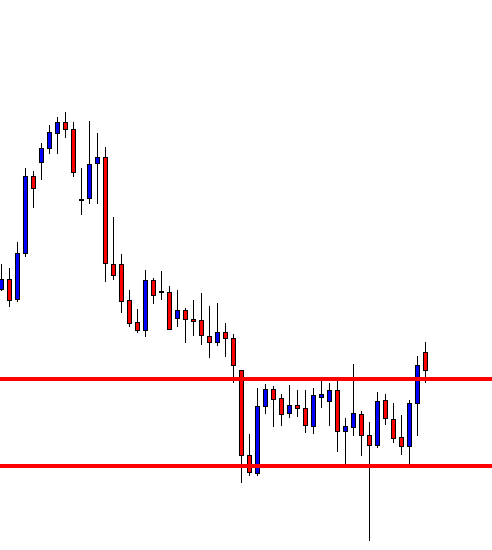

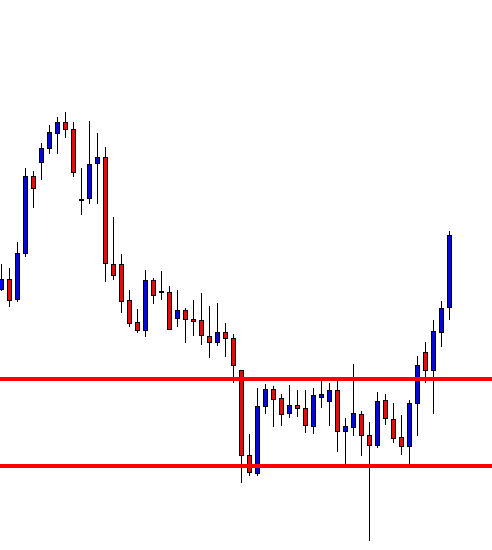

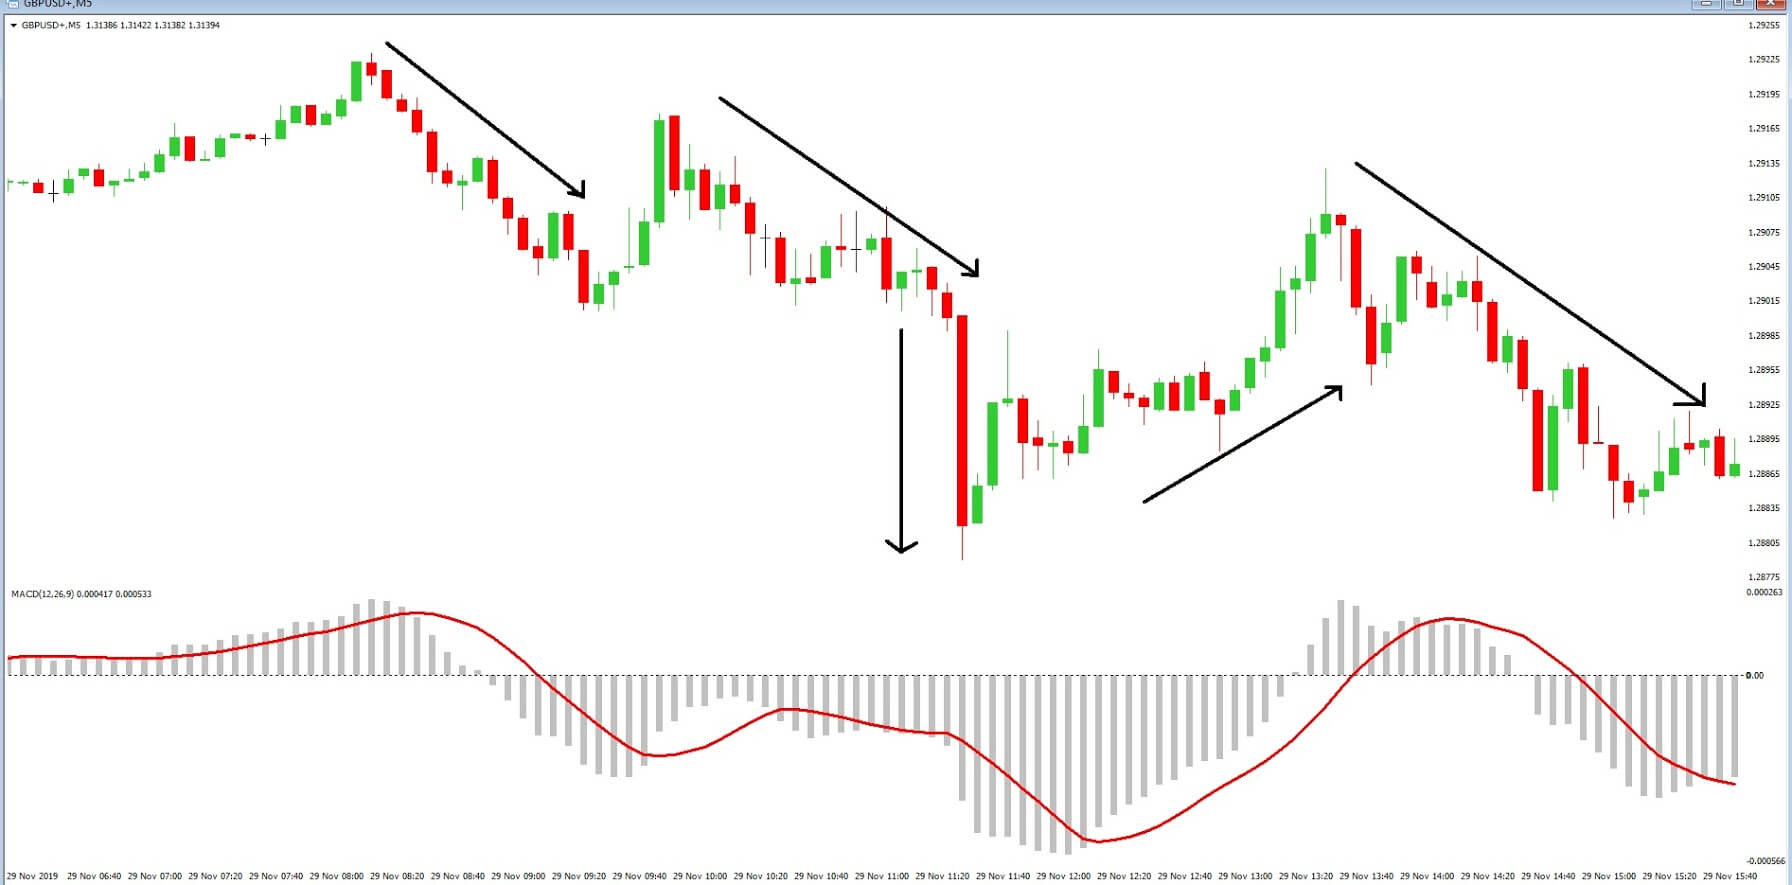
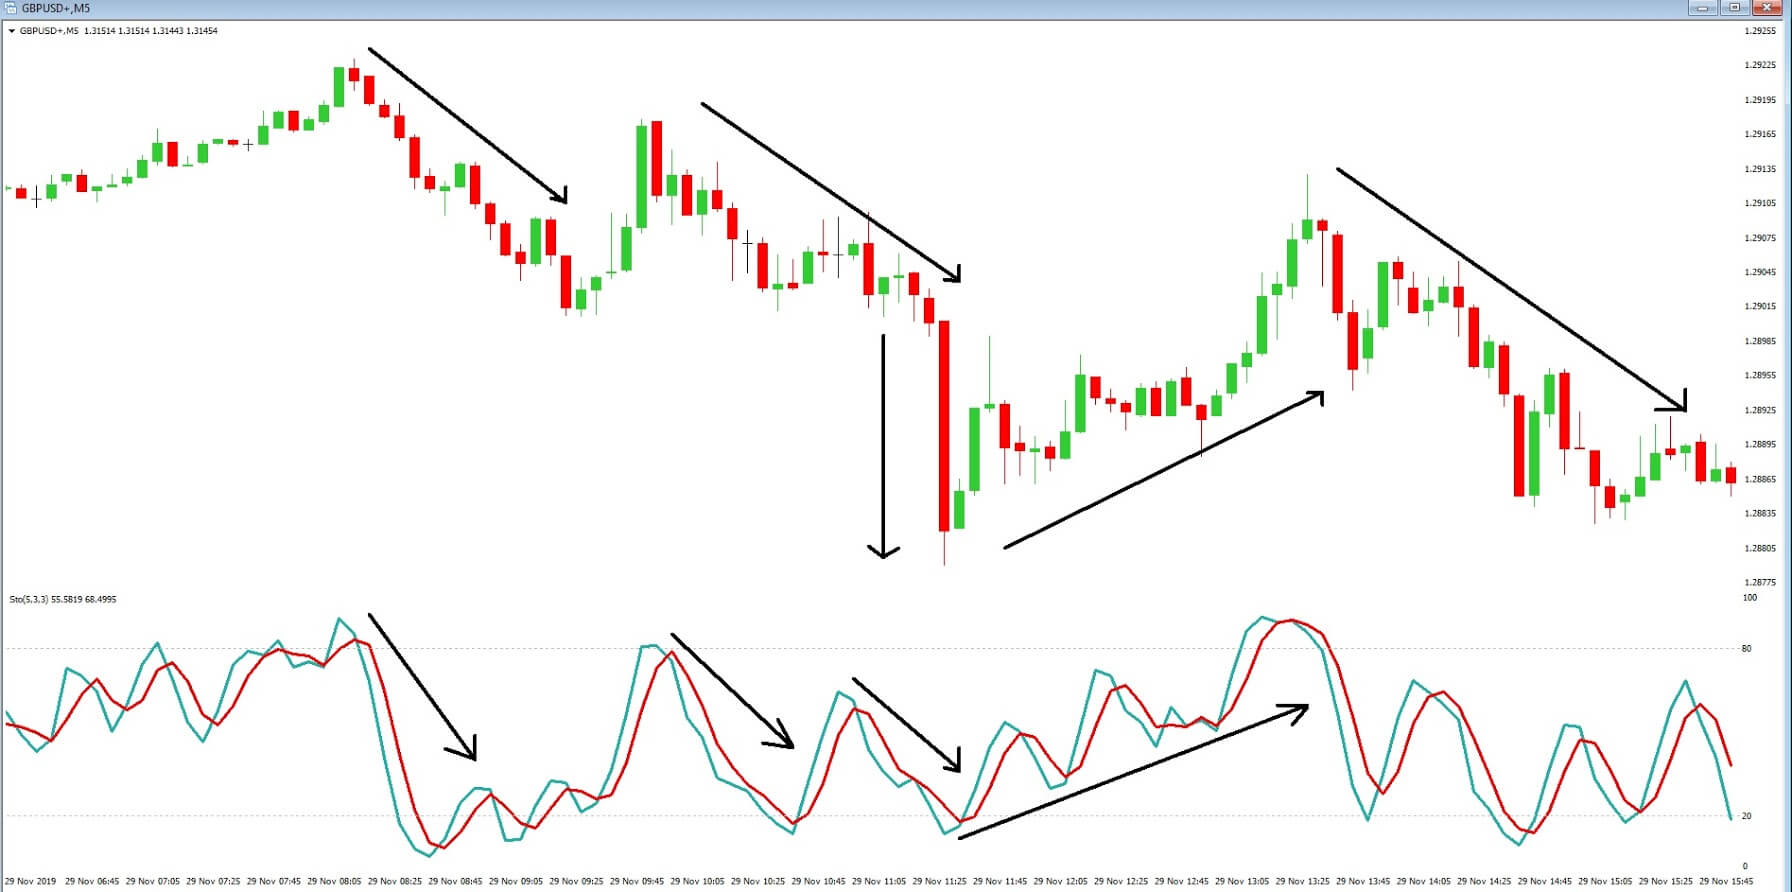
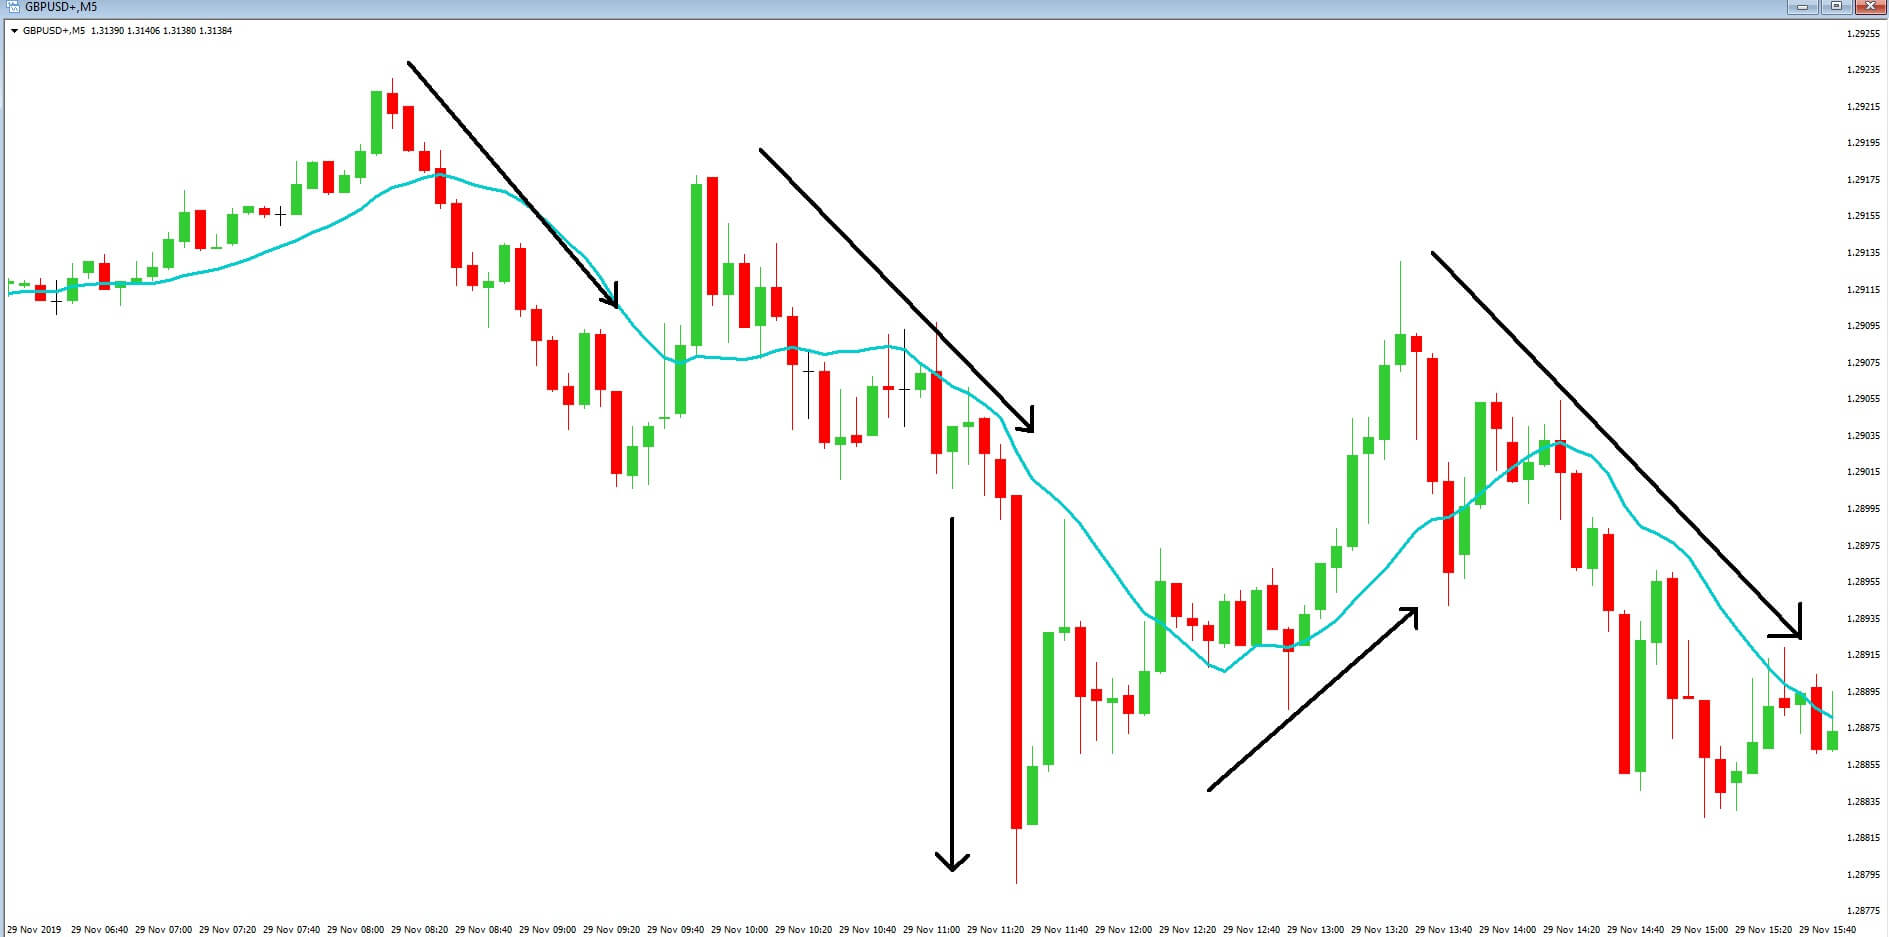
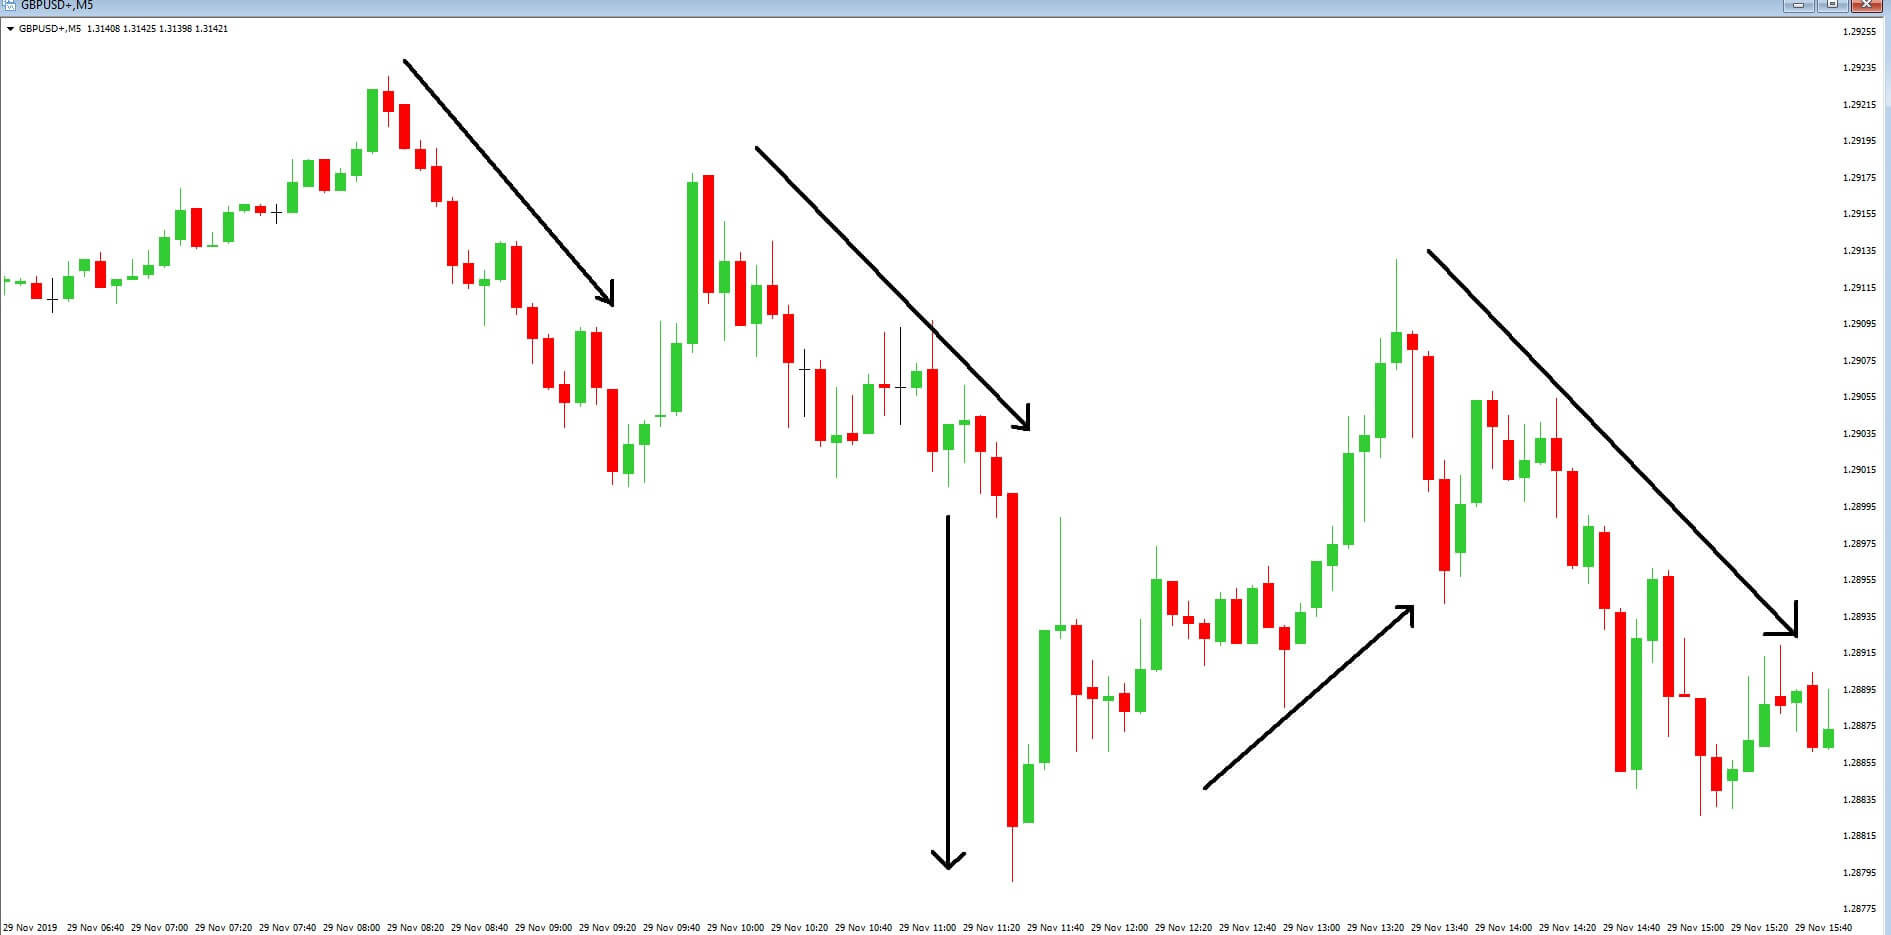


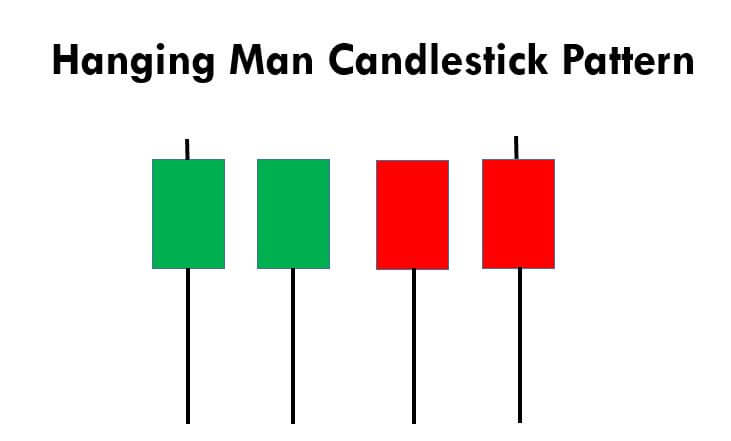
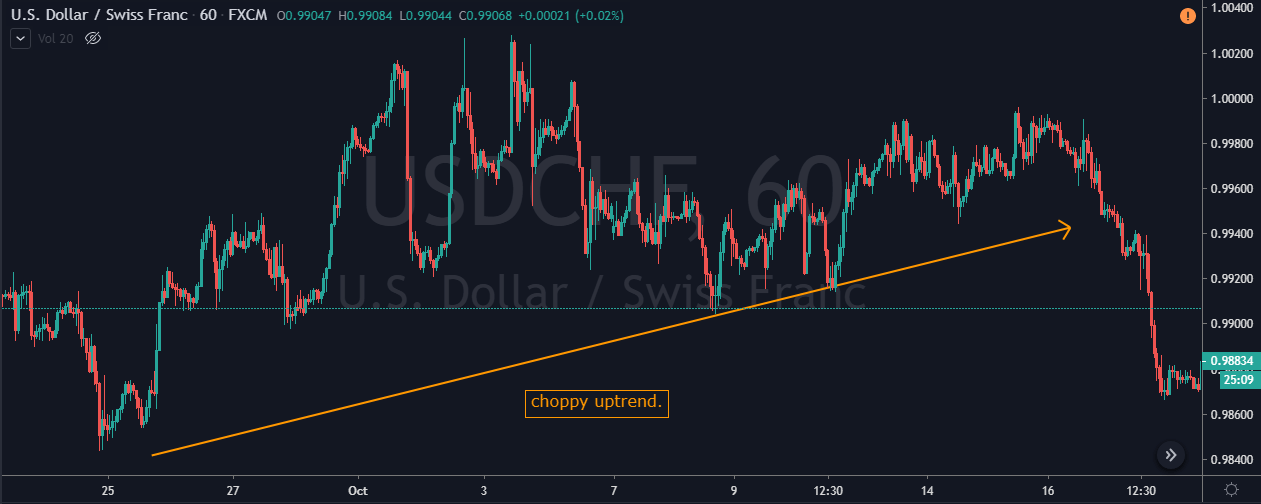
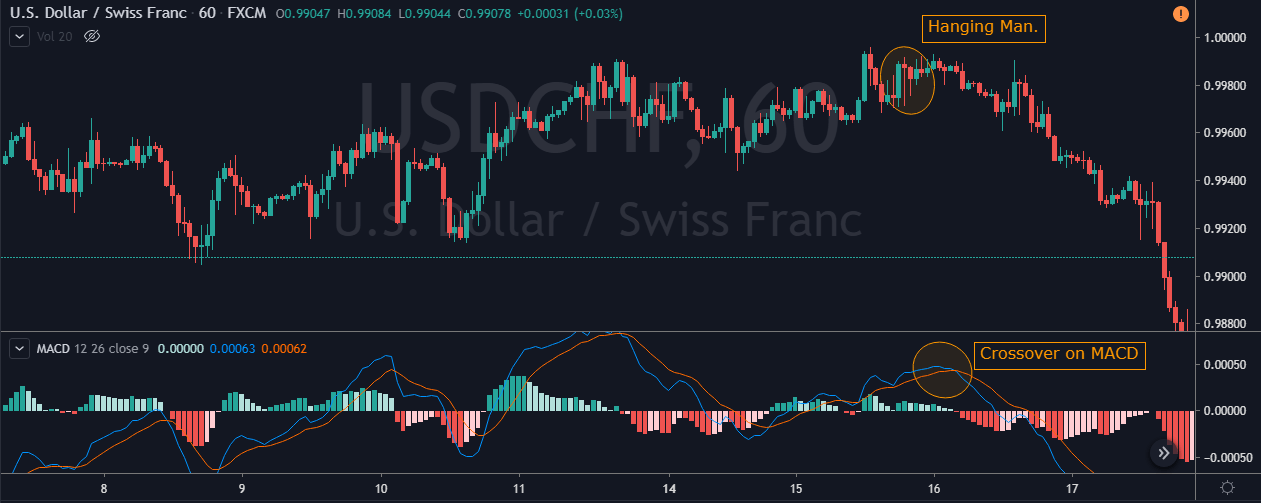
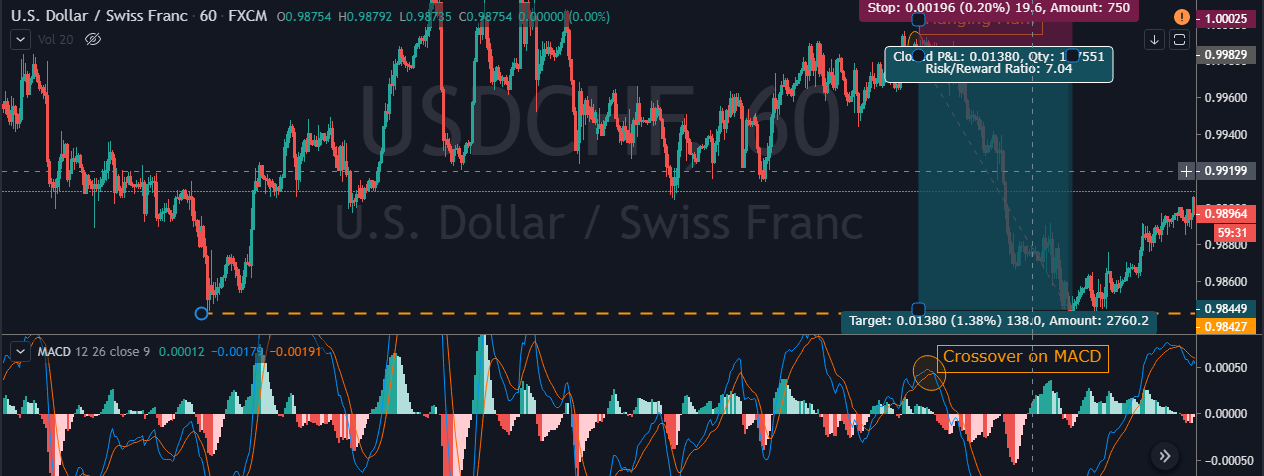
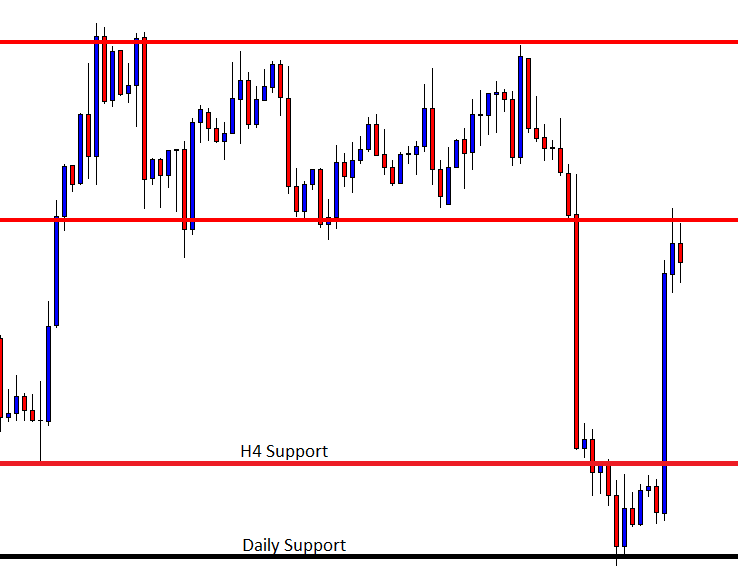
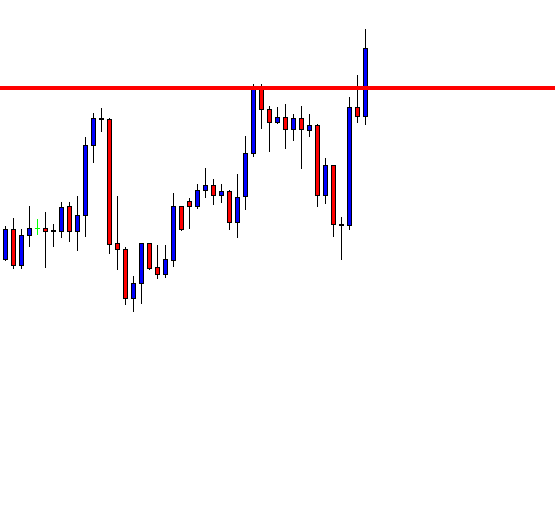
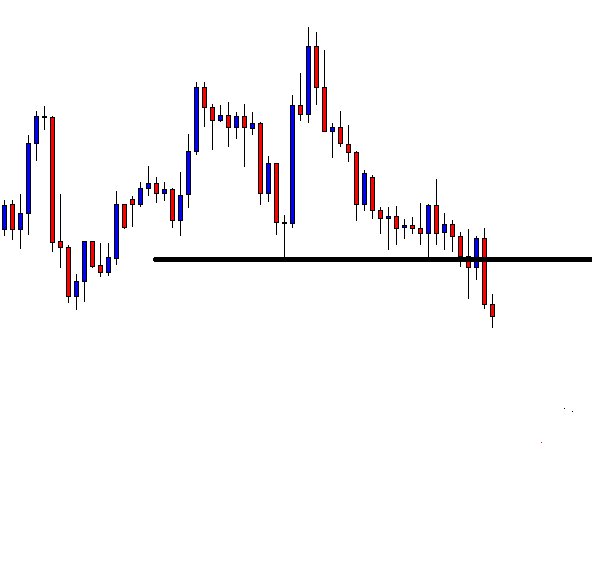
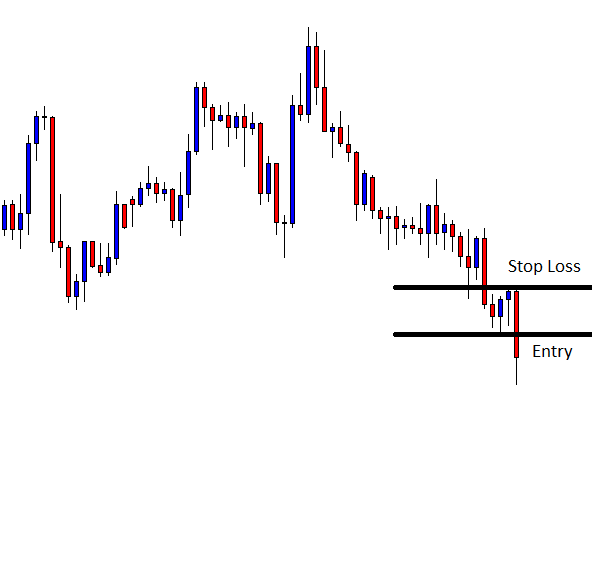
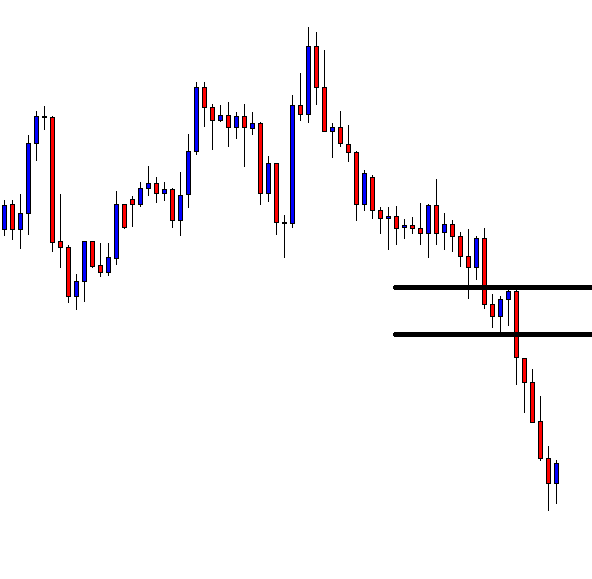
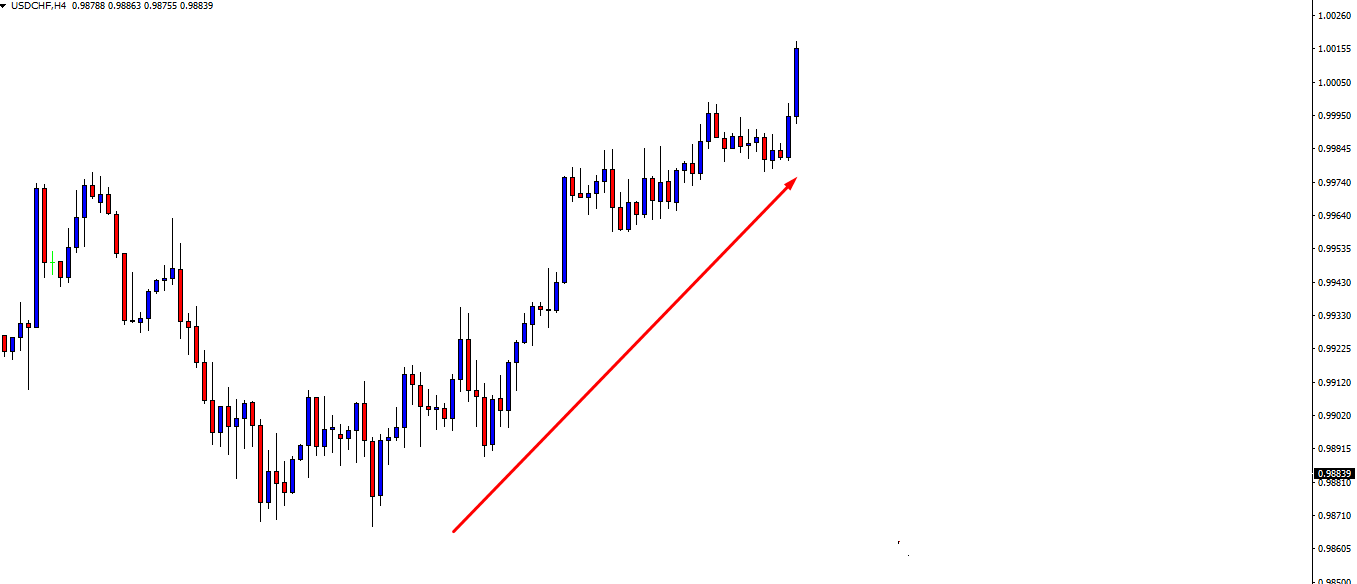
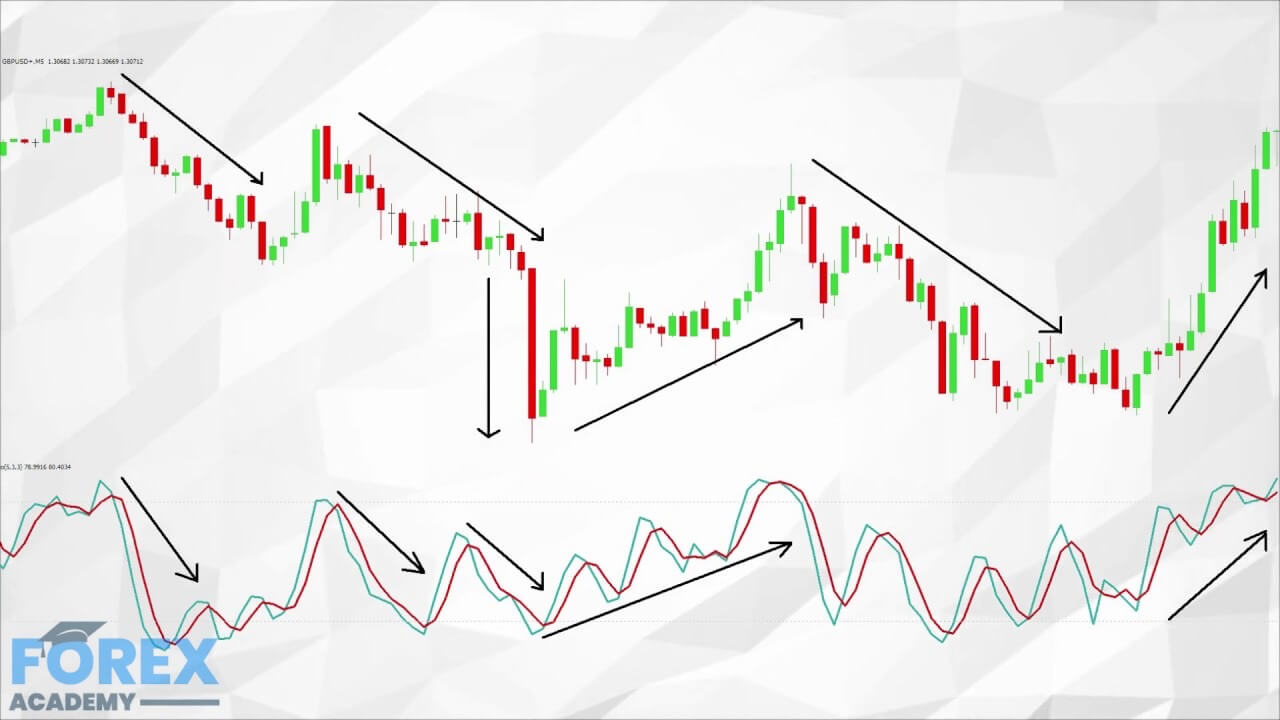
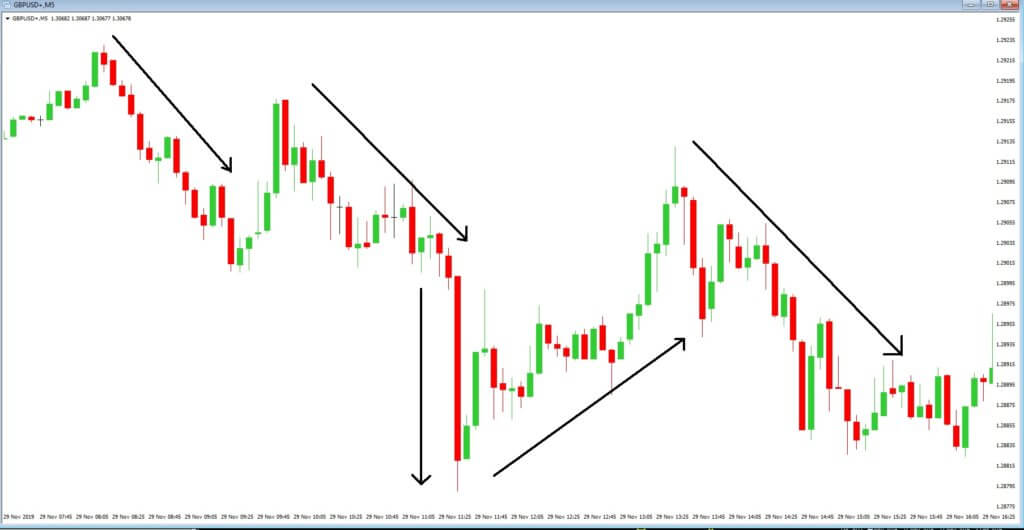
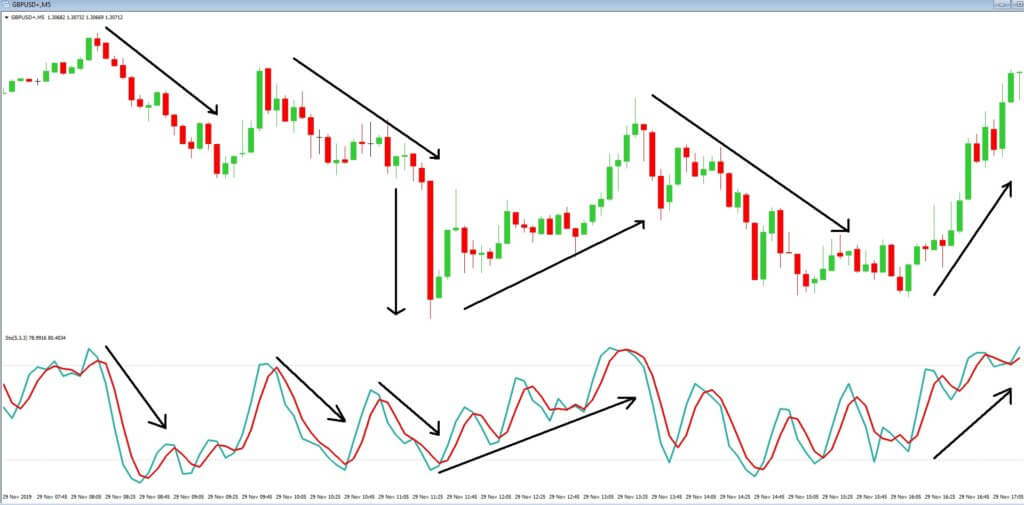
 This pattern is not confirmed unless the price falls shortly after the Hanging Man. If the next candle closes above the high of the Hanging Man, this pattern is not valid. After the pattern, if the very next candlestick falls, then it’s a clear indication of the reversal. Now, if you see a Hanging Man candlestick and the above-discussed rules apply, you can go ahead and take the trade. But since it is crucial to have an extra confirmation, let’s pair this pattern with a technical indicator.
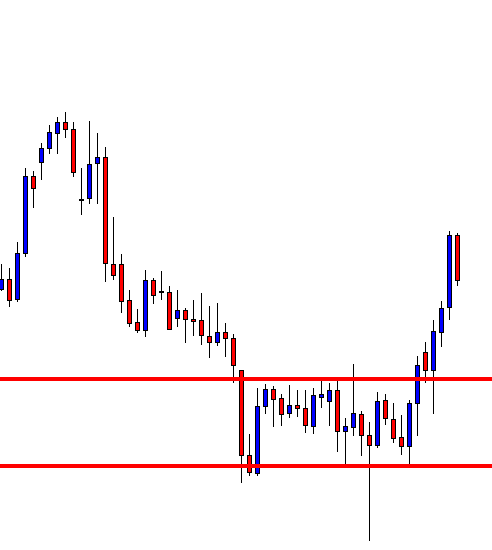