Of all the chart styles and trading styles I’ve used in my years of trading, Point & Figure is by far the least stressful and most profitable I’ve ever used. Point & Figure, for a trader, I believe, is the most stress-free form of charting available.
There is no need for economic reports or balance sheets. Point & Figure is concise, logical, and it eliminates guesswork and emotion. It is the most scientific and fact-based chart form. From an analysis perspective, I believe chart forms that include time, volume, and price are superior to Point & Figure (Japanese Candlesticks and American Bar Charts). From a trading perspective, Point & Figure is superior to all. I believe this because trading is an emotional career, and the more we can filter out the stimuli that cause emotional reactions, the better traders we become.
This section will review common patterns and strategies for Point & Figure charts. These are limited to 3-box reversal charts. I have debated whether to write about 1-box and 2-box reversal charts, but I have decided against it. The reason is that I do not use them, I stick with 3-box reversal charts only for Forex markets.
The following are chart patterns, as described in the books I’ve identified as sources at the end of these articles. Many of these patterns I’m going to show are from Dahlquist and Kirkpatrick’s phenomenal book, Technical Analysis – The Complete Resource for Financial Market Technicians (3rd Edition). If you want to get an understanding of how vital and powerful Point & Figure is, compare the size of the Point & Figure chapter against all the other sections in that book (consequently, that book is part of the required reading for the CMT certification.
I have ping-ponged the idea of skipping some of the patterns in Dahlquist’s and Kirkpatrick’s book because some of the patterns were determined to be ineffective in their cited research. The sources Kirkpatrick and Dahlquist’s reference showed pattern results in equity markets. Equity markets and Forex markets are not the same, so while some of the patterns described in Technical Analysis indicate they should be ignored, I am going to include them because they may work better in Forex markets. You will find this a constant throughout technical analysis literature: the positive expectancies of patterns, strategies, and theories have almost exclusively been tested in equity markets.
Trap Patterns
I am starting off our study with a pattern that you will frequently encounter. Trying to avoid them is near impossible, but because losses are extremely limited in Point & Figure, even successive traps generate minimal losses compared to gains. But I believe it is imperative to understand that traps do occur, they can be frequent, and you will have to get used to them. There are two types of traps, bull traps, and bear traps. Traps occur when a breakout from a multiple top or bottom creates an entry, but price changes direction, and the next column generates a trade entry on the opposite side of the trade.
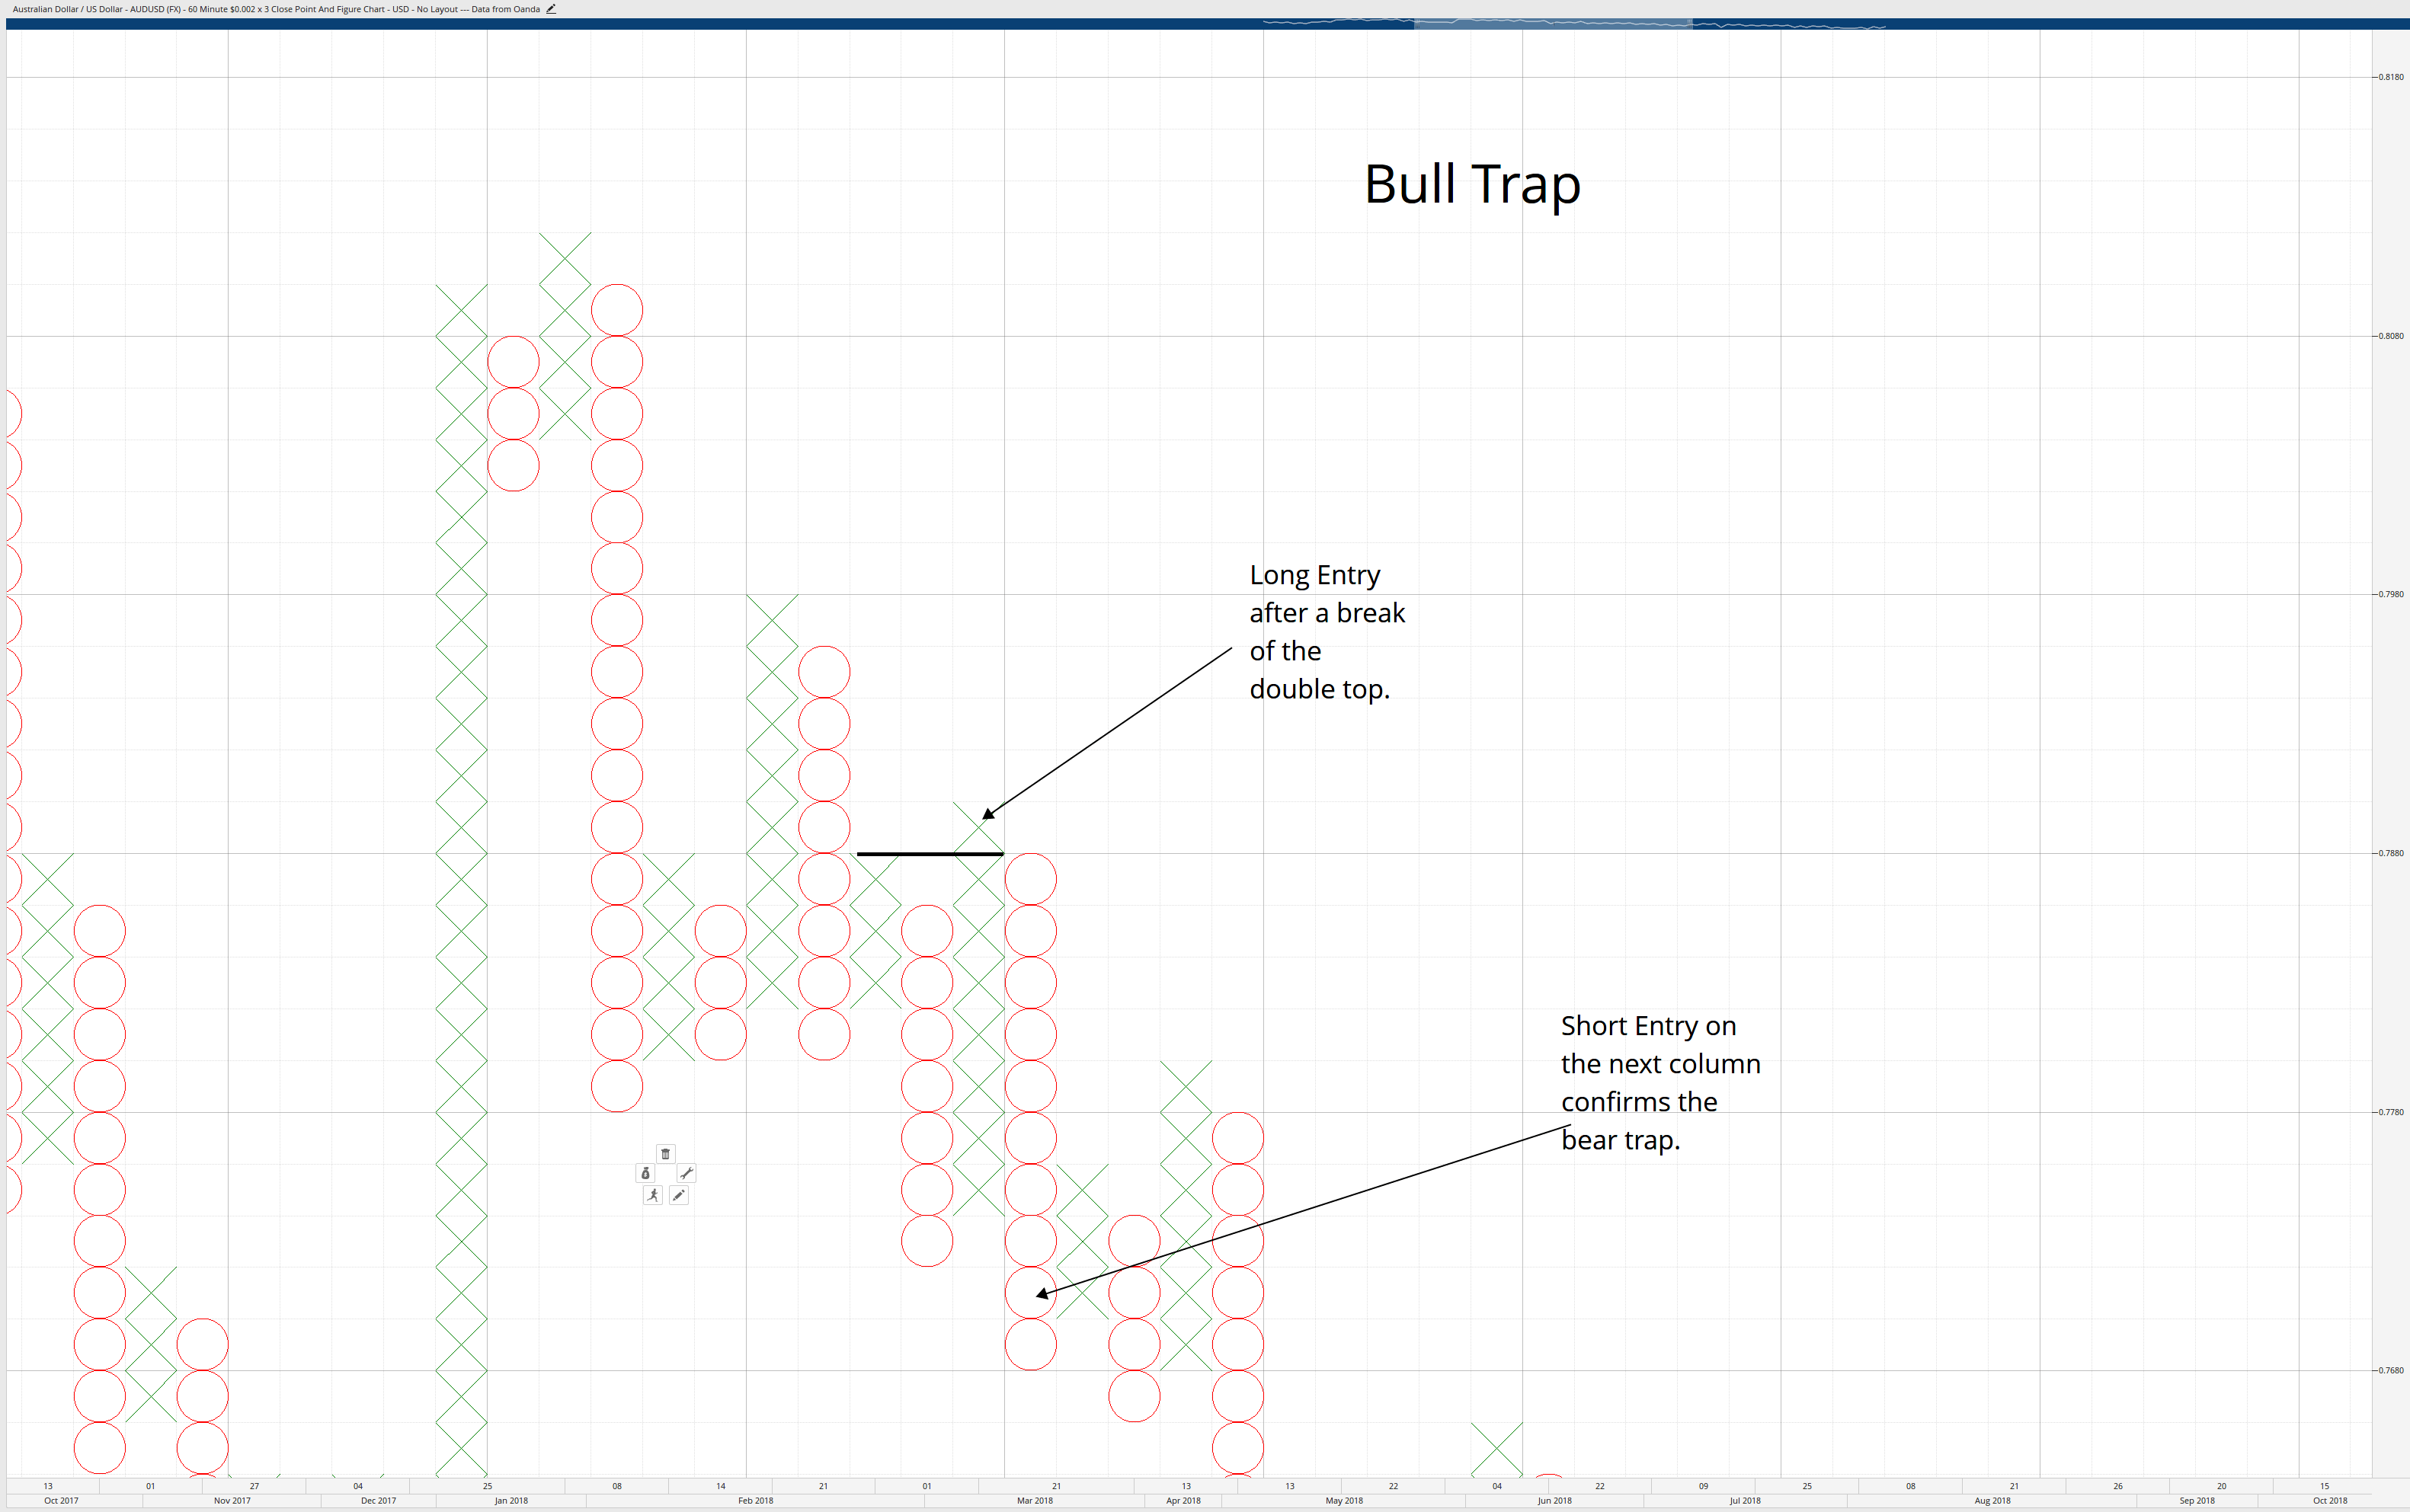
Bull Trap: Bull traps occur when price breaks a multiple top and creates a buy entry, but then the X column reverses to an O column that creates a new short entry.
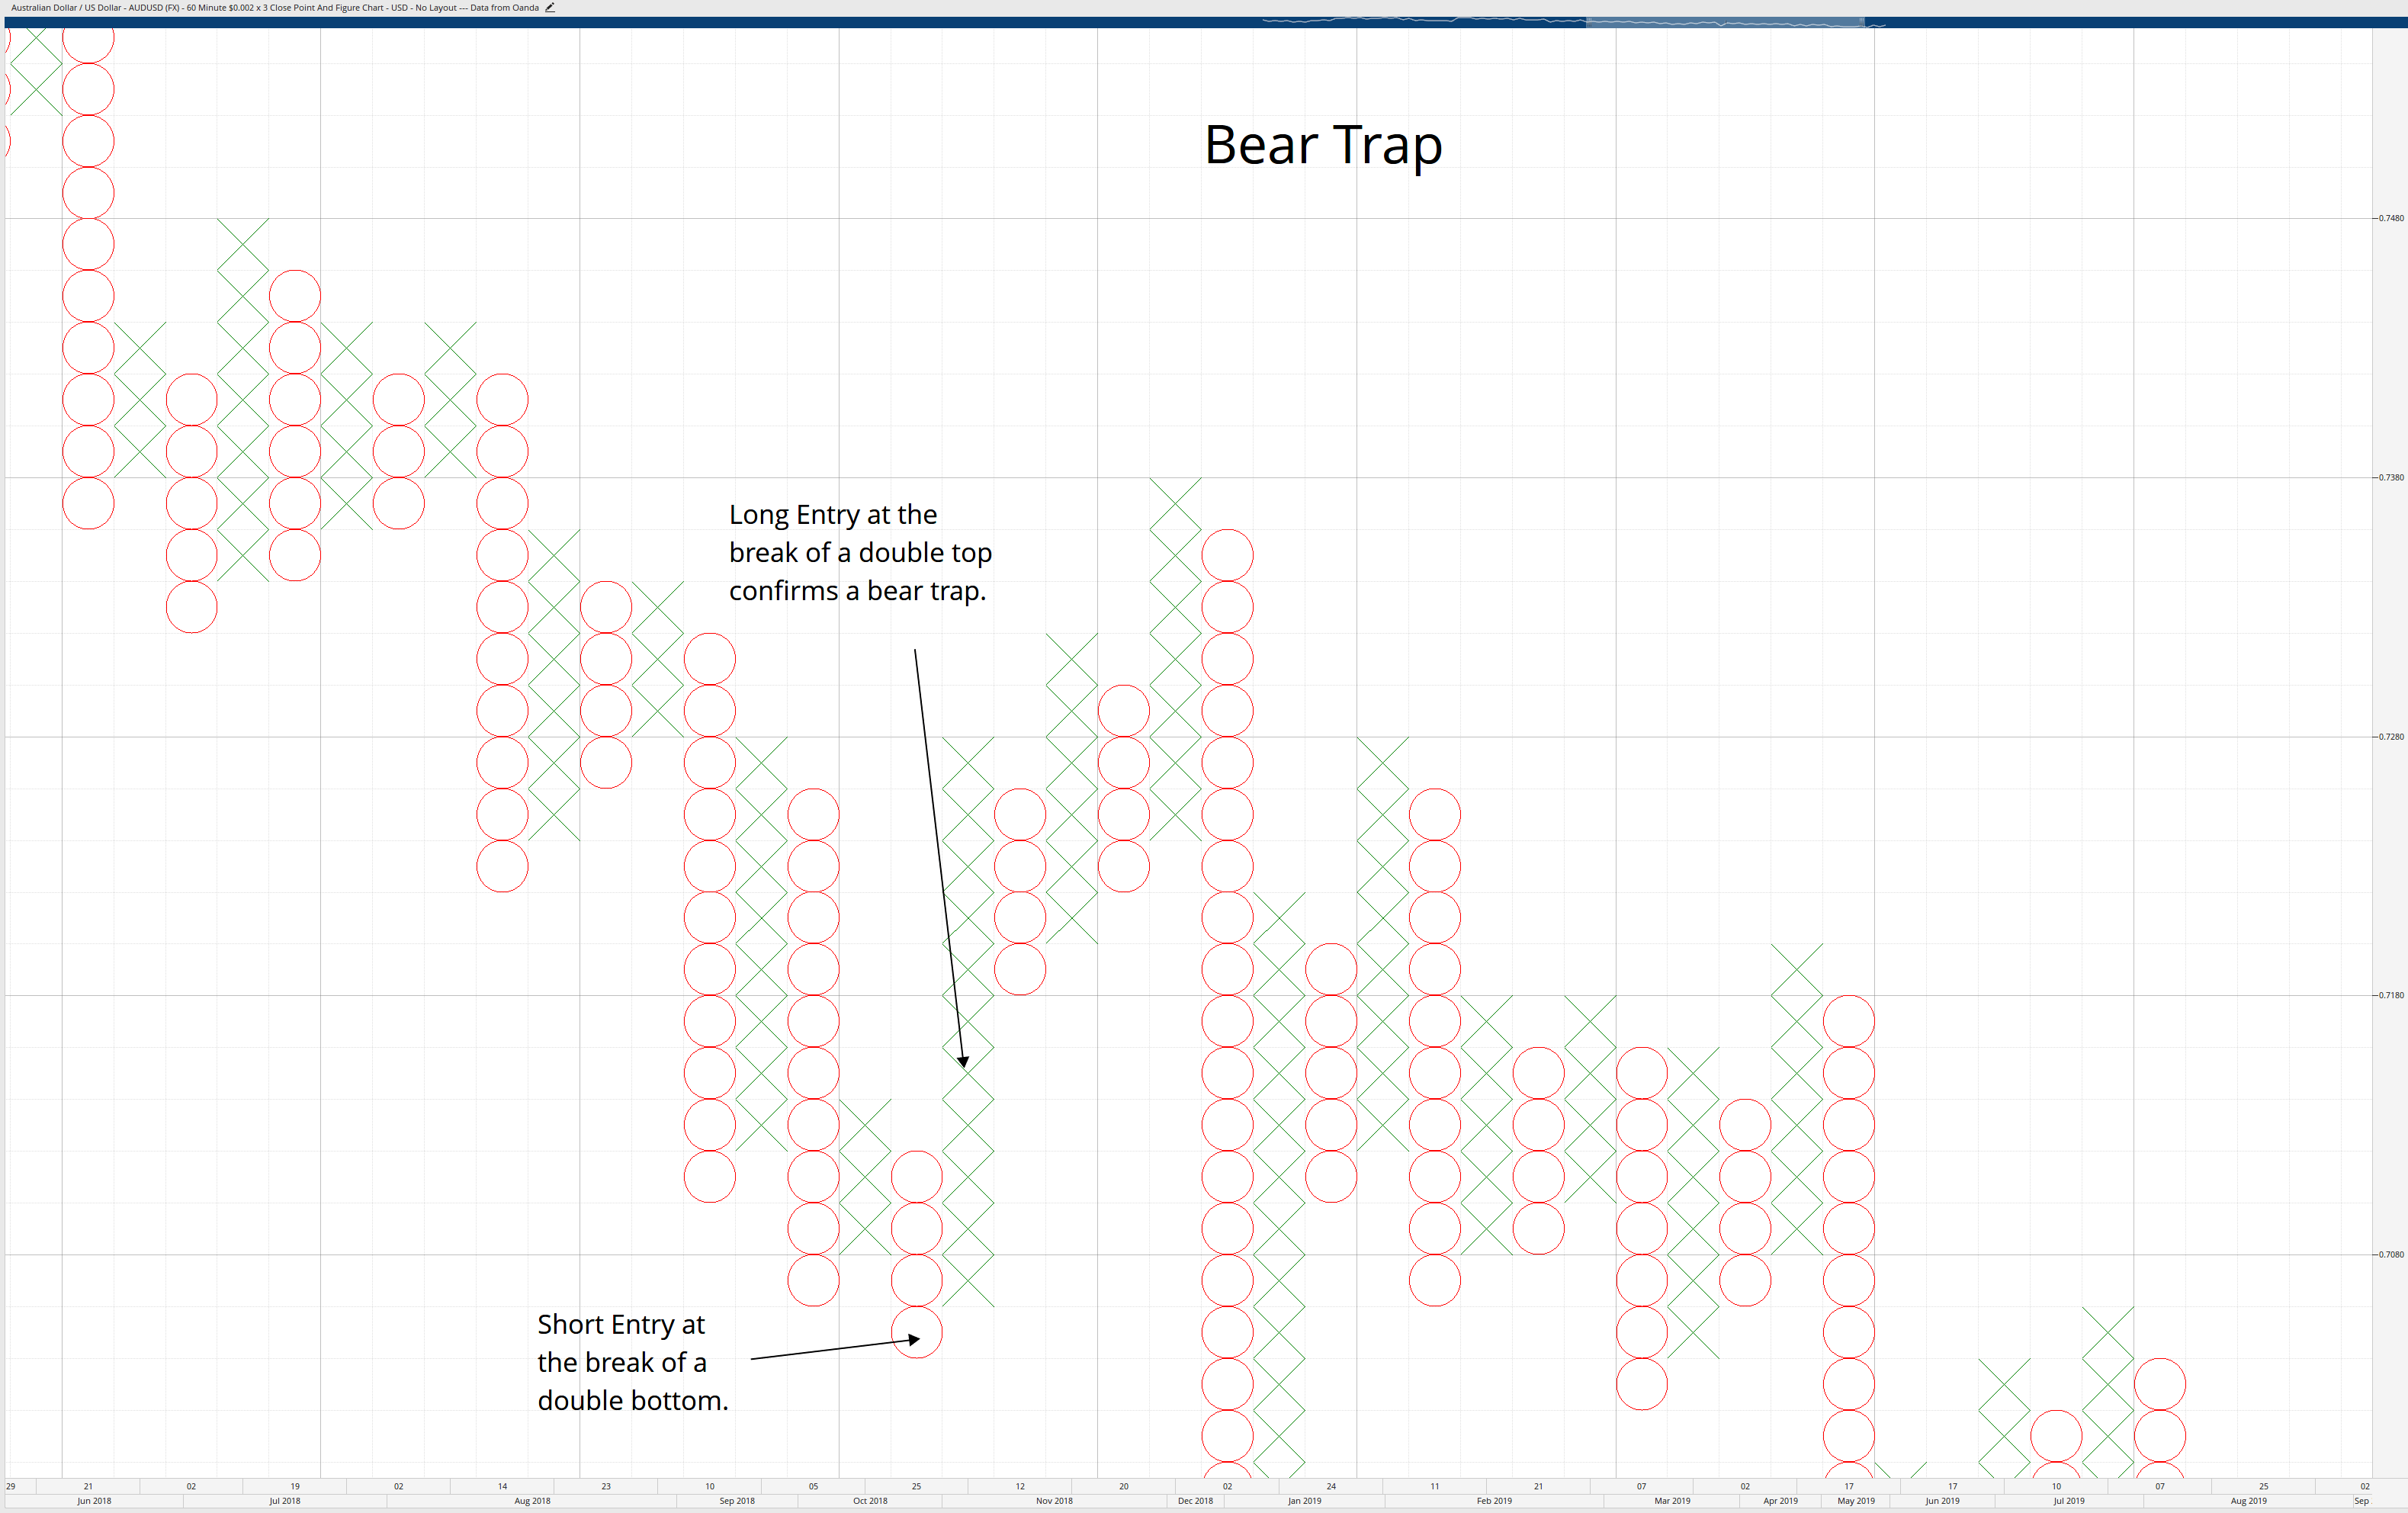
Bear Trap: Bear traps occur when price breaks a multiple bottom and creates a short entry, but then the O column reverses to an X column that creates a new buy entry.
Rising Bottoms
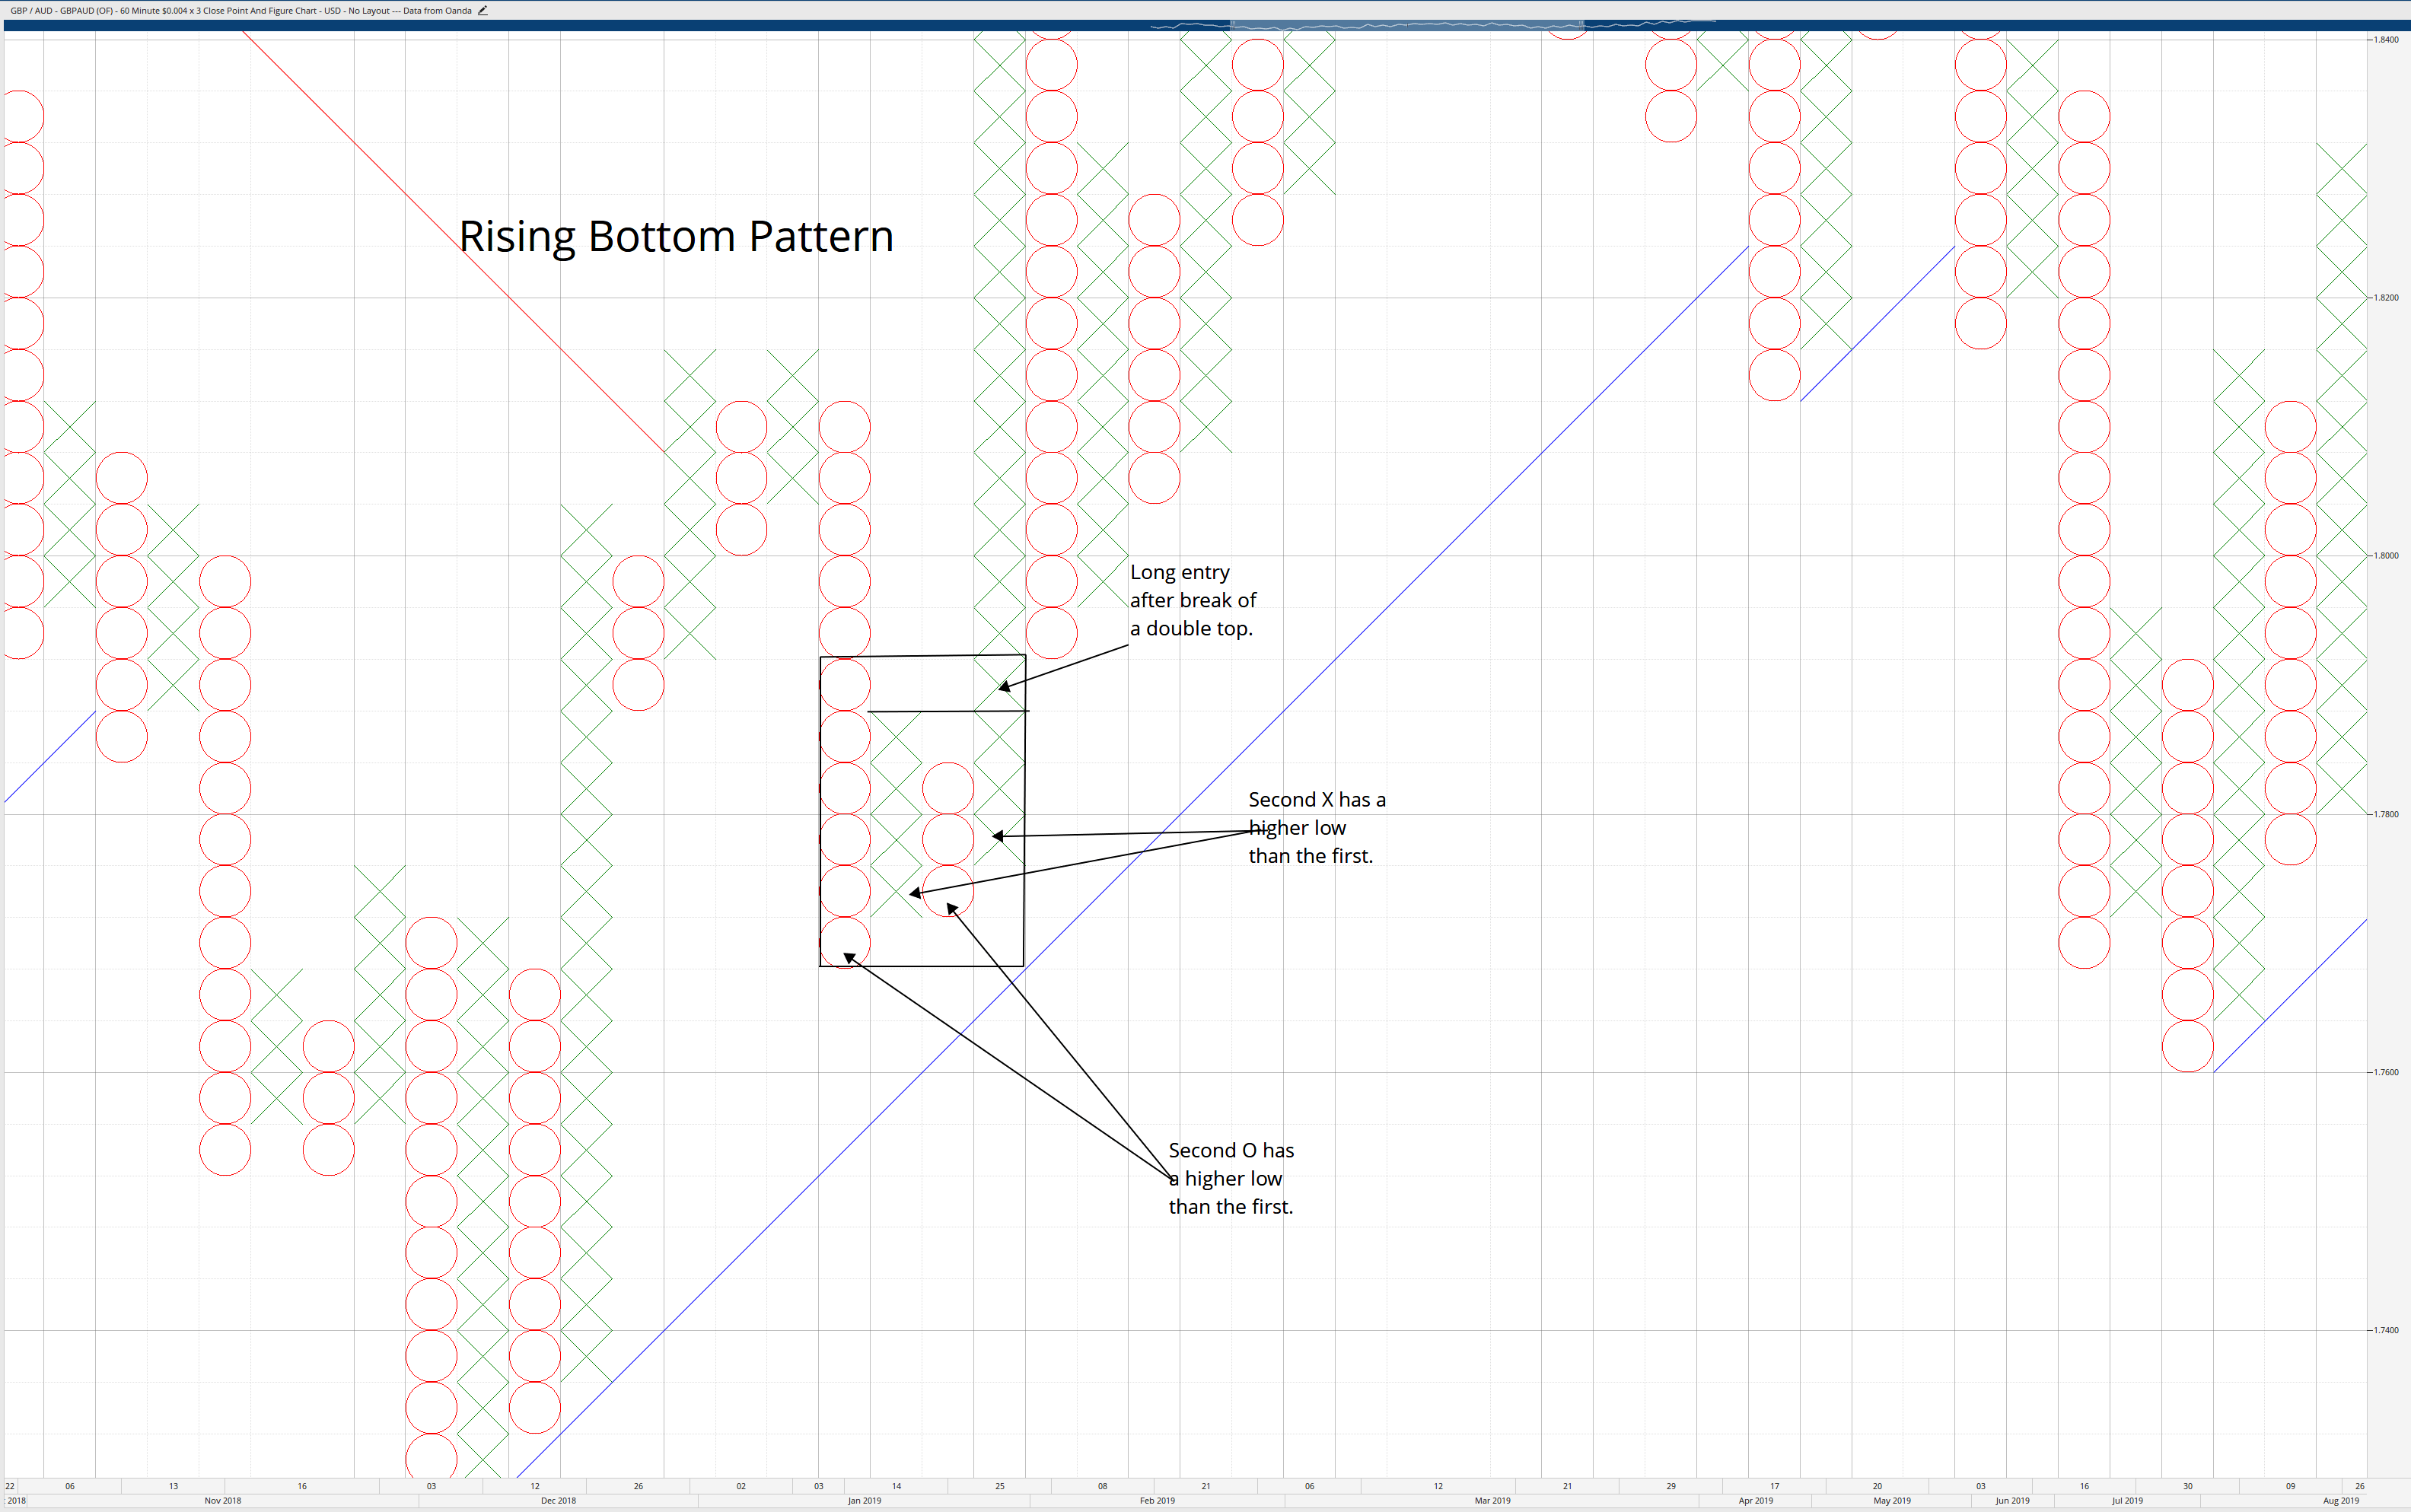
A rising bottom pattern may look like a regular double top pattern, but it is different. It is different because of the columns of Os in this pattern. The Rising Bottoms pattern has at least four columns with sequential higher lows. The last O column must have a higher low than the first column of Os, and the previous X column must have a higher low than the first X column. The long entry occurs when the double top is broken.
Declining Tops
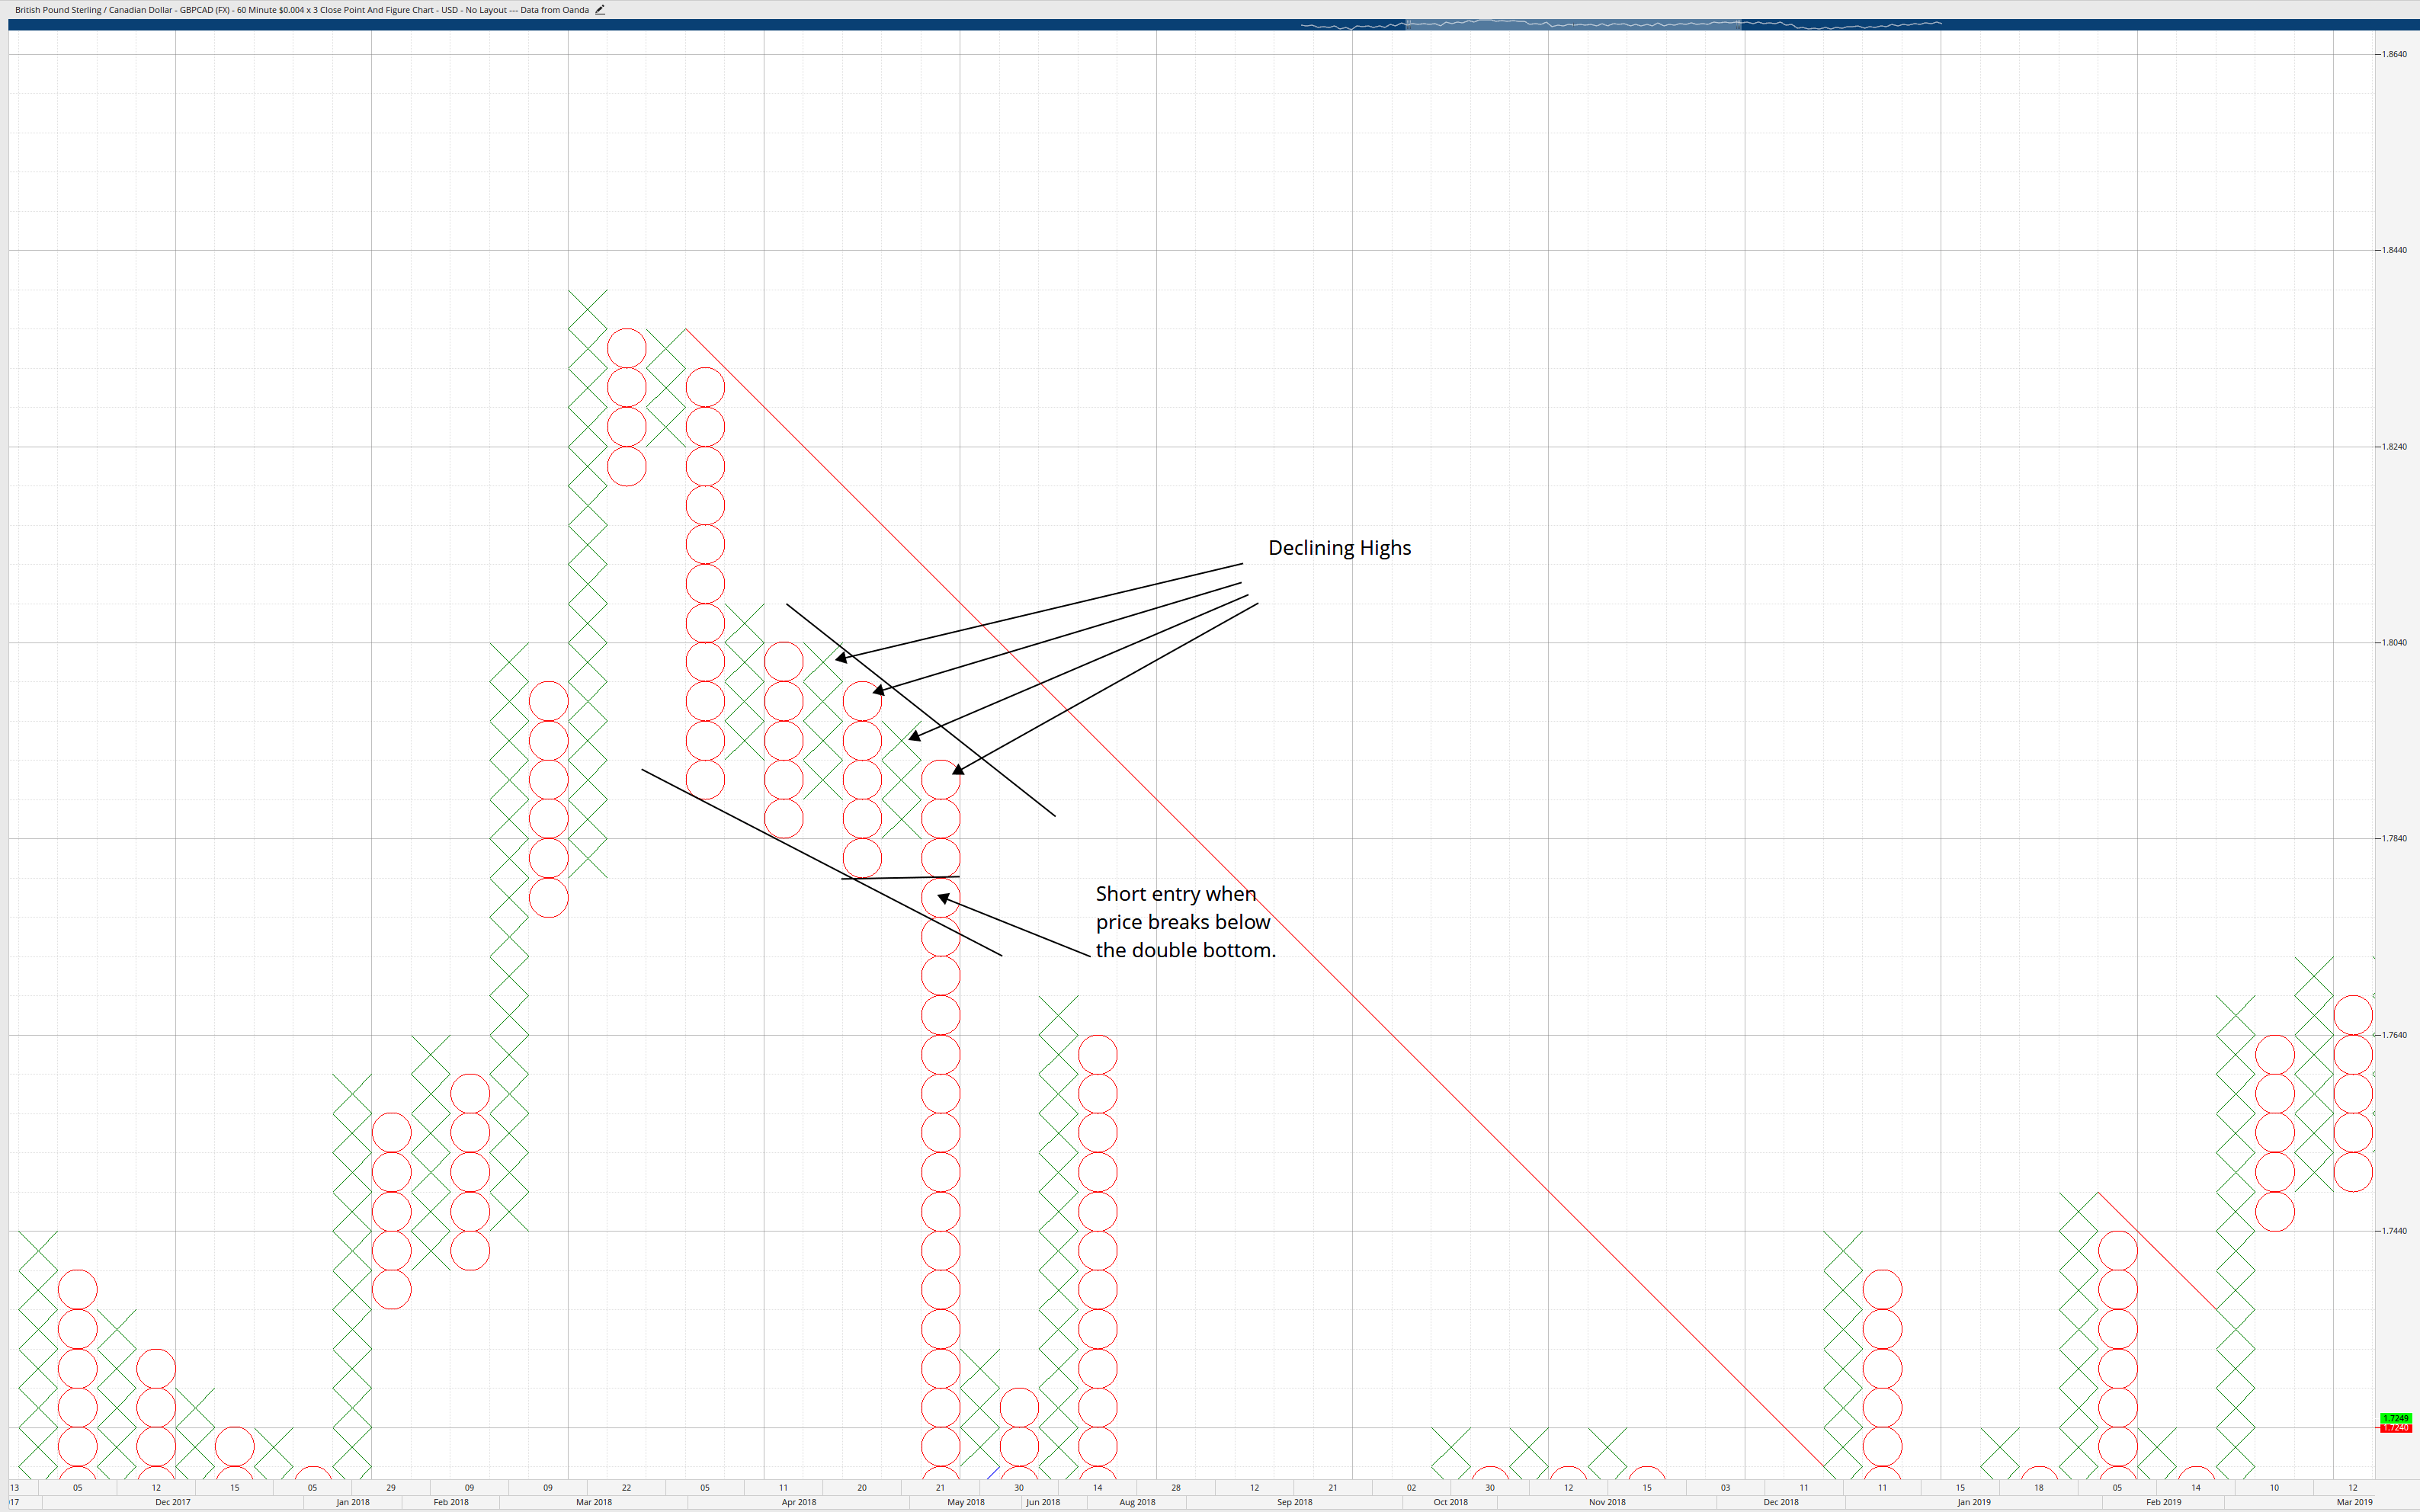
The Declining Tops pattern is the inverse of the Rising Bottoms pattern. The Declining Tops pattern has at least four columns with sequential lower highs. The last X column must have a lower high than the first column of Xs, and the previous O column must have a lower high than the first O column. The short entry occurs when the double bottom is broken.
Split Tops and Bottoms
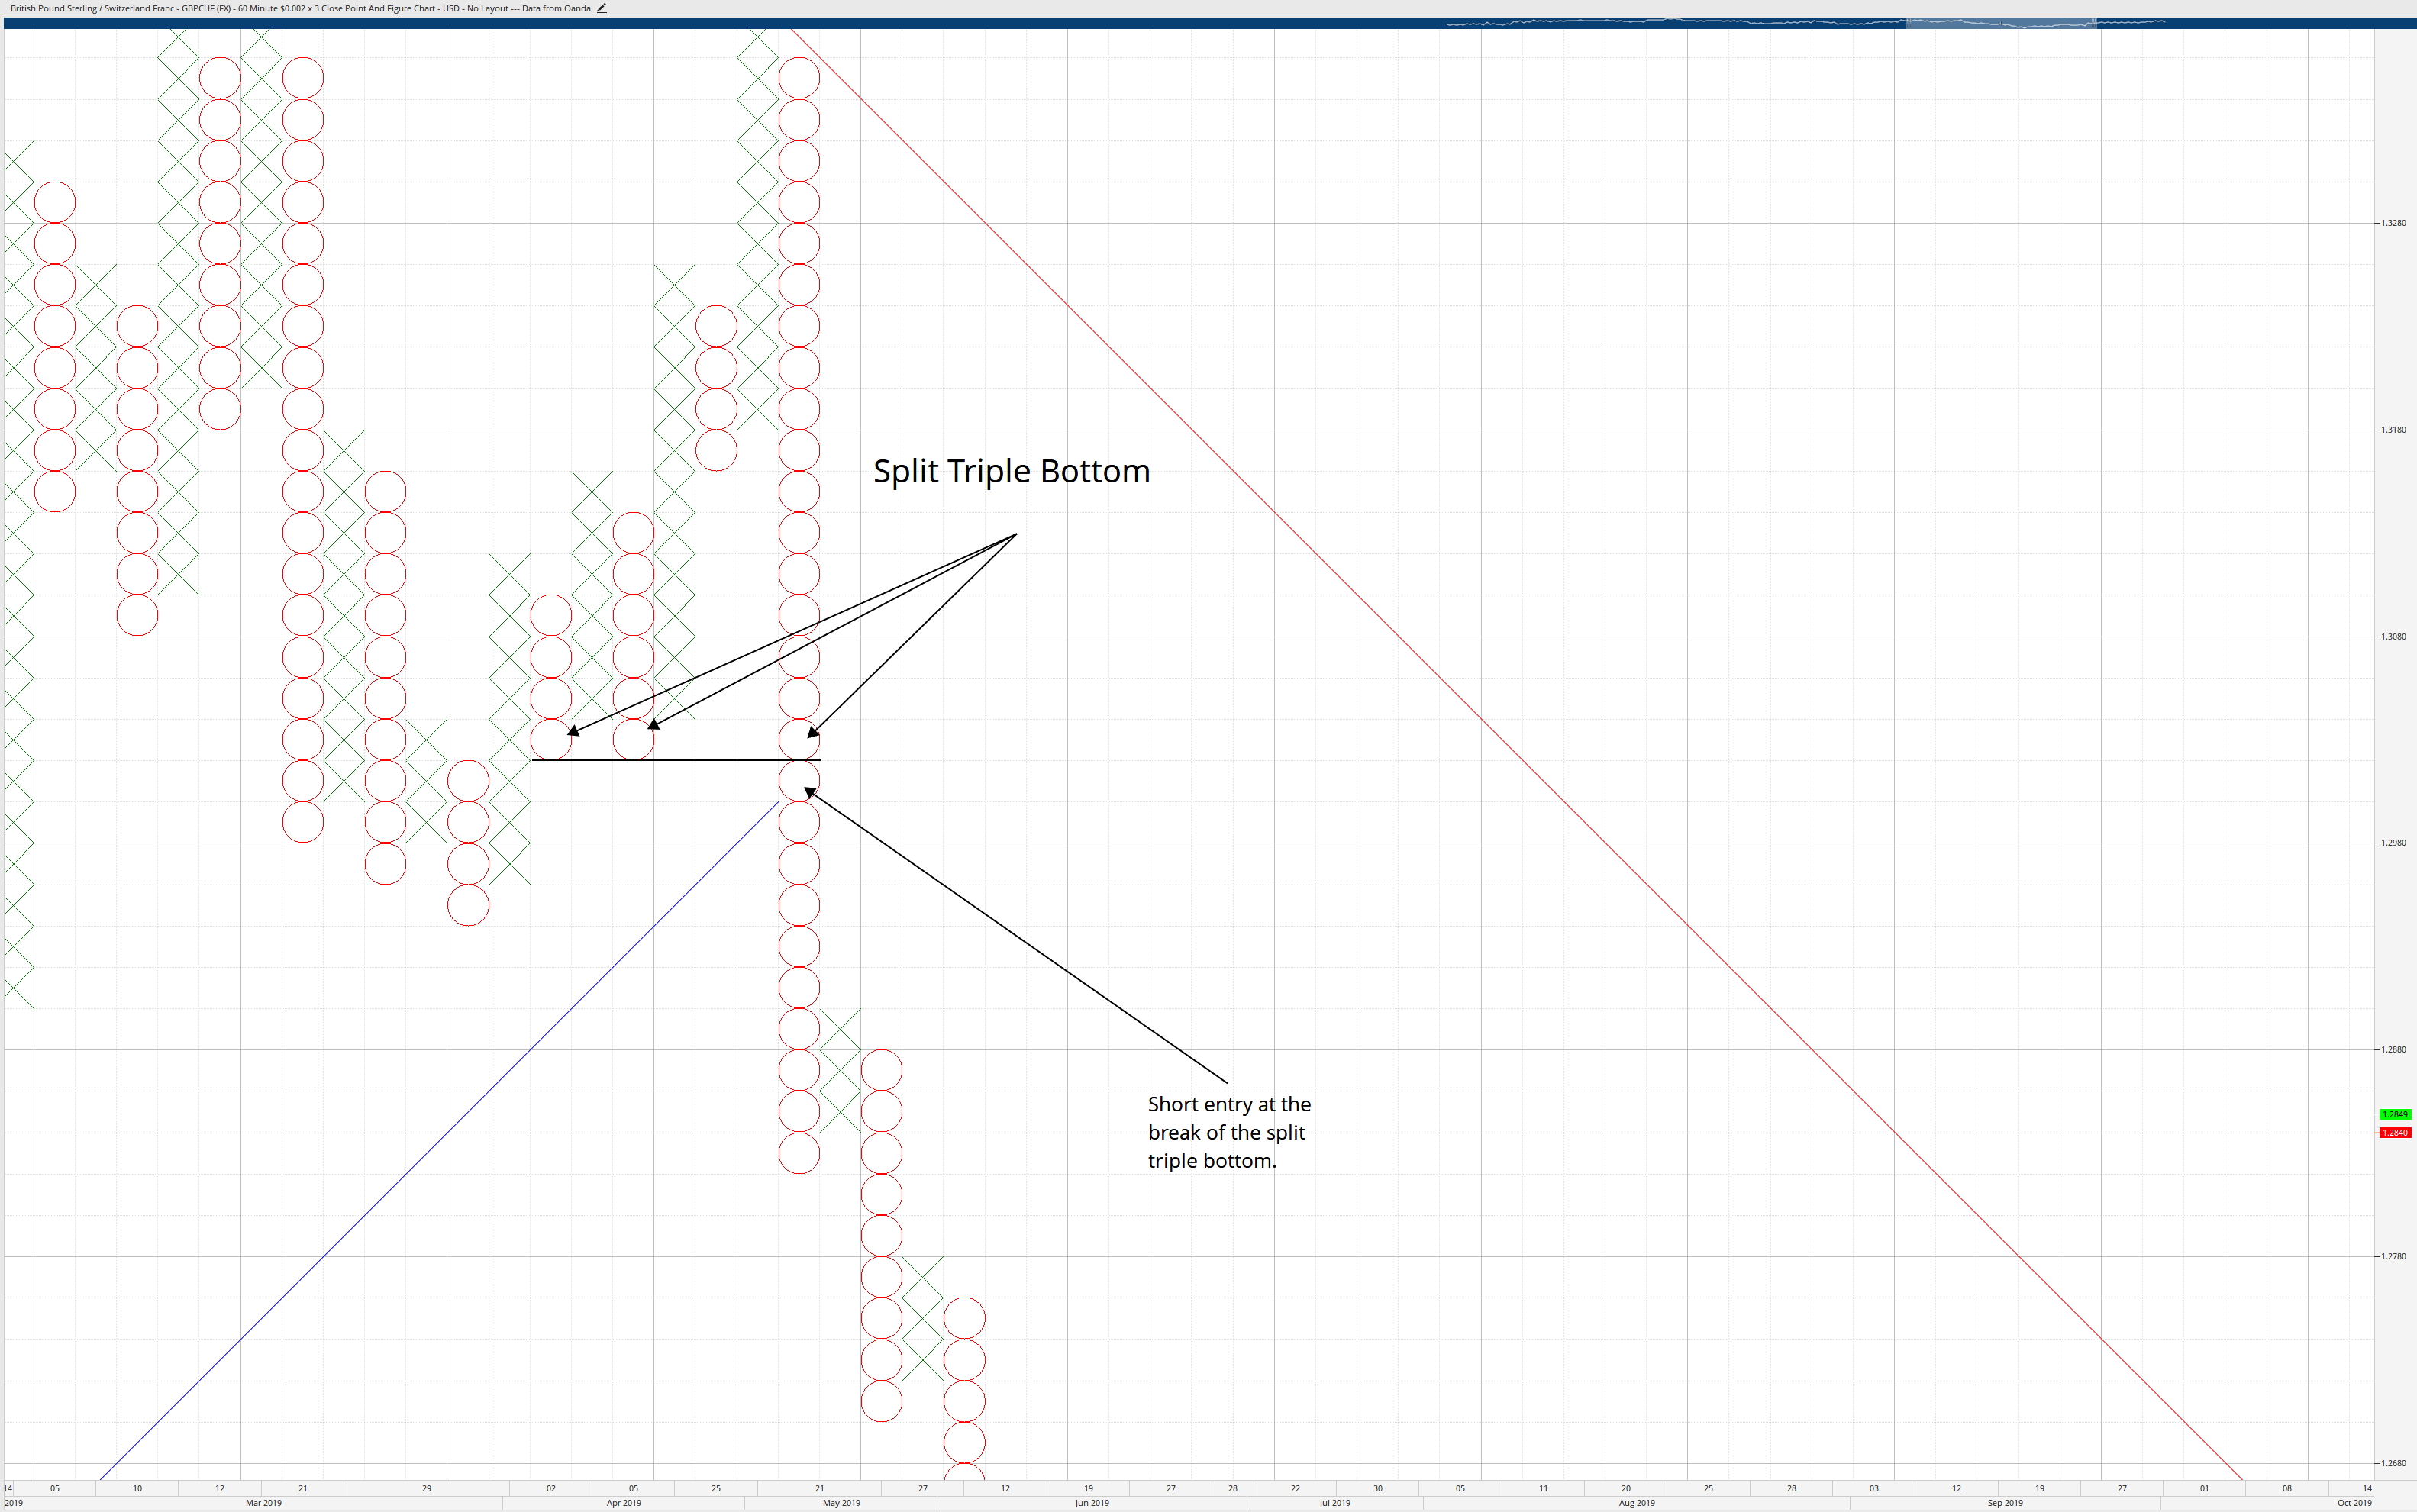
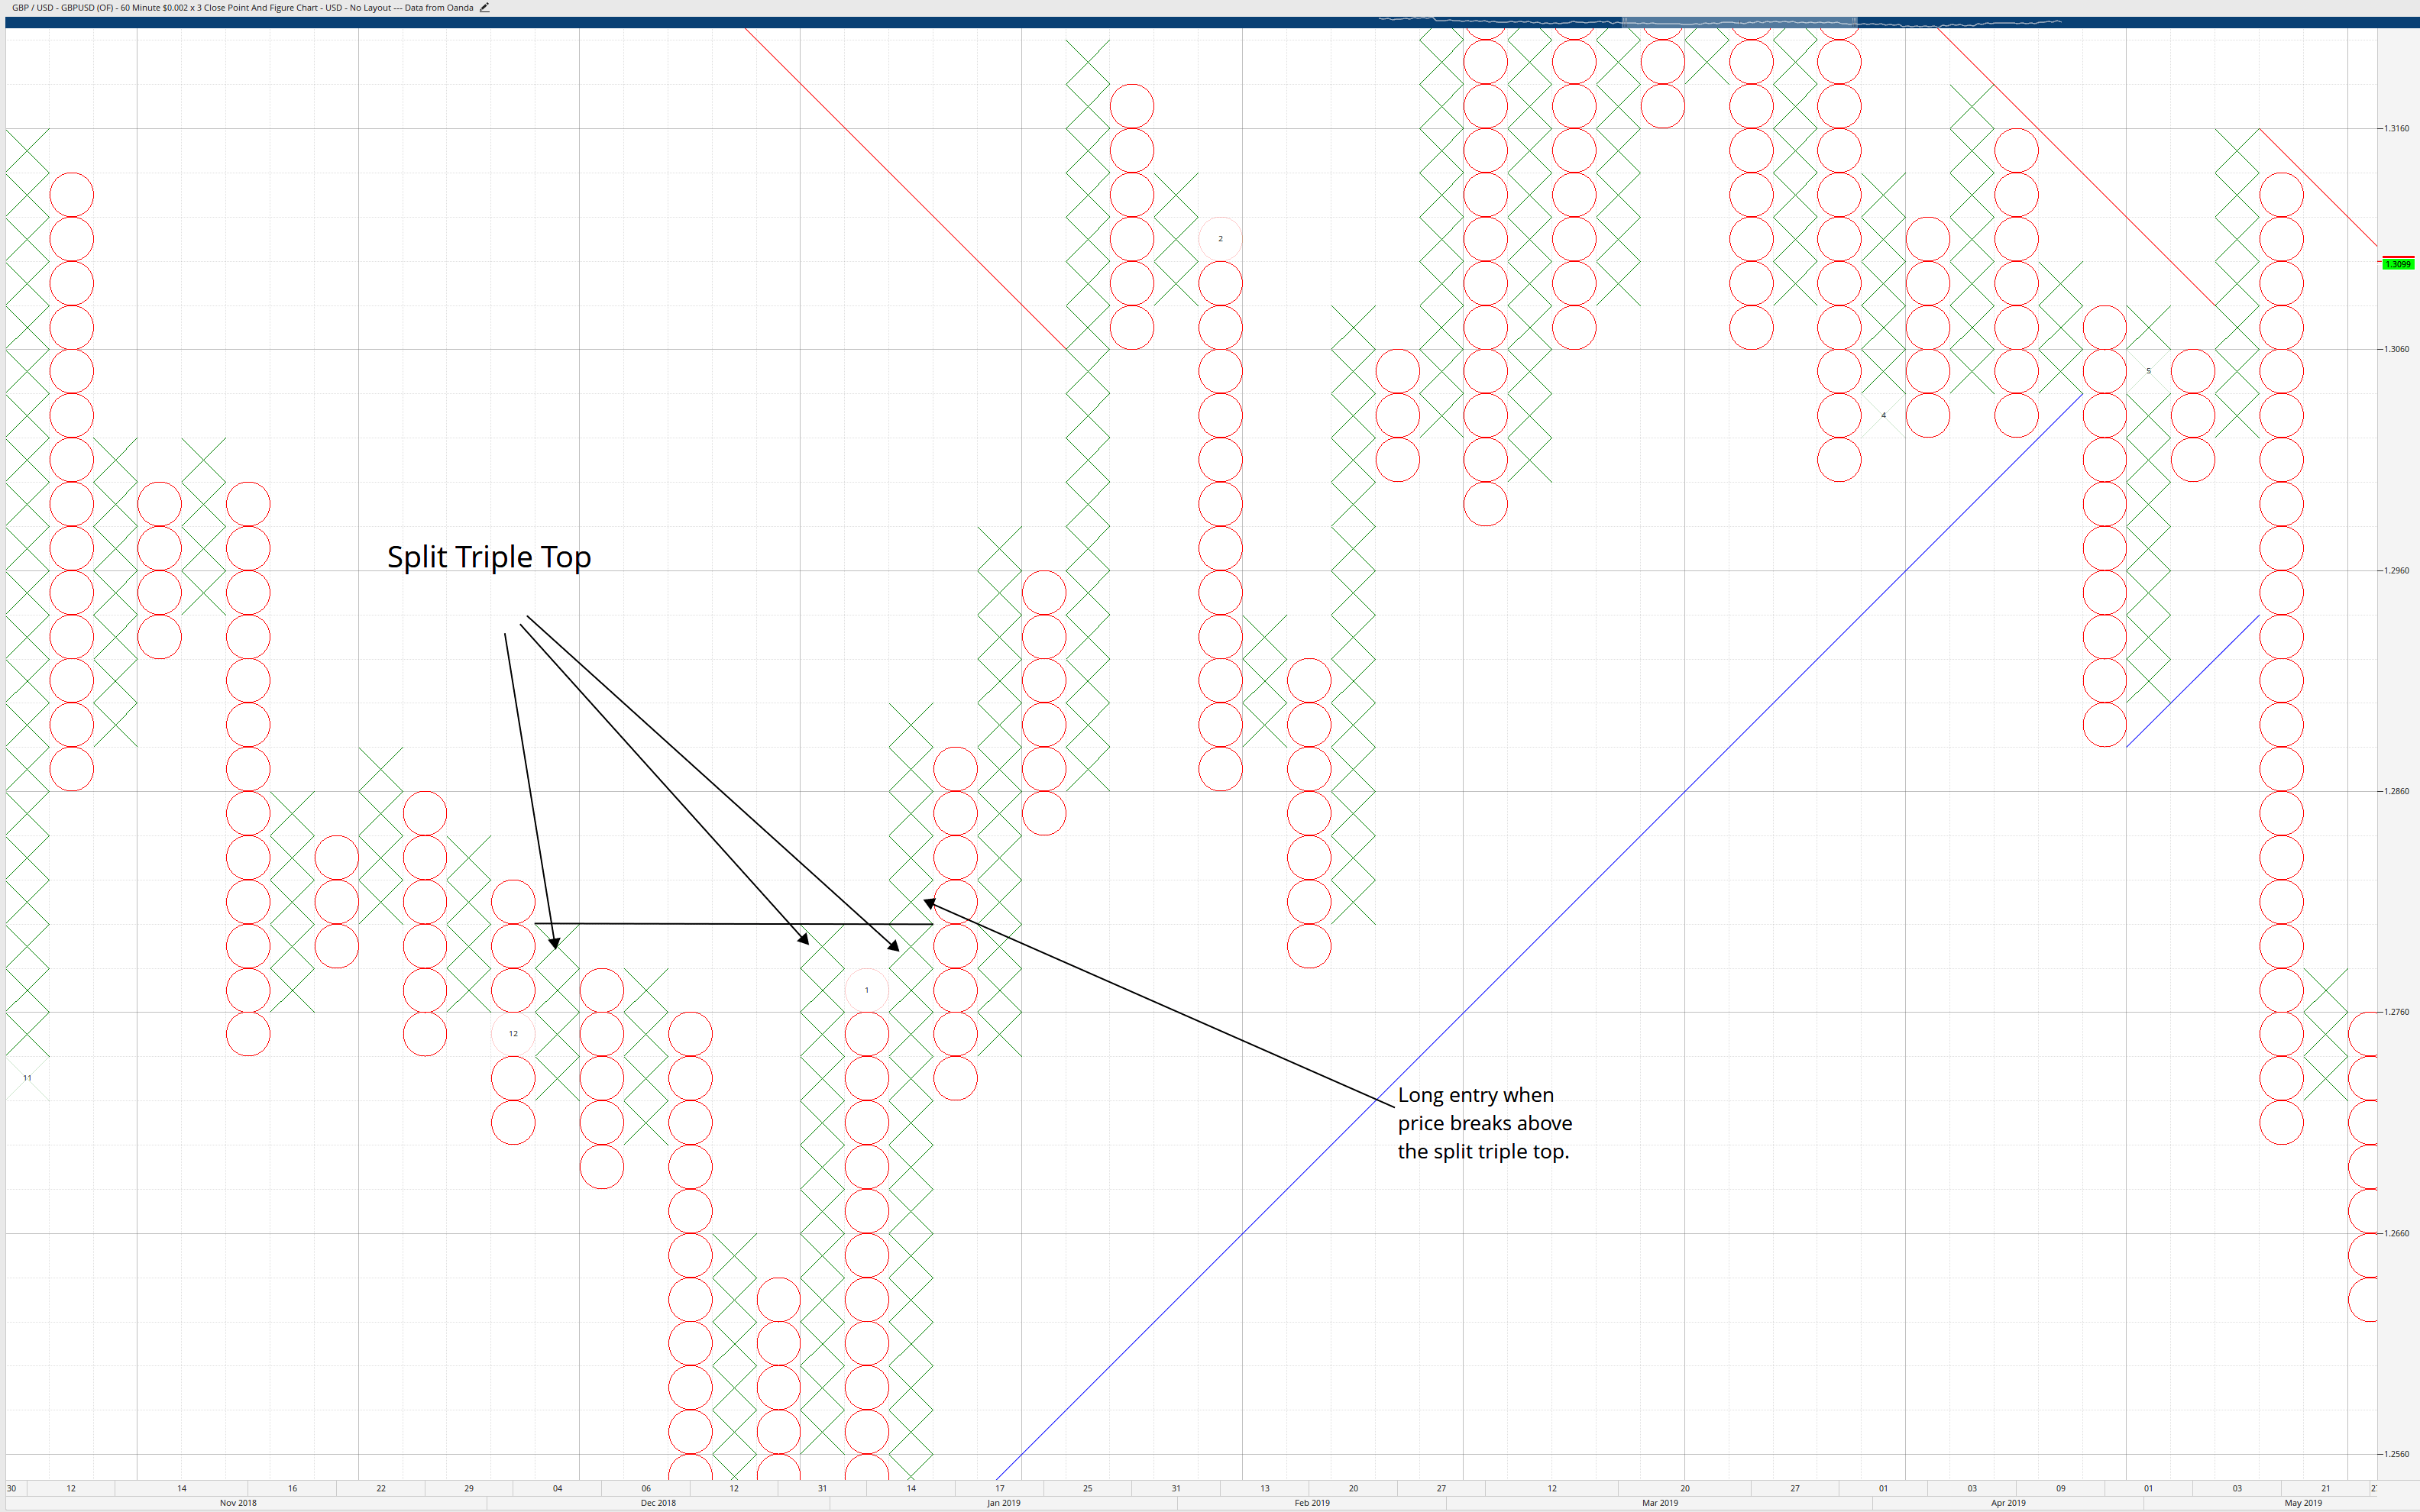
Split Tops and Bottoms generally occur in the form of Split Triple Tops and Split Triple Bottoms. Split Tops and Bottoms have a ‘gap’ in between the tops and bottoms. How many columns do you consider in the formation of a Split Top or Bottom? It is generally believed that 6 to 10 columns are appropriate for finding Split Tops and Bottoms. We trade Split Tops and Bottoms patterns the same way we trade any other multiple top or bottom.
Triangles
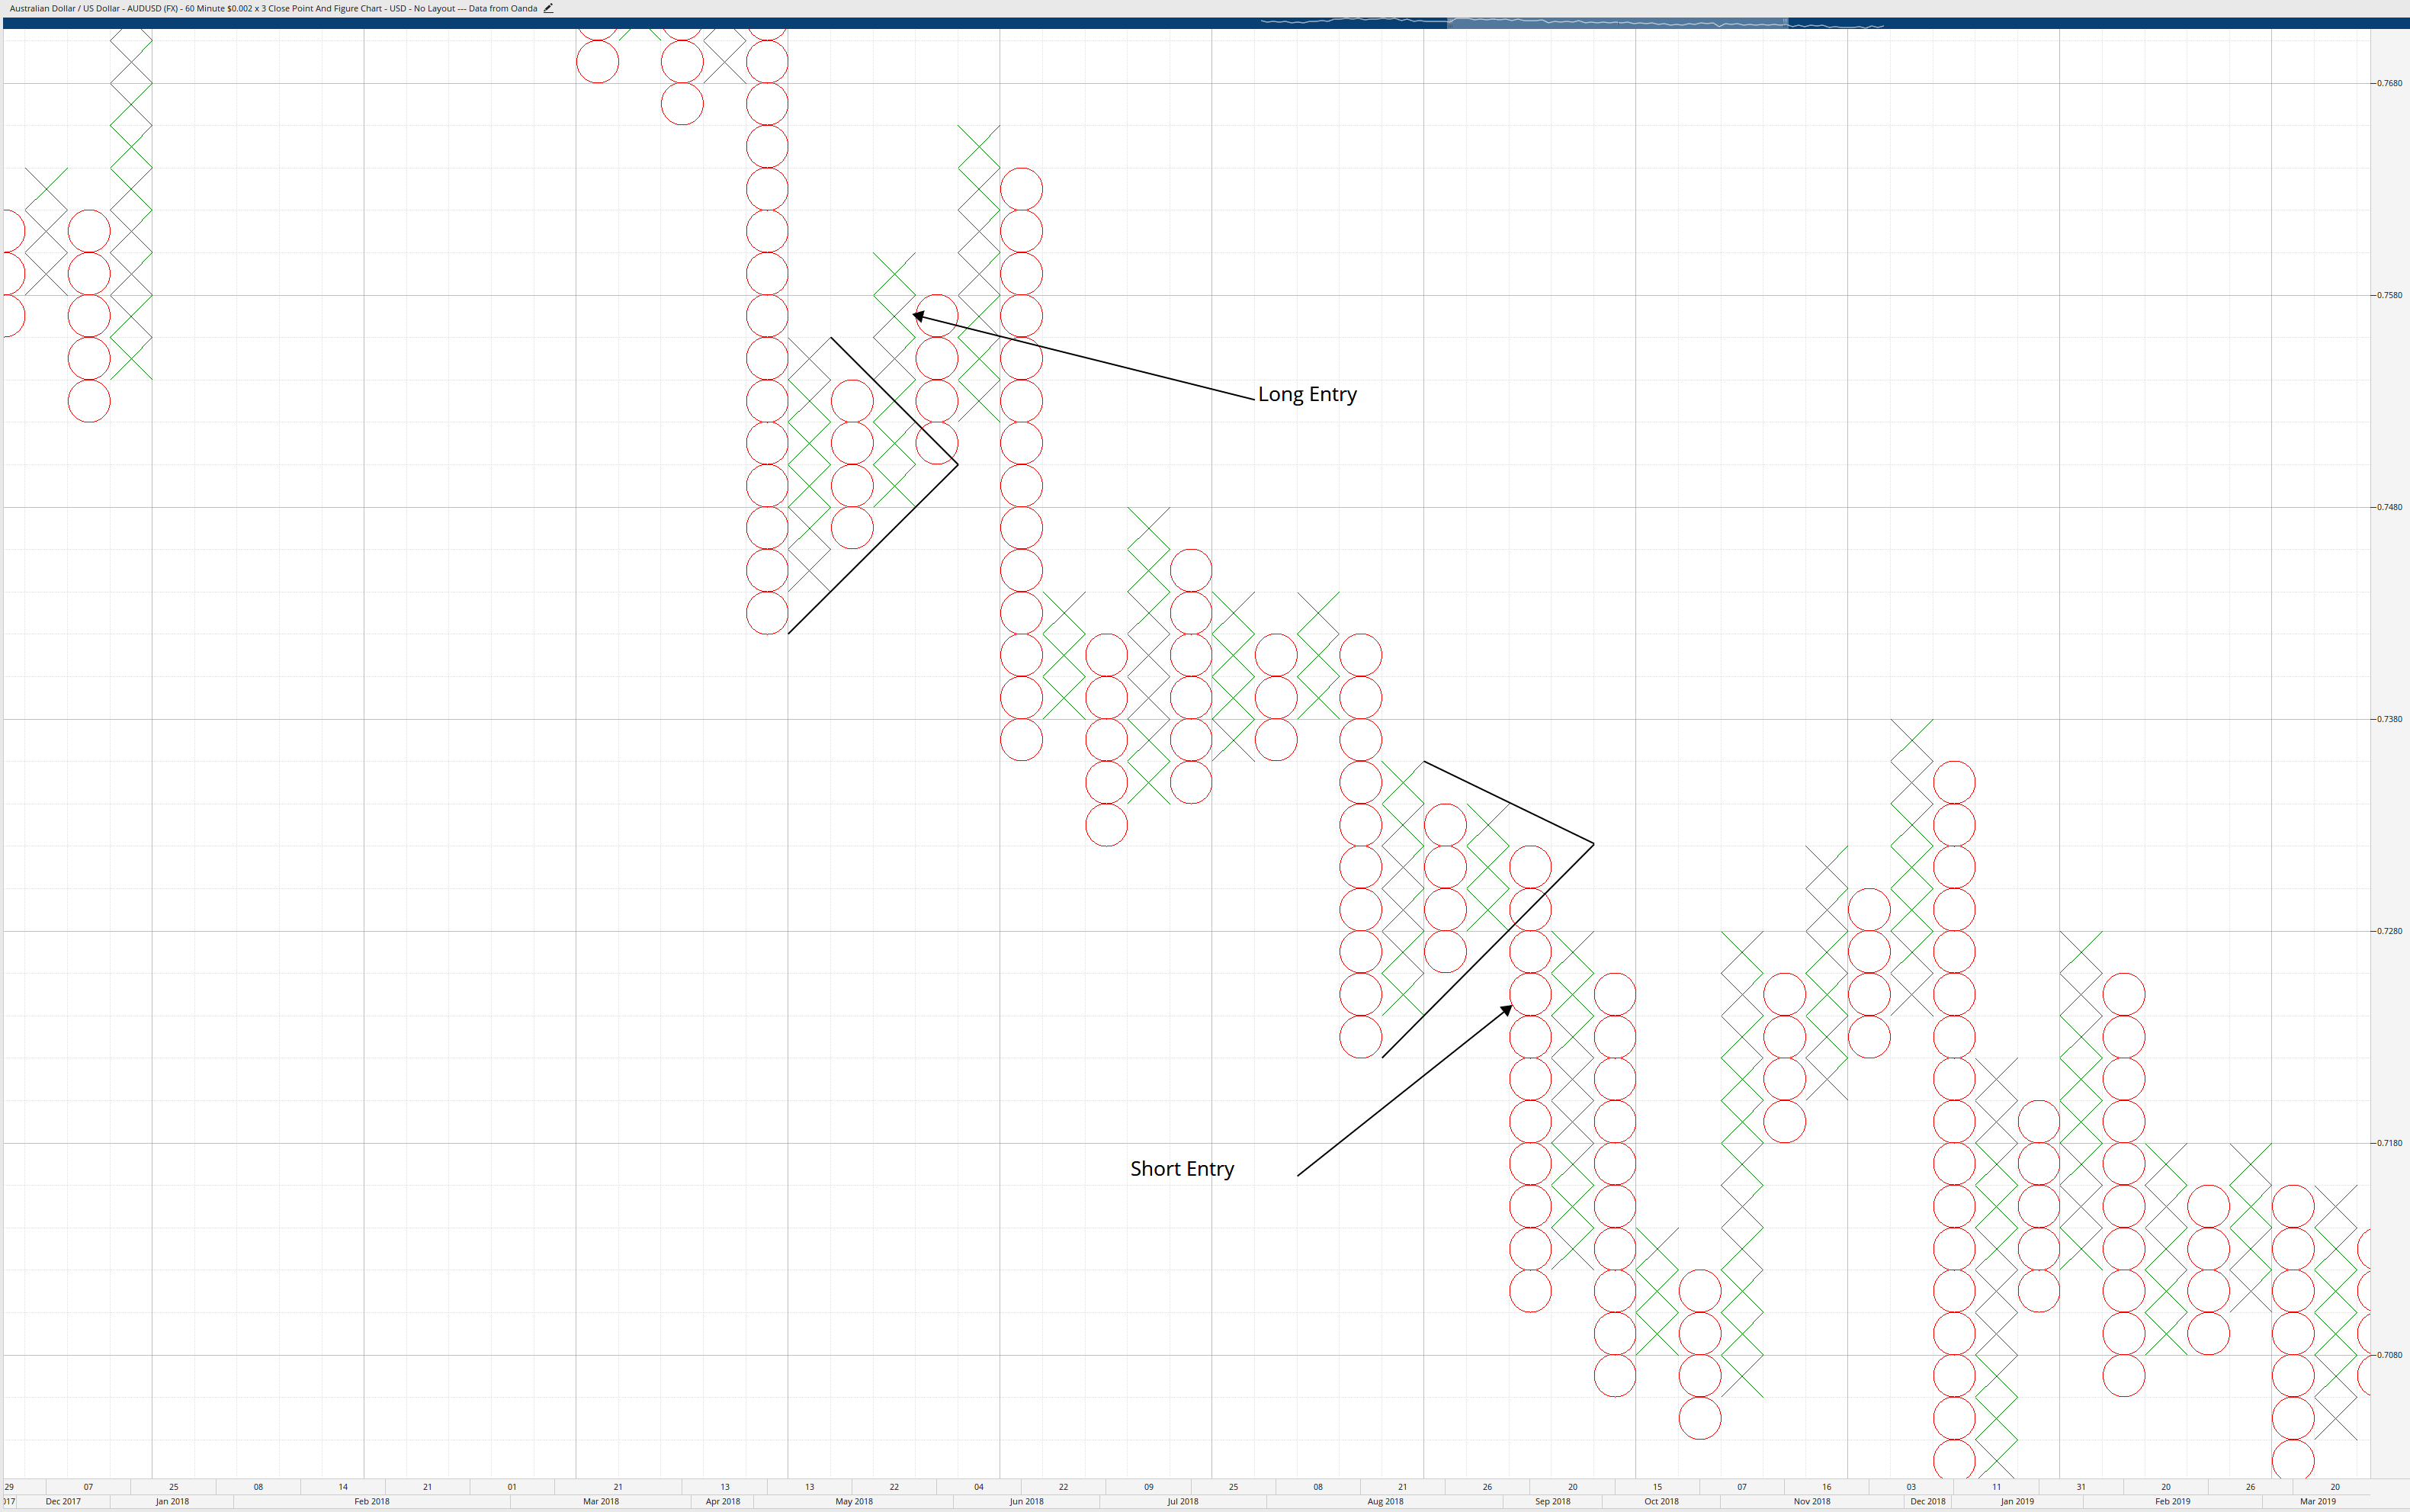
Triangles are common patterns you will find on Point & Figure charts. But it is important to remember that just because price breaks through a triangle, that doesn’t mean that we take an immediate entry on the break – we still have to wait for a multiple top or bottom to be broken.
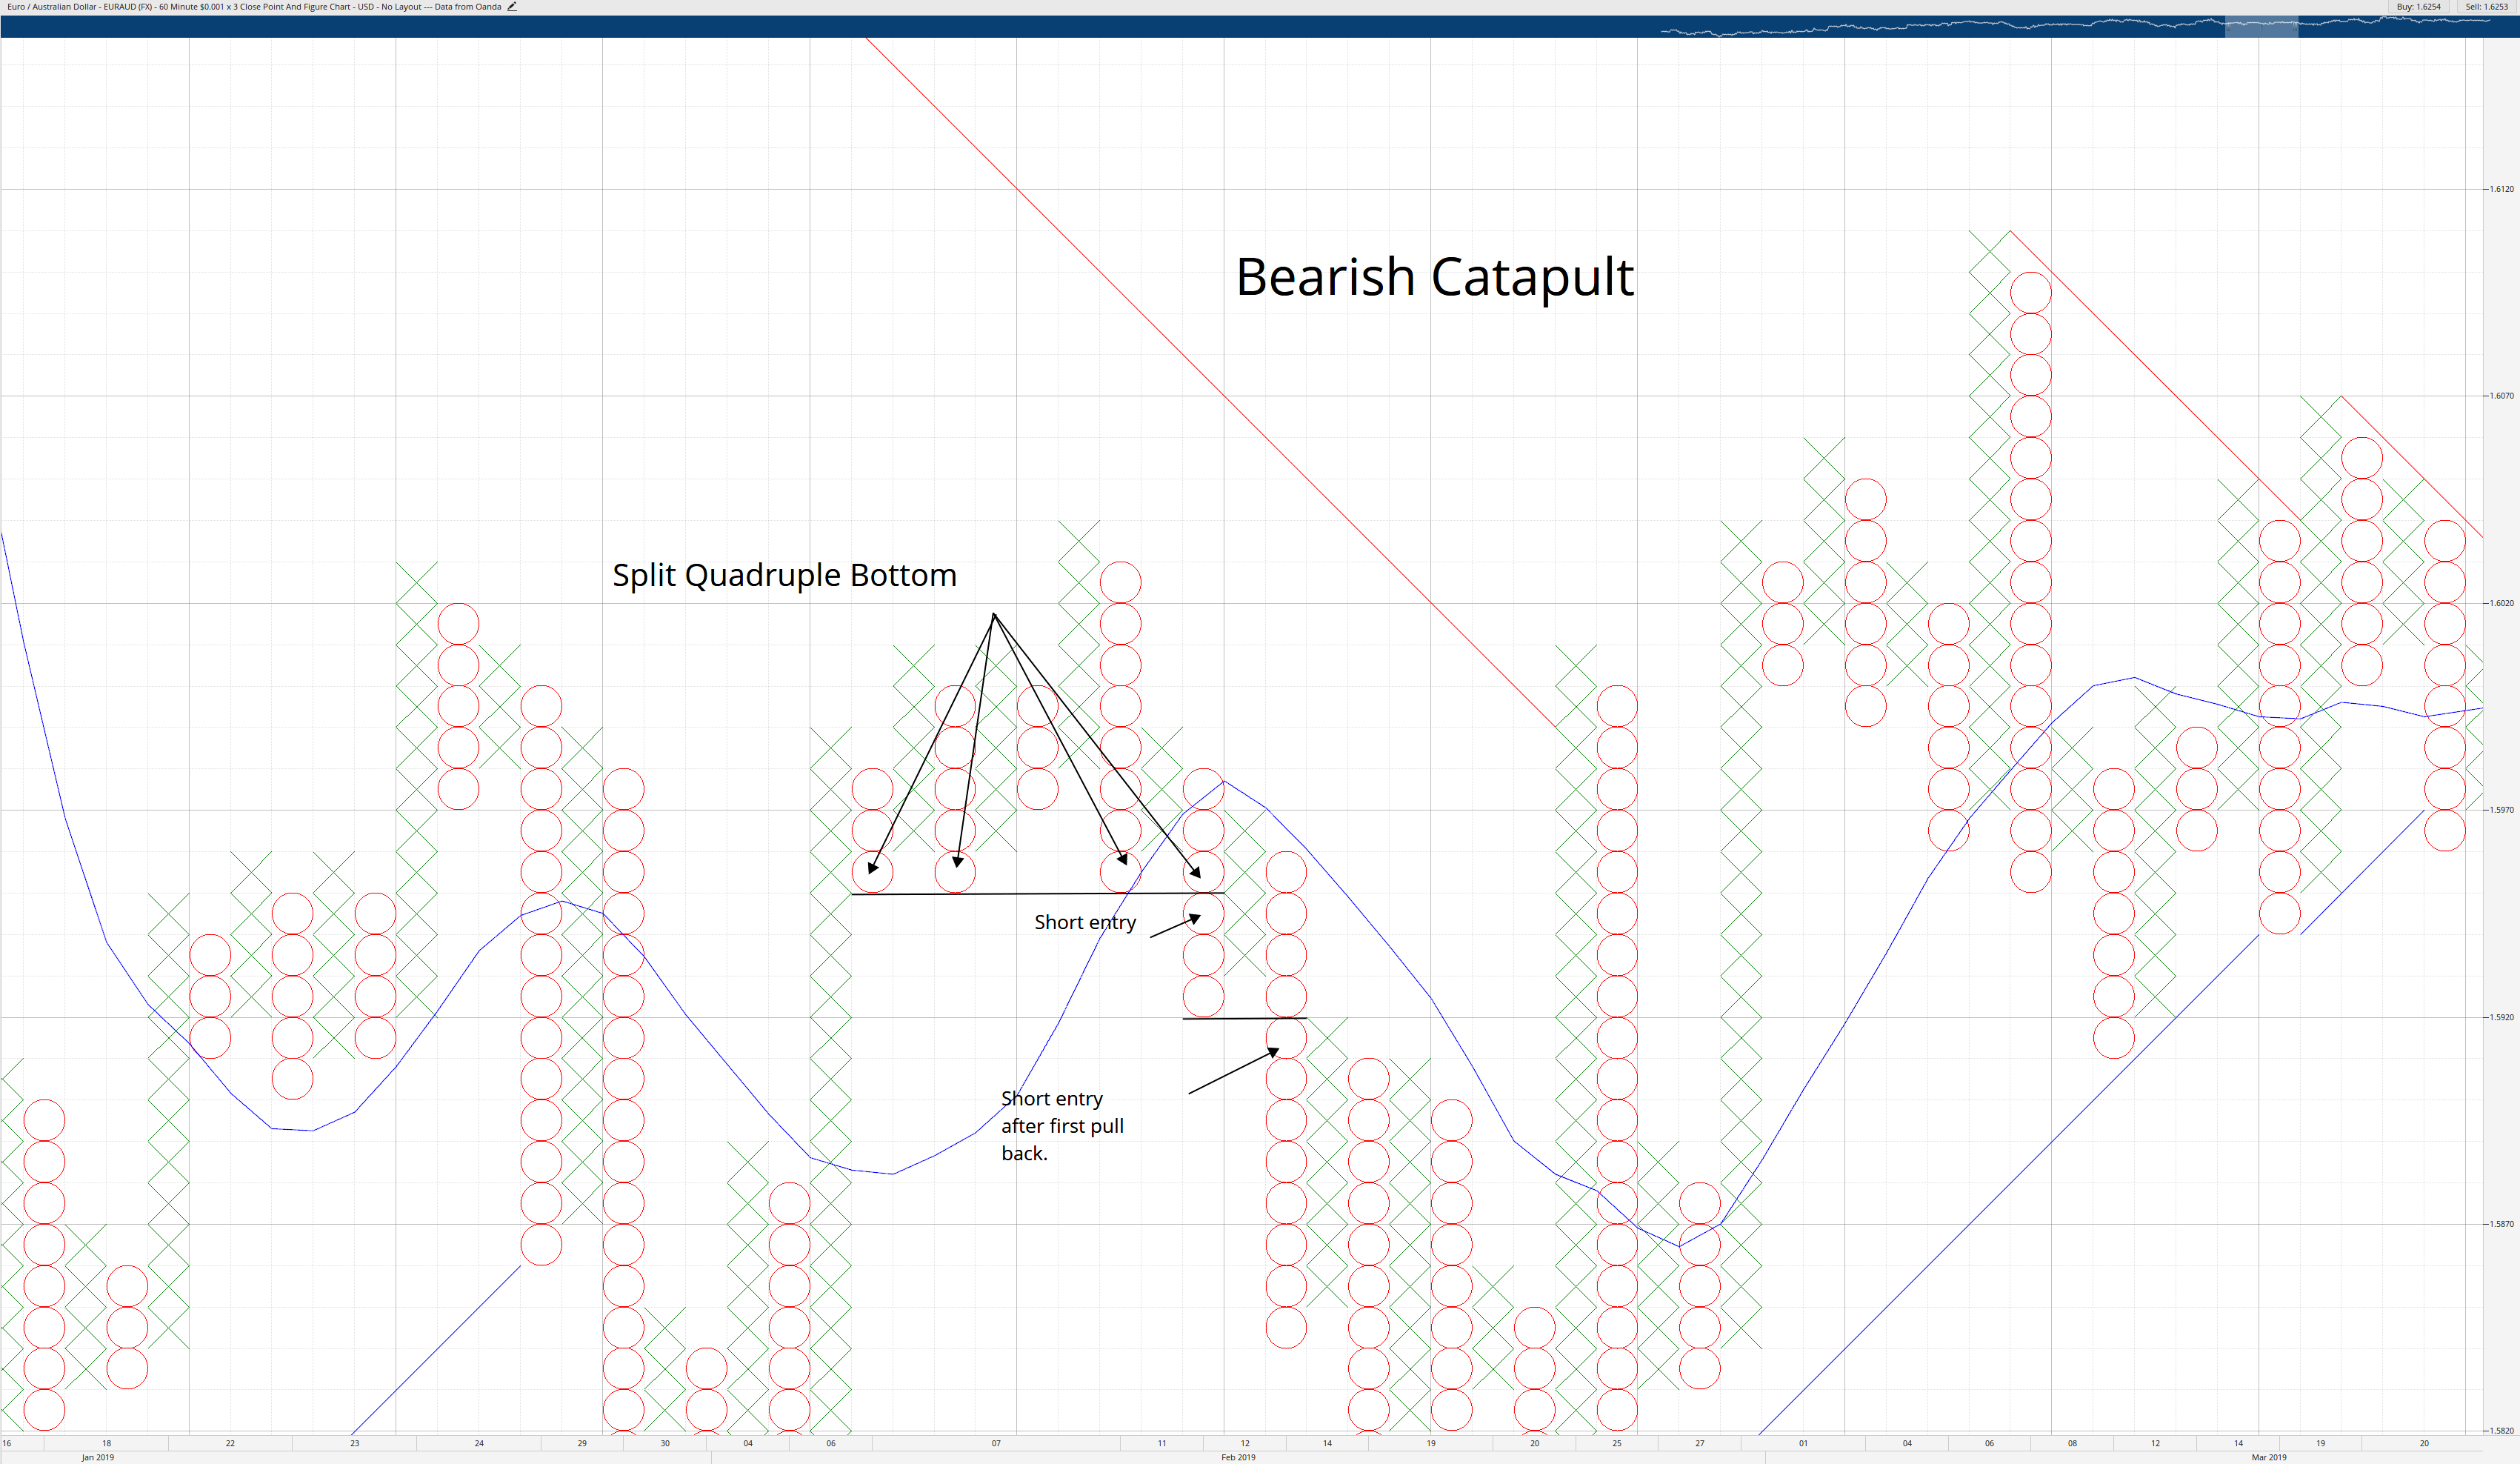
Catapults
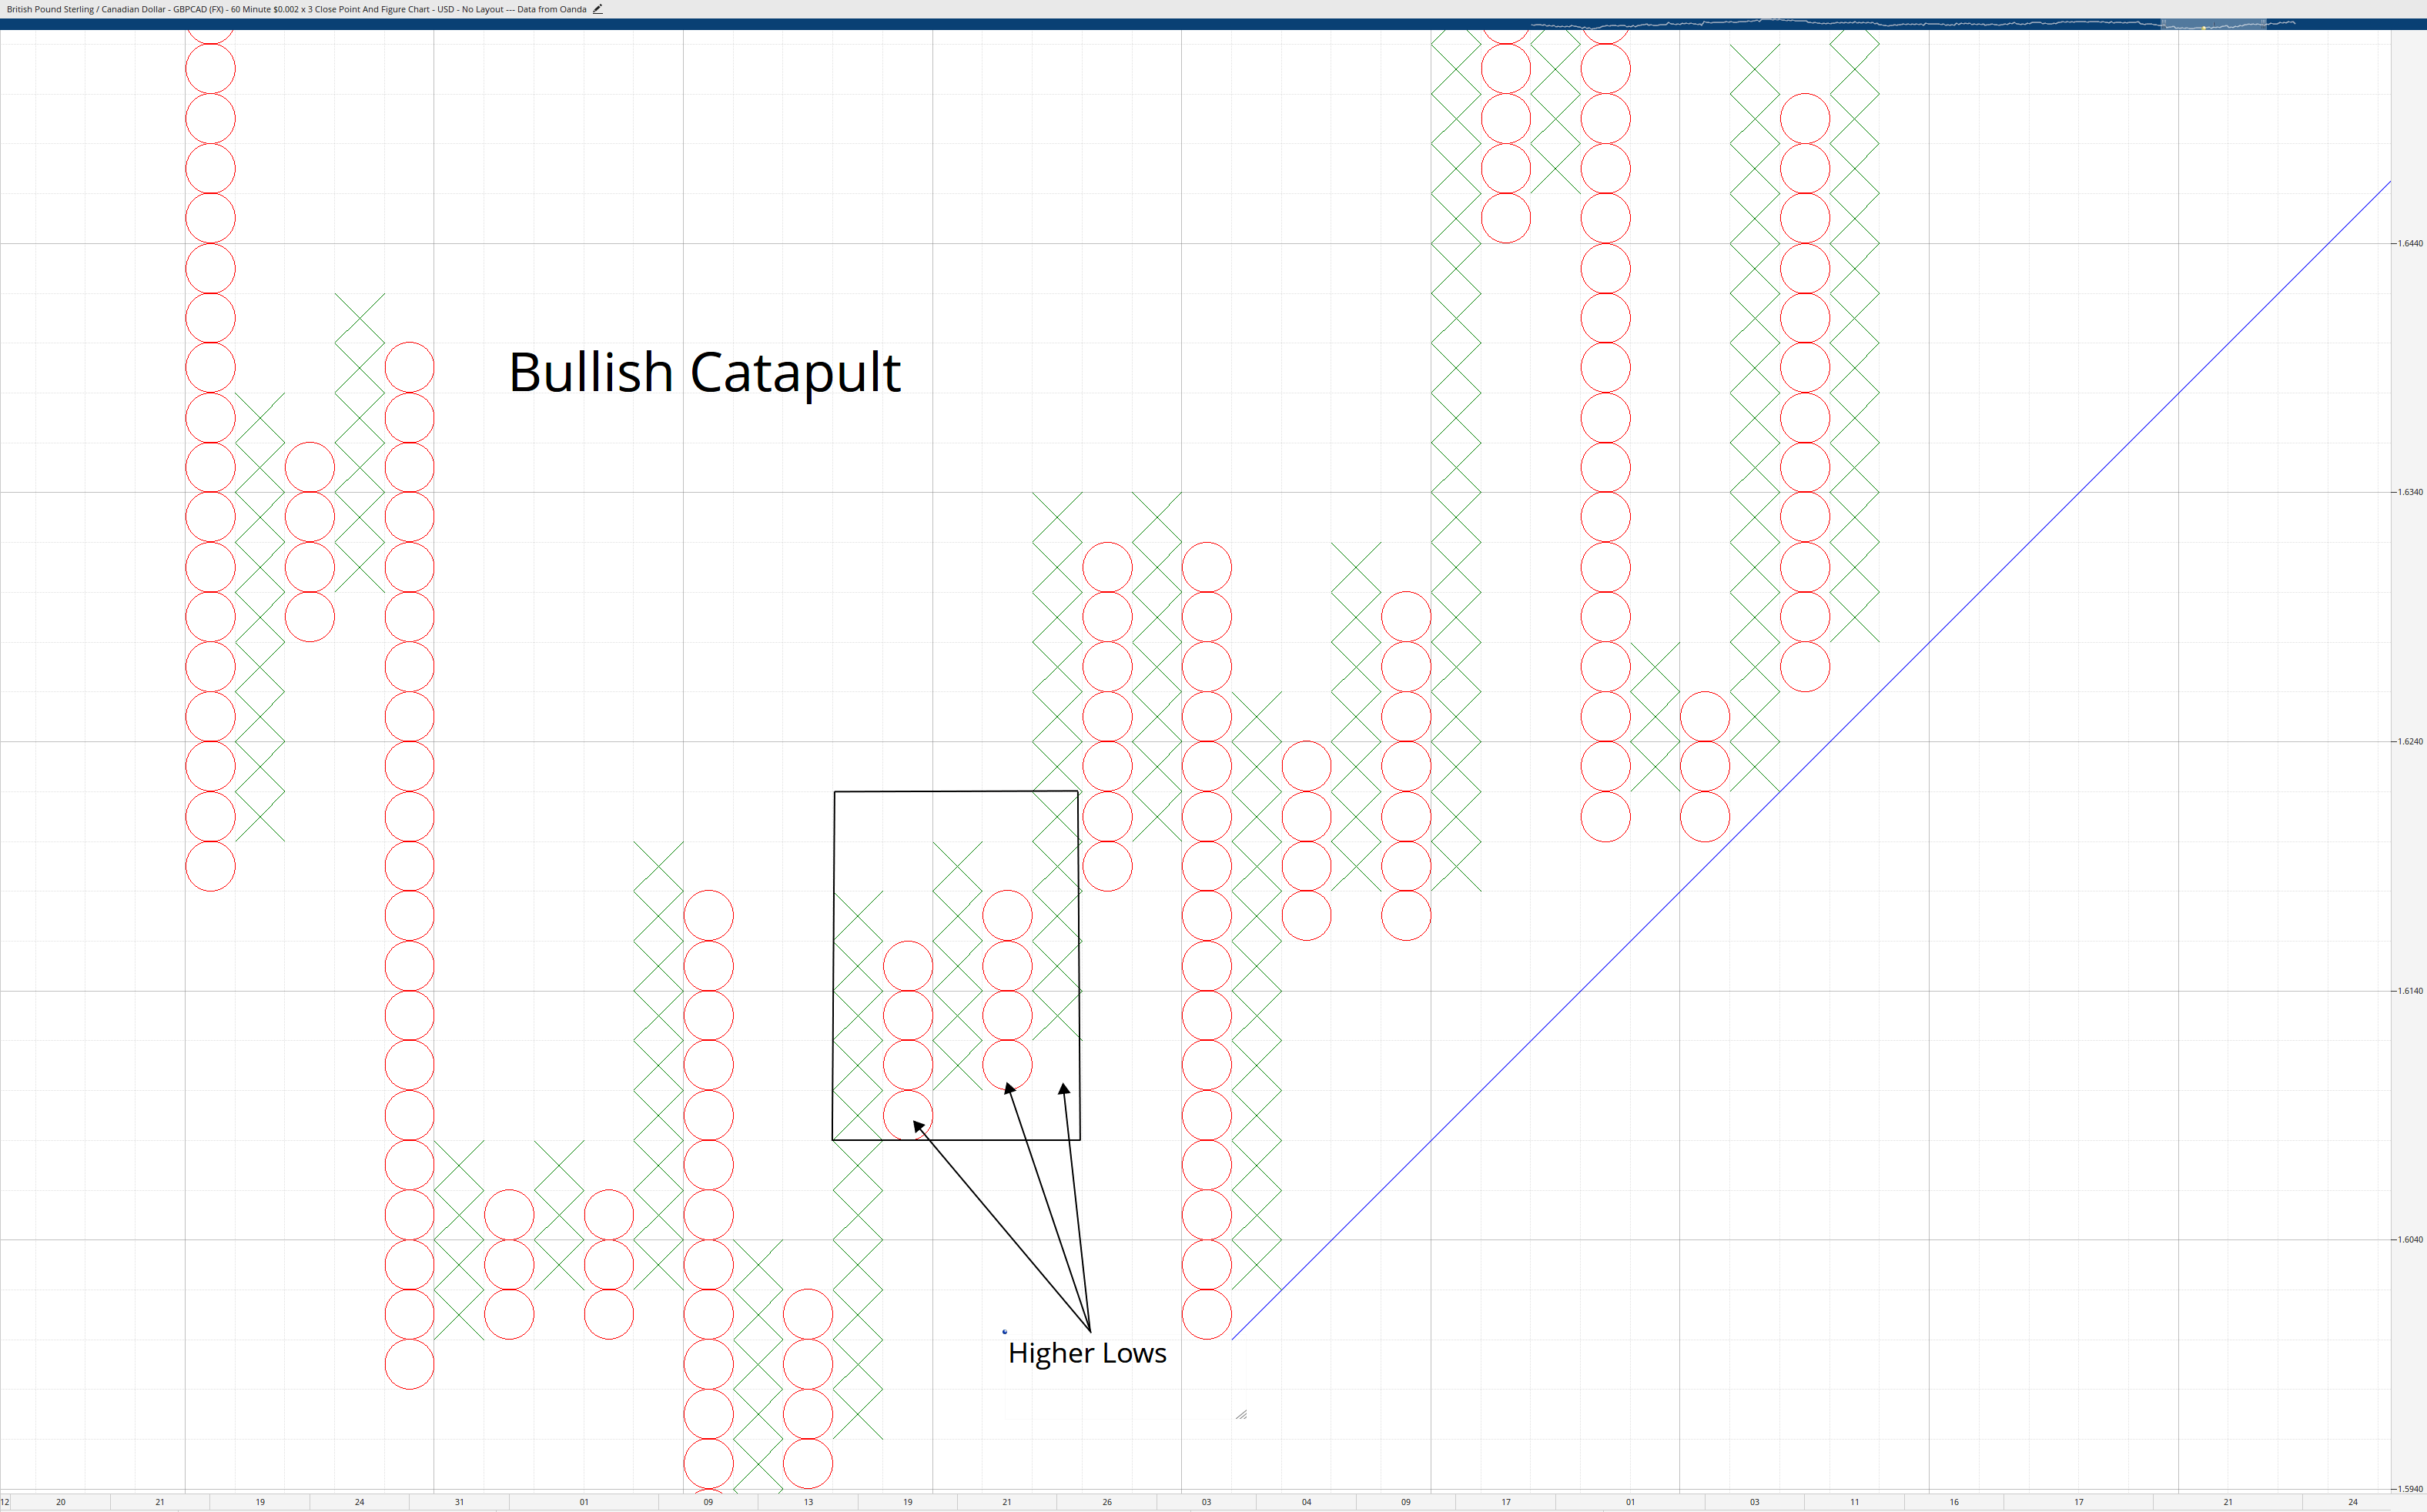
Catapults can be a somewhat confusing pattern, but they are compelling. The Catapult Pattern was one of the few patterns in Technical Analysis that generate equally positive returns on the short side of equity markets as it did on the long side. The strength of these patterns is related to the psychological component of trading. Catapults generally show up after a trendline break or after multiple top or bottom (at least a triple top/bottom or a split triple top/bottom). Catapults are most often pullback/throwback trades, and that is why they are so powerful.
Spike Patterns
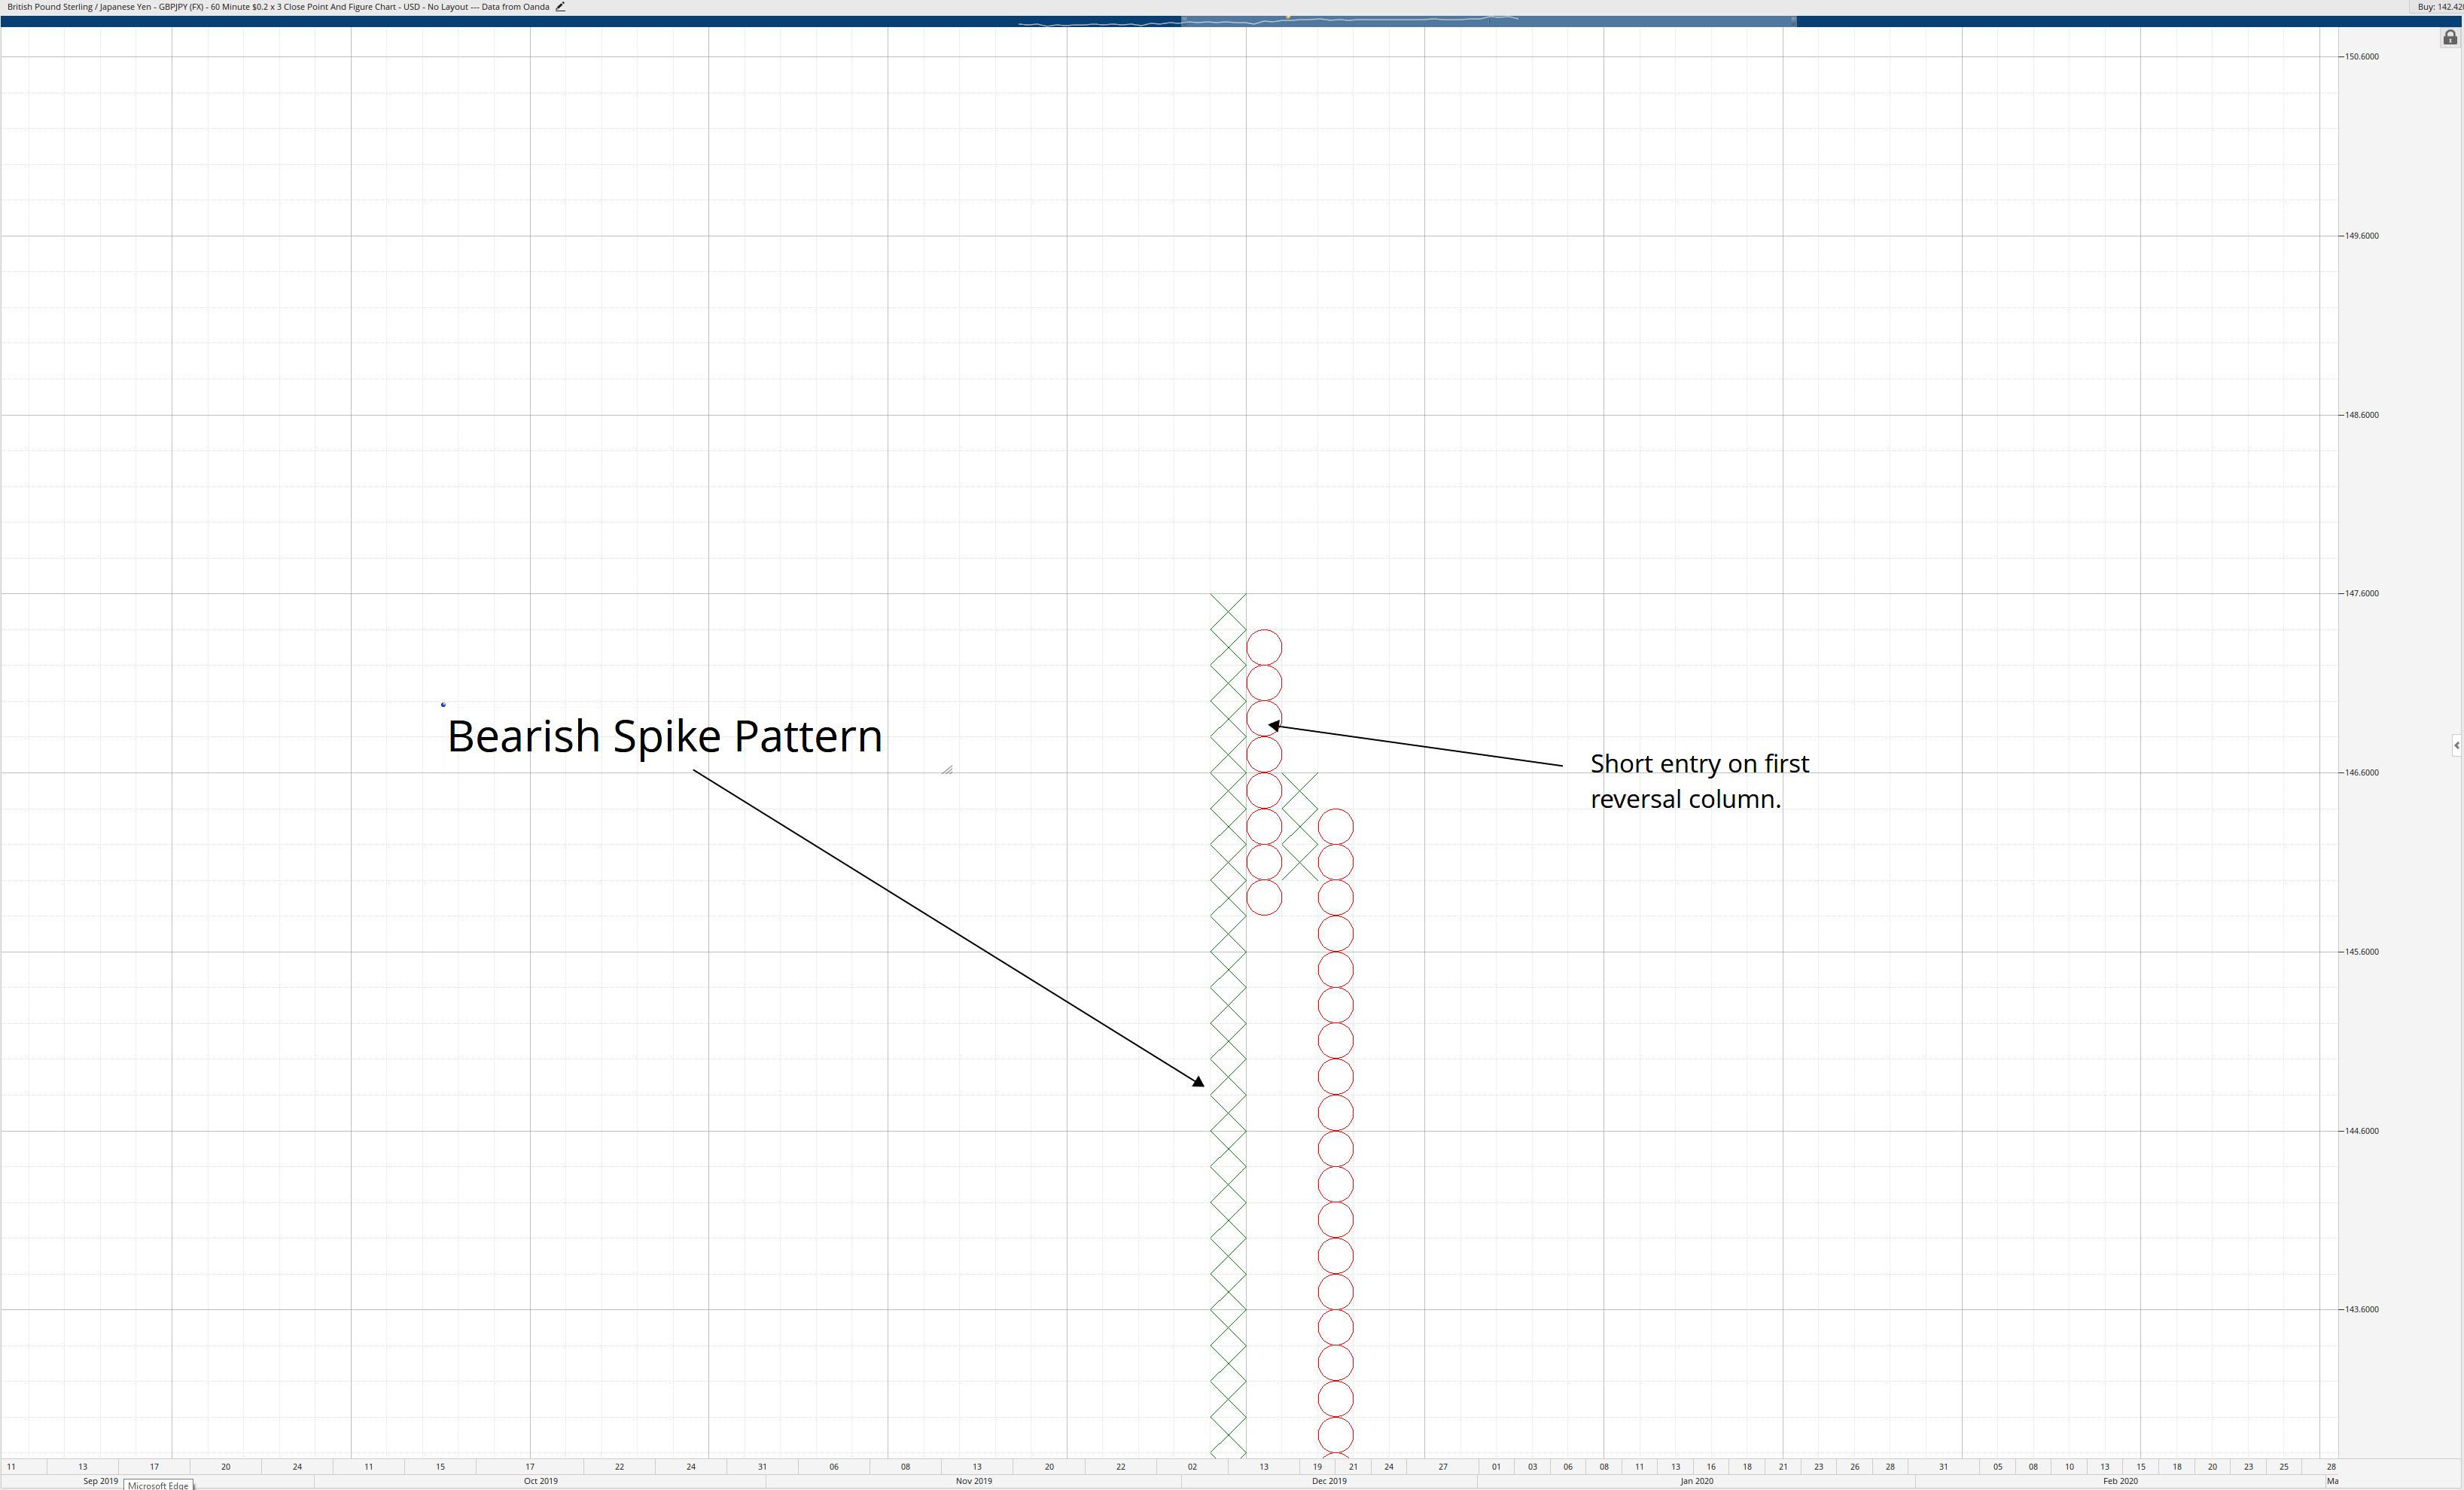
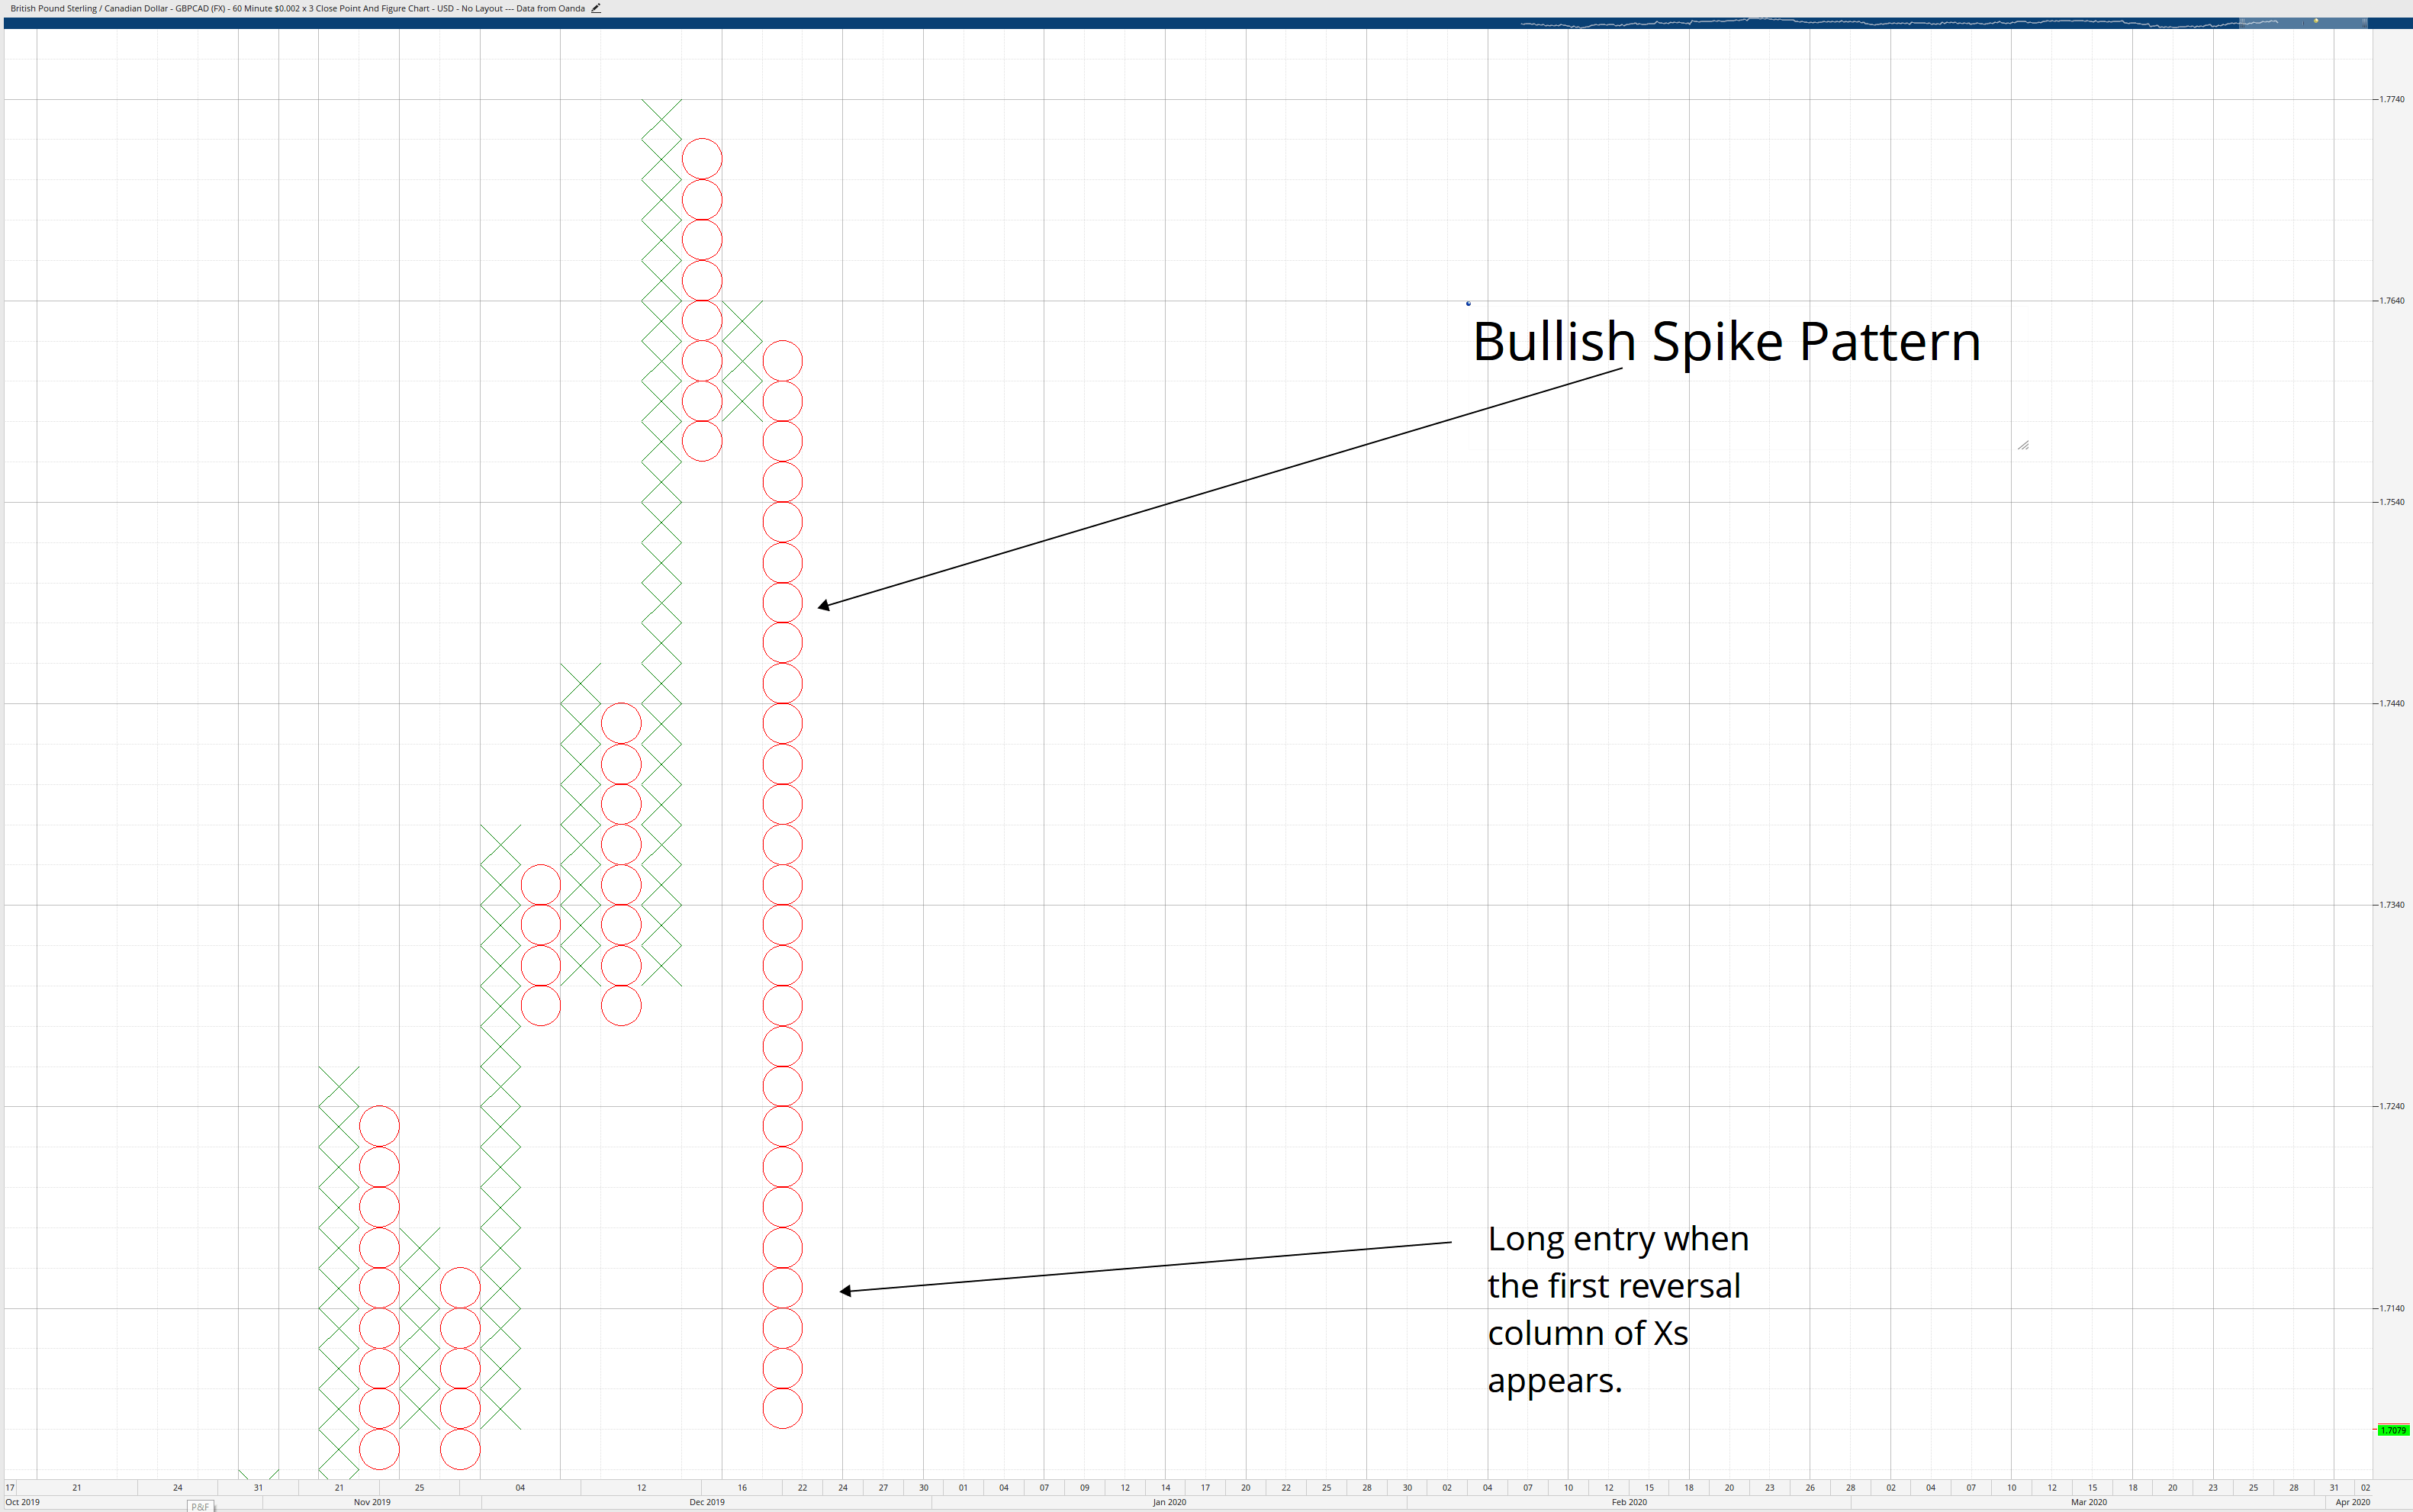
Spike Patterns (along with Pole Patterns) are the only patterns that have a small amount of subjectivity and interpretation. Even Dalquist and Kirkpatrick could not identify consensus from other Point & Figure experts on what constitutes a Spike Pattern. A spike pattern is a massive column that is around 15 to 20 boxes in length. This is my absolute favorite pattern because it has such an enormous reward and minimal risk. This is also only one of two patterns (the other being the Pole Pattern), where the entry does not require a multiple top or bottom. Spike patterns are entered immediately on the reversal column.
Pole Patterns
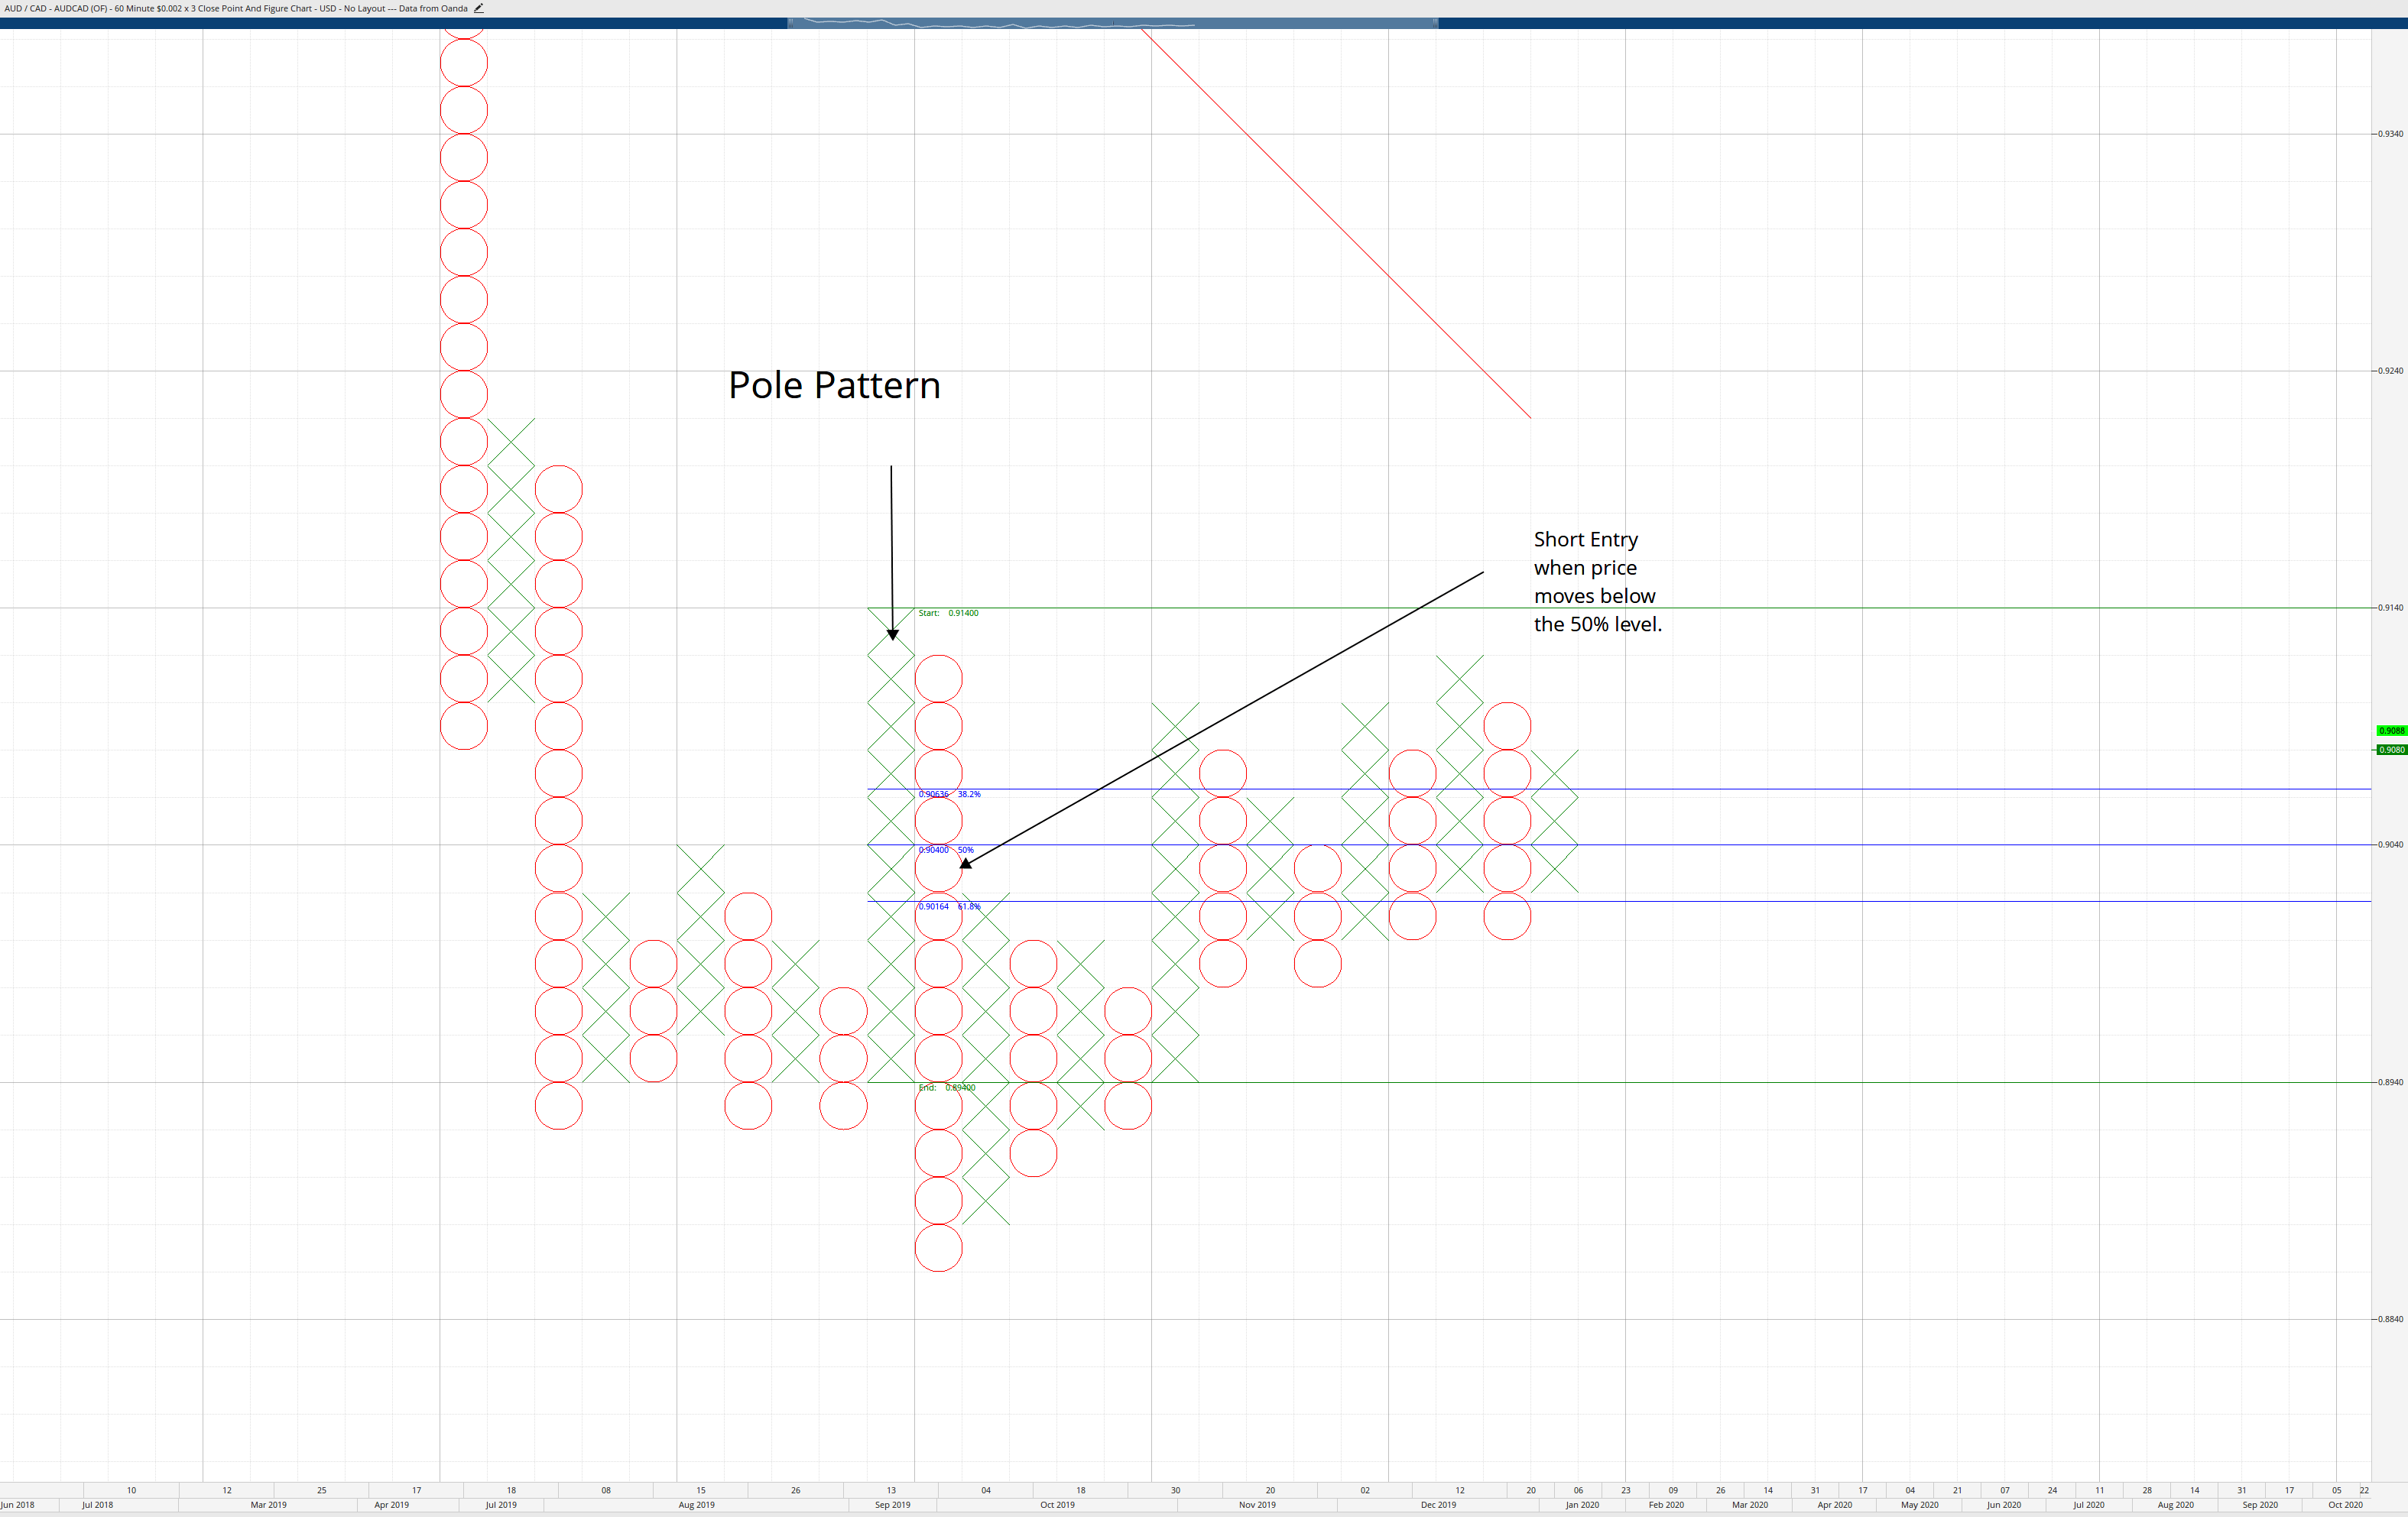
Pole patterns are hands down the most subjective pattern in Point & Figure. The problems with identifying with what qualifies as a Pole comes down to broad interpretation. A Pole is very much like a Spike Pattern in that it’s a substantial column, but it is smaller than a Spike. Poles are any column that is less than sixteen boxes but also more significant than ‘normal’ size columns. One of the identifying factors of a Pole Pattern is the same as a Spike Pattern: they show up at the end of swings. Trading a Pole Pattern is relatively simple. All we do is measure the length of the Pole with a Fibonacci retracement tool (doesn’t matter where you start) and then enter long or short when price moves beyond the 50% level.
Sources:
Dorsey, T. J. (2013). Point and figure charting: the essential application for forecasting and tracking market prices (4th ed.). Hoboken, NJ: John Wiley & Sons.
Kirkpatrick II, C. D., & Dahlquist, J.R. (2016). Technical Analysis: The Complete Resource for Financial Market Technicians (Third). Old Tappan, NJ: Pearson.
Plessis, J.J. (2012). Definitive Guide to Point and Figure – a comprehensive guide to the theory (2nd ed.). Great Britain: Harriman House Publishing.
DeVilliers, V., & Taylor, O. (2008). Point and figure charting. London: Financial Times/Prentice Hall.