Categories
Forex Daily Topic Forex Price-Action Strategies

Price Action Trading: An Important Thing to be Remembered

To draw Support/Resistance, price action traders are to be sensible. They often need to be adjusted. In today’s lesson, we are going to demonstrate an example of this. To spot out support/resistance, traders are to aim the zones. Then, in the end, they are to draw levels to have the confirmation of a breakout. Let us learn more about this from the examples below.

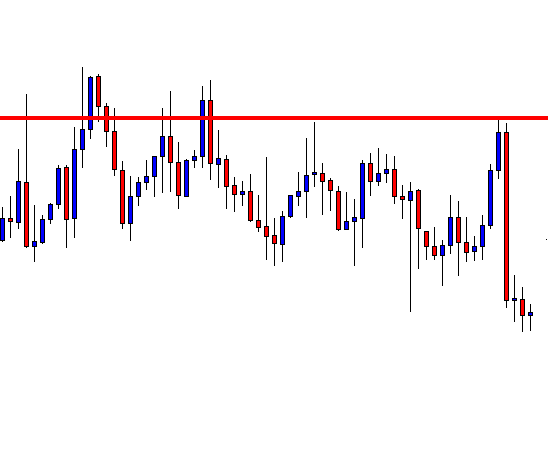
This is an H1 chart. The chart shows that the price has been choppy for quite a while. It has been roaming within a descending triangle. The price may make a breakout to either side. Let us work with horizontal support and spot out point/points where the price bounces twice.

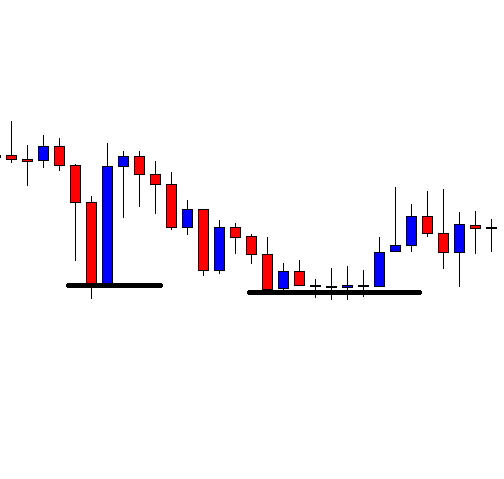
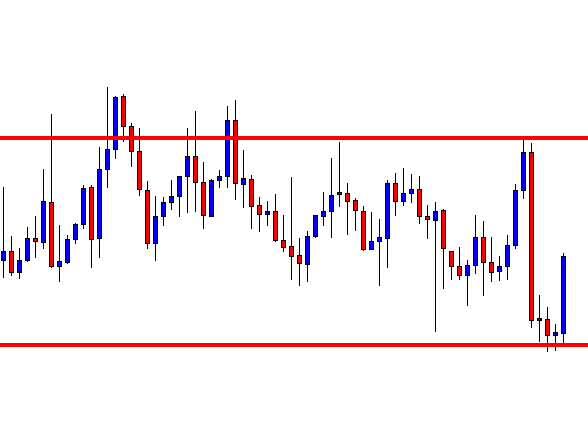
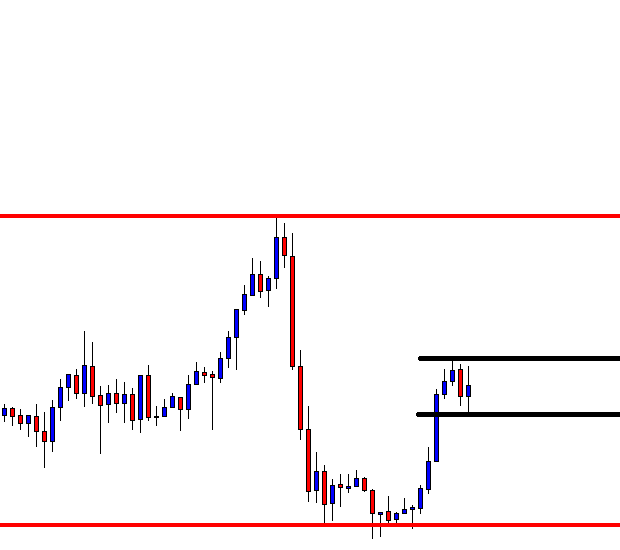
We may spot out two points here. These two levels are nearby to each other. Without any doubt, this is a strong support zone. If we consider levels, we may get confused since we get two levels. In such a situation, we may closely observe what the price does around the last swing low. Let us proceed to the next chart.

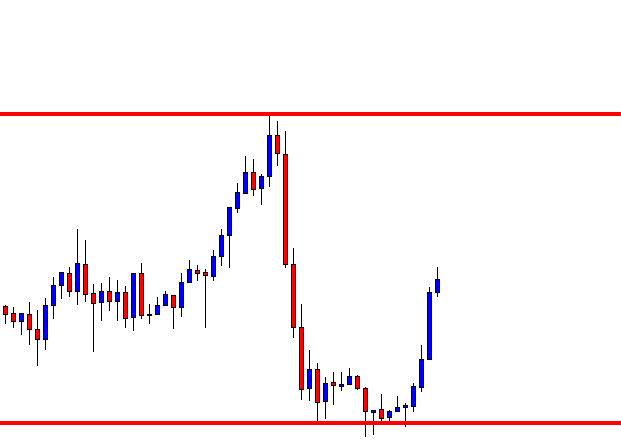
The chart shows that the last candle breaches the level of support (the last swing low). This is not an explicit breakout. We must wait for the next candle to have the breakout confirmation.

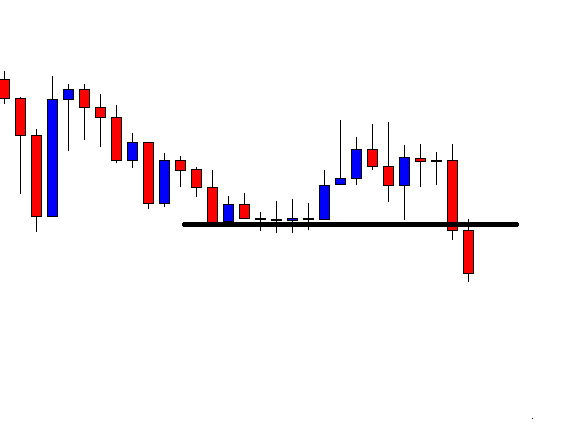
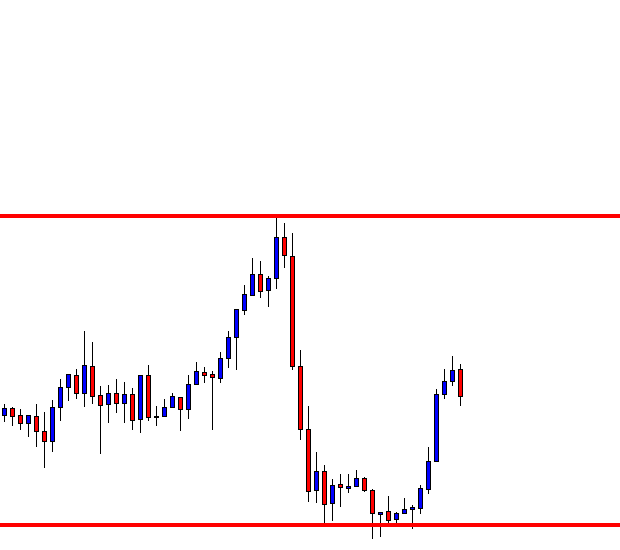
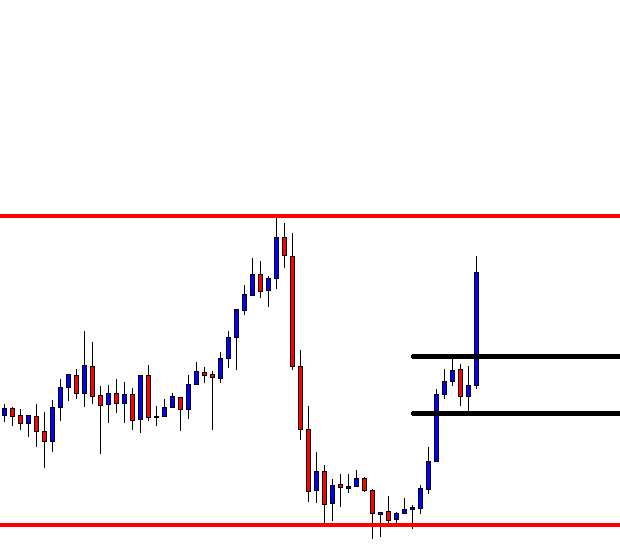
The next candle comes out as a bearish candle as well as closing well below the breakout candle. If we consider the price action for the last two candles, it is clear that the sellers have taken the control. The level of support at the last swing low holds the key as far as the last two candles’ price action is concerned. The H1 breakout strategy sellers may trigger a short entry right after the candle closes. Let us proceed to the next chart what the price does after triggering the entry.

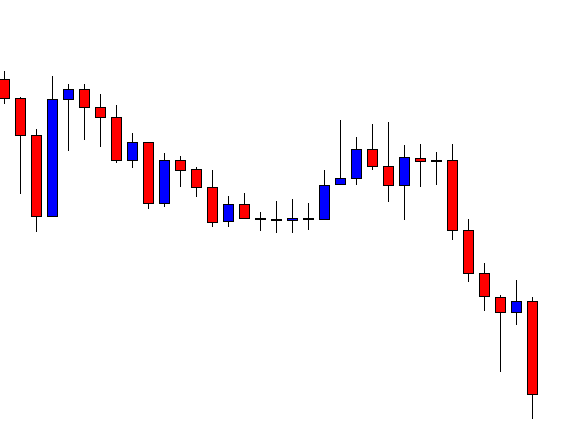
The price heads towards the South with good bearish momentum. The sellers achieve their 1R with ease. The last candle’s attributes suggest that the price may go towards the South further. In a word, this has been a prolific trade setup for the sellers.

If we consider the first swing low on this chart, we may get confused about the breakout. Considering the price action and the last swing low, it is a basic thing to understand that the price makes a breakout at the last swing low. The last swing low matters most as far as the breakout strategy is concerned. If the price consolidates after a breakout, then other levels (previous levels of support/resistance) may work as flipped support or resistance. This is one important thing to be remembered by the price action traders.

Categories
Forex Price-Action Strategies

H4-H1 Combination – An Opportunity Missed Just for an Inch

The H4-H1 is an action-packed combination. By drawing support/resistance on the and upon getting a reversal candle on the H4 chart, an entry is triggered considering H1 price action. However, things do not always go according to our expectations. In today’s lesson, we are going to demonstrate an example of an H4-H1 combination and find out whether it offers us entry or not. Let us get started.

This is the H4 chart. The chart shows that the price after having a rejection at a strong resistance zone heads towards the downside with extreme bearish pressure. The support zone is strong too. The last three candles are bearish, but they suggest that selling pressure may have decreased off a little. The last candle is a Spinning Top.

The combination of the last three candles ends up producing a Morning Star. This is one of the strongest bullish reversal candle combinations. The buyers are to flip over to the H1 chart for consolidation and H1 breakout candle to go long on the pair. Let us flip over to the H1 chart.

This is how the H1 chart looks. The chart produces several bullish candles consecutively, which suggests that it is the buyers’ territory. The resistance level is far enough to offer a lucrative risk-reward to the buyers as well.

Here it comes. The first candle for consolidation comes out as a bearish engulfing candle. Let us find out whether the price finds its support nearby or it heads towards the downside further.

It seems that the price may have found its support. It produces a Spinning Top again. If a bullish engulfing candle breaches the level of resistance, it will be an A+ buying signal. If another bullish candle breaches the level from where the last candle closes, it will be a good buying signal as well but may have relatively less buying pressure than the engulfing one. In both cases, the buyers are to calculate that the signal candle does not go too far up. Let us find out what happens next.

A very good-looking bullish Marubozu candle breaches the resistance. The buyers may want to trigger a long entry right after the candle closes. Would you trigger a long entry here? I let you think for a minute.

If yes, then you might have missed the line “In both cases, the buyers are to calculate that the signal candle does not go too far up.” It does, and it leaves only a little space for the price to travel towards the resistance. The risk-reward is not lucrative here at all.

An entry where almost everything looks perfect, we may still skip taking that for not fulfilling just one condition. It may frustrate us to some extent, but we have to deal with it professionally.