The analysis and forecast process of any financial asset can support the decision process to take any positioning on the market. However, the time dedicated to developing it could increase the cost of the trade as this grows on time. In this educational article, we will review how to analyze and make a forecast by applying the main concepts of the Elliott Wave Principle.
The Elliott Wave Principle in a Nutshell
R.N. Elliott, in his work The Wave Principle, identified a nature’s law that governs everything, from nature to human socio-economic activities. Elliott comments that the financial markets are the most important socio-economic activity, so, when someone understands that law, he can get forecasts about the phenomena under study, the financial markets, in this case.
In this context, Elliott described that price moves in two types of movements impulses and corrections, and at the same time, the price tends to repeat some specific structures and sequences.
On the one hand, impulsive movements create trends and follow a sequence of five waves. On impulses, three waves move in the direction of the primary trend and two in the opposite direction.
On the other hand, a corrective movement consists of three waves; two of them will be in the opposite move to the main trend.
This eight-waves movement creates a cycle, and when it is complete, a new cycle of the same degree will start. In other words, when a five-waves and three-waves movement is complete, a new cycle of the same extension will take place.
Elliott gave intensive importance to corrections and told us the position of the market and the outlook. Elliott’s experience drove him to identify four main types of corrections as zigzag, flat, irregular, and triangles.
Making Simplifications
In the two latest articles, we discussed how we could simplify corrective patterns in the wave analysis using some chartist patterns as flags and triangles. Also, we commented on how it can help us in our study, reducing the time elapsed to develop a forecast and, finally, a trading plan.
The Analysis Process
The basic methodology to carry on the market analysis is to analyze from a higher to lesser time frame. In other words, we can start the study from a monthly range and finish in the hourly chart. Once we have identified the market structure, we begin to define scenarios that have a probability of occurrence. The scenarios are relevant to the analysis process because, using them, we can evaluate all possible price paths and decide which one of them is the most probable.
The Heating Oil Triangle
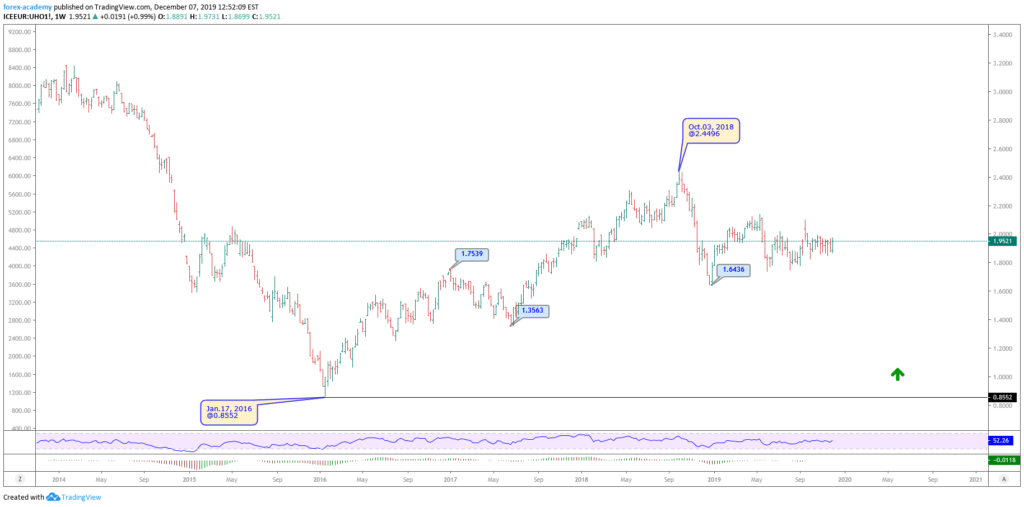
The following chart corresponds to Heating Oil in its weekly timeframe. In the figure, we observe the bullish sequence developed in three waves, which began on January 17, 2016, at $0.8552 per gallon. The energy commodity reached its highest level on October 03, 2018, at $2.4496 per gallon.

Once Heating Oil reached its high at $2.4496, the price started to make a bearish move, that found support at $1.6436 per gallon on January 02, 2019.
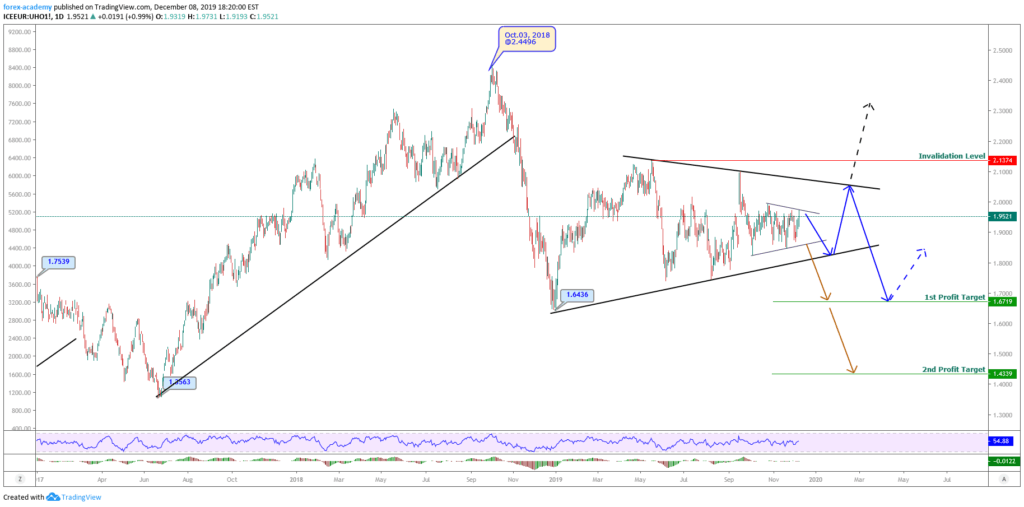
After that descent, the asset found buyers at $1.6436, Heating Oil’s traders started doing market swings. We can observe this as a triangle structure, as shown in the next daily chart.

According to the Elliott Wave Theory, we know that a triangle structure has five internal segments which follow a 3-3-3-3-3 sequence. However, there is the possibility that the triangle pattern does not build a fifth inner leg.
Now, let us identify some scenarios for the next path on Heating Oil.
- Scenario 1:The price moves down and crosses the base-line of the triangle (dark orange arrow), with a first potential profit target at $1.6719, and a second target at $1.4339 per gallon.
- Scenario 2 (blue arrow) considers that Heating Oil drops and, then, bounces off from the base-line, but does not surpass the previous high at $2.0994. From there, the price action begins a new bearish wave that would drive the energy commodity to $1.6719 per gallon.
- Scenario 3 (black arrow), considers that the price overcomes the resistance determined by the upper-line of the triangle and the invalidation level at $2.1374.
Conclusion
As we discussed in this article, the time dedicated to analyze and forecast a financial market is a valuable resource that could increase or reduce the hidden cost of the potential trade. As occurs in mathematical models, valid simplifications can help the analyst to reduce the time to a decision process.
Flags and triangles are simple and basic formations that can ease the market study.
Finally, the formulation of different scenarios provides a wide range of options about the next potential paths of the price action. Also, these scenarios create different answers facing the question of what if the market does that?

