After our last articles on candlestick reversal patterns, test your knowledge.
If you need to give a second read, these are the links:
Let’s begin
[wp_quiz id=”59882″]
Reference:
The Candlestick Course: Steve Nison
After our last articles on candlestick reversal patterns, test your kowledge.
After our last articles on candlestick reversal patterns, test your kowledge.
After our last articles on candlestick reversal patterns, test your knowledge.
If you need to give a second read, these are the links:
[wp_quiz id=”59882″]
Reference:
The Candlestick Course: Steve Nison
Introduction
Introduction
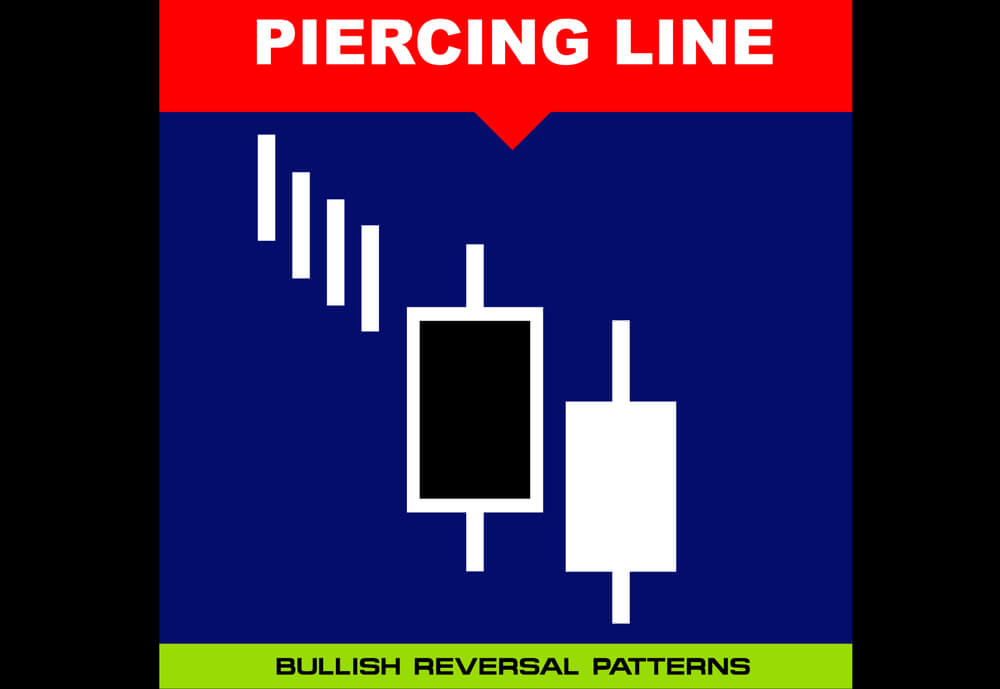
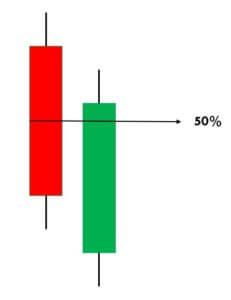
The Piercing Line is a simple and effective candlestick pattern, and it is used to trade the bullish reversals in the market. This pattern typically appears in a downtrend. Also, when it appears in a significant support area, we can consider it more reliable. Piercing Line is a two candlestick pattern where the sellers influence the first candle, and the second candle is responded by enthusiastic buyers. Piercing Line essentially indicates the bears losing control, and bulls taking over the market.
This indicates that buyers now overwhelmed the sellers. In terms of supply-demand, this pattern shows that the supply is depleted somewhere, and the demand for buying has increased. Remember not to trade this pattern alone. Always use it in conjunction with some credible indicators or other trading tools to further enhance the probability of winning.
In this strategy, we have paired the Piercing Line pattern with the Percentage Price Oscillator to generate credible trading signals. The Percentage Price Oscillator is a momentum indicator. It consists of a centerline, histogram, and the two moving averages. Just like the MACD indicator, the PPO also represents the convergence and divergence in price action. This indicator gives a crossover at the overbought and oversold market conditions.
When price action crosses the centerline, it means that the bullish or bearish momentum is super strong. We want to let you know that PPO is not that popular in the industry. Also, it is not available in the MT4 terminal. However, you can download this indicator from this link and add it to your MT4 terminal. If you are a Tradingview user, search the PPO indicator in the indicators tab, and you should be able to find it.
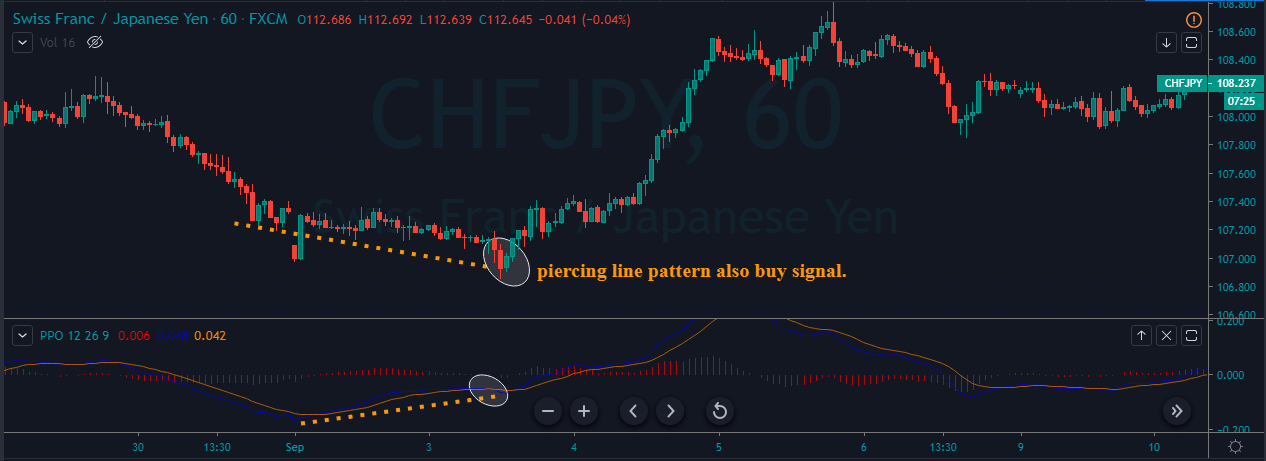
Step 1 – Find out the Piercing Line pattern in a downtrend.
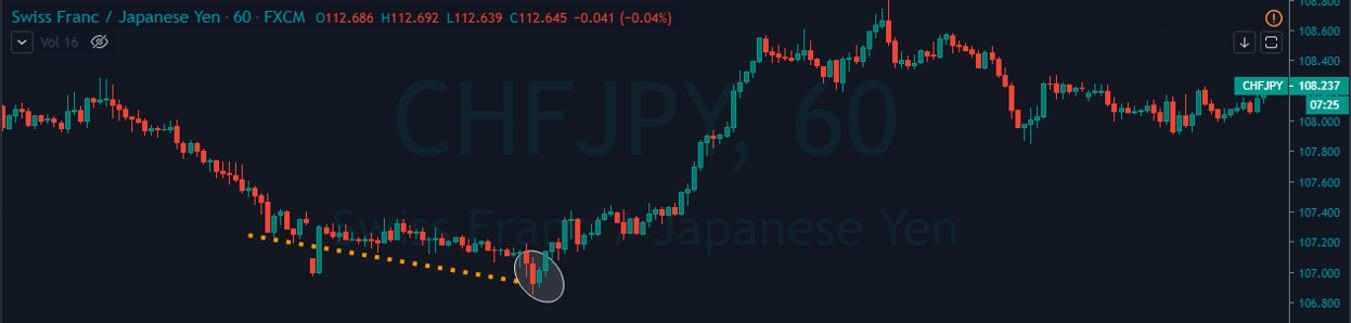
Step 2 – Once you find the Piercing Line pattern, the next step is to wait for the reversal to happen on the PPO indicator at the oversold market conditions.
In the below CHFJPY chart, the market was in an overall downtrend. We can see the market printing Piercing Line pattern, and that is an indication of a trend reversal. We can also see the PPO indicator giving crossover in the overbought area at the same time. Both of these clues indicate a clear buy signal in this pair. We can also see the price action showing divergence, which is another clue to go long. If we are able to find all of these clues on a single price chart, we shouldn’t mind placing bigger trades.
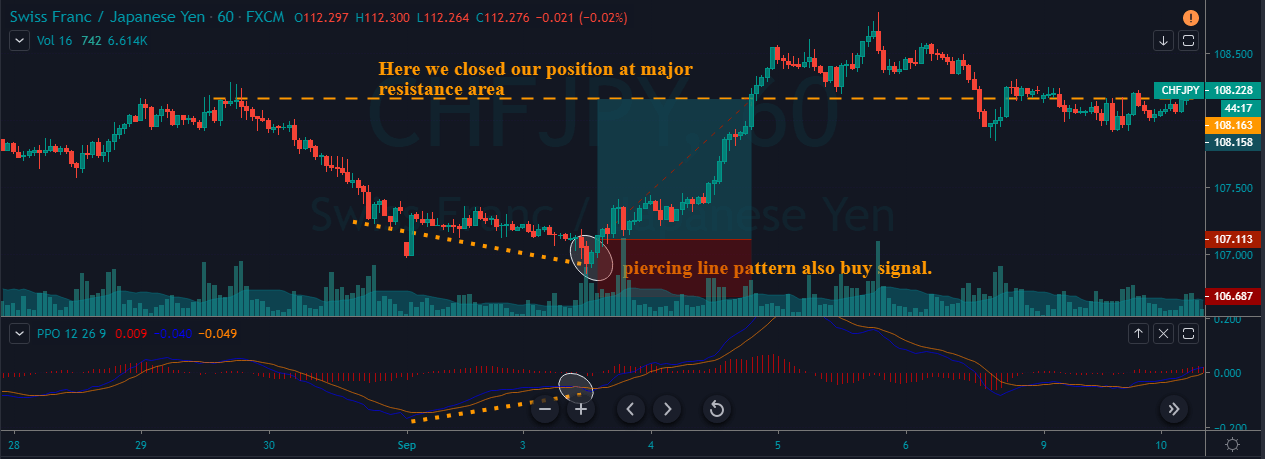
Step 3 – Stop-loss and Take Profit
PPO indicator quite often gives high probability trading signals. So when we take trades of that kind, most of the time, we must place the stop loss just below the first candle of the Piercing Line indicator.
There are several ways to book profits. For this particular strategy, we can close our position when the PPO reversed at the overbought area or when the market starts printing the opposite pattern. If you plan to make more money in a single trade with extra risk, it is advisable to book the profit at the higher timeframe’s major resistance area.
In the below chart, we can see that we have closed our whole position at the major resistance area and the stop-loss order was just below the recent low.
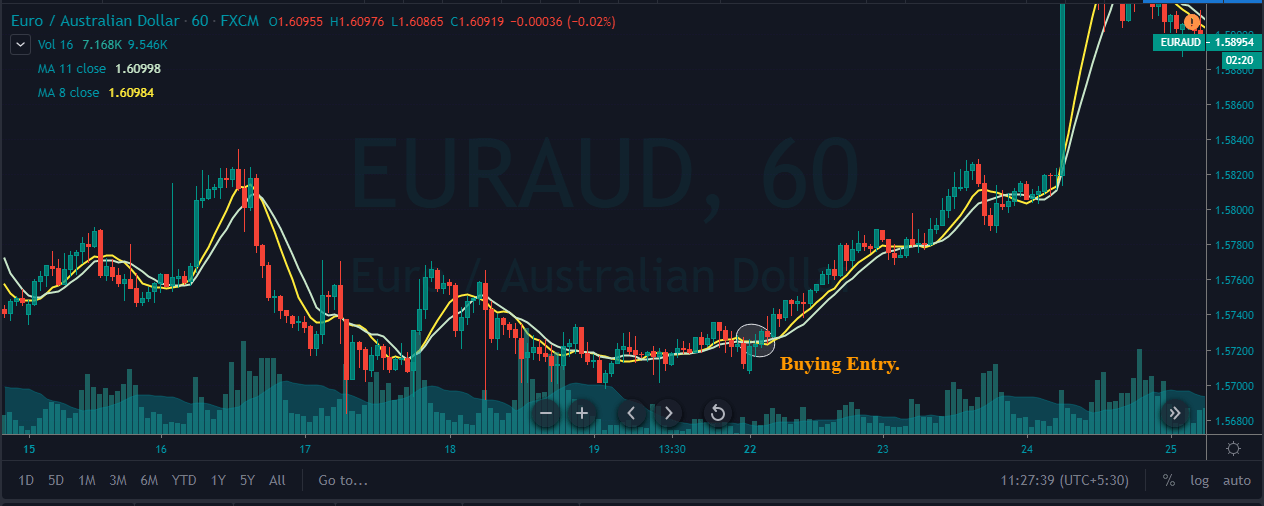
In this strategy, we have paired the Piercing Line pattern with the Double Moving Average. Moving Average is a very well-known indicator in the industry. Many average indicators are available in the market. If you are using the lower period average, expect more trading signals. Contrarily, if you are using the higher period average, expect fewer but accurate signals.
Step 1 – First of all, find out the Piercing Line pattern in a downtrend.
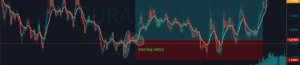
Step 2 – Activate the buy trade when the lower period MA crosses the higher period MA. In the below EURAUD Forex chart, the price action was in a downtrend, and around the 22nd of December, the market prints the Piercing Line pattern. This means that the sellers now have a hard time to go lower, and buyers took over the market. Furthermore, when a lower period moving average crosses the higher period moving average, it is a clear indication to go long. After our entry, price action immediately prints a brand new higher high.
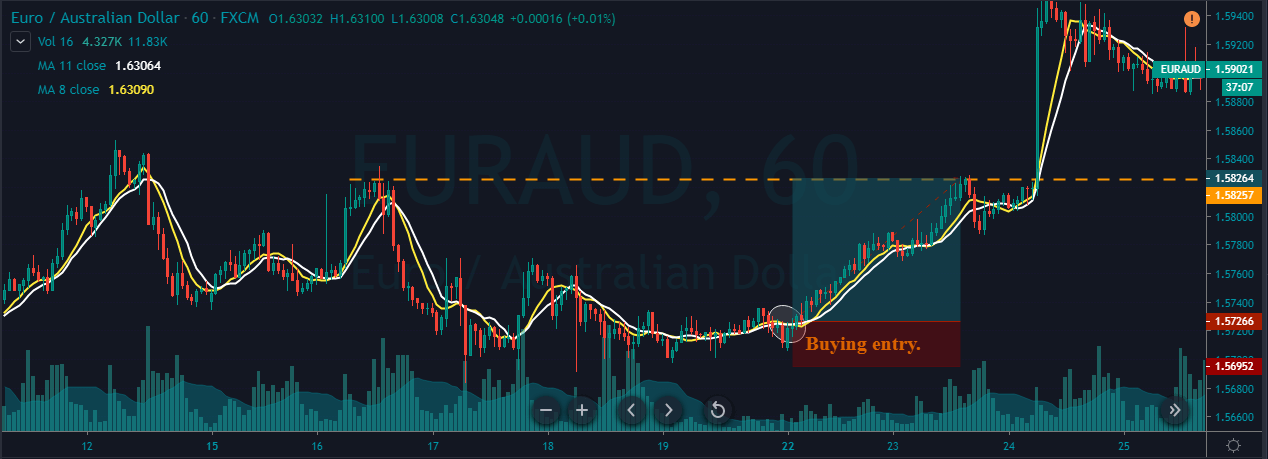
Step3 – Stop-loss and Take Profit
If you are an aggressive trader, use the recent low for stop loss. But if you are a conservative trader, make sure to place wider stop losses. If you plan to ride the longer moves, wait for the price action to hit the daily support area. But if you plan to go for intraday trades only, we suggest you exit your position when the double MA gives the opposite signal.
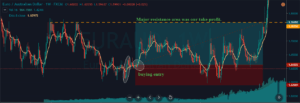
In the below chart, we can see that we have closed our full positions at the higher timeframe major resistance area, and stop-loss was just below the recent low. Overall, it was a 3R trade.
Piercing Line pattern is a bottom reversal pattern, and it is one of the very well-known bullish reversal patterns. We can say that this pattern is exactly the opposite of the Dark Cloud Cover pattern. We won’t be able to see this pattern very frequently on the price chart, but when it appears, a trend reversal is guaranteed. Sometimes you will find this pattern in the consolidation phase, but it’s not worth your time to trade it in ranges. So it is always recommended to find this pattern in a clear trending market because that’s where we can generate more effective signals. The only limitation of this pattern is that it requires the use of other technical tools to confirm the signal and cannot be used stand-alone. But that’s the case of most of the candlestick patterns, so that’s not a major limitation.
That’s about the Piercing Line candlestick pattern. Let us know if you have any questions in the comments below. Cheers!
Chart Patterns – Broadening Pattern & The Diamond Pattern

Chart Patterns – Broadening Pattern & The Diamond Pattern
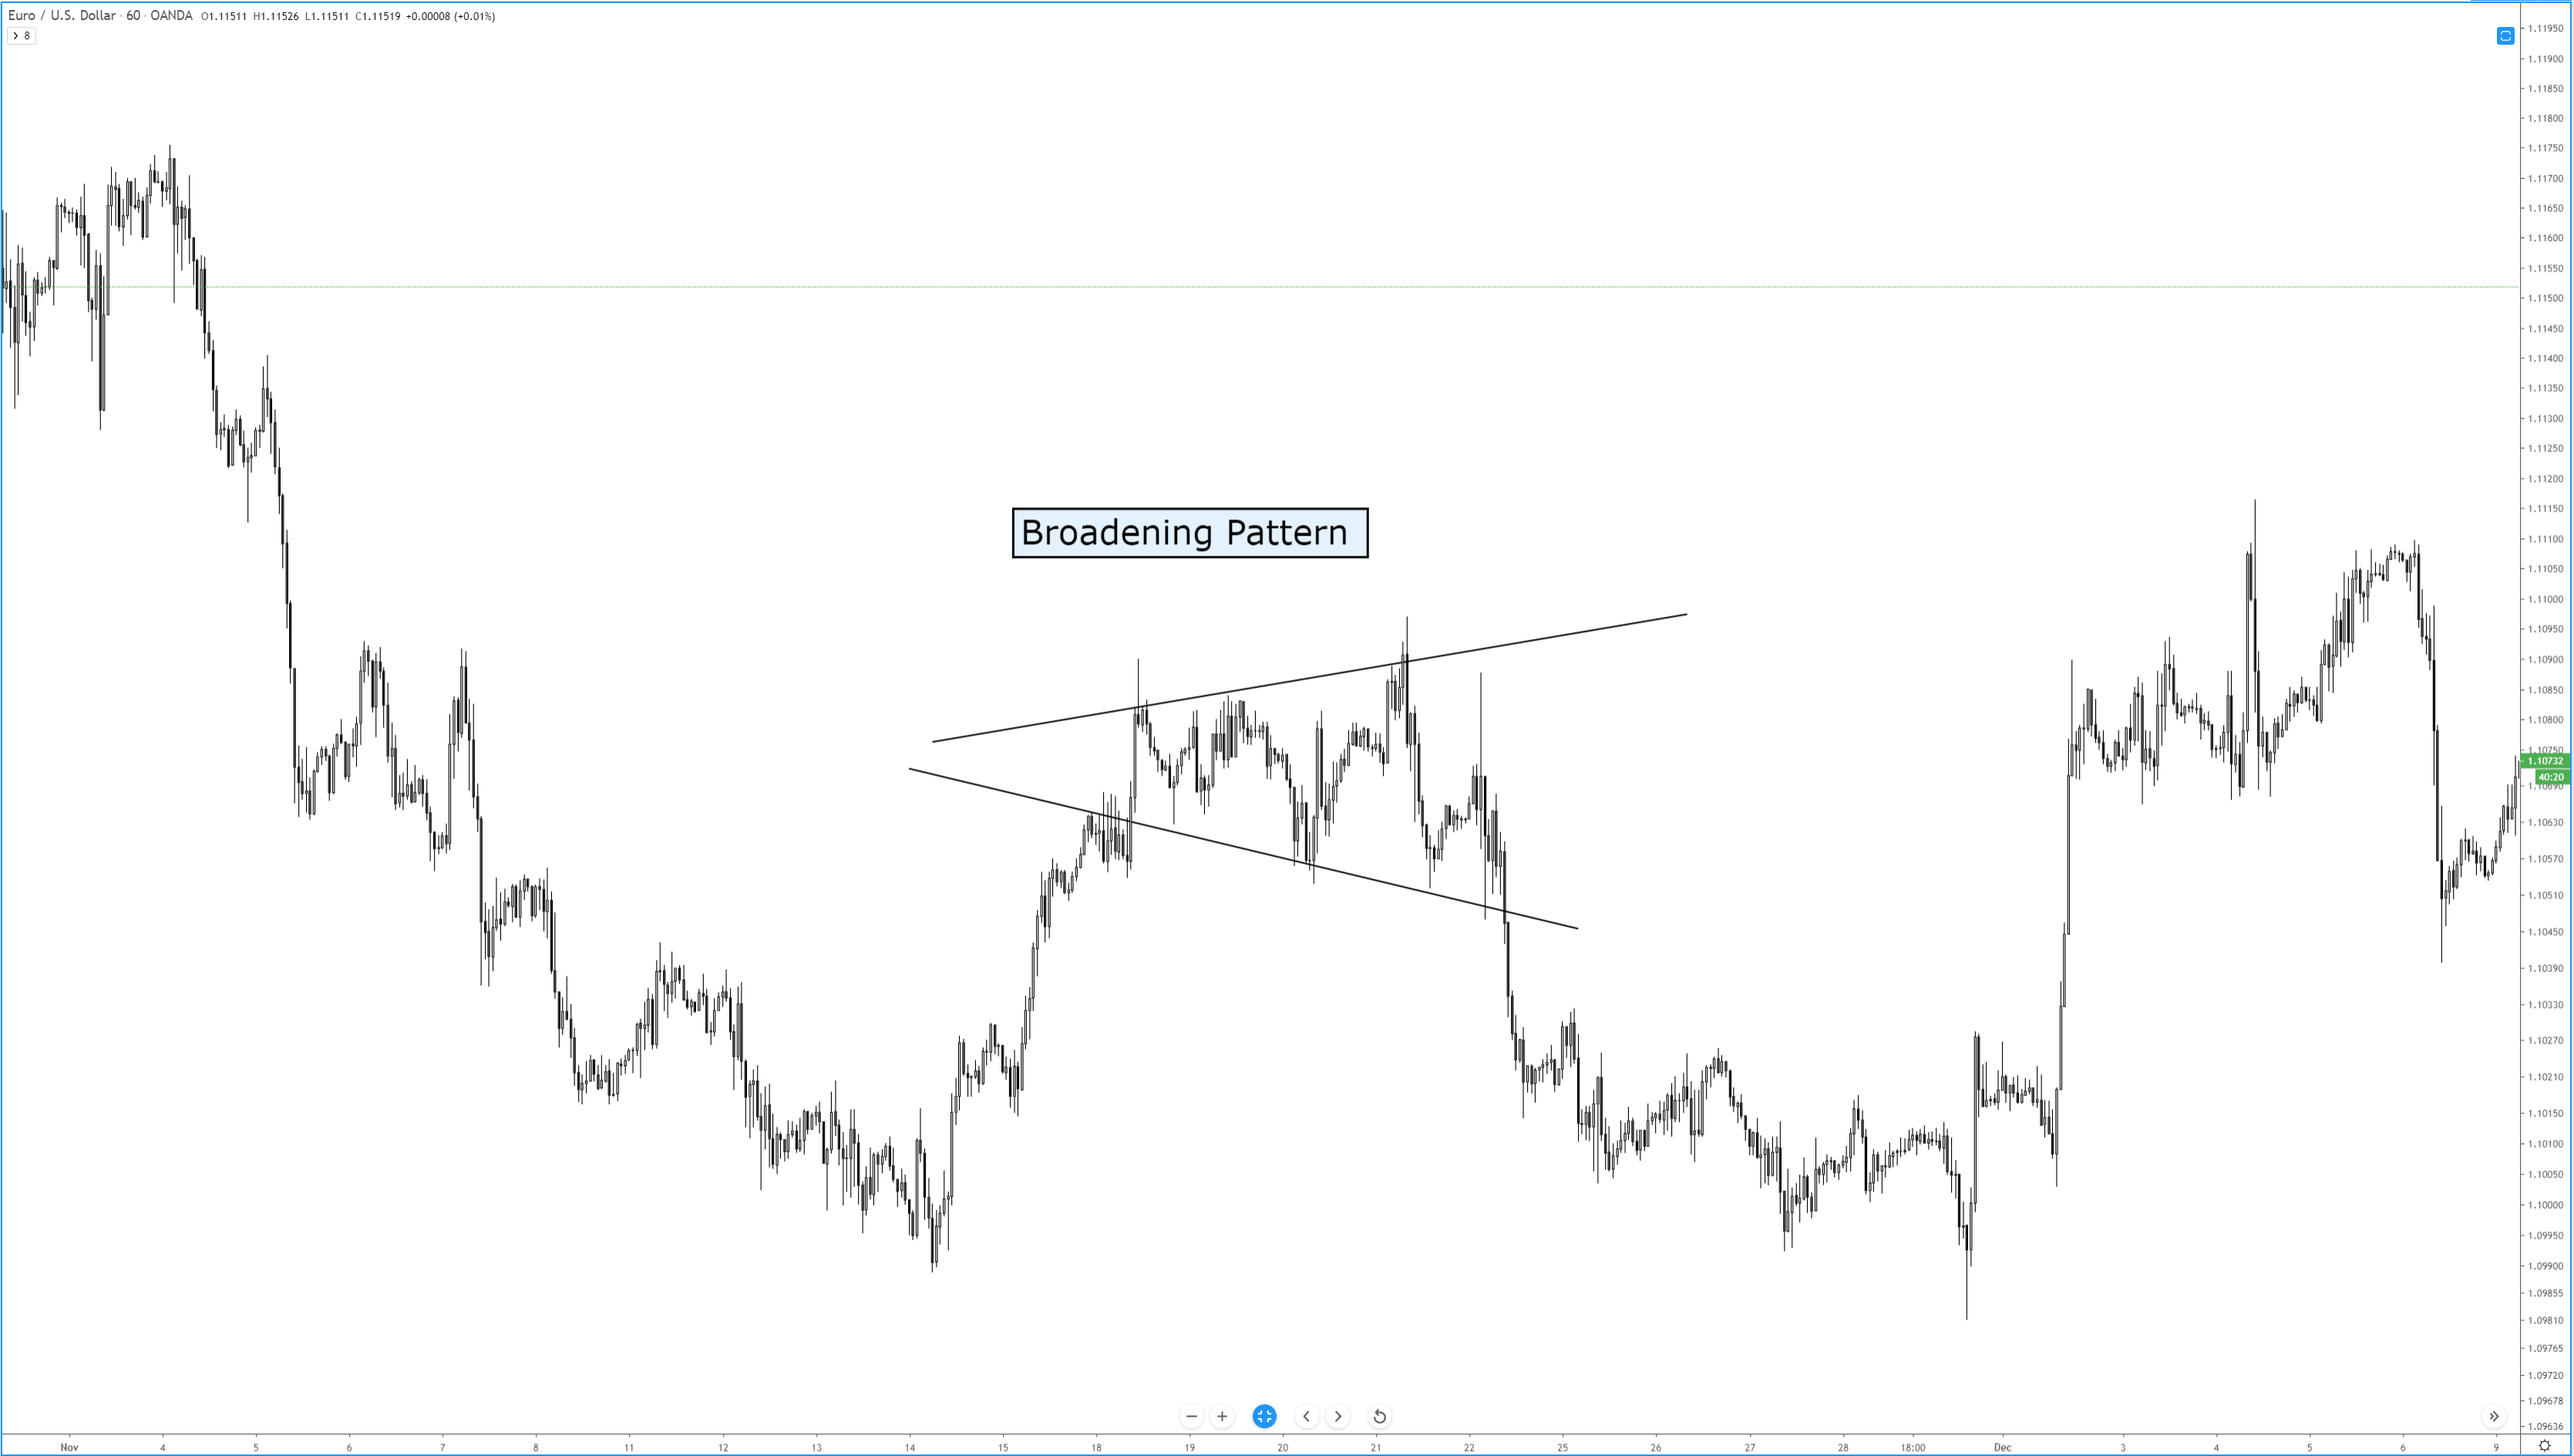
This pattern is also called a funnel or a megaphone pattern. It’s an inverse symmetrical triangle. This pattern is definitely not that common, and it’s a tricky pattern to trade. The behavior of price in a broadening pattern is to increase swing ranges where new higher highs and new lower lows are made. In my opinion, it is best to ignore this pattern. The breakout and retest of the upper or lower trendlines are the prevailing trade strategies utilized for this pattern. Of all the patterns, to trade, this is one of the least profitable. However, I’ve learned that the breakouts are often false, due to the nature of the final swing in the pattern being mostly overbought or oversold. It is not uncommon to see megaphone patterns turn into a triangle pattern – which results in a rare but profitable pattern known as a Diamond.
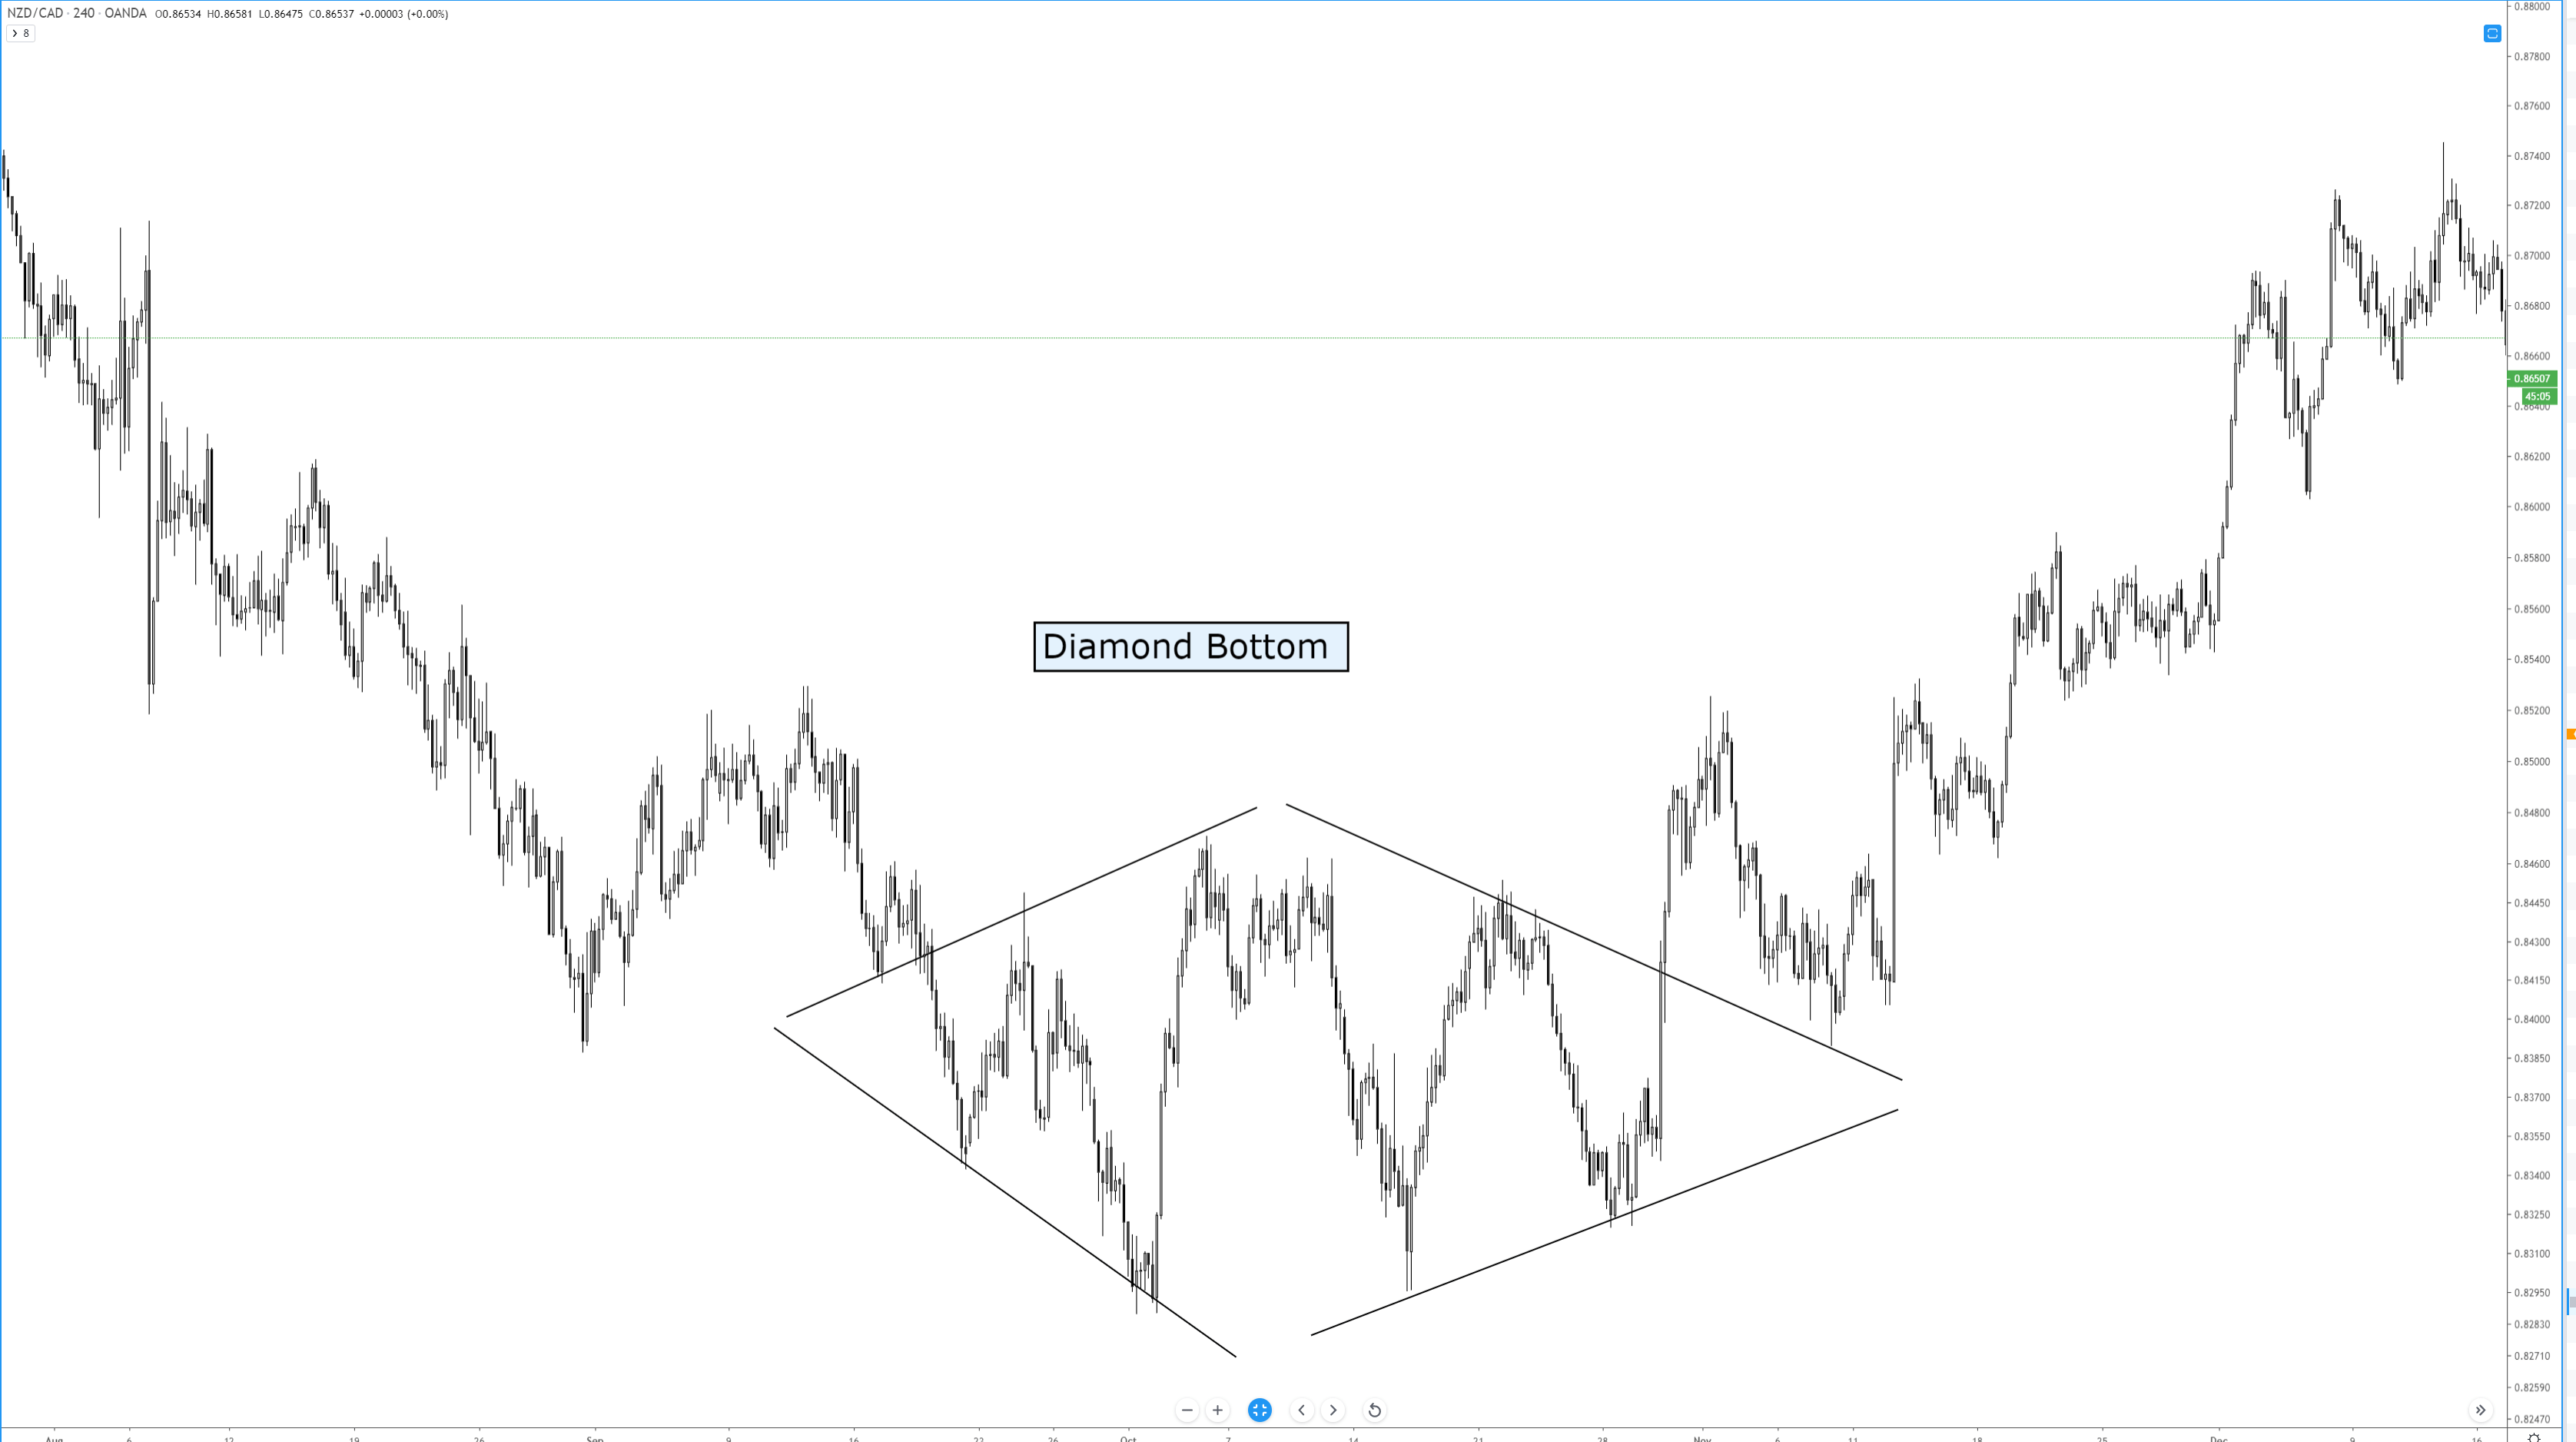
The diamond pattern is rare. It is also difficult to even notice if it exists. In fact, Thomas Bulkowsi writes on his site, ‘Let me clear about this. I don’t like diamonds. They are as tough to spot as nightcrawlers in the grass on a summer night.’ I believe that is a pretty accurate description. But, while diamond patterns are challenging to spot, they are a very powerful pattern that often results in fast and violent moves in the opposite direction – higher for diamond bottoms and lower for diamond tops. It is ok for the patterns to have one side that seems more slanted than the other and, in fact, they often do not appear as symmetrical as the example above. We trade a diamond pattern the same way we would any other triangle pattern.
Sources:
Kirkpatrick, C. D., & Dahlquist, J. R. (2016). Technical analysis: the complete resource for financial market technicians. Upper Saddle River: Financial Times/Prentice Hall.
Bulkowski, T. N. (2013). Visual guide to chart patterns. New York, NY: Bloomberg Press.
Bulkowski, T. N. (2008). Encyclopedia of candlestick charts. Hoboken, NJ: J. Wiley & Sons.
Bulkowski, T. N. (2002). Trading classic chart patterns. New York: Wiley.
Introduction

Introduction
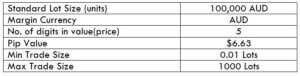
CADJPY is the abbreviation for the currency pair, the Canadian dollar against the Japanese yen. This pair is one of the most extensively traded cross currency pairs. In CADJPY, CAD is referred to as the base currency and JPY as the quote currency.
The value of CADJPY is the value of JPY, which is required to purchase one CAD. It is quoted as 1 CAD per X JPY. For example, if the current market price of this pair is 82.651, then these many units of Japanese yen are needed to buy one Canadian dollar.
The bid price is the price used to sell a currency, and ask price is the price used to buy a currency. There is always a difference between the two prices. This difference is called the spread. It varies from broker to broker and also the type of their execution model.
ECN: 1.1 | STP: 2
Similar to stockbrokers, there are forex brokers who charge a few pips of fee on each position a trader opens and closes. This fee is no different from the commission brokers levy. On STP accounts, the fee is nil, while on ECN accounts, it is between 6-10 pips depending on the broker one is using.
Slippage in trading is the difference between the price requested by the trader and the price he actually received. The two factors responsible for slippage are,
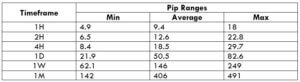
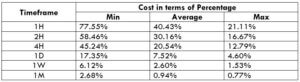
A trading range is a tabular representation of the number of pips a currency pair moved in a given timeframe. It represents the minimum, average as well as the maximum pip movement in six different timeframes. These values prove to be important for assessing one’s risk on a trade. For example, if the minimum pip movement in CADJPY on the 4H timeframe is ten pips, then a trader can expect to lose $917 in about 4H.
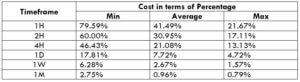
As already mentioned, there is a fee for every trade you take. And knowing the percent fee on the trades you are taking is important, as it depends on the volatility of the market and the timeframe you are trading.
Below is a representation of the total cost variation on trade in terms of percentages. Since costs on ECN accounts are different from STP accounts, we have two separate tables for this concept.
Spread = 1.1 | Slippage = 2 |Trading fee = 1
Total cost = Slippage + Spread + Trading Fee = 2 + 1.1 + 1 = 4.1
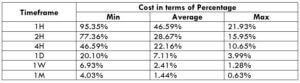
Spread = 2 | Slippage = 2 | Trading fee = 0
Total cost = Slippage + Spread + Trading Fee = 2 + 2 + 0 = 4
Before getting right into it, let us comprehend the above tables. The higher the values of the percentages, the higher are the costs on the trade. It is pretty evident from the table that, percentage values are on the higher side in the min column and comparatively lower in the max column. This means that the costs are high when the volatility of the market is low and vice versa. Also, the trades that are taken based on a long term perspective, the costs are considerably low.
One may trade the high volatility markets to minimize your costs, or trade during low volatility by paying high costs. However, it is ideal to enter during those times of the day when the volatility is close to the average values. During these times, one can expect comparatively low costs with enough volatility as well.
On a further note, another simple and effective way to reduce costs is by trading using limit orders. This entry method will take slippage out of the total costs and bring down its value considerably. An example of the same is given below.
Spread = 2 | Slippage = 0 | Trading fee = 0
Total cost = Slippage + Spread + Trading Fee = 2 + 0 + 0 = 2
What are Candlestick Charts?
What are Candlestick Charts?
A candlestick chart is simply a way of depicting the price moment’s information. Since these chats are very famous, they are available on almost every trading platform. Candlestick charts were first developed by a Japanese rice trader Sokyu Honma in the late 17th century. He is known as the father of candlesticks. Yes, it has been more than 250 years since this chart has been devised and yet they are so relevant even today.
Sokyu Honma – Father of Candlesticks

(Photo Credits – Alchetron)
Japanese are huge technical traders. They use a combination of candlestick techniques & western charts to analyze the market. The primary advantage of a candlestick chart is that it identifies the underlying psychology of traders in the market. This feature differentiates candlesticks from the other chart types we know today.
Have you come across terminologies like ‘hanging-man,’ ‘dark-cloud,’ and ‘evening-star’ but not sure what they are? Good. In the first part of this course lessons, we will be discussing everything about candlesticks and its patterns. We will also discuss how to use these charts & patterns to make profitable trades, as it will open a new way of analysis for you and show how Japanese candlesticks can enhance your trading performance.
There is a great interest in candlesticks by top traders. There are many reasons for that, and few of them are listed below:
🕯️ Candlestick charts are flexible. This is because they can be used as standalone or in combination with other technical indicators. These charts provide an extra dimension to the analysis.
🕯️ This technical approach is an age-old tradition of analysis, which has evolved from centuries of trial and error.
🕯️ Japanese are quite visual on the terms used to describe the patterns. A term like ‘hanging-man’ will spark interest among traders. There are hundreds of such names. Once a trader gets an understanding of what that pattern is, they will not be able to trade without using them.
🕯️ Another important reason for using the candlestick chart is that it can be paired along with the bar charts for people who see bar charts alone.
🕯️ All the usual technical analysis tools can be easily used with candlestick chartings, such as moving averages, trend lines, Elliot waves, retracements, and more. These charts provide a unique way of analysis, which is not provided by any other charting tool.
🕯️ As with all other charting methods, candlestick pattern depends on the interpretation of the trader. This could be one of their limitations. As a trader gain experience, they discover which candlestick pattern suits them the best.
🕯️ Every candlestick has a close. Therefore, traders will have to wait for the close to get a valid trading signal. However, a trader might try and anticipate what the close would be a few minutes before the actual close.
🕯️ The opening price is vital in candlestick. Traders with no access to live market data might not be able to get the opening price of a security.
That’s about the introduction to Candlestick charts, its pros & cons. In the next article, we will learn the anatomy of a single candlestick chart so that you can read the chart better. Make sure to take the quiz below before moving on. Cheers!
[wp_quiz id=”59568″]https://youtu.be/t_7qOjRLbz8

https://youtu.be/t_7qOjRLbz8
Huobi is a cryptocurrency exchange that started operating in 2013. It currently has over a million users as well as over $1 billion in assets under its custody. Though headquartered in Singapore, Huobi has an international presence. It has subsidiaries located in China, South Korea as well as the United States, where it is registered with the FinCen under HBUS Inc. As of March 2018, Huobi is active in 52 US states, operating as a Money Service Business (MSB).
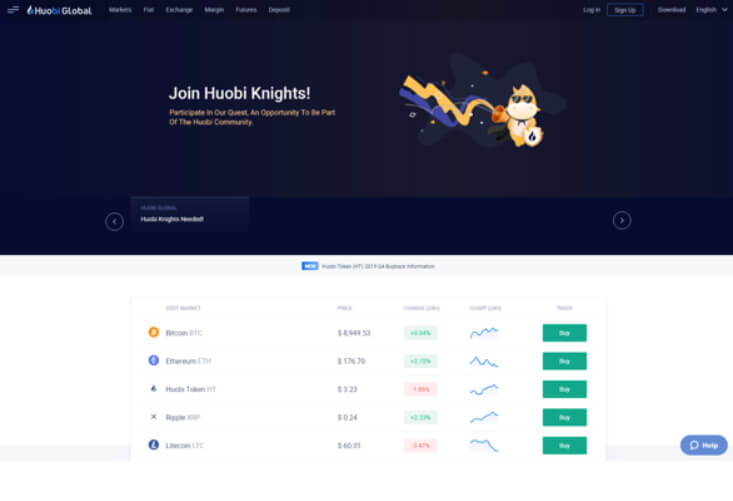
Huobi offers support to nearly 280 crypto assets, including 88 Ethereum-priced pairs, 105 Bitcoin-priced pairs, 37 pairs priced in USDT, as well as over 50 pairs on its HADAX platform.
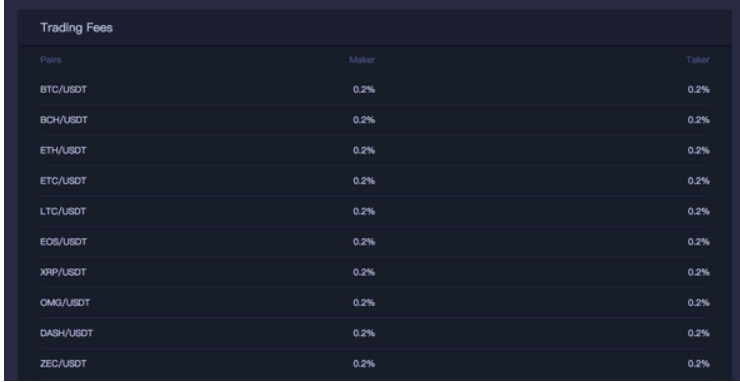
Huobi Commissions & Fees
Huobi tries to offer competitive trading fees to its users. It charges a 0.2% fee on major crypto pairs. Being a market maker or taker does not matter on Huobi.
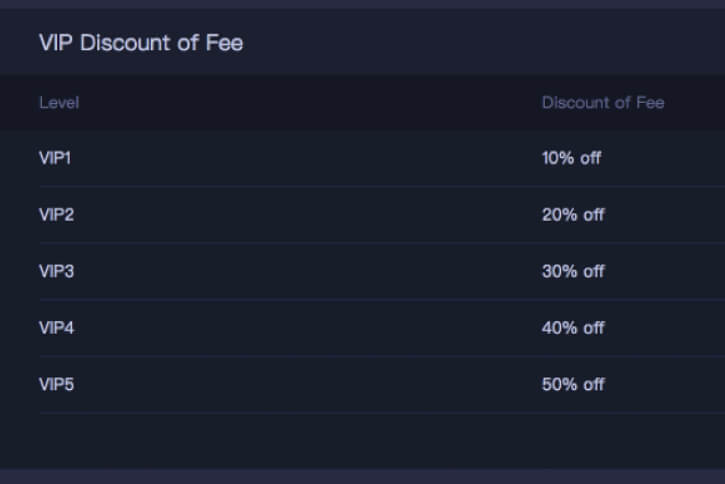
Huobi offers a VIP trading commission schedule to its active traders. The VIP trading commission is tier-based. The higher the VIP membership tier, the greater the commission discount is. In order to obtain a VIP trading discount, Houbi users must pre-purchase the VIP tier they think is the most cost-effective for them. This purchase can only be made with the Huobi Token that is issued by Huobi.
The Huobi Token simply acts as a discount token for the Houbi VIP users. The number of tokens directly determines the level of VIP access. The VIP level can range from level 1, which requires 120 tokens per month all the way up to level 5, which requires 12,000 tokens per month.
Determining the most cost-effective deal is detrimental. A user looking for a 10% discount on their trading fees would need to pay 120 HT, which, with Huobi Token costing $3.23 per unit, would cost $387.6. Therefore, buying this discount level would only be worth it if the trader is willing to spend more than $3,876 in trading commissions. This would, at a 0.2% commission rate, require spending of $1,938,000. However, as the company gave away around three million Huobi Tokens for free in early 2018, the exchange’s earliest users can have access to the greatest discounts if they use these tokens to purchase their VIP memberships.
While Houbi’s VIP profitability “threshold” is high, its base fees seem competitive enough for regular traders.
Security
Huobi offers its users a hosted wallet solution, where users can enable Two-Factor Authentication (2FA). However, this security layer has become an industry standard and, therefore, cannot be considered a feature. Users are notified via SMS upon each successful login.
When talking about storage security, Huobi users should not be worried about security breaches as much as other exchange users. This is because Huobi keeps 98% of its assets in cold storage. The access to cold storage is only granted to internal staff. It is also protected by multi-sig technology.
Huobi has built an anti-DDOS attack system to keep its infrastructure as sturdy as possible.
Account security is also something Huobi is proud of, as fund withdrawals have a couple of interesting caveats. If users change their security settings and immediately attempt to withdraw their funds, Huobi will manually review the withdrawal. On top of that, they may email or call the user to obtain a withdrawal confirmation. Otherwise, withdrawals require three separate codes:
One sent via SMS to the user!
One sent via email!
One 2FA code generated on the user’s device.
In addition to these security features, Huobi created an Investor Protection Fund in January 2018. This fund is used for compensating investors in extraordinary circumstances.
Check out our part 2 of Huobi in-depth review for more on how the platform works.
Introduction
Introduction
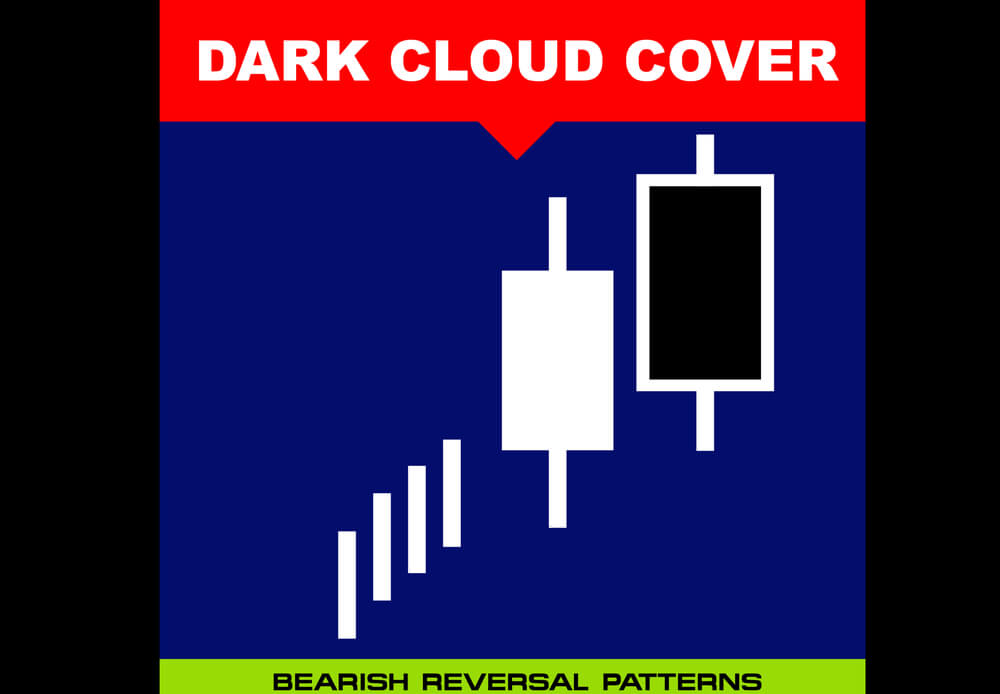
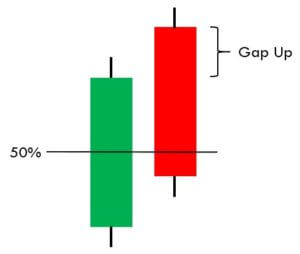
Dark Cloud Cover is a bearish reversal candlestick pattern. It essentially shows the shift in momentum from the buyers to sellers. This pattern is formed by a bullish candle, which is then followed by a bearish candle. Traders can look for an entry on the next red candle. The Dark Cloud Cover pattern can only be used when it occurs in an uptrend. Because, if the price rises above the Dark Cloud Cover pattern, it becomes less significant to trade. It is essential to know that the bearish engulfing pattern and Dark Cloud Cover pattern are very similar in their appearance. If the second candle of the pattern closes below the previous candle, you have the bearish engulfing pattern; if not, it is a dark cloud pattern.
As we always say, do not trade any pattern stand alone in the market. Pairing the pattern with other credible trading tools like indicators or oscillators will dramatically increase the odds of your trades. In this strategy, we have paired the Dark Cloud Cover pattern with the MACD indicator to filter out the low probability trades. MACD indicator stands for Moving Average Convergence and Divergence. It is one of the most popular indicators that has been in use since the late 1970s. It belongs to the oscillator family, and it is designed to measure the magnitude, direction, and rate of change in any underlying currency pair.
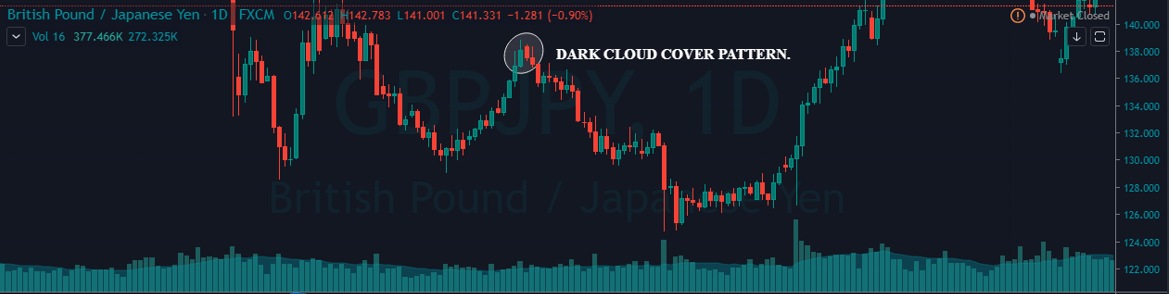
Once you have found the Dark Cloud Cover pattern, the next step is to take the sell trade when MACD gives crossover at the oversold area.
As you can see in the below daily chart of the GBPJPY forex pair, the price action turned sideways for some time. After that, it prints the Dark Cloud Cover pattern, and at the same time, we can see the MACD indicator giving a reversal at the overbought area. This is a potential sign for us to go short on this pair. As mentioned earlier, do not confuse between the Dark Cloud Cover and Engulfing Pattern. In a Bearish engulfing pattern, the red candle completely takes over the preceding green candle, whereas, in the Dark Cloud Cover pattern, the red candle takes over only 50% of the previous green candle.
In this strategy, we have closed our full position at the major support area, and stop-loss was above the Dark Cloud Cover pattern. Price action holds below the support area, but it immediately came back, and prints a brand new higher high. We can also close our positions based on the MACD indicator. When the MACD indicator reversed at the oversold area, it’s a perfect sign to exit our position. Always remember the sure sign of market reversal is when the price action is at the significant support area and the MACD lines crossover at the oversold region.

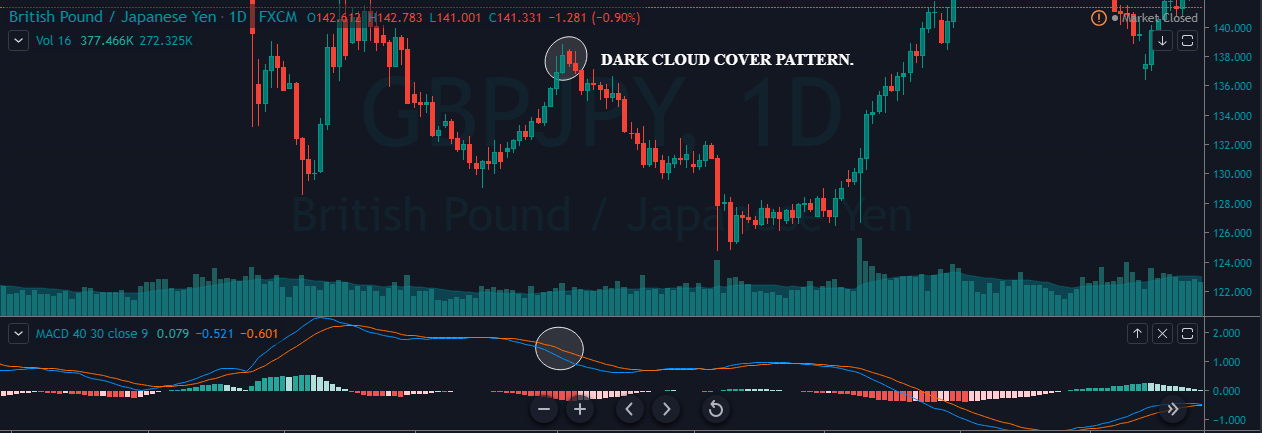
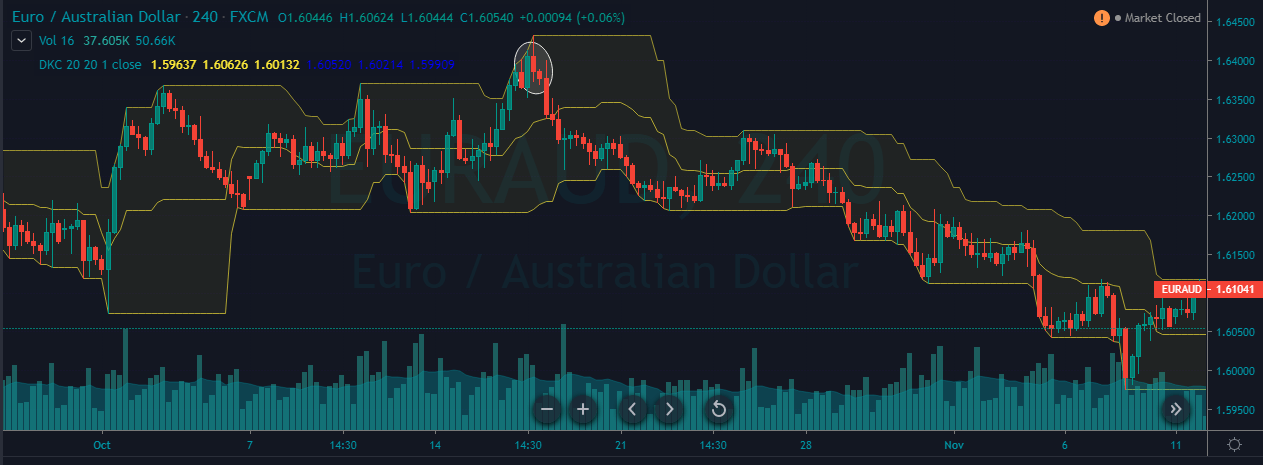
In this strategy, we have paired the Dark Cloud Cover pattern with the Donchain Channel. Richard Donchain developed the Donchain channel indicator in 1936. He was a fund manager, writer, and also known as the father of trend trading. Once the Donchain channel indicator is plotted on to the price chart, it helps the traders to visualize the price of an asset and if it is relative to the upper and lower bounds of the indicator.
Once you find the Dark Cloud Cover pattern in an uptrend, the next step is to check if the price action respects the upper Donchain Channel.
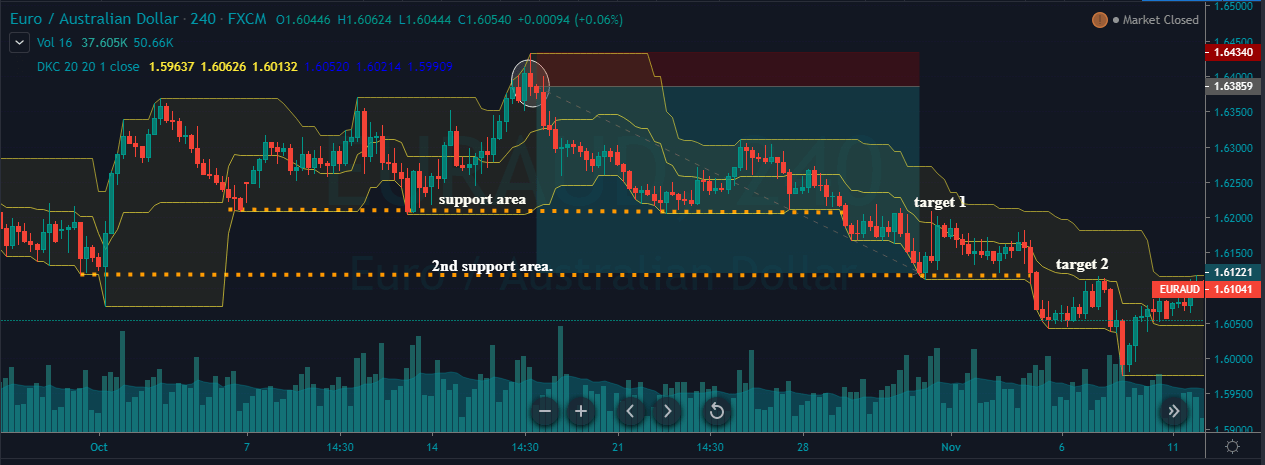
The image below represents the EUR/AUD forex pair, and the price action was held at the major resistance area. Before printing the Dark Cloud Cover pattern, the price hits the upper bound of the Donchain channel twice. When price action hits the upper bound of the Donchain channel and if the market prints the Dark Cloud Cover pattern at the same time, it is a clear indication of sellers stepping into the market. After the completion of the pattern, we activate our trade, and for a profit-booking, we aim for the second target.
In this example, we have two target areas. If you are a short term or intraday trader, then exit your position at first support area, and if you are a positional trader or a swing trader, then go for target two. When you activate your trade and if the market has two major support areas, always try to exit your position at target two, because the end goal of every trader is to make as much money as possible when the market gives them an opportunity & minimize the losses when the trade goes against them. The placement of stop-loss should always be above the Dark Cloud Cover pattern.
The Dark Cloud Cover is quite a popular trading pattern in the industry, and it can easily be recognized on the price charts. This pattern is only useful or reliable to trade when it appears in an overall uptrend. This pattern identifies the shift in momentum from buyers to sellers. The test of the resistance line or trend line can be used as a confirmation tool to take sell trades. If you are using the Dark Cloud Cover pattern alone, always use it on the higher timeframe. Also, use more significant stop loss because none of the indicators or patterns are capable enough to indicate accurate signals all alone. On a lower timeframe, this pattern often provides some false signals. Still, by pairing it with other trading indicators, we can dramatically filter out the low probability signals.
We hope you find this article useful. Try trading this pattern with the indicators we have mentioned above to maximize your profits, as these combinations have been back-tested by experienced traders. Cheers!
Bitcoin’s underlying technology – blockchain – is hailed as an unrivaled, ultra-secure technology. And it’s true – Bitcoin’s cryptographic encryptions are some of the strongest in contemporary times. However, as is the norm with technology, the reality of ‘bigger and better’ is always looming.

Bitcoin’s underlying technology – blockchain – is hailed as an unrivaled, ultra-secure technology. And it’s true – Bitcoin’s cryptographic encryptions are some of the strongest in contemporary times. However, as is the norm with technology, the reality of ‘bigger and better’ is always looming.
Bitcoin’s underlying technology – blockchain – is hailed as an unrivaled, ultra-secure technology. And it’s true – Bitcoin’s cryptographic encryptions are some of the strongest in contemporary times. However, as is the norm with technology, the reality of ‘bigger and better’ is always looming.
Quantum computers, the super-powerful computers relying on naturally occurring phenomena to perform calculations, are becoming a reality. When Google announced that it had achieved “quantum supremacy” in 2019, the blockchain and crypto universe had legit cause for concern. This is because quantum computing is sufficiently powerful to compute equations spellbindingly quickly. And for this same reason, the very encryption securing Bitcoin and other cryptocurrencies might not be so strong, at least when it comes to quantum computing.
Is the quantum threat real, though, and if so, how immediate is it? And what does the future hold for blockchain in light of the quantum threat? We’ll answer these questions in this article – right after we dig into this quantum phenomenon.
A quantum computer is any device that harnesses quantum mechanics to perform tasks. Quantum computers can achieve massive computational speeds because they rely on ‘quantum bits’ (qubits).
The regular computer uses binary units called bits to perform tasks. Bits can only represent one of two possible states at a single time: 0 or 1. However, qubits can represent both 0 and 1 states at the same time. The phenomenon is known as superposition, and it’s what allows quantum computers to perform calculations at ultra-fast rates.
Another state in quantum theory is entanglement – a state in which two members of a pair exist in the same quantum state. When two particles are entangled, a change of state in one prompts a change of state in the other, even if they are far apart from each other in physical space. Nobody knows the cause of this phenomenon, but pairing qubits this way in a quantum machine leads to exponential growth in the machine’s processing power.
Coming back to superposition – it’s an extremely hard state to achieve and just as hard to maintain. It’s an incredibly fragile state – with the slightest vibration or temperature change causing them to fall out of the superposition state. This is known as the ‘decoherence’ phenomenon. When quantum bits are ‘disturbed’ this way, they decay and eventually disappear. When this happens, the task at hand cannot be successfully completed.
To correct this, physicists use a variety of techniques to protect qubits from the outside world – like placing them in extremely cold fridges and vacuum chambers.
A quantum machine’s computational power is determined by the number of quantum bits it can leverage at the same time. The first experiments in the late 1990s yielded two qubits. These days, the most powerful computer can leverage 72 qubits. This computer is currently owned by Google.
Thanks to its superfast calculating speed, quantum computing can redefine entire industries for the better – from healthcare to finance to supply chain to transportation to weather prediction.
Blockchain and cryptocurrencies are not 100% foolproof (cue the many hacking incidents), but they remain one of the most secure technologies in modern times. People trust blockchain because of its revolutionary qualities like immutability, utter transparency, and high security.
But quantum computers are a real threat to the blockchain.
To begin with, blockchain transactions are encrypted with cryptography based on elliptic curve cryptography (ECC). But ECC is not “quantum-proof,” meaning a powerful quantum machine could potentially decrypt a crypto holder’s private keys and forge signatures. With crypto-based on trust – once that trust is broken, it could very well be the end of Bitcoin and other cryptocurrencies.
Right now, scientists are already aware of a possible algorithm that could break down many existing encryption techniques – including elliptic curve signatures. Researchers and mathematicians are already versed with how quantum machines could look like – and they worry about what that could mean for blockchain.
In fact, the general contention is that no one knows the sheer power that quantum computing could herald. It could very well exceed everyone’s expectations and render blockchain technology obsolete.
Speaking to Forbes in October 2019, Dragos Illie, a quantum and encryption researcher at Imperial College London, said it would take at least 1500 qubits to have any effect on Bitcoin and other cryptocurrencies.
Going by achievements in quantum physics, it would take even decades before we can reach that milestone. As previously mentioned, the largest quantum machine has 72 qubits.
What do Researchers Say?
Researchers from the Russian Quantum Centre have noted that one of blockchain’s weaknesses is that it relies on one-way mathematical functions that are easy to run but difficult to run in reverse. These formulas are used to generate digital signatures as well as verify transactions.
A bad actor armed with a quantum device could perform these reverse calculations in a matter of seconds. They could also forge transaction signatures, impersonate crypto holders, and gain access to their wallets. Such an actor could also very easily meddle with the mining process. They could commandeer the public ledger and manipulate records.
The researchers suggested developing countermeasures to this threat immediately. One solution would be replacing the current digital signatures with “quantum-safe” cryptography. This cryptography would conceivably be able to withstand attacks from a powerful quantum machine. Another solution would be based on quantum internet – although that’s decades away. It would entail quantum-based wireless communication architecture that would unlock new possibilities for blockchain technology.
Other quantum researchers – Del Rajan and Matt Viser from Victoria University propose leaping straight to making blockchain a quantum-based system. Their idea envisions a blockchain-based on qubits that are entangled not just in physical space – but also in time itself. They rationalize that it would be difficult for malicious actors to retroactively alter records on the blockchain – as to do this would require destroying the particle altogether. However, this would only be possible after the actualization of a quantum internet.
While researchers propose solutions that are only possible in the far future, there’s a lot of hands-on research in this field that’s already going on. Quantum experts are already developing quantum cryptography to curb the threat of quantum computing on blockchain. However, experts differ on just how immediate the quantum threat is.
For instance, Yaniv Altshuler, founder of predictive analysis Endor Protocol said to Cointelegraph, the crypto website: “Quantum computers are becoming incredibly powerful…but there is no evidence that quantum computing can compromise the blockchain.”
Stewart Allen, CEO at quantum computing firm IonQ, believes that by the time quantum computing becomes powerful enough to pose a danger to the blockchain, security algorithms will have advanced to be able to counter them:
“There is no real threat of quantum computers breaking blockchain cryptography in the short-term…We’re at least a decade from quantum computers being able to break blockchain cryptography.”
Bitcoin advocate Andreas M. Antonopoulos believes the quantum threat is grossly overstated. In a 2018 YouTube Q&A, Antonopoulos said: “We can migrate quite easily to another algorithm. It’s not really as big a threat as people think it is.”
But other experts believe the quantum threat is real and immediate.
Norbert Goffa, executive manager of on-chain data storage system – ILCoin, has concerns over quantum-based mining pools. “Today, we do not have any quantum-based mining machines. On the other hand, a lot of companies are working on quantum-based computing technology. We believe that in the next five years, it could be real…”
Rakesh Ramachandran, CEO of QBRICS, an enterprise blockchain platform, believes that quantum computing will cause a systemic shift in blockchain tech.
“Quantum computers will be redefining cryptography…wherever there is an application of cryptography…The challenge lies in how blockchain will migrate to the new version of cryptography.”
Quantum computing is an exciting technology with the ability to compute equations super-fast – and plenty of industries are poised to benefit greatly from the technology when and if it develops. However, that same technology could be maliciously used to unravel the whole world of blockchain. Thankfully, brilliant researchers are hard at work, figuring out how to protect blockchain and cryptocurrencies from the quantum wave. In essence, there is no big cause of worry.
Introduction

Introduction
The Shooting Star is one of the most popular bearish candlestick patterns in the industry. This pattern appears in an uptrend most of the time, and it indicates bearish reversals in the price action of any underlying currency. So basically, when this pattern appears on the charts, it implies that the buyers are exhausted, and its sellers turn to lead the market. Once we have identified the Shooting Star pattern in an uptrend and confirm the trend reversal with any other credible indicator, we should look to open a short position.
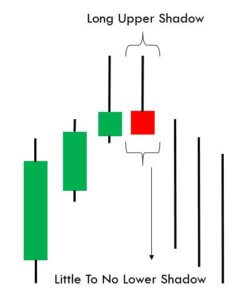
This pattern has a unique structure as it consists of a small body and a high upper wick, as shown in the image below. This image accurately represents the trend reversal because we can clearly see the buyers losing momentum and sellers taking over the market.
In this strategy, we have paired the Shooting Star pattern with the Stochastic Indicator to identify the trading opportunities. Just like RSI and MACD, the Stochastic Indicator also belongs to the oscillator group. It is developed in the 1950s, and it is still widely used by the traders. The Stochastic indicator oscillates between 0 & 100 levels. When the indicator goes below 20, it means that the currency pair is oversold. Similarly, when the indicator goes above the 100 level, it indicates that the currency pair is overbought.
Once you find the Shooting Star pattern, the next step is to check the Stochastic Indicator. If the indicator is giving a reversal at the oversold area, it indicates the overbought market conditions.
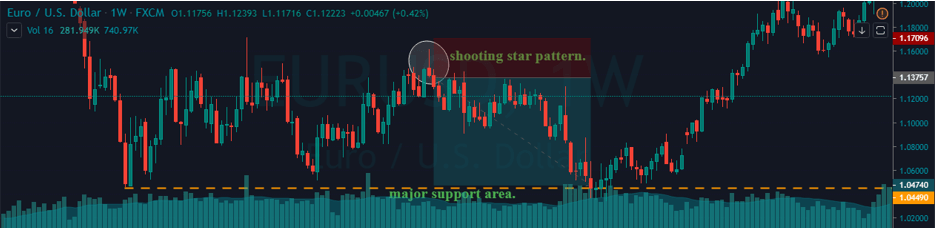
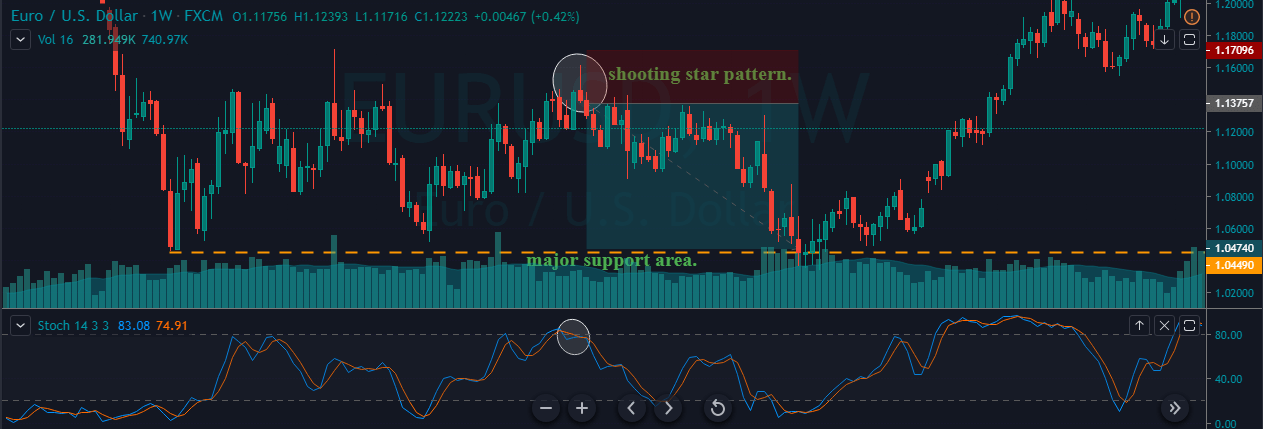
The image below represents the EUR/USD weekly Forex chart. In this pair, price action was held at a significant resistance area, and it prints the Shooting Star pattern. Also, the Stochastic indicates the overbought conditions. These three clues clearly say that this pair is all set to change its direction. The Stochastic pattern on a higher timeframe has very higher chances to perform. So whenever you find this pattern, and if it supports the rules of this strategy, always trade big.
A stop loss is specially designed to limit the loss of the trader. So before activating your trade, it is essential to decide where you are going to place the stop loss. In the example above, we put the stop loss just above the Shooting Star candle.
Shooting Star pattern indicates the reversal in price action. This means that we are catching the top of the trend. As the end goal of every trader is to maximize their profits and minimize losses, always try to hold the positions for more extended targets.
In the example, we have closed our position at a higher timeframe support area. We can use the higher timeframe support or look for the Stochastic Indicator to reach the oversold area. Another way to close the position is when the market reaches the major support area while the Stochastic is in the oversold area.
As we can see in the image below, we closed our full position at a significant support area. You can use the Stochastic or any other trading tool to exit your position, but we always suggest to use the considerable support/resistance area to book profits.

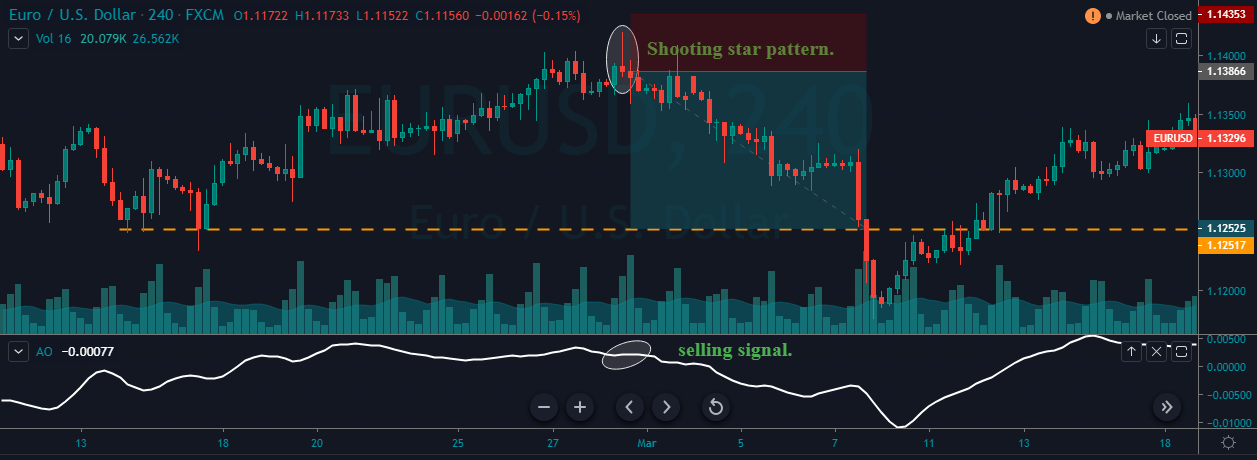
In this strategy, we have paired the Shooting Star pattern with the Awesome Oscillator to identify the trading opportunities. The Awesome Oscillator is a boundless indicator. When the Awesome Oscillator reverses below the zero-level, it indicates the buying pressure. When it reverses above the zero-level, it means sellers are ready to lead the market. Furthermore, some traders use this indicator to confirm the strength of the trend. When the indicator goes above zero-level, it means the buying trend is quite strong, and when it goes below the zero-level, it shows the sellers dominating the market.
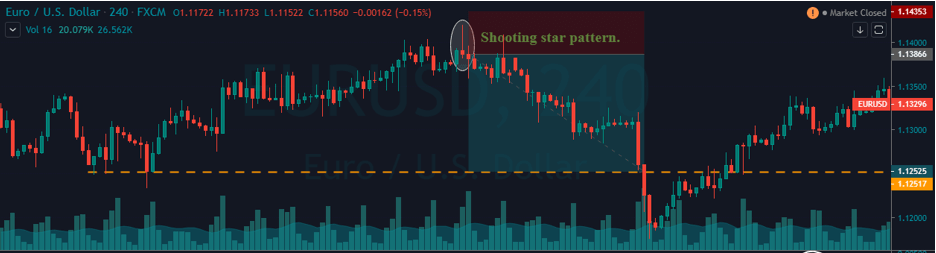
Once we find the Shooting Star pattern, the next step is to take a sell-entry when the Awesome Oscillator reverses at overbought market conditions.
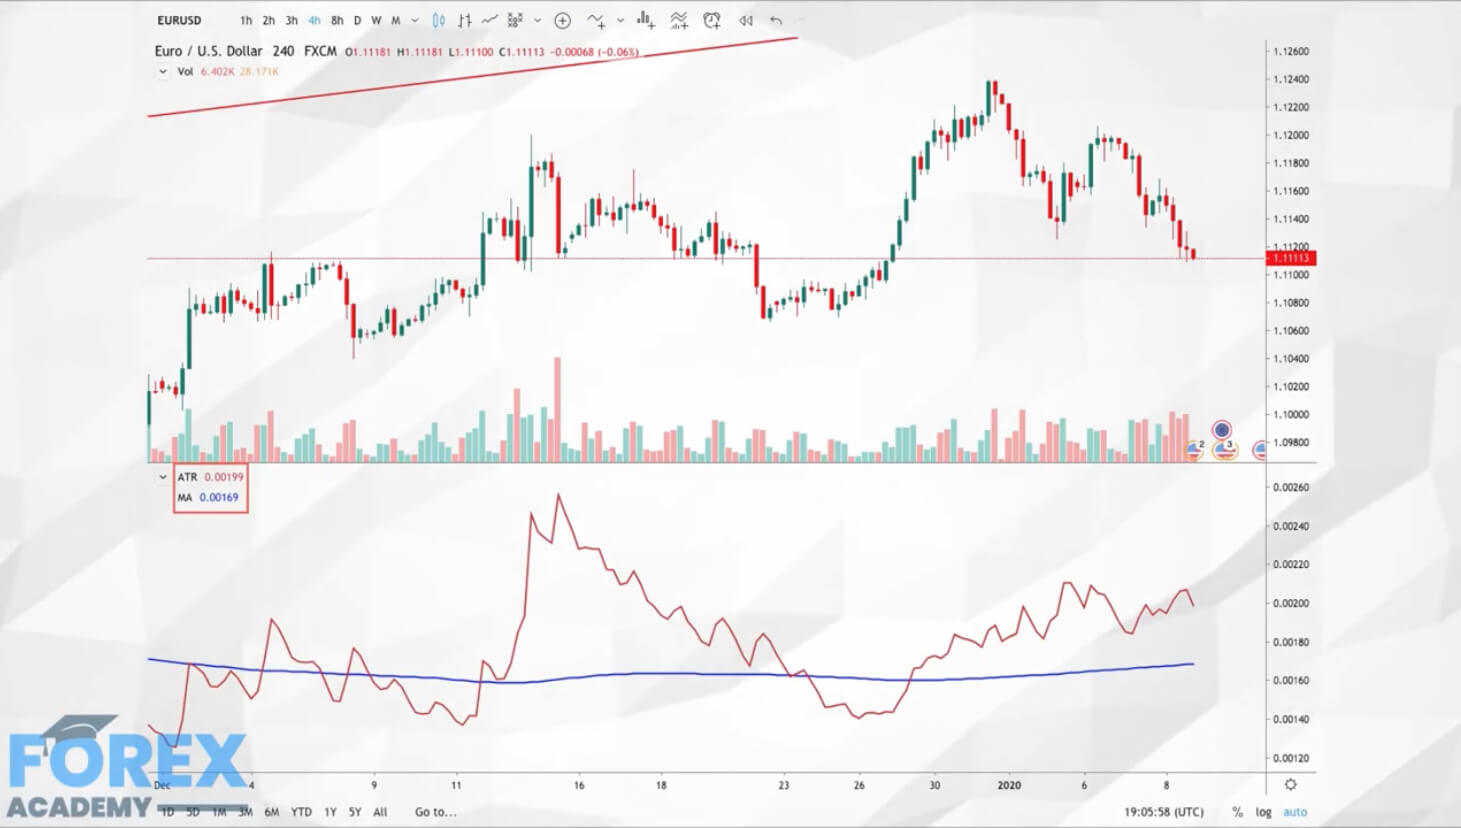
The image below is the EURUSD 240 chart. On this pair, at first, the buyers were quite weak, and they started holding at the resistance area. Furthermore, in that small range, price action turned sideways, and it printed the Shooting Star pattern. The Awesome Oscillator even reversed at the overbought conditions. Both of the trading tools are indicating the exhaustion of the buyers. And sellers are ready to take over the market.
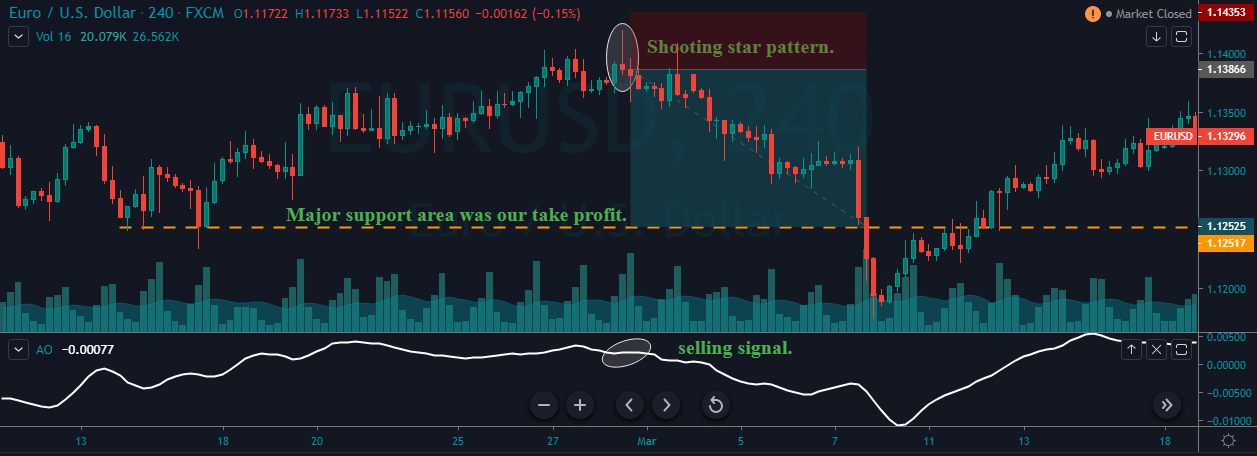
Every trader has different expectations from the market, some like to trade short term trends, and some like to trade longer-term moves. If you are an intraday trader, then we suggest you close your position when the Awesome Oscillator reverses at the oversold area. But, if you are a swing trader or investor, wait for the opposite pattern (Hammer Pattern) to appear to close all of your positions. We can even use the higher timeframe support/resistance area to close our positions.
We advise you to place the stop-loss order above the Shooting Star pattern. As you can see in the image below, we booked full profits at the major support area. After that, the price action dropped a bit more but reversed immediately to follow the buy direction. It is important not to ignore the higher timeframe support/resistance areas.
At first, we see the buyers enjoying the uptrend as the price of the currency keeps printing brand new higher high. As this euphoric moment begins to set in, the sellers start to sell their positions at higher prices. Now the buyers get panicked, and even they start to sell their positions. Now that the buyers and sellers are both selling their positions, panic is created in the market, which leads to a sharp reversal in price action. Thus a long wicked small body candle appears on the trading charts.
Keep in mind that the Shooting Star pattern is more reliable when it is formed after the three consecutive bullish candles. It creates strong bullish pressure on the price chart, and in such cases, the upper wick of Shooting Star is even longer. It indicates that the price is about to reverse with even more strength.
The Shooting Star is a single candle pattern, and it is the most popular trend reversal pattern in the industry. There is a strong psychological pattern that exists beyond the Shooting Star pattern. When the market is in an uptrend, and when buyers gain exponential strength, most of the traders book the profit, and as a result, the bullish trend loses its strength. This results in sellers sending the price down. Most of the time, the Shooting Star pattern provides the 3:1 risk-reward ratio trades.
We hope you find this article informative. Please let us know if you have any questions regarding the same in the comments below. Cheers!
https://youtu.be/hnNdfQFM_vs
https://youtu.be/hnNdfQFM_vs
Professional traders plan ahead, and so should you too. Whether you are an institutional trader with a long-term view you or an intraday retail Forex trader looking to scalp a few pics here and there. It is absolutely necessary that you plan in advance by looking at your economic calendar in order that you do not inadvertently trade at times of potential increased volatility.
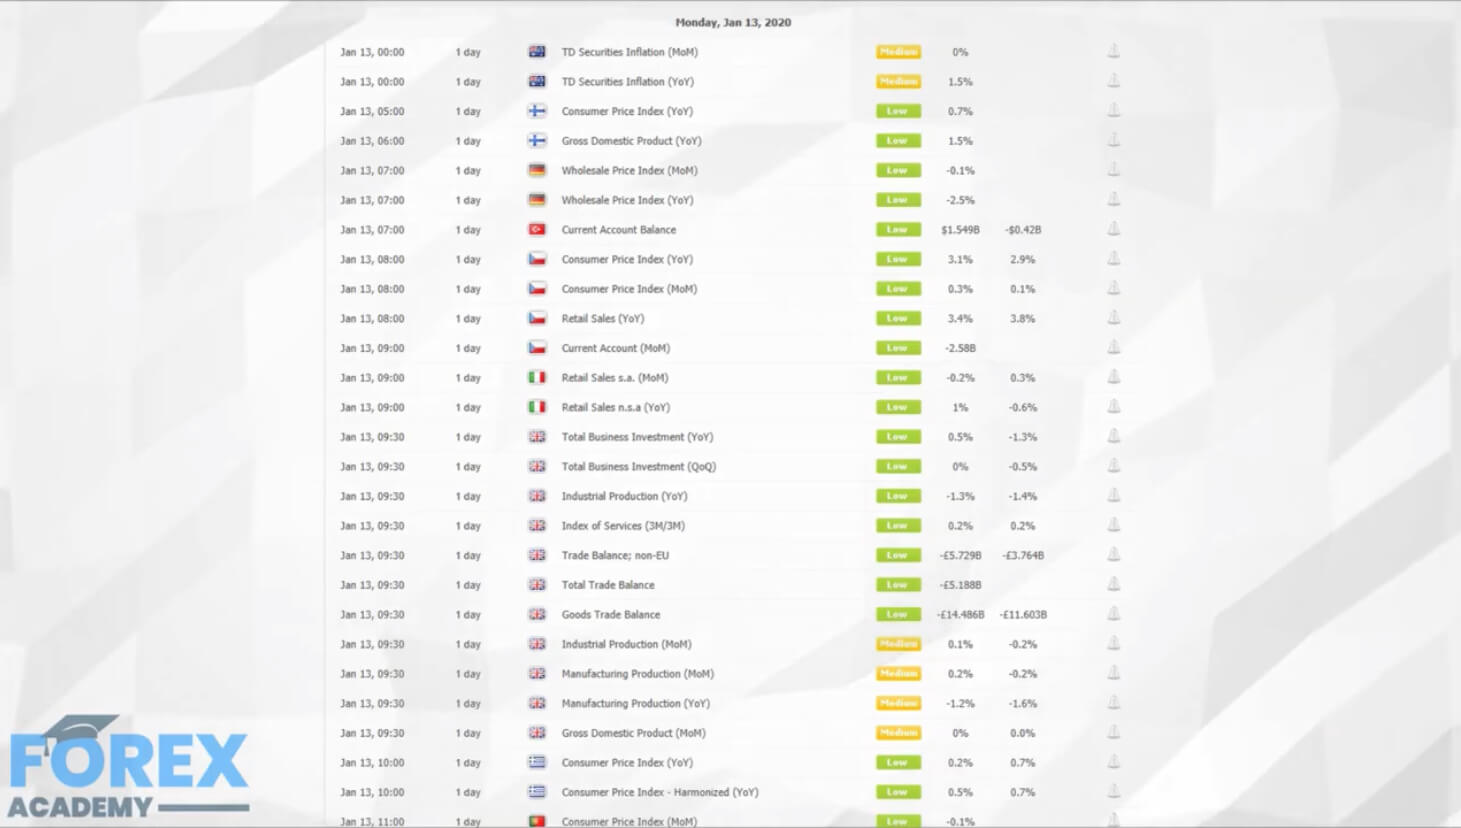
Example A
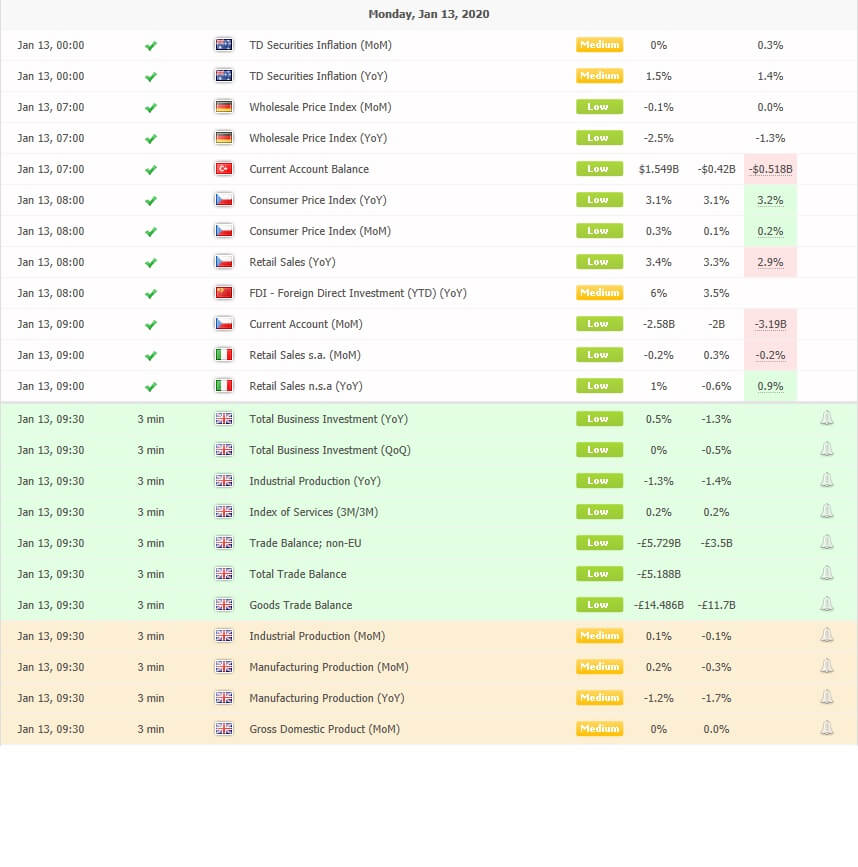
In example A, on Monday 13th January 2020, we can see from our economic calendar that there is a slew of data pertaining to the British economy, which due to be released into the market at 9:30 a.m. GMT. The data is considered to be low to medium in importance and covers things such as total business investment year on year, the trade balance and industrial production month on month, which is of medium important and gross domestic product, month on month, which is also of medium importance.
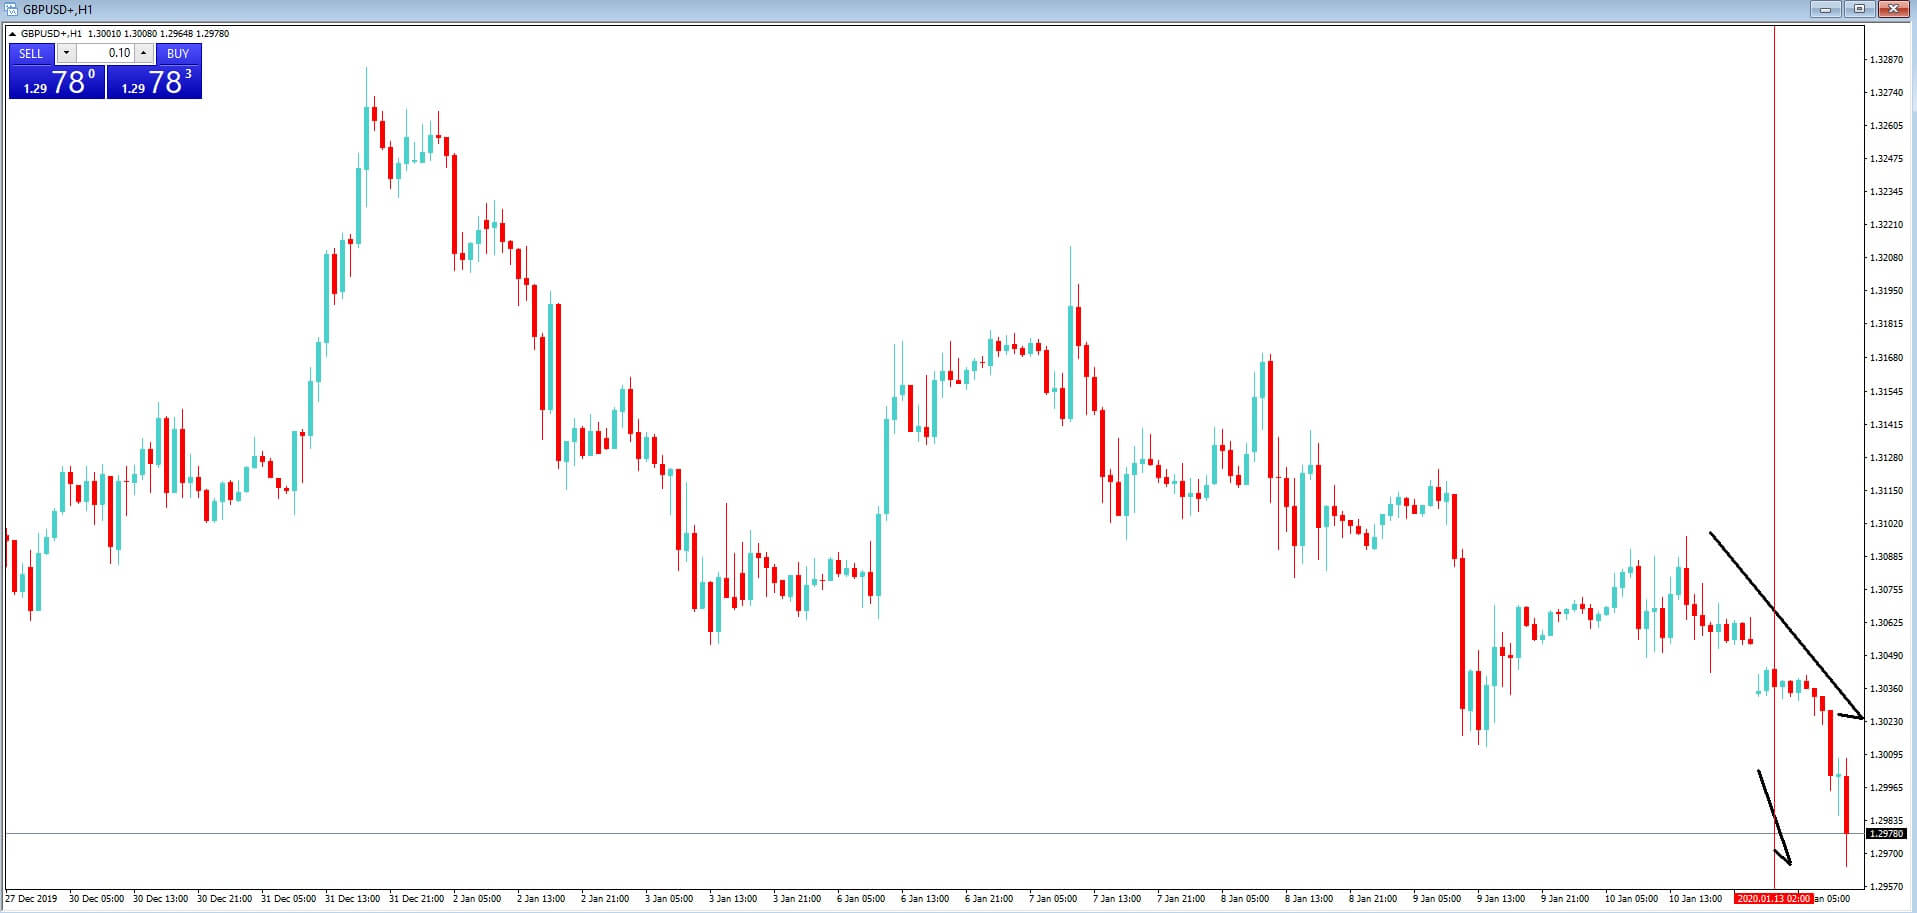
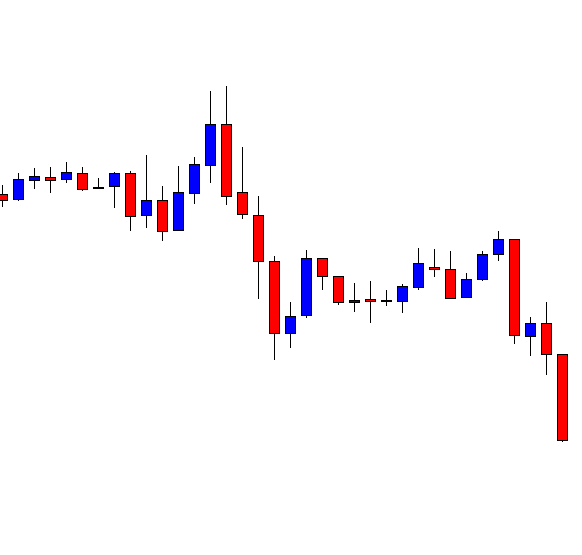
Example B
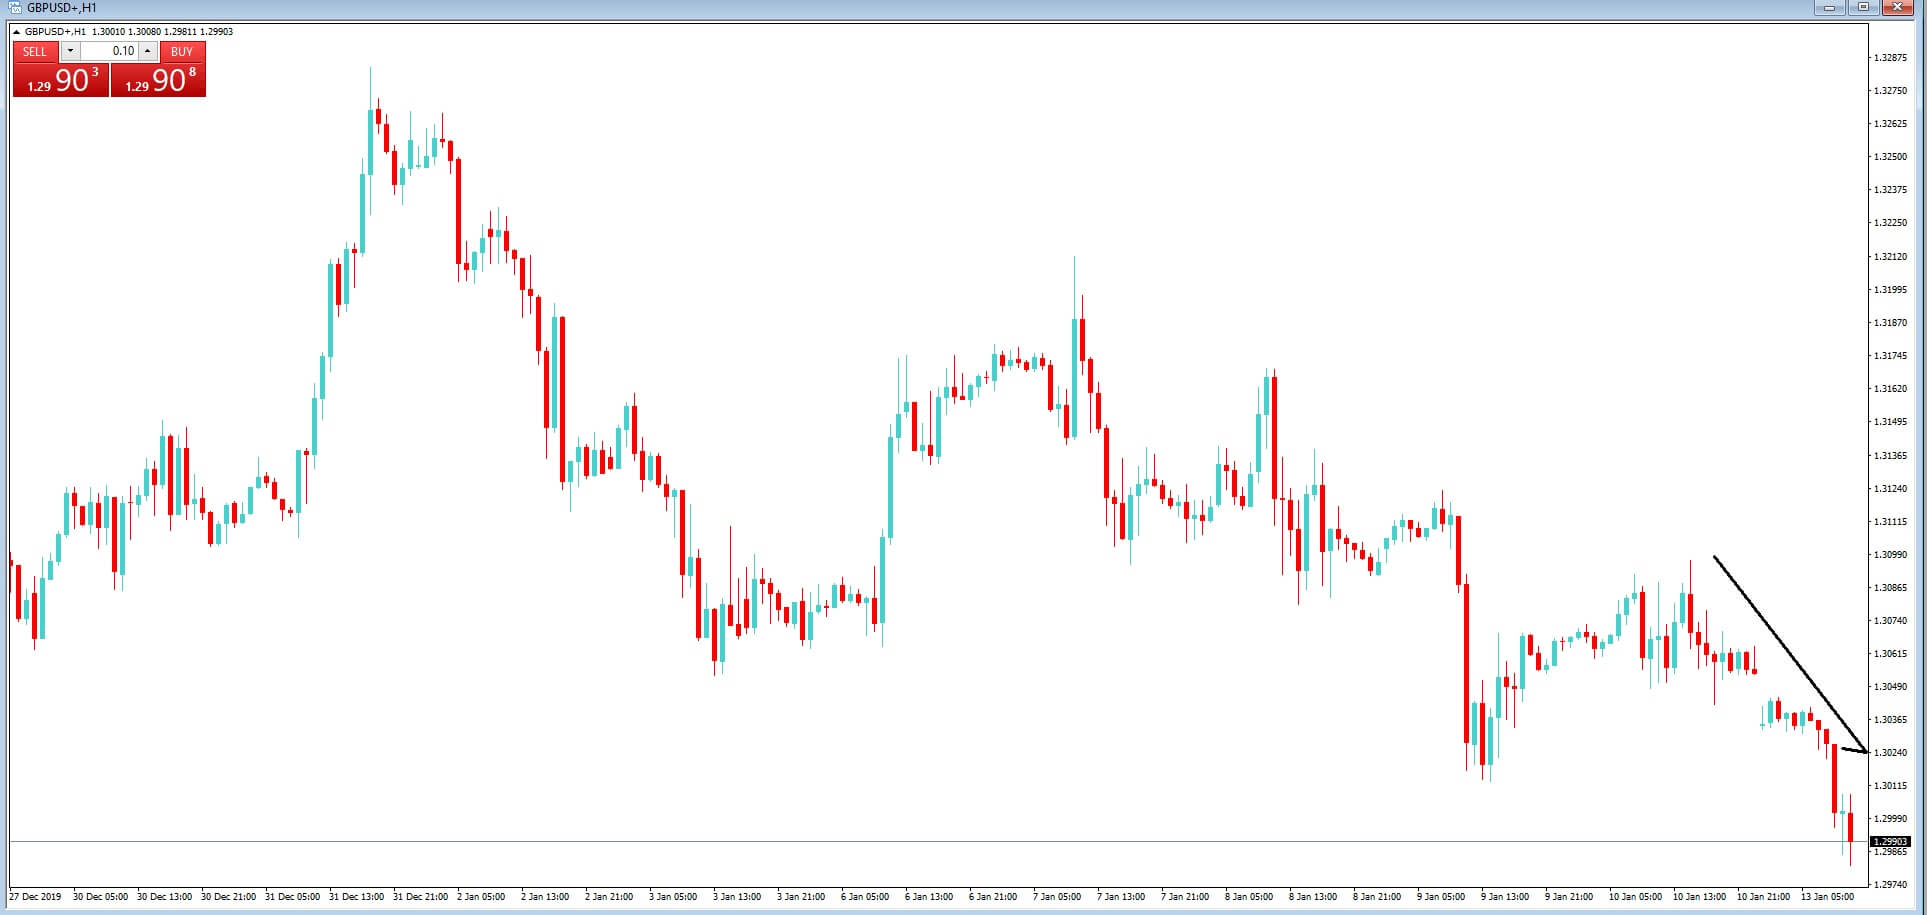
In example B, which is a 1-hour chart of the GBPUSD pair, we can see that there has been a sell-off in the pair in the run-up to these figures being released. This is somewhat due to the fact that in the last few days, the Bank of England has been quite dovish regarding future growth for the British economy this year, plus strong hints that they may reduce interest rates by a half a point by the end of the year. Therefore traders are on the back foot while expecting that the British economy will continue to slow down and they will be sensitive to any data releases that point too to a weakening in the economy, which will provide further ammunition for policymakers in the Bank of England to reduce interest rates in the United Kingdom.
Example C
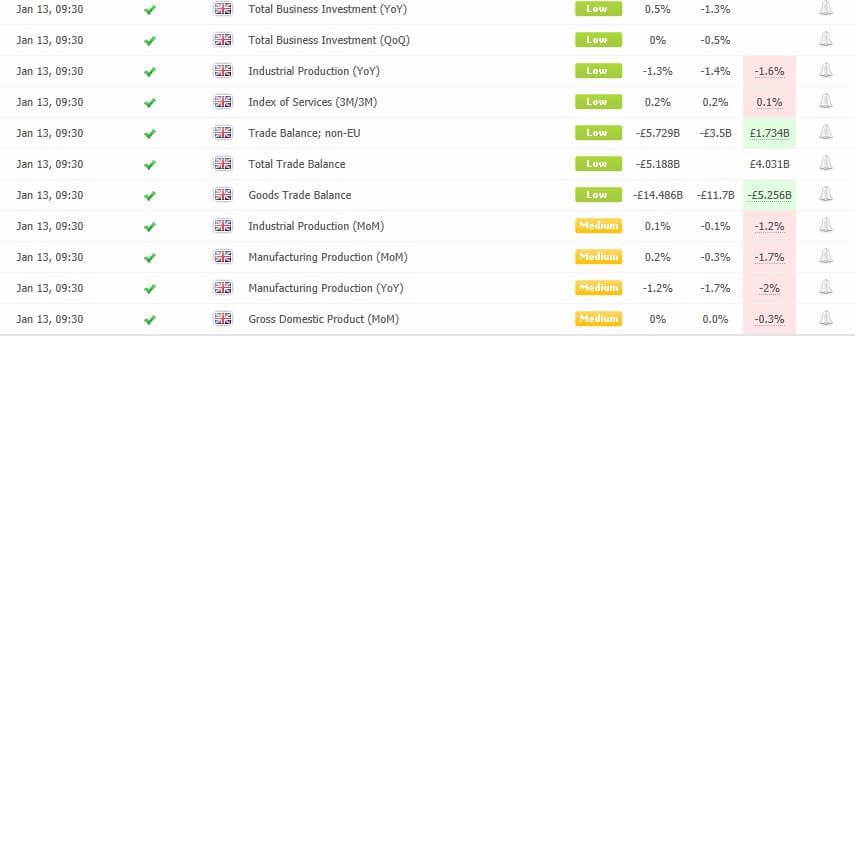
In example C, of our economic calendar, just a moment after the data has been released, we can see that the figures across the board are largely worse than expected, with the most important figure; which is the gross domestic product – month-on-month – showing a worse than expected decline of – 0.3%.
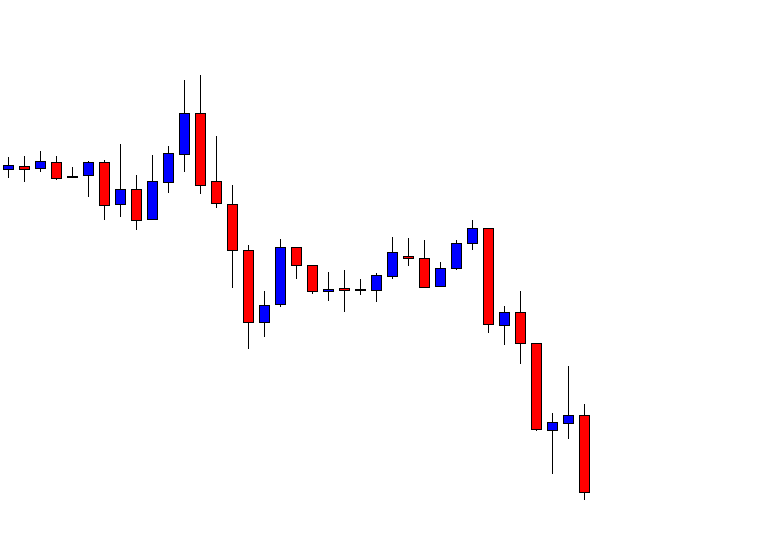
Example D
In example D, we have returned to our 1-hour chart of the GBPUSD, and we can see that there was a further spike lower in the pair post announcement of the economic data release.
However, we often find in the forex market, that institutional traders will have anticipated that the market data may have been worse than expected. And in some circumstances, even though the economic data release is bad for the economy, it might be perceived by traders as not being as bad as expected.
If we stick with this example for one moment, we can see that the overall trend has been to the downside with this pair. Therefore, new traders should be on their guard, because the pair may have bottomed out, even though there was bad data, and set for a reversal in price action. And this is one of the dangers when it comes to trading around economic data releases.
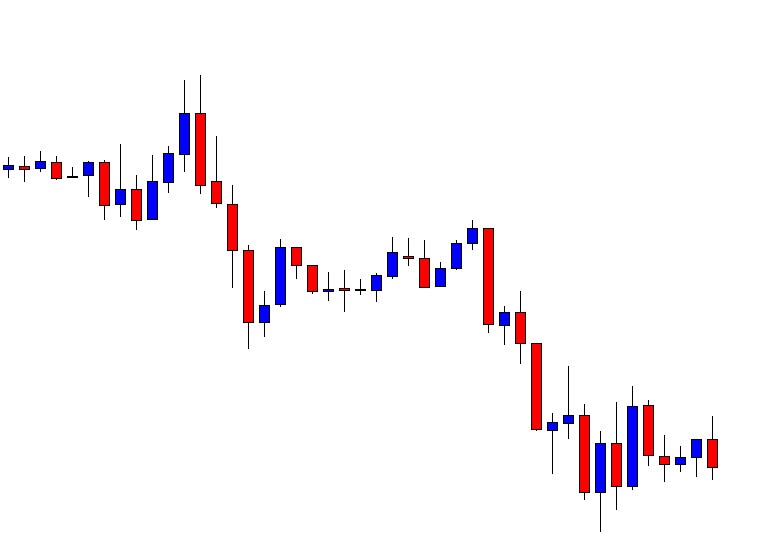
Example E
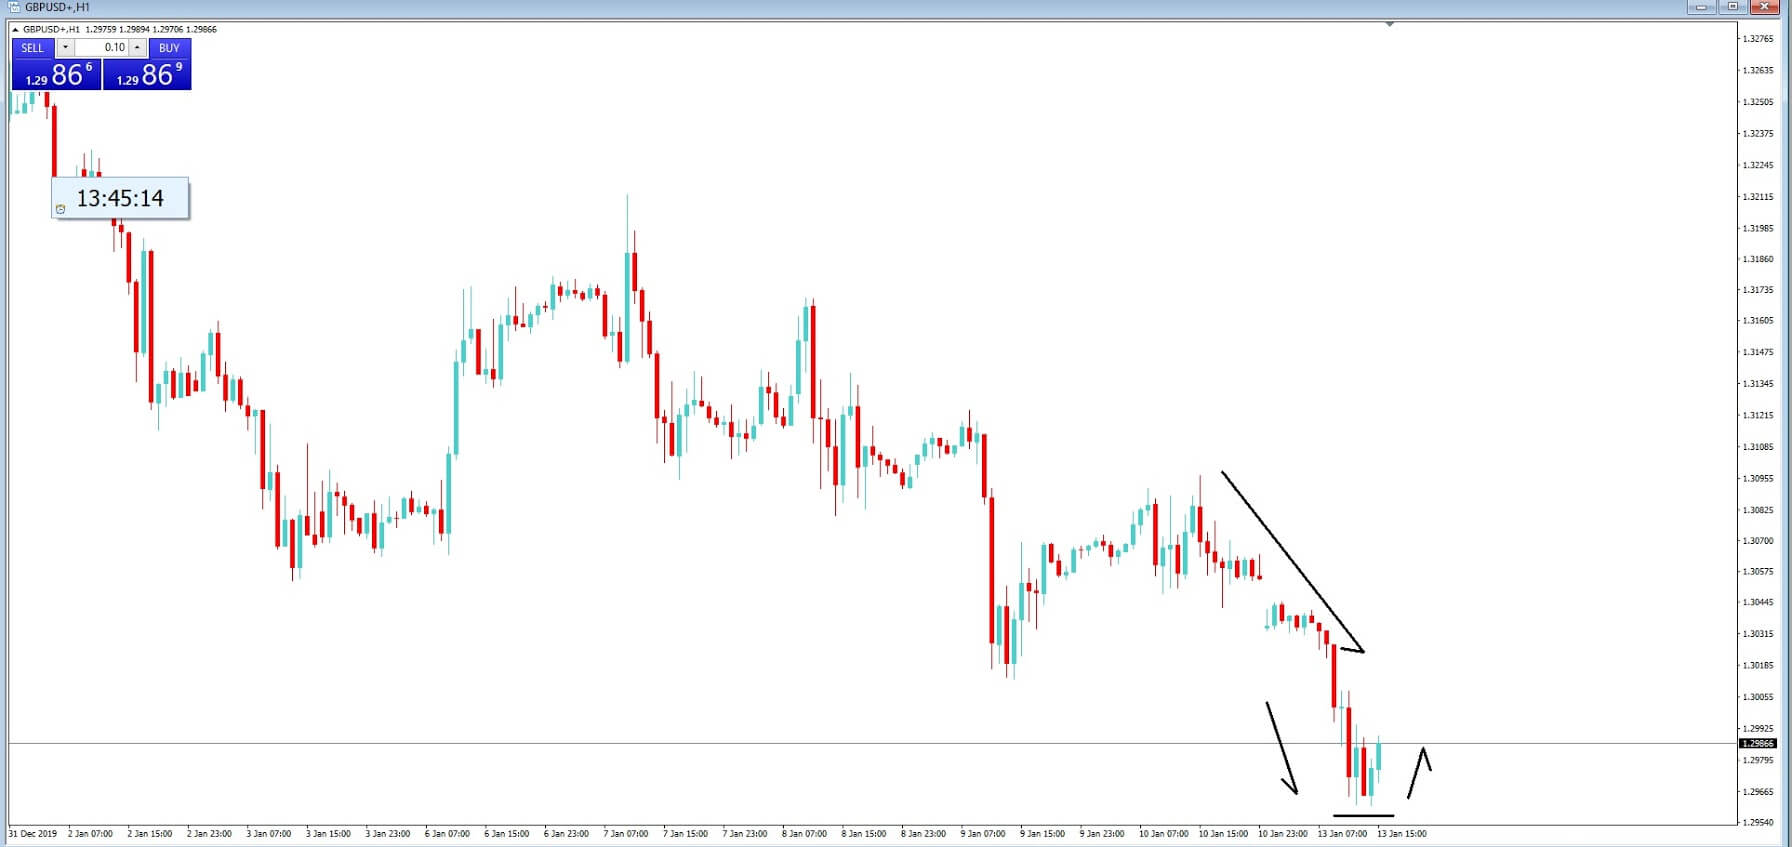
In example E, we return just 4 hours later to our hourly chart of the GBPUSD pair, and we can see that indeed price action had bottomed out because traders had anticipated that all the bad news was already in the price, and they decided to buy the pair.
In part 3, we will be looking at different types of economic indicators and their importance to the financial markets.
https://youtu.be/wCsg8rbHw6Q
https://youtu.be/wCsg8rbHw6Q

To determine if something is good or just a product of randomness is not easy. The pharma industry spends years and costly double-blind studies to determine if a new chemical compound is better than a placebo (distilled water, or just a pill of sugar). This kind of evidence is needed because, as we have seen, almost nothing is sure in mother nature.

Taking the example of the pharma industry, to assess the properties of the new drug, scientists basically create two data sets. One dataset contains all the data measurements of the specimens taking the placebo and another dataset recording the same data of the specimens being administered the drug. So they end up with two groups, and, basically, they want to know if both groups belong to the same statistical distribution or from a different one. The statistical test to do this analysis is called the T-Test.
A T-test allows us to compare the average values of the two data sets and determine if they came from the same population. In the case of Pharma, the placebo group is the equivalent of a random sample with a zero mean, and scientists apply the T-Test to see if the average parameters of the group treated with the drug are similar or different from the placebo group. In the case of a trading system, we would like to know how far is the trading system away from a random trading system. The T-Test will answer not just the question of whether the system or strategy has the edge over a random pick, but it enables us to qualify and rank systems.
For a T-Test to be valid, we need to ensure several details! Scales of measurement must be standardized in both data sets. That means, the collection of the data should be standardized with one unit of trade, and preferably also using units of a standard Risk as a description of profits and losses.
The data collected is representative of the system. That means the data should be collected under all possible conditions the system will experience. The number of samples must be as large as feasible, and to comply with point 2 from a large historical database to account for every possible market situation: Bull, bear, sideways with low, mid and high volatility.
The standard deviation on both samples – random and strategy – should be similar. Making sure point 1 is guaranteed, point 4 is also insured.
The basic formula for when the size of both groups is equal:
t = (m1 — m2) / (σ / √N )
where m1 and m2 are the averages of the two groups and sigma σ is the standard deviation of the samples (assuming equal sigma on both)
if m2 is zero (random) the formula simplifies to:
Q = m / (σ / √N )
Where we have changed the t letter for Q, meaning quality, therefore knowing the average m and standard deviation sigma (σ) of a trading system, we can compute its quality Q.

We can look at m as the signal of our system

And σ / √N as the nose of the system.
Therefore, to maximize Q, we need to make m large and the denominator σ / √N as small as possible.
Qualifying trading systems.
From the Q equation, we can see that the denominator σ / √N is the ratio of the standard deviation and the square root of N, the number of trades. This makes it hard to compare systems with a different number of trades since it will make substantially better the same trade system as the number of samples grows.

SQN
Dr. Van K Tharp came with the idea of capping N the trade number to 100, even when the test is made with a large sample number. This way, we can compute m, the mean with all available data, but cut N to 100 to calculate the Q metric. That formula modification is called SQN, or System Quality Number.
SQN is
Q = m / (σ / √N ) when the sample size N is below 100 and
Q = m / (σ / 10 ) when the sample size N exceeds 100.
The SQN reveals if the system is worth trading. Systems below 1 are hard to trade because it presents a noise figure higher than the signal. That will create lots of doubts on a trader because, on multiple occasions, the system will underperform. An SQN of 1.5 is a very decent system, that can be traded with discipline. Systems beyond 2 are sound. If by chance, you end up with a system with SQN greater than 3, you’re a lucky fellow. Please call and share it with us.
The next release will explain how to make use of the SQN to assess the health of the markets.
Introduction

Introduction
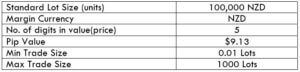
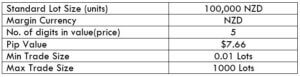
AUD/NZD is derived from the full-form of the currency pair, the Australian dollar, and the New Zealand dollar. It comes under the classification of cross currency pairs. In this pair, AUD is the base currency, and NZD is the quote currency.
The value of AUD/NZD depicts the value of NZD that is equivalent to AUD. It is simply quoted as 1 AUD per X NZD. For example, if the current value of this pair is 1.0405, then these many New Zealand dollars are needed to purchase one Australian dollar.
Spreads are a typical way through which brokers make money. The pip difference between the bid price and the ask price is their profit margin, which is referred to as the spread. It varies from the type of account model.
ECN: 0.9 | STP: 1.8
The fee is basically the commission on a trade levied by the broker on each trade. Again, it varies from the type of account model.
Fee on STP = 0
Fee on ECN = 6 to 10 pips (starts from as low as one pip)
The slippage is the difference between the broker’s executed price and the trader’s execution price. There is this variation as the order is executed using market execution. There are two reasons for slippage to take place.
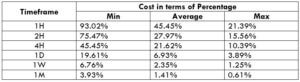
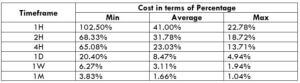
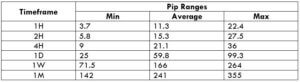
Assessing the profit/risk is a great add-on to one’s trading analysis. With this, the trader can know how long he must before his trade performs. And below is the table that enables the analysis of it.
This is one great application of the above table. By combining these values with the total cost of trade, one can determine variations in the costs by varying the parameters like volatility and timeframe.
Spread = 0.9 | Slippage = 2 |Trading fee = 1
Total cost = Slippage + Spread + Trading Fee = 2 + 0.9 + 1 = 3.9
Spread = 1.8 | Slippage = 2 | Trading fee = 0
Total cost = Slippage + Spread + Trading Fee = 2 + 1.8 + 0 = 3.8
 The Ideal way to trade the AUD/NZD
Before getting into finding the best way to trade this pair, let us comprehend what the above table has got to say.
The higher the magnitude of the percentages, the higher is the cost on the trade for that particular volatility and timeframe. The min column represents low volatility, and the max column represents high volatility.
It can clearly be ascertained from the table that the percentages are comparatively higher on the min column and lower on the max column. This means that the costs are high when volatility is low and vice versa.
But, it is not ideal to trade in neither of the two situations mentioned below.
When the volatility is high -> because of the risk involved
When the volatility is low -> because the costs are high
Now, to maintain a balance between all the parameters, it is best to trade when the pip movement is around the average values.
Furthermore, another simple way to reduce cost is by trading using a pending/limit order instead of market orders, as it will nullify the slippage on the trade. And this, in turn, will reduce the total cost of the trade as well.
The Forex market is open from Monday to Friday. Since Friday is the last day of the week, traders may need to look after their trade more. To be precise, they may need to close their intraday trades manually. In today’s lesson, we are going to demonstrate an example of this.
The Forex market is open from Monday to Friday. Since Friday is the last day of the week, traders may need to look after their trade more. To be precise, they may need to close their intraday trades manually. In today’s lesson, we are going to demonstrate an example of this.
The Forex market is open from Monday to Friday. Since Friday is the last day of the week, traders may need to look after their trade more. To be precise, they may need to close their intraday trades manually. In today’s lesson, we are going to demonstrate an example of this.
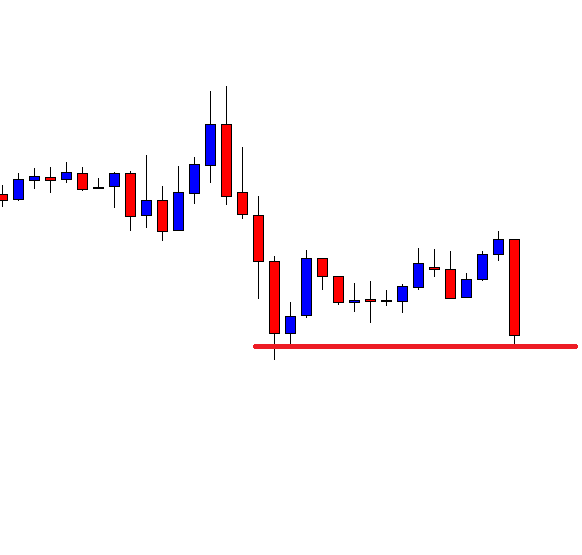
This is an H1 chart. The price after being bearish has been trapped within a rectangle. It could make a breakout either side. However, the last candle suggests that the price is bearish biased. It closes within the level of previous swing low. If the price makes a bearish breakout, the sellers may trigger a short entry upon the breakout confirmation. Let us proceed to the next chart.

The price action produces an inside bar. As we know, an inside bar is a relatively weak reversal candle. It may push the price towards the North; however, if a bearish candle breaches the level of support, the sellers may get ready to go short on the pair.
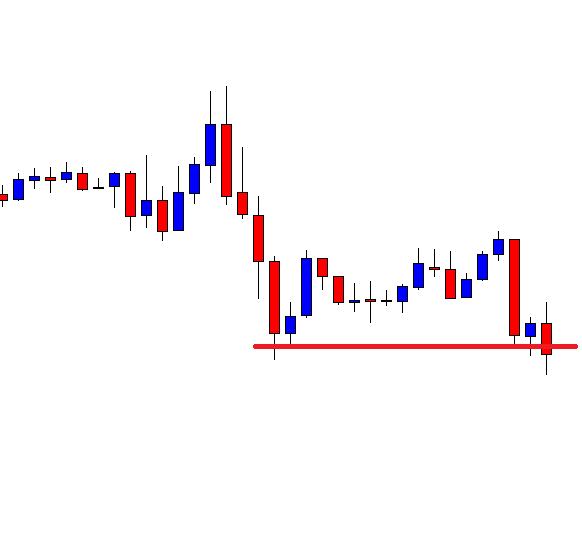
The last candle breaches the level of support. It is not an explicit breakout. Nevertheless, the candle closes below the level. If the next candle closes well below the breakout candle, the sellers may trigger a short entry by setting the Stop Loss above the trend-initiating candle.
Yes, the next candle closes well below the breakout candle. The sellers may trigger a short entry right after the last candle closes. Usually, the take profit level is to be set with a 1:1 risk-reward ratio on the H1 breakout strategy. Do not forget that it is Friday. It is an essential factor to remember while trading in the H1 breakout trading strategy.
The last candle gets us some green pips. It looks good now. Most probably, it is going to get us the reward, which it usually does. We must wait and hold the position.
We have been waiting for long. The price has been on strong consolidation. It is still to travel more to hit the Take Profit. As mentioned, it is Friday. The market is about to close (within 2 hours). Usually, most of the pairs get sluggish before the market closes on Friday. On Monday, many pairs start trading with a gap. There is no point holding H1 breakout positions during the weekend. Thus, we may close the trade manually and be happy with half the profit of our expectations.
https://youtu.be/i_AO21esRws

https://youtu.be/i_AO21esRws
Trading any asset in the financial markets is complicated, and there are simply no shortcuts to becoming a successful trader, it all comes down to education. One of the biggest mistakes that new traders make is to learn about technical analysis without also learning about fundamental analysis, which is just as critical, if not more so. Fundamental analysis is the study of the macroeconomics pertaining to a particular country. It measures its wealth, and in the Forex market, a country’s wealth will determine what its currency exchange rate value is against other countries’ exchange rates.

Fundamental analysis is expressed in the markets by way of economic indicators, which are released by why governments, and non-profit organizations, which monitor economic activity within a country on a regular basis. Economic indicators are in levels of importance attached to each data point where risk rises from low, medium, to high. They can be leading indicators, which tend to precede trends, lagging, which might confirm trends, or coincident, which means the current state of an economy.
Leading indicators include consumer durables and share prices. Coincident indicators include GDP, employment levels, and retail sales. And lagging indicators include the gross national product (GNP), CPI, unemployment rates and interest rates, Once collated, and calculated, the economic information is released and is usually subject to a time embargo, and this typically happens once a month at a set time and day of the week. These are then updated each month, quarter, and each year. Economic indicators are segregated into groups. The higher the rise, the more the likelihood of increased market volatility post-release. More importantly, the release of such data allows traders and investors to understand the current and future economic position of a country and to plan in advance and adjust their portfolios or positions as appropriate.
Once economic indicators are updated, financial policymakers within a country can use the data on how to change policy. Therefore information which may suggest that an economy is overheating, or has as inflation which is below or above government targets, can be critical to policymakers may be forced to make adjustments and therefore perfect a currency exchange rate. Traders will be looking out for such data in order to try and predict if major policy decisions such as interest rate changes could be about to happen in order to adjust their portfolios accordingly. Traders are strongly advised to have access to a reliable economic calendar and refer to it on a regular basis in order to not to get caught out by events such as these. Decent calendars are freely available, and offer a breakdown of economic releases times and will also include things such as expected speeches from political and economic leaders. See example A.
In part 2, we will be looking at how professional traders plan ahead for forthcoming economic data releases.
Introduction

Introduction
NZDJPY, or the NZD/JPY or the New Zealand dollar against the Japanese yen, is a cross-currency pair in the Forex market. The left currency (NZD) represents the base currency, and the one the right (JPY) represents the quote currency.
The market value of NZDJPY is a value of JPY that is required to buy one NZD. It is quoted as 1 NZD per X JPY. For example, if the CMP (current market price) of NZDJPY is 72.657, then it takes 72.657 yen to buy one New Zealand dollar.
Spread is the difference between the bid price and the ask price controlled by the broker. It varies across brokers and their type of execution.
ECN: 0.8 | STP: 1.7
On every trade a trader takes, there are few pips of fee on it. And this is only on ECN accounts because the fee on STP accounts is nil.
Slippage, which happens on market orders, is the difference between the price asked by the client and the price he actually received. There are two primary reasons for it, namely, the broker’s execution speed and the change in volatility of the market.
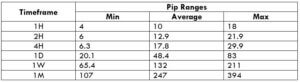
The average, minimum, and maximum pip movement is determined in the trading range table. This comprehensive table helps traders assess the profit they can generate and loss they can incur in a given timeframe. Moreover, this table is helpful in analyzing the cost variation in a trade, which shall be discussed in the next section.

The cost of a trade is not the same throughout the trading day. It varies based on the volatility of the market. Hence, it is necessary to know during what times the cost is high and what times it is low. This could be found out from the table illustrated below.
Spread = 0.8 | Slippage = 2 |Trading fee = 1
Total cost = Slippage + Spread + Trading Fee = 2 + 0.8 + 1 = 3.8
Spread = 1.7 | Slippage = 2 | Trading fee = 0
Total cost = Slippage + Spread + Trading Fee = 2 + 1.7 + 0 = 3.7
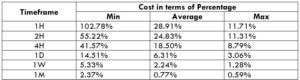
The magnitude of the cost percentage is directly proportional to the cost of a trade. So, the higher the value of the percentage, the higher is the cost of a trade. From the table, it can be observed that the cost is highest in the min column compared to the other two columns. This means that the costs are highest when the volatility of the market is low and vice versa, irrespective of the timeframe you’re trading. It is neither ideal to trade when the volatility of the market is high, nor when the costs are high. The average column is on the one we focus on. Trading when the volatility is at the average value is when you can expect moderate volatility and decent costs.
Also, you may reduce your costs by trading using limit or pending orders instead of market orders. This will bring the slippage to ground zero. This, in turn, will reduce the total cost of the trade as well. An example of the same is illustrated below.
Spread = 1.7 | Slippage = 0 | Trading fee = 0
Total cost = Slippage + Spread + Trading Fee = 0 + 1.7 + 0 = 1.7
Hence, it is seen that the costs have reduced by around 50% of the previous value.
Introduction

Introduction
NZDCHF is a cross-currency pair in the Forex market. It is an abbreviation for the New Zealand dollar and the Swiss franc. Here, NZD is the base currency, and CHF is the quote currency.
The value of NZDCHF simply represents the units of CHF equivalent to one unit of NZD. It is quoted as 1 NZD per X CHF. For example, in the market, if the price of NZDCHF is 0.64535, then it requires those many units of CHF to buy one NZD.
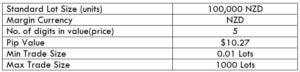
The bid price and ask price in the market is typically not the same. The difference between these two prices is referred to as the spread. And this difference amount is used by the broker. It varies from the type of account model.
ECN: 1.1 | STP: 1.9
The fee is basically the commission that has to be paid on each trade you take. It varies from broker to broker and their execution type. Typically, there is no fee on STP accounts, but a few pips on ECN accounts.
Another type of fee traders have to bear is the slippage. It is the difference between the trader’s requested price and the broker’s executed price. Slippage always is changing due to the ups and downs in market volatility and the broker’s execution speed.
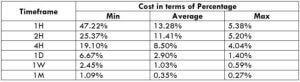
Many novice traders randomly take trades without determining the amount they’re going to risk. The trading range is that representation, which indirectly illustrates the risk and profit area in a trade, in a given time frame. For example, if the average pip movement on NZDCAD on the 4H timeframe is 20 pips, then the trader will be risking $205.4 in an hour on an average.
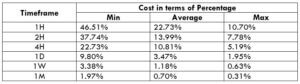
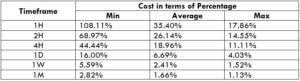
Apart from knowing the profit/loss that can be made from a trade in a given time, it is also necessary to know the cost variation in different volatilities and timeframes. Below is a table representing the cost as a percentage that is obtained by considering the volatility, timeframe, and the total cost on a trade.
Spread = 1.1 | Slippage = 2 |Trading fee = 1
Total cost = Slippage + Spread + Trading Fee = 2 + 1.1 + 1 = 4.1
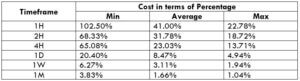
Spread = 1.9 | Slippage = 2 | Trading fee = 0
Total cost = Slippage + Spread + Trading Fee = 2 + 1.9 + 0 = 3.9
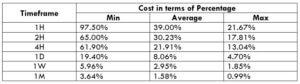
Trading on any timeframe and during any volatility is not an efficient way of trading. There are specific times in the market when you must enter/exit. This can be determined from the above two tables. Firstly, the higher the magnitude of the percentage, the higher is the cost of a trade for that particular timeframe and volatility. It can be ascertained from the table that the costs are low for high volatilities and high for low volatilities. And neither of the two states is ideal to trade. To keep your cost affordable and volatility moderate, it is ideal to trade when the volatility is nearby the average values.
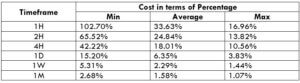
Furthermore, it is recommended to have strategies that enable the use of limit orders. Because trading with limit orders will completely cut off the slippage on the trade Nullifying it, the total cost will significantly reduce, which, in turn, will reduce the cost percentage as well. For example, it was observed that cost percentages were reduced by about 50% when the slippage was removed.
https://youtu.be/PeBr1Eq8xN4
https://youtu.be/PeBr1Eq8xN4
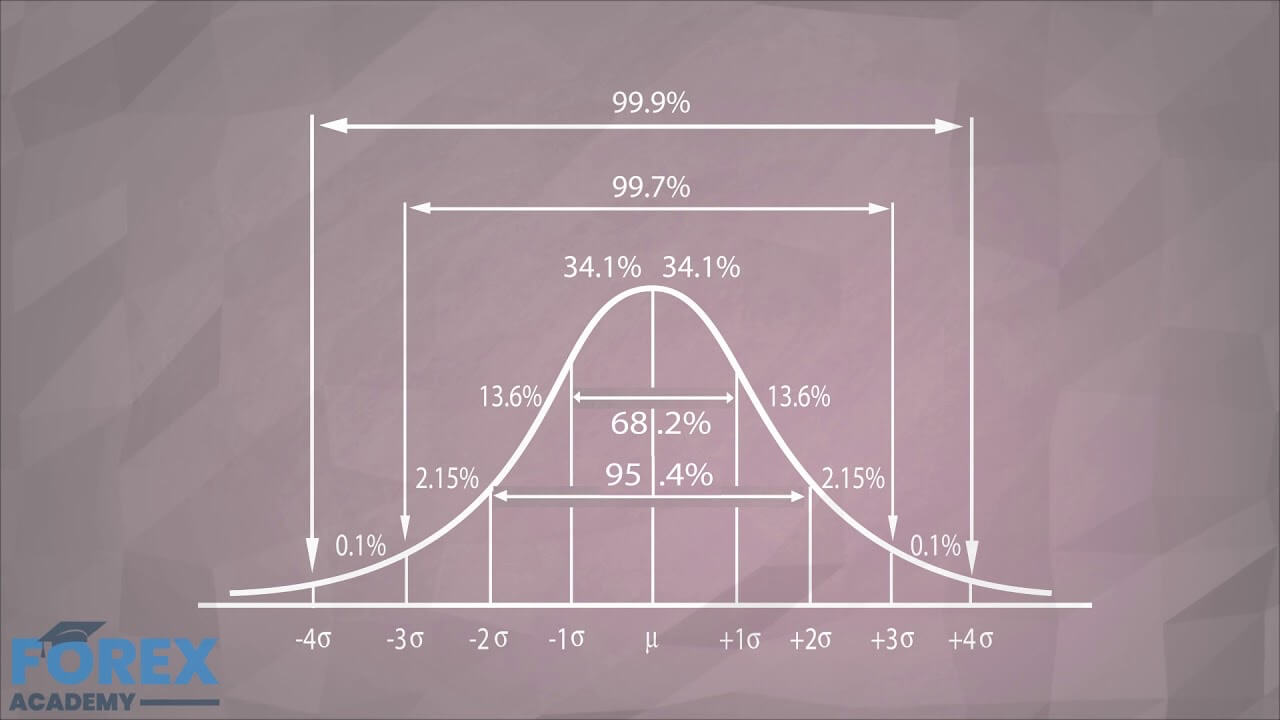
In our last episode, we discussed how to qualify turning points as a filter to validate TA signals based on the intrinsic statistical properties of the Normal Distribution.
In this video, we will continue developing ideas to improve the chances of success in Forex and Crypto trading.
Better Fibonacci Retracements and Extensions

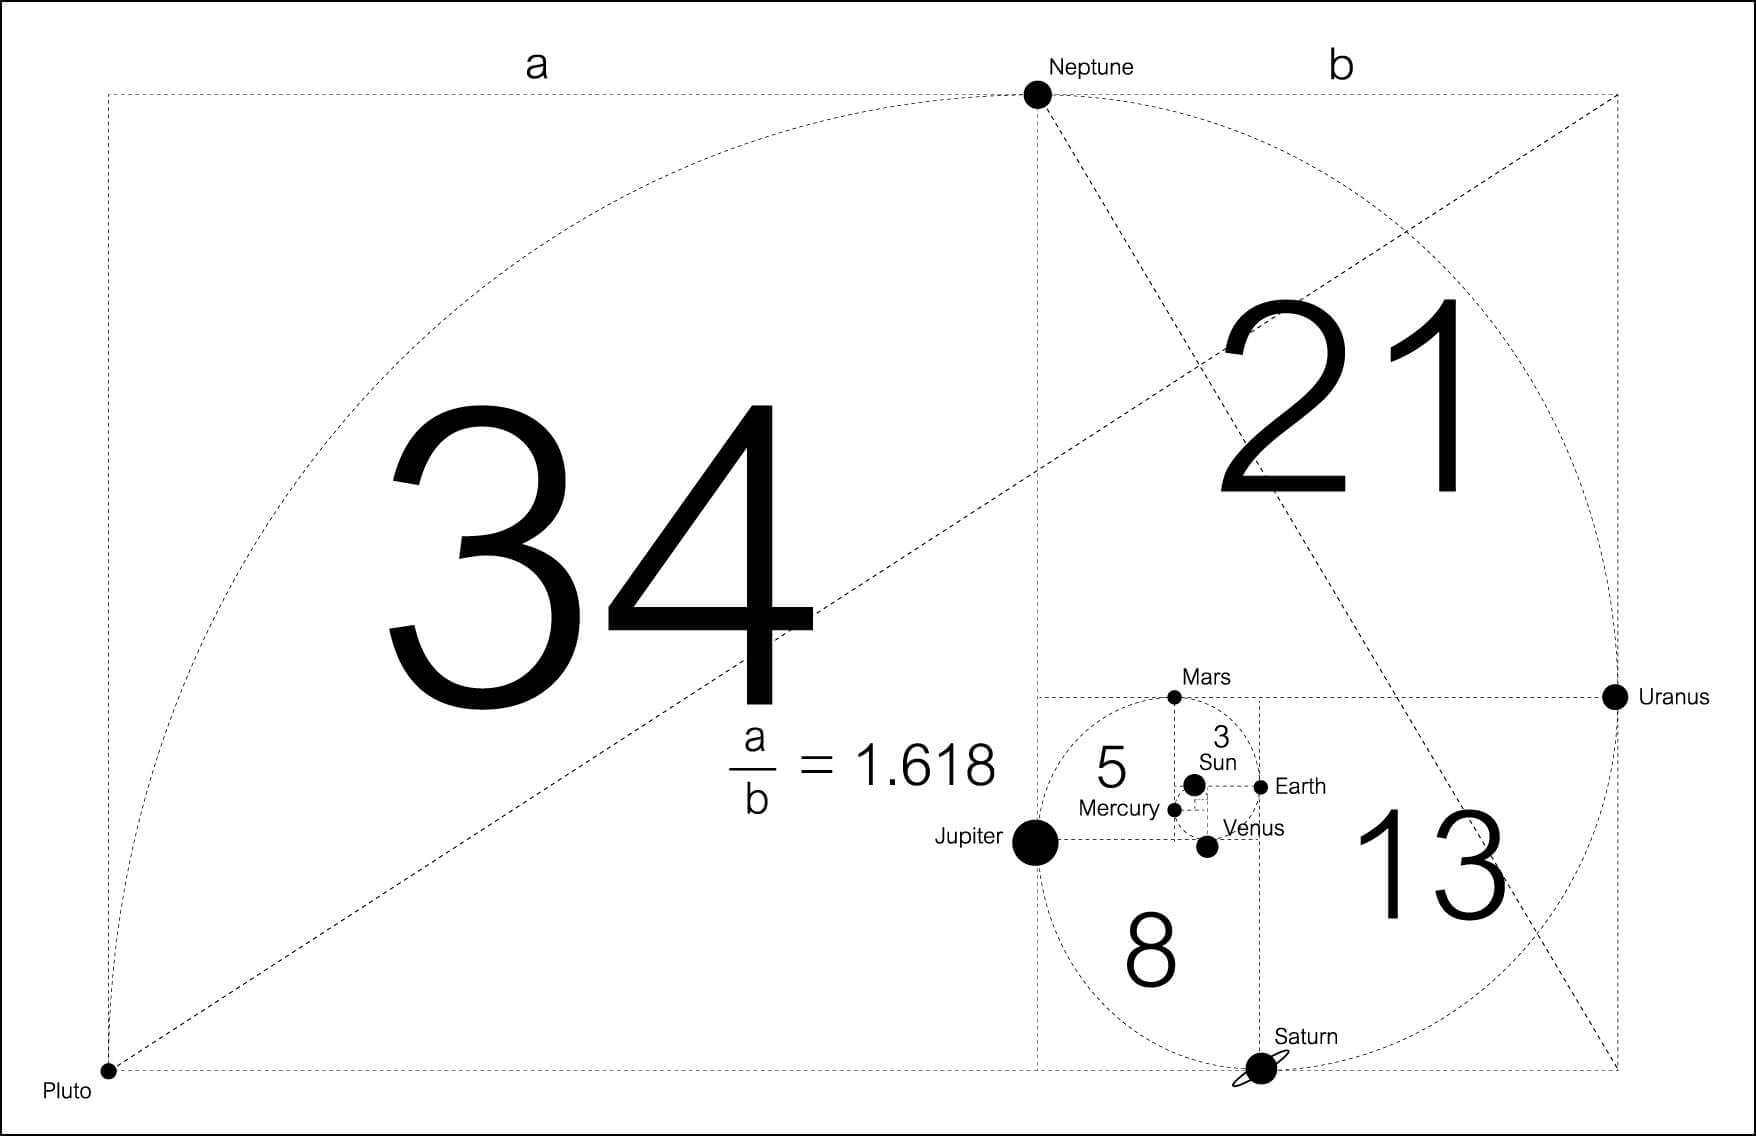
Fibonacci retracement is a prevalent indicator to evaluate retracement entry points, and a Fibonacci extension is also a popular method to assess potential target levels. It is based in the golden ratio, coming from the Fibonacci number sequence. As you should know, the Fibonacci sequence starts by 1,1, and the following members come from the addition of the two previous numbers.
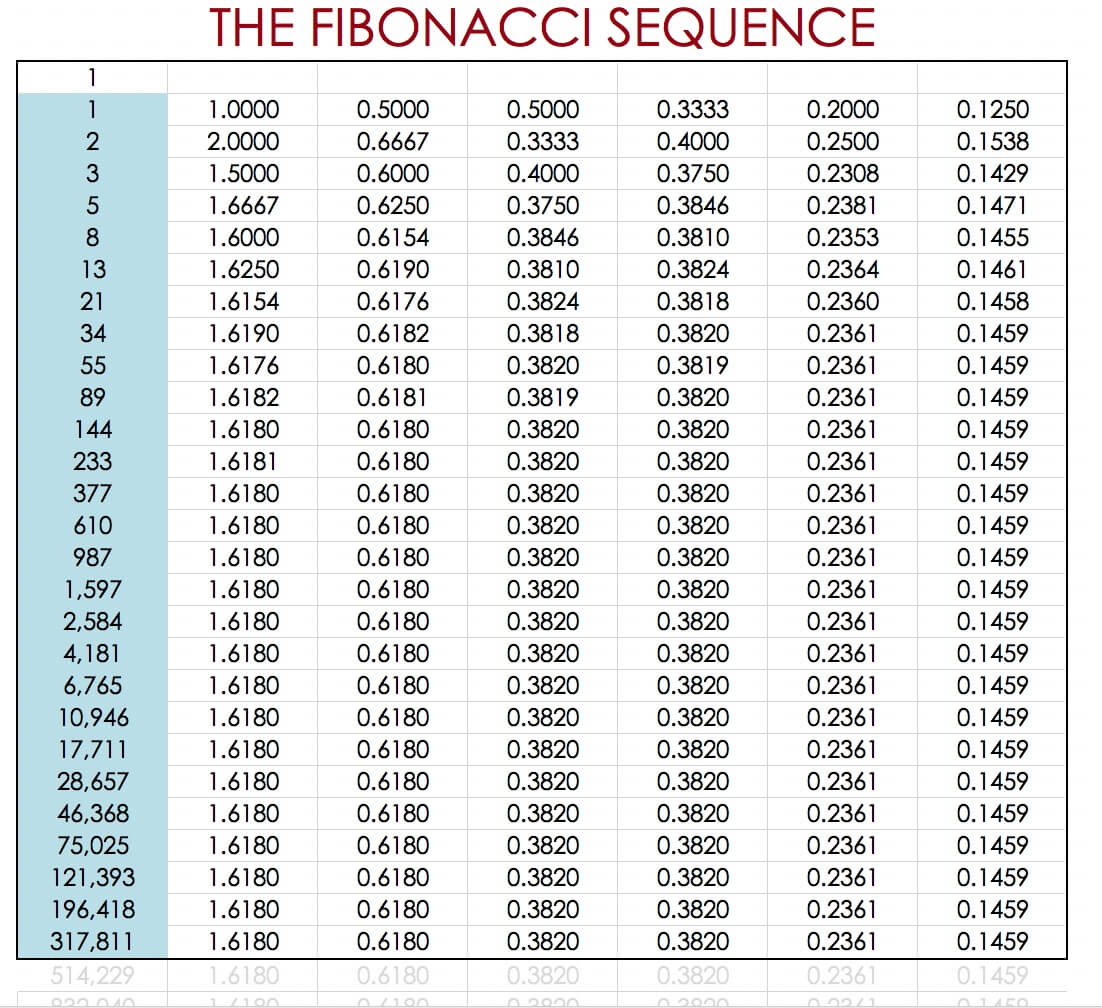
As the numbers grow, a Fibonacci number divided by its previous number in the series gives the golden ratio: 1.6180. The reciprocal, a Fibonacci number divided by the next number, provides the other golden ratio: 0.6180. 0.382 comes from the ratio of a Fibo number and the second next. 0.236 is the result of a Fibo number divide by its 3rd next. 0.1459 results from the division of four distanced Fibo numbers, and we could go on forever. To these ratios, trading software adds the 0.5 and 0.75 levels and the complimentary and extensions.
It is hardly useful to have a forecasting tool that tells you the next retracement could end at 14.6%, 23.8%, 38.2%, 50%, 61.8%, 75%, 85%, or 100% of the last top, but with no likelihood associated with each level.
What if we could classify the retracements and assign them the probability of occurrence? Well, we really can. We could keep a record of all the past retracement, organized for the bull and bear movements, and then bin them in chunks of 10 percent and create a histogram and, from there, assign a probability to each bin. Or, we could just take the average and the standard deviation of all retracements for bulls and bears, separated, and use the well known probabilistic profile of the Normal Distribution to assess probabilities.
That would also apply to extensions. By keeping track of every impulsive movement following a retracement, we can typify the behavior of the asset. We could create the average and standard deviation of the last 30-50-100 occurrences and create a statistical profile similar to the retracement case.
In the case of the retracements, we can see that the average plus 1SD would be very high probability entry points since only 16% of the cases the retracement went further down.
In the case of extensions, the average minus one SD would be a sweet spot for the first take profit level, being the second the average and the third the average plus one SD.
Stop Settings
Until now, we have discussed entry and exit points taken from a statistically minded perspective. What about setting stops in the same way instead of the obvious levels everybody notices, including institutional traders?
Setting stop levels can be rather straightforward if we know the distribution of the prices. If the entry point takes place at the average +1SD retracement level, the average plus 2SD is a good stop level, as the likelihood of the retracement to reach it would be just 5%.
We could, even, keep track of the history of stops, using John Sweeney’s Maximum Adverse Excursion concept. To summarize it, The MAE method is a stop-loss setting system that tries to place the stops at the historical optimal level based on past trades.
The method tracks the price paths during positive trades to see the maximum adverse excursion taken by the trades before moving in our favor. That way, we could detect the level beyond which there is a high probability that the trade will not be profitable. That is the optimal level for the stop-loss.
For more on Stop settings, please read:
Masteting Stop-Loss setting: How about using Kase Dev-Stops?
Introduction
Introduction
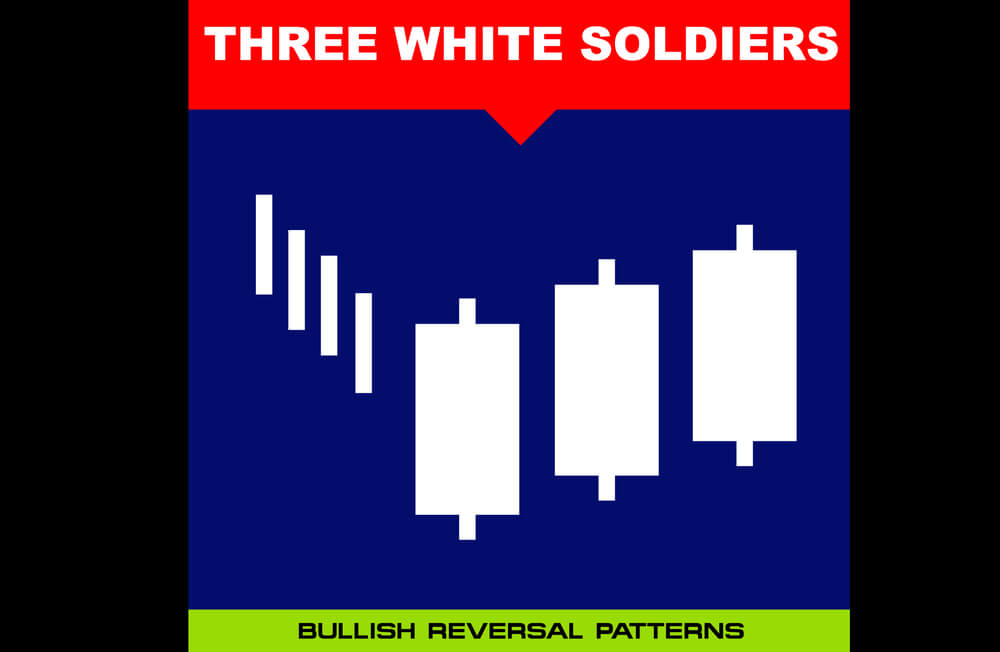
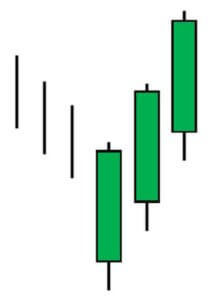
The Three White Soldiers is a bullish candlestick pattern. This pattern is highly reliable and quite potent when it is found at a significant support area in a downtrend, which indicates sharp price reversals from a bear market to a bull market.
Candles get printed on every trading chart in all the timeframe. But only the candlestick patterns in the right context of the market will be rewarded. The Three White Soldiers pattern that we are going to discuss is one of the most credible and reliable patterns we have come across. Trading legend Gregory L. Morris, in his book ‘Candlestick Charting Explained,’ said that the Three White Soldiers is extremely rewarding if traded correctly and it should never be ignored.
In this strategy, we have paired the Three White Soldiers pattern with the RSI indicator to identify good trading signals. RSI is a well-known oscillator, and it stands for the Relative Strength Index. The RSI indicator has a reading from 0 to 100. When the indicator line goes above the 70, it indicates the overbought conditions. When the indicator lines go below the 30 levels, it means the market is in an oversold condition.
Step 1 – First of all, find the Three White Soldiers pattern in a downtrend.
Step 2 – When market prints the Three White Soldiers, our next step is to check the RSI indicator. If the RSI indicator is at the oversold area and gives a sharp reversal, it means that both of the trading tools support the buying entry in any underlying currency pair.
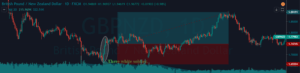
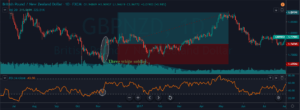
In the example below, GBPNZD was in an overall downtrend. At first, market prints the Three White Soldiers pattern, and the RSI was at the oversold area. This condition indicates a potential trend reversal. We can see that the pattern candles are quite strong, and the RSI indicator also supported our strategy. This aspect creates an illusion for novice traders to take the trade immediately. However, it is not a good way to enter the trade. We suggest you always wait for 2-3 candles to confirm the stability of the pattern.
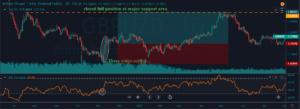
 Step 3 – Step Loss & Take Profit
In this example, we have put the stop loss just below the low of the first candle of three green candles. When two leading trading tools indicate the same signal, always use smaller stops so that you can maximize your profits.
For this strategy, there are several ways to book the profit. We can close our position at a significant resistance area or when the RSI indicator reaches the overbought area. If your plan is to ride the longer moves, we suggest you closing your position when the market prints the Three Black Crows patterns. This pattern is the complete opposite of the Three White Soldiers pattern.
The example below belongs to the daily chart. Keep in mind that stronger the support/resistance area on the higher timeframe, more chances the market has to respect that area. In our example, the last time price respects the resistance line, so we decided to close our full position at a resistance area. Overall it was 1500+ pip move on the daily chart. These kinds of higher timeframe trades are suitable only for big investors.
In this strategy, we have paired the Three White Soldiers pattern with the EMA to filter out the bad trading signals. EMA stands for Exponential Moving Average. The EMA is used to highlight the current trend and to spot the trend reversals. Trading signals can also be generated when the EMAs are read correctly. Generally, when the EMA goes above the price action, it indicates a sell signal, and when it goes below the price action, it indicates a buying signal.
Step 1 – Of course, the first step here is to identify the Three White Soldiers pattern on the charts.
Step 2 – When market prints, the Three White Soldiers, and EMA go below the price action, it indicates the buying signal.
In the below EURAUD weekly Forex chart, when the market prints the Three White Soldiers pattern, EMA was also below the price action. This indicates a potential price reversal of this currency pair. Even when both the pattern and EMA indicates the signal, we decided to wait for 3 to 4 candles to confirm the strength of the pattern. We can see that the market holds there for a couple of candles, which is a clear cut sign to go long on this pair.
Initially, the market goes higher for some candles, but it didn’t reach our major target. Our position goes into the loss a couple of times. Do not panic and lose trust in your strategy because the price didn’t hit the stop loss yet. Trading is a game of patience and only close your position when the market hit the stop loss or take profit. In this case, waiting patiently led to fruitful results as our trade hits the take profit.
Step 3 – Stop Loss & Take Profit
In the above chart, we have placed the stop loss above the exponential moving average because it works as a dynamic support/resistance to price action. We closed our full position when EMA goes above the price action.
Most of the times, Three White Soldiers pattern appears at the end of a downtrend. Sometimes it also prints after a lengthy consolidation phase. Although it is not a strong bullish sign if you want to trade the consolidation phase, always pair this pattern with other technical tools to filter out the negative signals. The volume is the most critical thing to enhance the reliability of the pattern when the market is in a consolidation phase.
Introduction NZDCAD is the abbreviation for the currency pair New Zealand dollar against the Canadian dollar. It is referred to as a cross-currency pair. Here, NZD is the base currency, and CAD is the quote currency. In this article, we shall be going over everything you need to know about this currency. Firstly, let’s get […]

Introduction NZDCAD is the abbreviation for the currency pair New Zealand dollar against the Canadian dollar. It is referred to as a cross-currency pair. Here, NZD is the base currency, and CAD is the quote currency. In this article, we shall be going over everything you need to know about this currency. Firstly, let’s get […]
NZDCAD is the abbreviation for the currency pair New Zealand dollar against the Canadian dollar. It is referred to as a cross-currency pair. Here, NZD is the base currency, and CAD is the quote currency. In this article, we shall be going over everything you need to know about this currency. Firstly, let’s get started by understanding what the value of NZDCAD depicts.
Comprehending the value of a currency pair is simple. The value of NZDCAD determines the Canadian dollars that must be paid to buy one New Zealand dollar. It quoted as 1 NZD per X CAD. For example, if the current value of NZDCAD is 0.86595, then 0.86595 CAD is required to purchase one NZD.
Spread is the primary way through which brokers make revenue. They have a different price for buying and selling. The difference between these prices is called the spread. It varies from broker to broker and their execution type.
ECN: 1 | STP: 1.8
For every execution, there is a fee levied by the broker. This fee is also referred to as the commission on a trade. It is nil on STP accounts. And on ECN accounts, it is usually within 6 to 10 pips.
Slippage is the variation in the price executed by you and the price you actually received. It happens on market orders. Slippage depends on two factors:
The trading range is a tabular representation of the pip movement in a currency pair in various timeframes. These values help in assessing the risk-on trade as it determines the minimum, average, and maximum profit that can be made on a trade.
Cost a percentage of the trading range is an excellent application of the above table. By manipulating the values with the total cost, the variations in costs in different at different volatilities and timeframes can be calculated. For this, the ratio between the total cost and pip movement is found out and represented in percentage.
Spread = 1 | Slippage = 2 |Trading fee = 1
Total cost = Slippage + Spread + Trading Fee = 2 + 1 + 1 = 4
Spread = 1.8 | Slippage = 2 | Trading fee = 0
Total cost = Slippage + Spread + Trading Fee = 2 + 1.8 + 0 = 3.8
There are two variables here, namely, timeframe and volatility. By varying these two, the variation in the total cost is examined. Note that the higher the percentage, the higher is the cost on a trade and vice versa. From this, we can make out that the prices are high when the volatility is low. And prices are low when volatility is high. Also, as the timeframe widens, the cost decreases.
It is not ideal to trade when the volatility is high, as it is risky. It is also not the best choice to trade when the volatility is low, as the costs are high. So, to keep a balance between both volatility and cost, it is ideal to trade when the pip movement of the pair is around the average values.
Talking about timeframes, trading the 4H or the Daily would be great, as the cost is bearable, and the trade wouldn’t take too long to perform as well.
Another simple hack to reduce cost is by trading using limit/pending orders instead of market orders. This will significantly reduce costs on a trade because the slippage on the trade becomes 0. It is observed that the cost reduces by about 50% of the original value. Below is a table representing the cost percentage when the slippage is made zero.
https://youtu.be/QcbJj5nxnLY
https://youtu.be/QcbJj5nxnLY
How to get an Edge using Statistical Thinking I
Do you know the difference between institutional traders and the average retail trader?
Well, there are many obvious differences, including the capital available to them. Still, the most significant factor is that you blindly believe in technical analysis, whereas they use other higher-level techniques to be ahead of them, ahead of you.
The mathematician is highly paid in the financial markets for a reason: They make the real difference. The marketplace is a battlefield, and quant analysis is analogous to smart drone attacks, whereas trading using TA is like fighting with spears and arrows.
But I don’t have that software!
Of course, pros use large databases and sophisticated analytical software, machine learning, and so forth. If you are serious about trading, you should consider creating your custom analytical software. The use of high-level languages such as Python in combination with Pandas, a terrific statistical package, and a bit of code, would put you into the next level. Still, with patience, dedication, and a spreadsheet, you could collect your own information. Excel also included quite a decent statistical package.
Metatrader 4 to Excel
It is possible to automate your data capture from your MetaTrader 4. MetaTrader 4 has a DDE Link. It is straightforward to get it done.
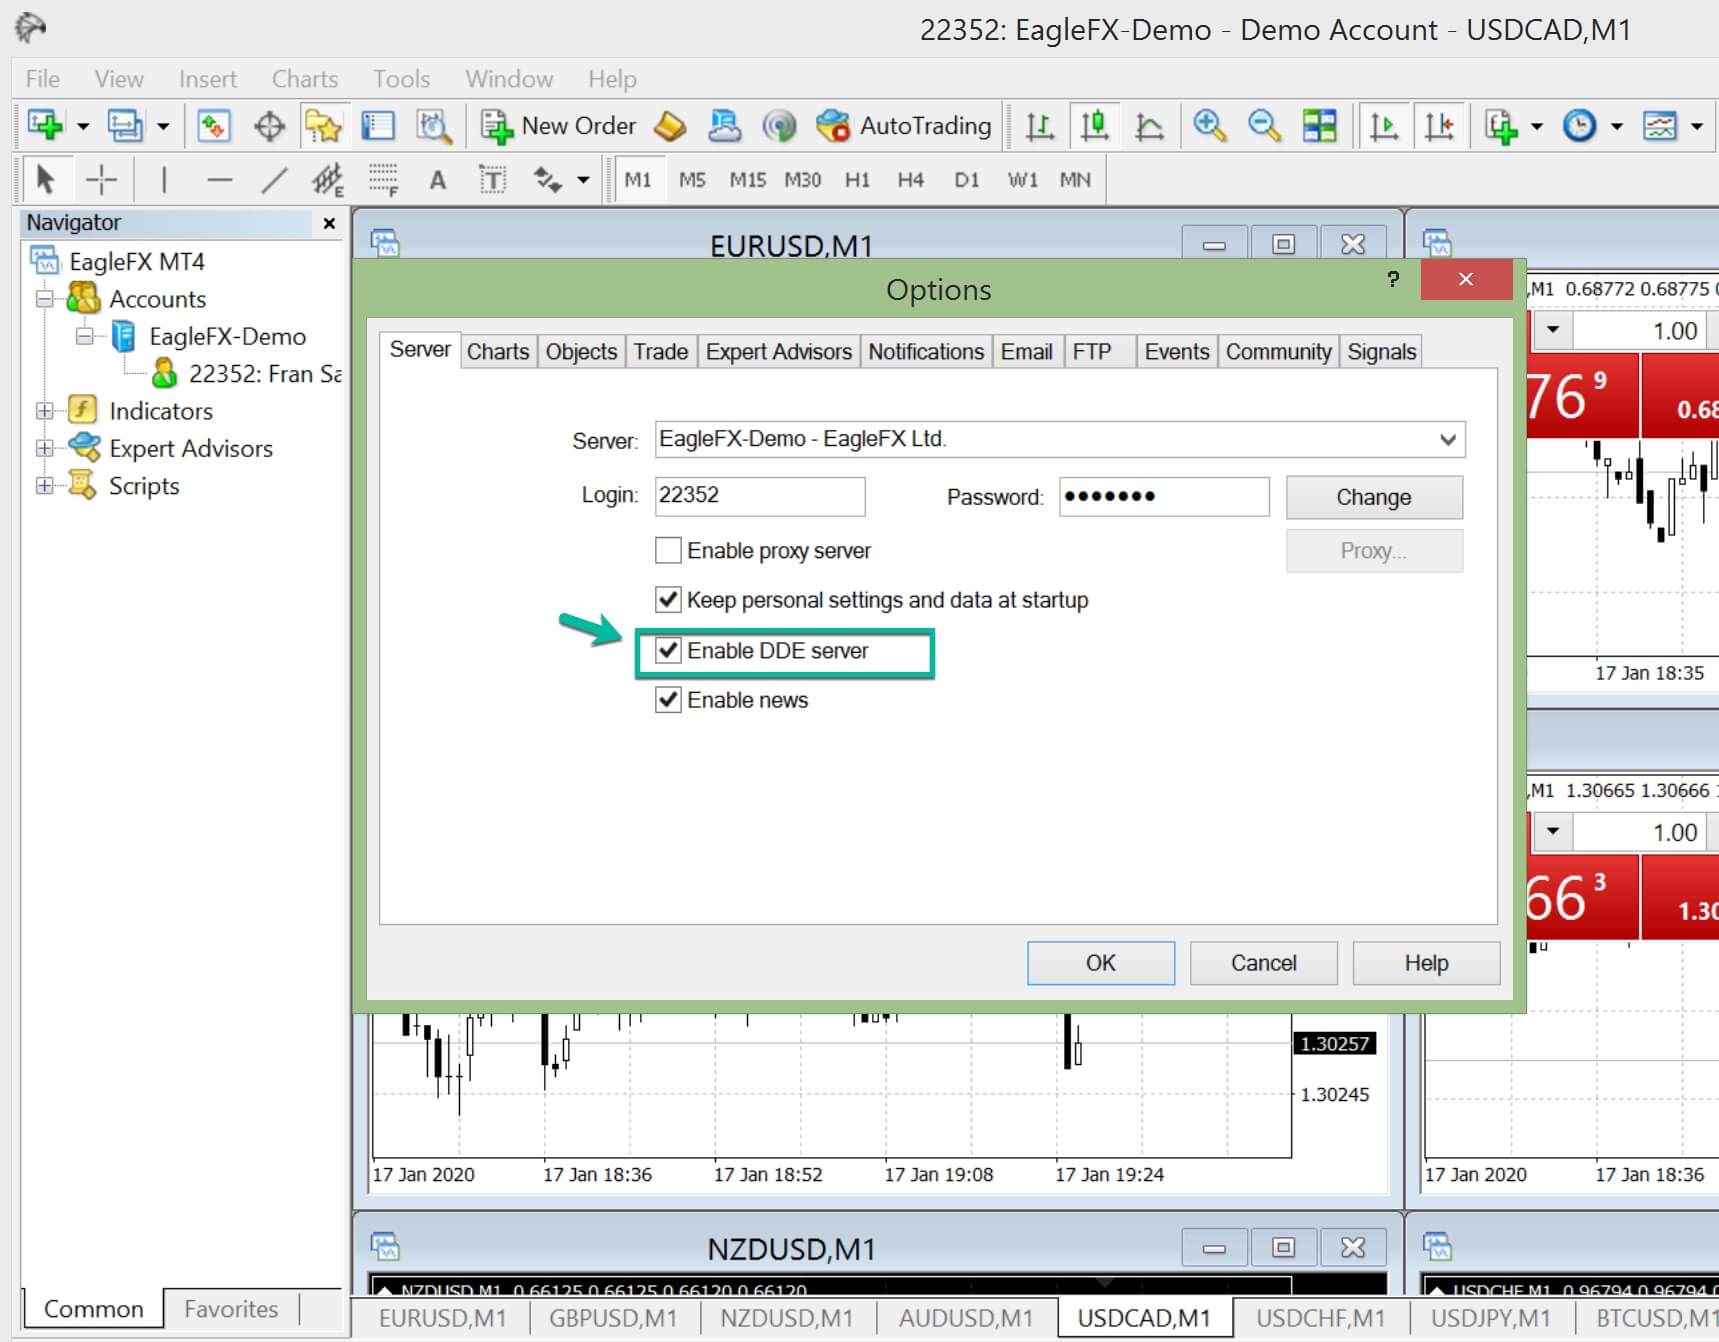
You simply need to enable the MT4 DDE server and place a simple code in the corresponding Excel cells.
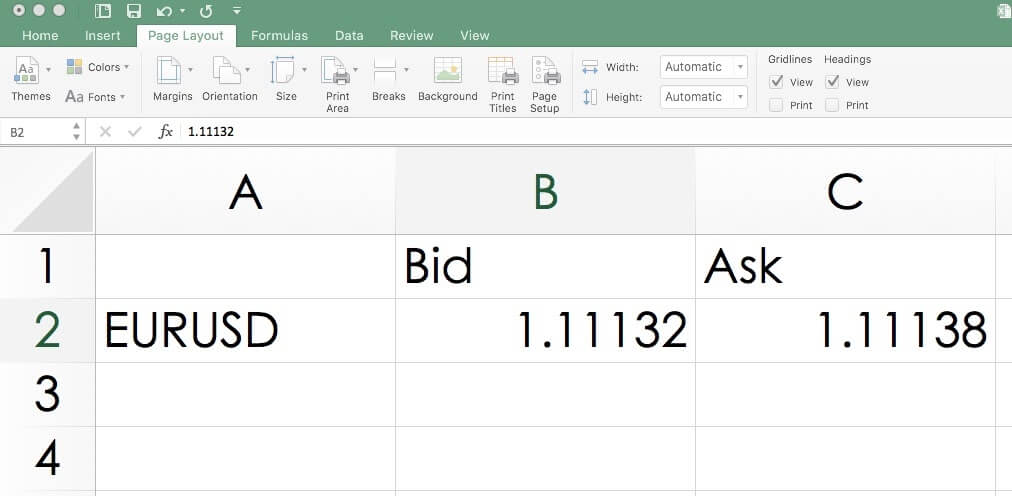
=MT4|BID!EURUSD
=MT4|ASK!EURUSD
=MT4|HIGH!EURUSD
=MT4|LOW!EURUSD
=MT4|TIME!EURUSD
Average Trading Ranges
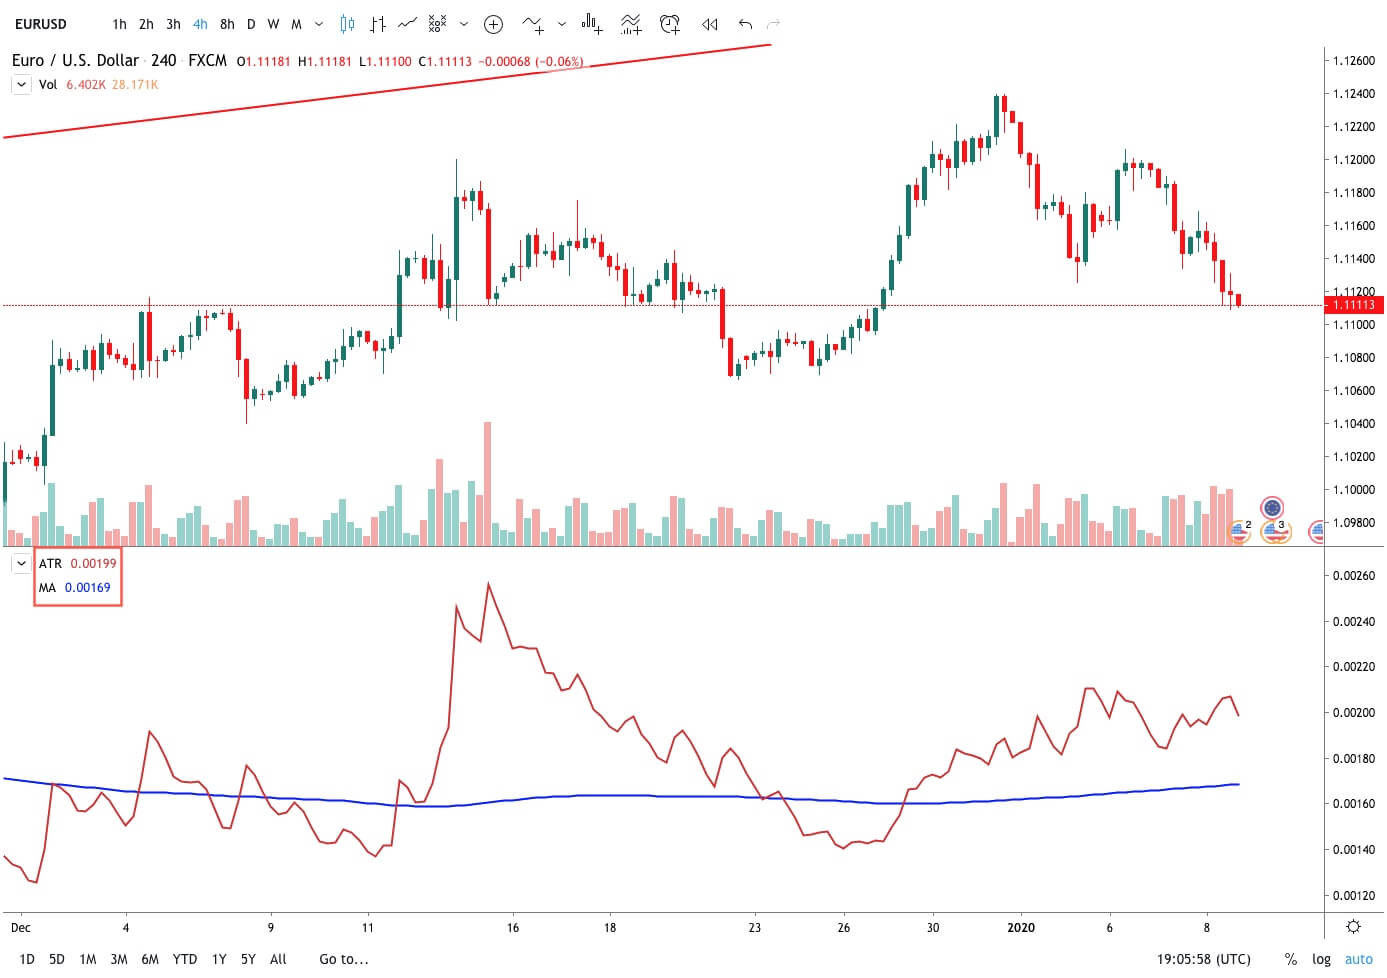
Determine trading ranges can be accomplished using the Average True Range Indicator (ATR). There is no need to collect data to use it, and it will provide you the basic information to know a lot of things. Using a short-term value such as a 10-period ATR will tell you of the Forex pair you intend to trade is experiencing a period of low or high volatility, or if its current range can be considered as normal. This knowledge will show you several interesting facts that may decide if it is worth trading or not.
1.- The ATR is the average range for the period. Therefore, it tells you the expected movement of the timeframe of your chart. So it is at the same time, your risk and your potential profit per timeframe. It tells you several pieces of information:
Your stop loss pip distance divided by the current ATR will say to you the average time it will take the market to reach your stop. For example, in a 4-Hour chart, if your stop-loss is 10 pips away and your STR is 16 pips, you know the average time a bad trade will take to reach your target is 10/16 x 4hours = 2.5 hours.
Your profit distance divided by the current ATR will tell you the average time it will take your trade to reach your target.
Your trading costs, Spread+ Fee+ Slippage multiplied by the profit to ATR ratio computed above, divided by the ATR and multiplied by 100 will tell you the percentage of the projected profits are needed to break-even.
That value will help you to decide the best timeframe for your needs. If you’re aware of the overall cost of the operation, you may realize your mostly working for your broker and that a better timeframe is needed or that the current market ranges are not suitable for trading.
Determining turning points and the concept of range_stats
Now, if we collect the averages of trading ranges, we can get a lot of more exciting insights about the market.
What if we could get a real edge over the market, statistically relevant and profitable long term?
Going back to our previous video about the Normal Distribution, we talked about the Central Limit Theorem. This theorem says that the average value of a collection of samples will be normally distributed.
If we apply this concept to a collection of ranges, we will get a Bell-shaped curve, including its statistical properties.
UP and Down Ranges
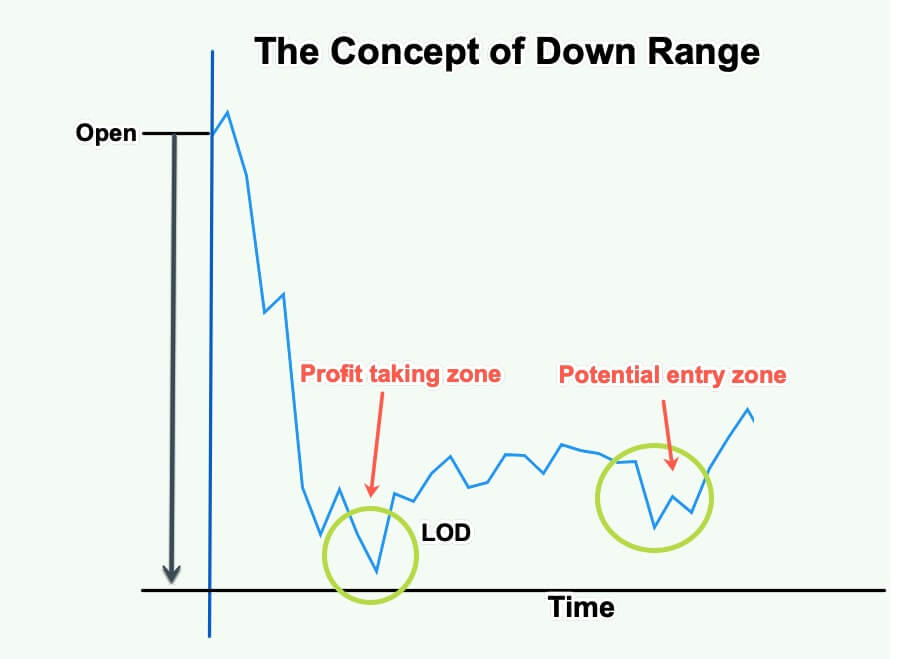
If we have our data collected, we could compute the average range from the opening of our session to the low of the session. Let’s call this piece of data the Down_Range.
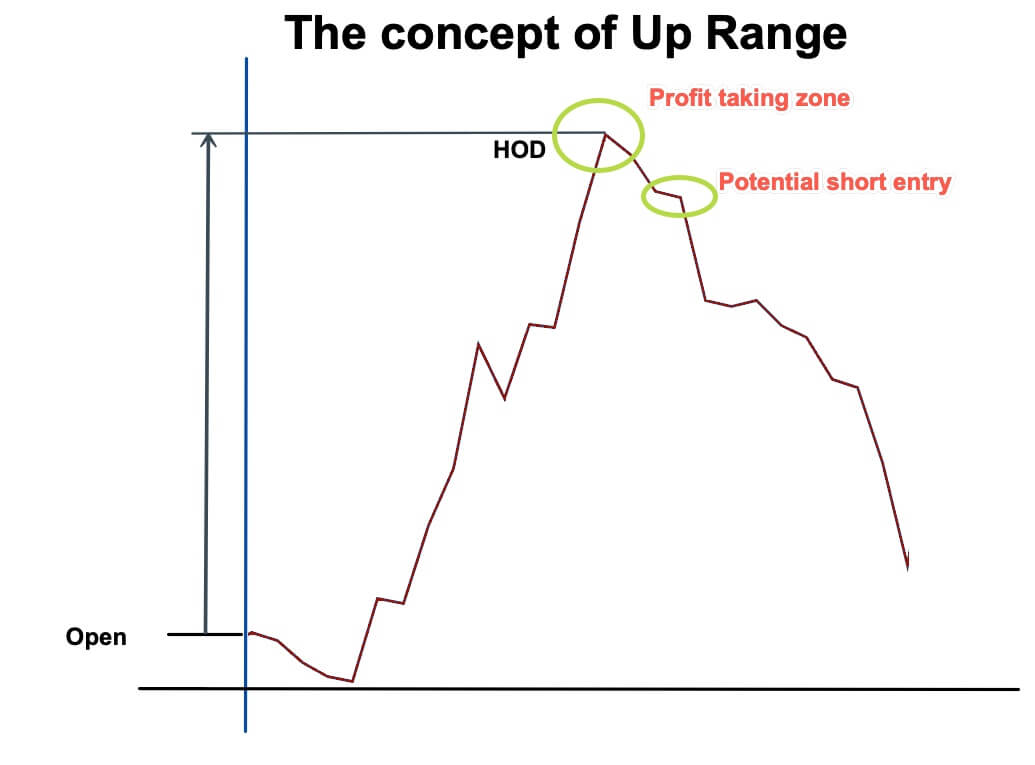
We can do the same for the gain data. That is the range from the opening to the high of the session. That will be called the UP_Range.
If we store the UP__Range and the Down_Range measurements, we can compute the average of the last 30, 50, or 100 days and its standard deviation (SD) and apply some statistical thinking on it.
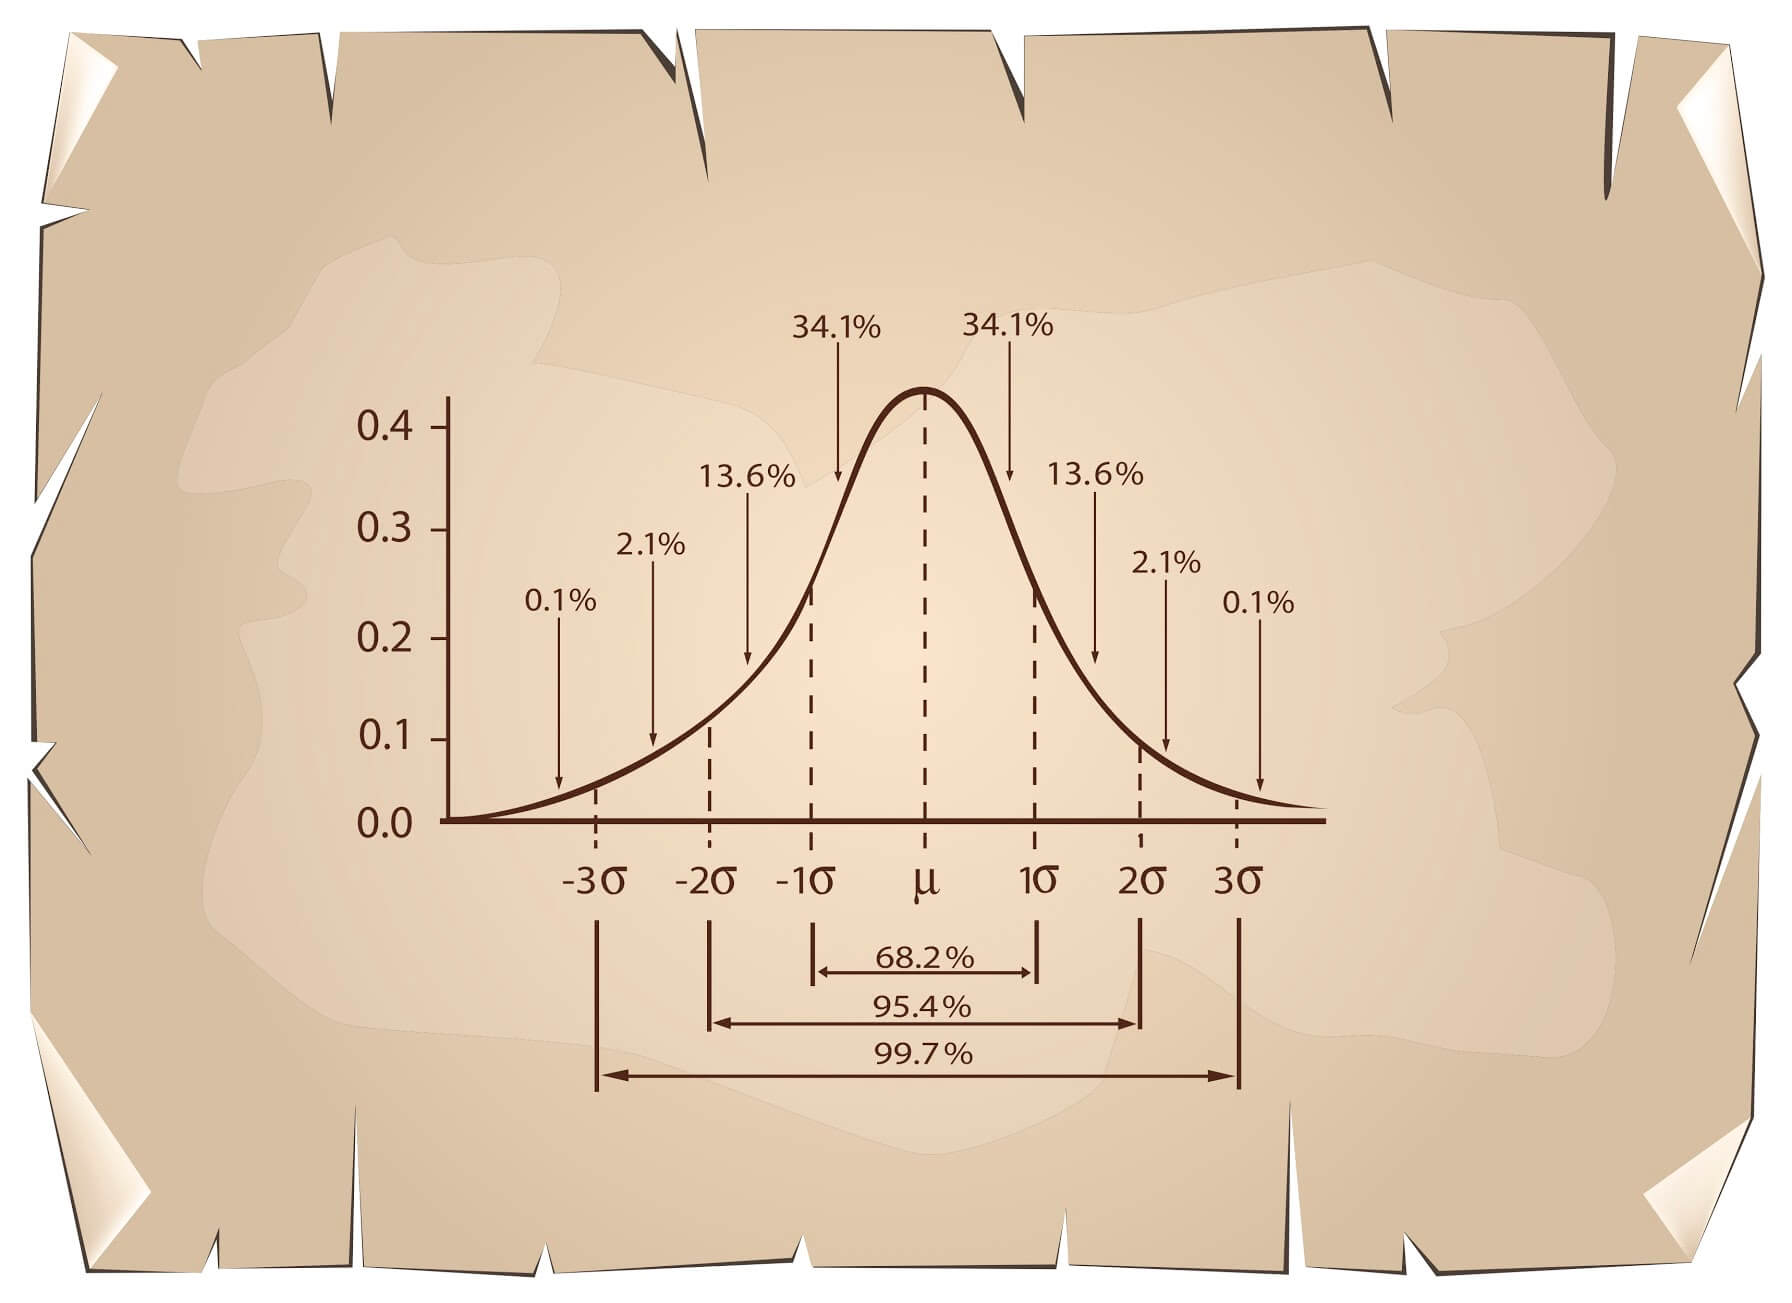
In our previous lesson about the Normal Distribution statistical properties, we’ve learned that 68.2% of the data points belonging to a Normal distribution are located in the region between the average plus and minus one SD. That means only 31.8% of the data points are beyond that area. And looking to the right side, only 15.9% of the ranges are higher than the average plus one SD.
On this fact lies our trading edge: Our data collection of Up and Down ranges tells us how far, on average, the asset moves before turning in the opposite direction.
Thus, our TA signals will be much more statistically significant when the UP or Down typical range has been exceeded by 1SD, there is a high likelihood the currency pair is reversing.
Taking profits can also be aided by this type of strategic information, as we could compute the typical range the asset moves after turning in the opposite direction and apply it to our trade setting.
More on Statistical thinking in our next video.
Reference: Ken Long Tortoise Methods
In the previous article, we presented the wave identification process starting with the segment as the basic unit of the price movement. In this educational article, we will introduce some rules to support the preliminary analysis.

In the previous article, we presented the wave identification process starting with the segment as the basic unit of the price movement. In this educational article, we will introduce some rules to support the preliminary analysis.
In the previous article, we presented the wave identification process starting with the segment as the basic unit of the price movement. In this educational article, we will introduce some rules to support the preliminary analysis.
When an Elliott wave analyst decides to study a financial asset, he tends to choose a specific timeframe, and in consequence, he will visualize a defined group of waves. However, in view that the speed of price changes across time, the analyst must be flexible in the timeframe selection process.
The psychology of masses changes over time; this phenomenon can be reflected in the speed of price, making a market more volatile in a specific moment than another. For this reason, it is useful to analyze using different timeframes.
R.N. Elliott, in his work “The Wave Principle,” exposes the importance of selecting different timeframes when the speed of price doesn’t allow us to visualize the different waves adequately.
Before starting to analyze the price through time, it is essential to distinguish the concept of directional and non-directional movement. The directional move contains a group of segments that produces a global increase or decrease in the value of a financial asset.
When the price action runs in a directional movement, the segment that moves in the opposite direction of the previous move, never retracing beyond the 61.8% Fibonacci level of that movement.
The following chart illustrates the concept of directional and non-directional movement. The GBPJPY cross in its 2-hour chart exposes the bearish directional movement started on December 13th, 2019, when the price reached 147.954 and ended when the price found support at 141.161 on December 23rd, 2019.
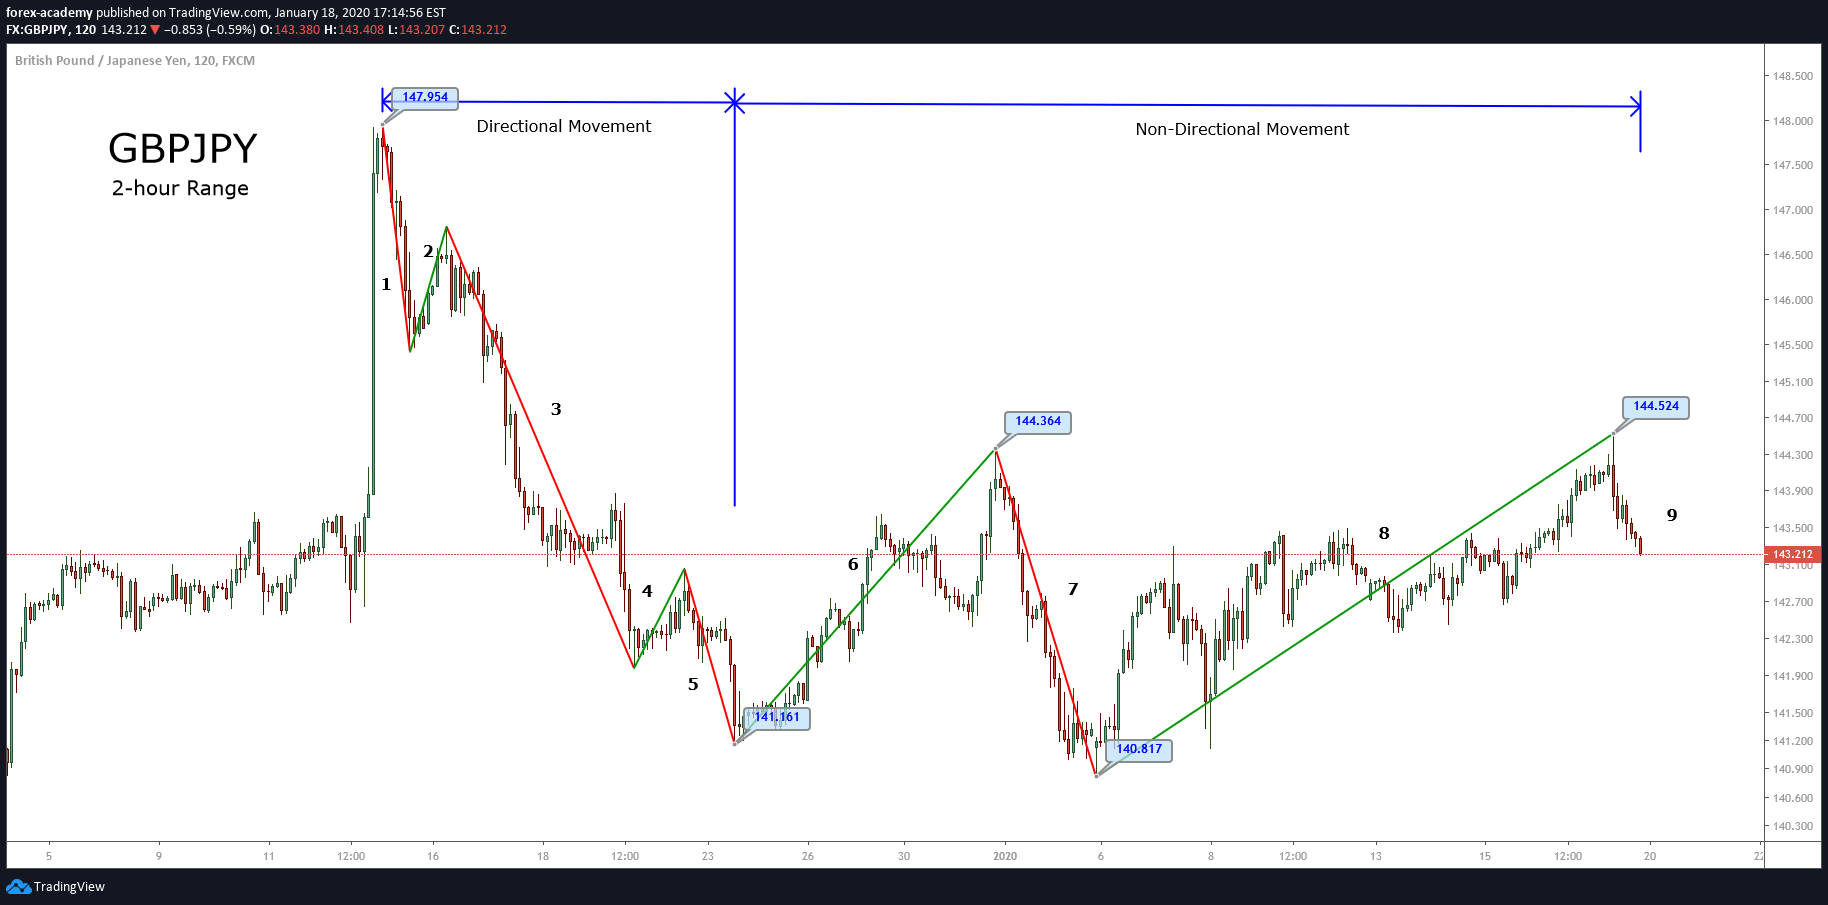
The bearish directional movement ended once the segment identified as “6” surpassed the origin of the last bearish section tagged as “5”.
The sixth segment climbed until 144.364, from there, the cross found fresh sellers, which drove its price to a new low at 140.817. This non-directional movement is identified as the segment “7”.
After this new support, GBPJPY bounced in a segment identified as “8” until 144.524, being the third segment of the non-directional sequence. Currently, the price is retracing in a bearish segment that still is active.
The price moves following a rhythm that changes through time. Sometimes, in a different timeframe, it isn’t straightforward to visualize the Elliott wave formations, in this case, the wave analyst has to be flexible to select a different timeframe to develop its study.
The identification of directional and non-directional movements will allow the analyst to understand and follow the rhythm of the market.
– Neely, Glenn. Mastering Elliott Wave: Presenting the Neely Method. Windsor Books. 2nd Edition.
Hello there,

Hello there,
Hello there,
We hope you guys are following the course well. We have done with Course 2.0, and we quickly want to sum up the concepts we have discussed in this course. Also, this article will act as a guide for you in finding any particular articles or for a quick overall revision. Basically, this is a quick navigation guide of Forex Course 2.0.
We have started this course by understanding one of the most important parts of the Forex Industry – Brokers. We also learned the different types of brokers, tips to pick the right broker, and whom to stay away from. We have also understood the different types of analysis that are used by retail traders like us to forecast the price of a currency in the Forex Market. Below is the link for each of the lessons we have published.
Brief History and Introduction to The Forex Brokers – Link
Types 0f Brokers in the Foreign Exchange Market – Link
Two Types of ‘No Dealing Desk’ Brokers – Link
Understanding the Concept of Spreads in Forex – Link
Two Different Types Of Spreads In The Forex Market – Link
Picking A Genuine Forex Broker 101 – Link
How to stay away from the Forex Bucket Shops – Link
Steps Involved In Opening A Forex Trading Account – Link
Analyzing The Forex Market – Fundamental Analysis – Link
Analyzing the Forex Market – Technical Analysis – Link
Analyzing the Forex Market – Sentimental Analysis – Link
Which is the best way to analyze the market? – Link
So with that, we have ended our course 2.0. The upcoming course 3.0 is the most valuable course we will be providing at Forex Academy. The entire course is going to deal with the Technical Analysis right from the fundamentals. This course is designed by the top price action traders in the industry, and we are super excited to start rolling out this course for our readers. Are you excited too? Stay tuned!
We hope you find this comprehensive guide useful. Let us know if you have any questions regarding Course 2.0 in the comments below. Cheers!
Introduction
Introduction
GBPNZD is the abbreviation for the Great Britain pound against the New Zealand dollar. Here, the pound is the base currency, while the New Zealand dollar is the quote currency. Though it is not a major currency, it has considerable volatility and liquidity.
The value of GBPNZD represents the value of NZD equivalent to one pound. It is quoted as 1 GBP per X NZD. For example, if the value of GBPNZD is at 1.9677, then to buy one pound, the trader has to pay 1.9677 NZ dollars for it.
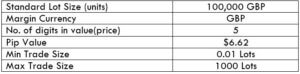
Spread is the medium through which brokers generate revenue. They set two different prices for buying and selling a currency pair. The difference between the prices is their profit. This difference is referred to as the spread. The prices usually vary from type of account model.
ECN: 1.2 | STP: 2.1
The fee is basically the commission on each trade a trader must pay. Typically, there is no fee on STP accounts, but a small fee on ECN accounts. The fee is usually between 6 and 10 pips.
Slippage takes place when positions are opened/closed using market orders. The trader wishes to pay a specific price, but in reality, he receives a different price. And the difference between these two prices is called slippage.
The trading range is the depiction of the pip movement of a currency pair on different timeframes. With it, one can analyze how many dollars they can win/lose in a given timeframe. For example, if the average pip movement on the 1H timeframe is 30 pips, then you will either be in a profit of $198.6 or a loss of $198.6 in an hour. Knowing this, a trader can plan their lot sizes accordingly.
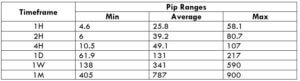
Having knowledge of the cost of the trade is necessary. Note that the cost varies based on the volatility and the timeframe traded. So, it becomes vital to know when the right moments to enter the market are. Below are two tables illustrating the total costs as a percentage for varying timeframes and volatility.
Spread = 1.2 | Slippage = 2 |Trading fee = 1
Total cost = Slippage + Spread + Trading Fee = 2 + 1.2 + 1 = 4.2
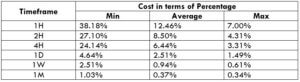
Spread = 2.1 | Slippage = 2 | Trading fee = 0
Total cost = Slippage + Spread + Trading Fee = 2 + 2.1 + 0 = 4.1
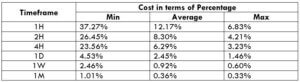 The Ideal way to trade the GBP/NZD
The above tables show that the costs are high in the min column and low in the max column. The higher the value of the percentage, the high is the cost. So, this means that the costs are high for low volatility markets and vice versa. It is neither ideal to trade during low volatility nor during high volatility. To have an equilibrium between the costs and the volatility, it is best to enter the market when the volatility is around the average mark.
Slippage is a parameter for calculating the total cost. It has a great weight in the total cost. However, there is a way to minimize and nullify it. This can be simply be done by trading using limit orders instead of market orders.
Bitcoin mining was Satoshi Nakamoto’s idea to release new Bitcoins into circulation only after solving some complex puzzles. The mining system, which verifies transactions after ten minutes, was so designed in order to secure the network. And as Bitcoin has become more popular, so has mining increased.

Bitcoin mining was Satoshi Nakamoto’s idea to release new Bitcoins into circulation only after solving some complex puzzles. The mining system, which verifies transactions after ten minutes, was so designed in order to secure the network. And as Bitcoin has become more popular, so has mining increased.
Bitcoin mining was Satoshi Nakamoto’s idea to release new Bitcoins into circulation only after solving some complex puzzles. The mining system, which verifies transactions after ten minutes, was so designed in order to secure the network. And as Bitcoin has become more popular, so has mining increased.
But if Bitcoin’s future depends on mining, that future becomes harder to picture every day. This is because mining presents various challenges that make the Bitcoin network less safe and not decentralized as Satoshi envisaged. Also, mining is incredibly expensive and not good for the environment.
Is there an alternative? This is the question nagging many Bitcoin fans.
As it turns out, photonic chips could be the answer.
Let’s take a more in-depth look into Bitcoin mining, what photonic chips are, and if the technology is enough to replace Bitcoin mining as we know it.
Bitcoin mining has a bit of fascinating history. After Bitcoin took a dramatic dip from $17,000 to less than $7,000 at the end of 2017, the overall sentiment was Bitcoin was done. But the cryptocurrency’s mining appeared to be unshaken by what was happening with the price. This meant the value of Bitcoin trumped the costs associated with mining it. In other words, Bitcoin was still profitable.
In the next year, miners continued scoring big. But in November 2018, Bitcoin plummeted from around $6500 to less than $3500. This plunge was what did it for many miners. Bitcoin simply wasn’t profitable enough now. Because many miners checked out, the crypto’s hash rate took a plunge too – going from 60 exa-hashes/sec to 35 exa-hashes/sec.
The drop in Bitcoin’s price and the consequent decline in hash rate had certain ramifications for Bitcoin. For one, this meant mining would almost be confined to regions where electricity was cheap – mainly Western China. Consider too that around this time, China was cracking the whip against cryptocurrencies, a fact that drove cryptocurrency-based businesses to set up in other countries.
What did this mean for Bitcoin? First off, the “centralized” mining, as opposed to mining being geographically diverse, was a threat to the very core tenet of Bitcoin – decentralization. And the cold legal reception in the very region where Bitcoin could be mined posed a threat to its very existence.
Since then, looking for alternatives to Bitcoin mining has become the vocation for some Bitcoin enthusiasts.
Apart from the existential threat to Bitcoin, there was always another persistent problem with Bitcoin mining. While Satoshi Nakamoto devised the computations to increase security for the network, what he may not have envisioned was the massive power bills. And when more people learn about Bitcoin, the more they seek it out, and the more the energy used goes up.
Bitcoin mining is so power-hungry that it gobbles up over 75 terawatt-hours a year. The enormity of this might not register until you learn that this is above the annual power consumption of entire countries such as Austria. For the mere expense and the impact this has on the environment, mining is simply not sustainable.
To solve the mining problem, a team of researchers comprising Michael Dubrovsky (co-founder of PoWx), Marshall Ball of Columbia University, and Bogdan Penkovsky of the University of Paris-Saclay have proposed better mining technology. Dubbed “optical proof of work,” oPoW is a laser technology that involves using a more energy-efficient approach to mining.
The idea is to “fix” Bitcoin mining as it is and return mining to “the people” as opposed to a small concentrate of individuals in one corner of the world. Another end goal is to make Bitcoin mining a more profitable venture. Current specialized computers go by the thousands in dollars – and they are not designed to be used for much else.
Photonic chips are small optical computers made of integrated circuits and that rely on photons (using light beams to generate energy) rather than electrons.
Also known as lightwave technology, photonics is not nearly a new concept. The term “photonics” goes back to 1967 when the French physicist, Pierre Aigrain, coined it to describe the result of harnessing light to emit energy. There are countless applications of the technology today – in IT, healthcare (biophotonics), manufacturing, sensing, lighting, solar power, space technology, and so on.
Dubrovsky and the team want to introduce photonics to Bitcoin mining. Instead of the power-guzzling ASIC miners, they hope that optical computers will use way less energy.
Mining using photonics will mean changing Bitcoin’s mining algorithm. The team hopes to replace Bitcoin’s encryption protocol with one they call HeavyHash. HeavyHash is optimized for photonic computers and will replace the SHA256-based PoW (HashCash.)According to the team, this new algorithm will lower the barrier to entry to Bitcoin mining, democratize Bitcoin, and massively help the world save power.
Beyond these ambitions, oPoW would stabilize the cryptocurrency’s hash rate, so it’s not so vulnerable to price falls. In short, whether Bitcoin’s price declines or not, miners would still make profits.
While the oPoW plan sounds ambitious, it has its share of challenges.
The energy-efficiency of photonic chips is not clear cut. Some photonic applications, for instance, optical switches and photonic circuits, use round-about applications to function. These applications increase the energy use of photonic chips. The researchers have not predicted how much energy the chips will save. It’s hard to know what this means for oPoW at this stage, and if it will be a power-saving option after all.
The team is also yet to prove how oPoW will address the problem of different regions having different power costs. Hardware costs will rise in the future, not decrease. So finding cheaper sources of energy may be a better solution.
Consider for a moment that oPoW proposes to change the fundamental mining algorithm of Bitcoin. That comes with drastic ramifications, both positive and negative.
If implemented, an oPoW system would, first of all, break China’s control of Bitcoin mining farms. In turn, mining would now be concentrated in technologically advanced countries. Countries that are ahead in photonic technology would benefit the most. As you can see, this would not be the democratization of Bitcoin mining that the researchers imagine.
Drops in Bitcoin’s price would not mean a reduction in hash rate. Whichever way the price goes, miners will continue to enjoy a payday.
There is a lot of chatter about current miners creating some sort of “price floor.” An oPoW implementation would sink this floor further in the event of a bearish market since mining costs would be lower. This would likely influence Bitcoin’s price to gravitate towards the bearish end.
As it stands now, it’s hard to be enthusiastic about oPoW, especially with the many gaps in how it will improve the current system. Sentiments are rife within the Bitcoin community that the technology is likely to only be a temporary fix. The team itself has not specified how much power the chips would save. So while the concept looks good on paper, it’s probably not sufficiently innovative to solve one of Bitcoin’s long-running challenges. It’s up to the team to prove the Bitcoin community wrong on this one.
The Head And Shoulders Pattern

The Head And Shoulders Pattern
Of all the patterns that exist in any market, the most well known is the Head And Shoulder Pattern. Kirkpatrick and Dahlquist’s book, Technical Analysis, detailed many studies on the performance of this pattern. The result of all the data is that the Head And Shoulder Pattern is the most profitable of all standard patterns. Interestingly, Dalquist and Kirkpatrick made no distinction between the performance of the head and shoulder pattern and the inverse head and shoulder pattern (sometimes called the bottom forming head and shoulder pattern). While this pattern is successful across many markets, it is also the pattern that causes the most losses to new traders. We’ll get into the specifics of why this pattern destroys a good number of traders. First, we need to understand what the pattern is.
The image above shows two head and shoulder patterns, the regular pattern and the inverse pattern. It just so happened that the daily chart of the AUDUSD conveniently had both of the patterns right next to each other – not a common occurrence. Now, you can and will read a lot of rules and theories behind the head and shoulder pattern. I could go into the behavior of this pattern, the psychology behind the three triangles that make up the broader pattern, the symmetrical nature of the left and right shoulders, etc., etc., etc., but we don’t need to complicate a pattern that can be very easily understood.
There’s a great book by Larry Pesavento titled Trade What You See. While the book Trade What You See is focused primarily on Harmonic Patterns, the title always stuck with me. If you were to stand in front of a mirror, you would more than likely notice the symmetrical nature of your left and right shoulders (unless you’ve had some significant injury or disease. There’s a good number of people who believe that both the right and left shoulders need to be as exact as possible – but this isn’t necessary.
Here’s a simple rule to follow:
If it doesn’t look like a human head and shoulder, then it probably isn’t a head and shoulder pattern.
Are you familiar with the poker game Texas Hold’em or any other form of poker? There are several maxims that poker players follow, one of them is ‘Don’t chase the straight or the flush.’ Why? Because when you get dealt a hand that is missing just one card for your straight or one more suite to complete your flush, the odds are overwhelmingly against you getting that final card to complete the straight/flush. Head and shoulder patterns are the same way. The head and shoulder pattern is only complete when the neckline has been broken. Let me repeat that three times for you:
A head and shoulders pattern is not complete until the neckline is broken.
A head and shoulders pattern is not complete until the neckline is broken.
A head and shoulders pattern is not complete until the neckline is broken.
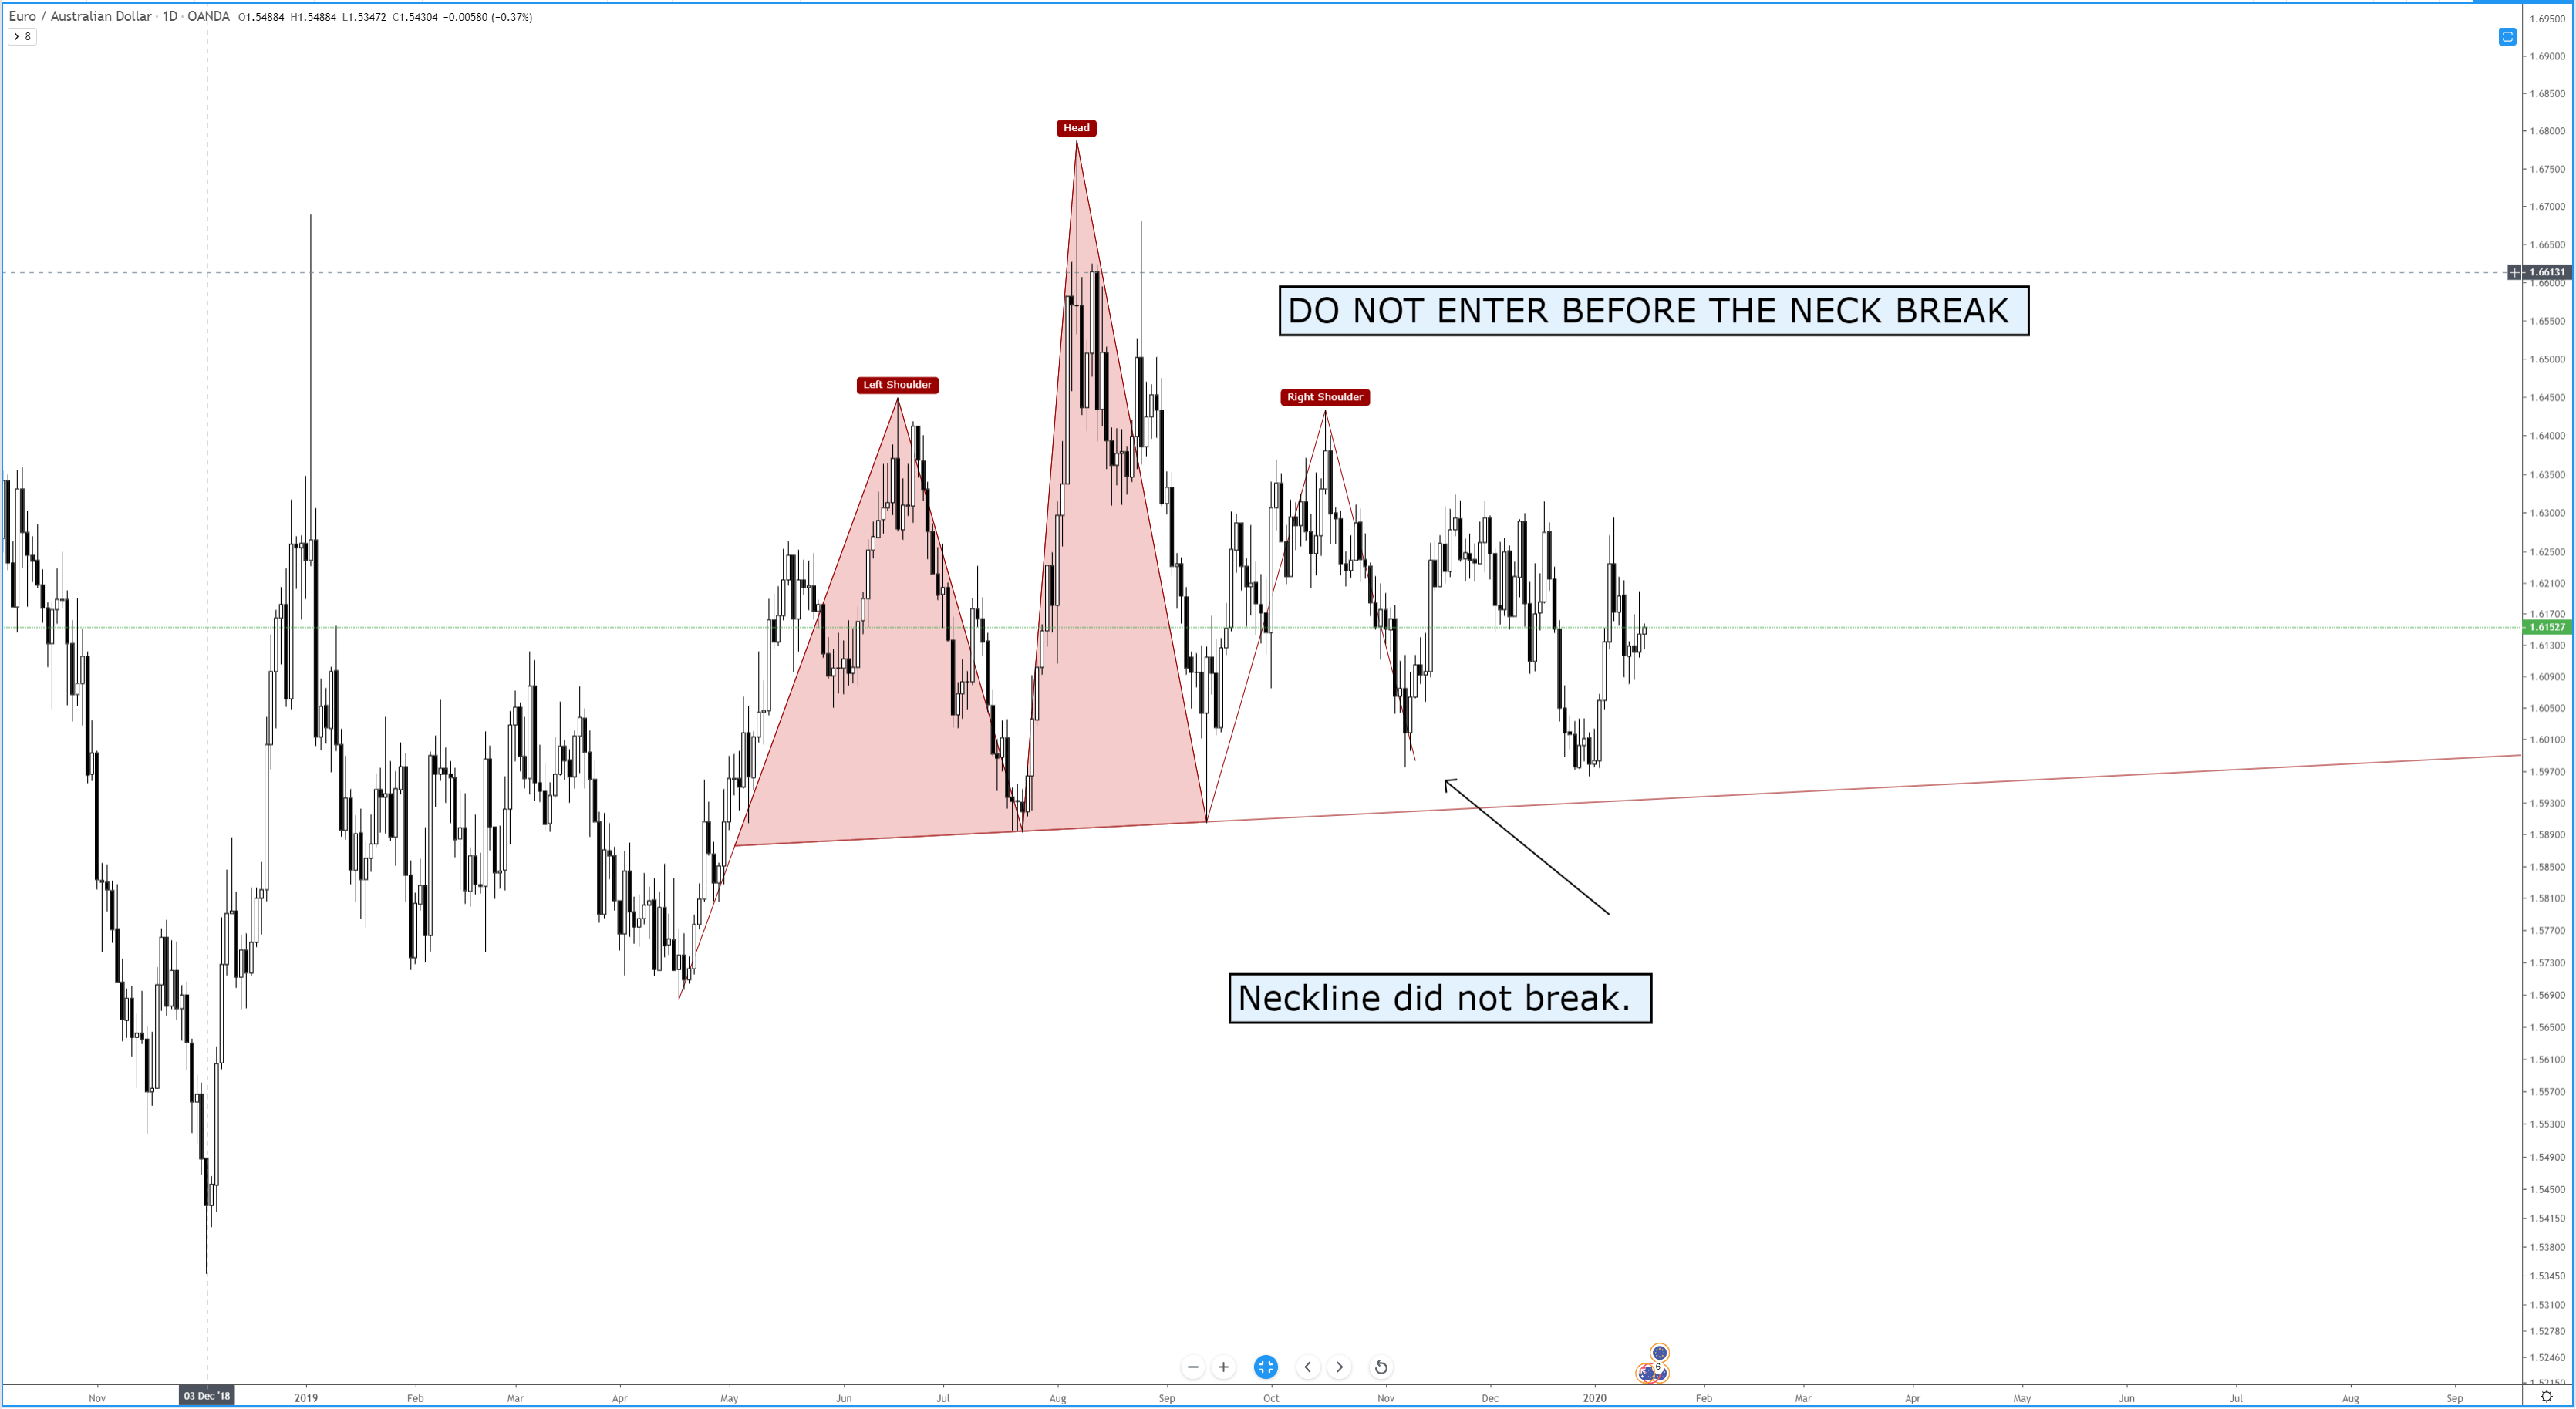
Many a trading account has been the victim of trying to anticipate the completion of a head and shoulder pattern, only to have it be broken. In addition to being the most profitable basic pattern, the head and shoulder pattern is also one of the most rejected patterns. We don’t chase straights or flushes in poker, and we don’t chase patterns in trading. In addition to the information above, here are some other factors that can help you interpret the head and shoulder pattern:
Sources:
Kirkpatrick, C. D., & Dahlquist, J. R. (2016). Technical analysis: the complete resource for financial market technicians. Upper Saddle River: Financial Times/Prentice Hall.
Bulkowski, T. N. (2013). Visual guide to chart patterns. New York, NY: Bloomberg Press.
Bulkowski, T. N. (2008). Encyclopedia of candlestick charts. Hoboken, NJ: J. Wiley & Sons.
Bulkowski, T. N. (2002). Trading classic chart patterns. New York: Wiley.
Environmental sustainability is an issue that keeps a lot of environment-conscious people awake at night these days. With scientists ringing the alarm louder than ever before, many people are becoming more aware of the need to participate in actions that contribute to a safer, cleaner environment. And with blockchain slowly taking over industries, it was […]

Environmental sustainability is an issue that keeps a lot of environment-conscious people awake at night these days. With scientists ringing the alarm louder than ever before, many people are becoming more aware of the need to participate in actions that contribute to a safer, cleaner environment. And with blockchain slowly taking over industries, it was […]
Environmental sustainability is an issue that keeps a lot of environment-conscious people awake at night these days. With scientists ringing the alarm louder than ever before, many people are becoming more aware of the need to participate in actions that contribute to a safer, cleaner environment.
And with blockchain slowly taking over industries, it was only a matter of time before we heard of the technology being tapped to mitigate the climate crisis. Its immutable record-keeping, transparency, and accuracy are just some of the qualities that make it an excellent tool for this end.
2local is a Netherlands-based entity that’s leading the way in the environmental-sustainability endeavor – while relying on a powerful blockchain-powered system. But 2local also seems to have other high ambitions in addition to saving the environment.
Let’s dig into the organization’s background, the intriguing way it hopes to integrate blockchain to promote environmental sustainability and its cryptocurrency, the L2L token.
2local is a blockchain-enabled platform running on the Stellar platform that seeks to promote environmental sustainability and growth and prosperity for all. On the platform, consumers can connect with companies that sell sustainable, locally produced, high-quality goods, and services. The platform operates on a cashback and loyalty system in which consumers, via the use of the native L2L stablecoin, can receive a cashback for purchasing goods from these companies.
Backed by professionals from the maritime, finance, tech, business, market research, entrepreneurship, and so on, the project seems poised to benefit from a wealth of experience.
2local operates on a three-pillar model to address what it terms as a “man-made crisis” of hunger, inequality, and climate change. These are “a local lens, a cashback system, both deeply rooted in blockchain.” Its local lens encourages companies to go local while encouraging people to buy these locally made products. The cashback system compensates people for purchasing locally made products, while the platform’s blockchain provides a fast, secure, and transparent system.
2local is the first company in the blockchain space to design a smart market model that connects businesses with the end-user, with both parties being given an incentive to preserve the environment.
All transactions on the platform are conducted via the platform’s native L2L token. L2L tokens can be stored in digital wallets specially designed for the platform. Set to be launched in 2021, L2L is an algorithm-based stablecoin, ensuring users can trade with it without the risk of volatility-triggered losses.
Using the L2L token gets users rewarded with a monthly cashback. Also, when you use the token, you save on high transfer fees.
Countless studies continue to show that global temperatures have reached new highs thanks to man-made carbon emissions. Blockchain has been touted and is being explored as one of the potential solutions to this problem. Thanks to its verification potential, the technology could bring a different way of doing things when it comes to mitigating the effects of climate change.
2local is one of the organizations tapping into this potential. Thanks to a blockchain-powered system, it’s easy to track the origin of a product and verify if it’s indeed made with local materials. Locally made goods help promote sustainability by reducing transport miles.
This is because the more the transportation miles, the more harmful gases are released into the environment. The need to transport materials across territories also drives the need for more fuel consumption, which ravages the environment even more.
2local couldn’t be more an organization of the times (or is it the future?) than with its ambitious plans of making the world a better place – while being aided by blockchain, a revolutionary idea in itself. The truth is, blockchain and the need for environmental sustainability are both ideas that simply refuse to be ignored. For this reason, we think 2local is one to watch.
Risk-Reward is an extremely important factor in price action trading. The price action of a chart is related to risk-reward to some extent. In today’s lesson, we are going to reveal an example of that. Despite the daily chart producing a bearish reversal candle, the H4 traders do not get the opportunity to take an […]

Risk-Reward is an extremely important factor in price action trading. The price action of a chart is related to risk-reward to some extent. In today’s lesson, we are going to reveal an example of that. Despite the daily chart producing a bearish reversal candle, the H4 traders do not get the opportunity to take an […]
Risk-Reward is an extremely important factor in price action trading. The price action of a chart is related to risk-reward to some extent. In today’s lesson, we are going to reveal an example of that. Despite the daily chart producing a bearish reversal candle, the H4 traders do not get the opportunity to take an entry. However, something interesting happens afterwards. We find that out in a minute.
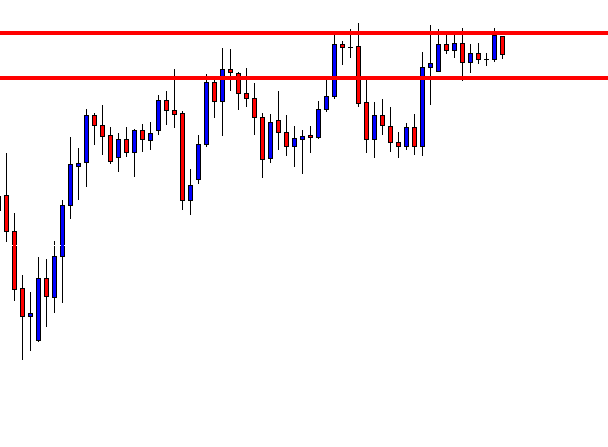
This is the daily chart. The chart shows that it produces a bearish inside bar, which is a not a strong bearish reversal candle. Nevertheless, a good consolidation and a bearish engulfing candle on the H4 chart may attract the sellers to go short on the pair. The nearest support is not too far. However, if we flip over to the H4 chart, we will be able to find out whether it offers a 1:1 risk-reward or not.
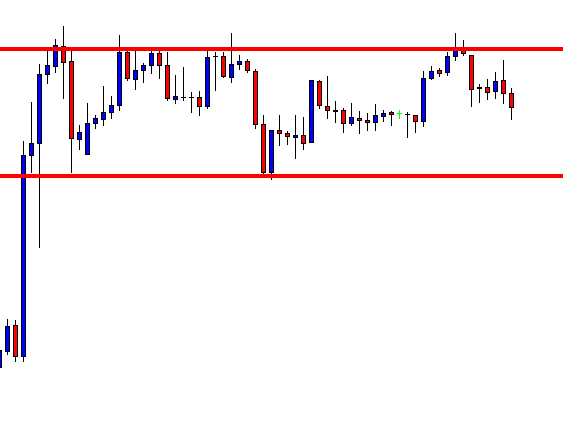
This is the H4 chart. The chart shows that if it starts consolidating now, it may offer 1:1 risk-reward (depending on the breakout candle). Thus, sellers may wait for a consolidation and an H4 bearish engulfing candle to make some green pips.
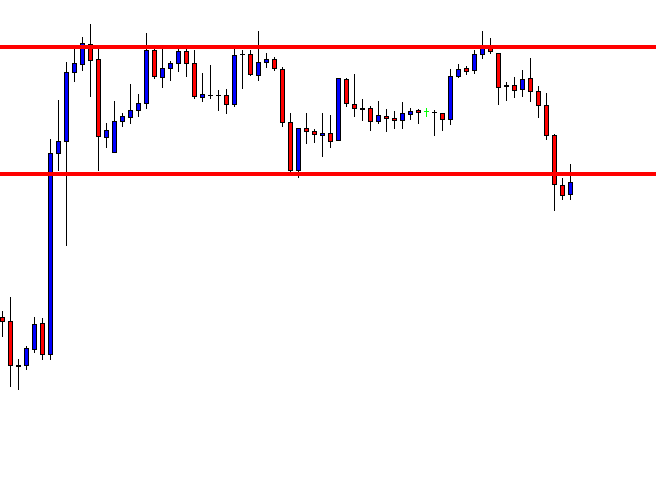
It does not consolidate but keeps going towards the South. The sellers on the minor charts may have found some short entries earlier. Since we are dealing with the daily-H4 combination, we may not shift our concentration on the minor charts of this pair. Do you notice one thing? Concentrate and try to find an interesting thing about the chart. The interesting fact about the chart is it has made a breakout on the H4 support. It consolidates and seems to have obeyed the breakout level. A bearish engulfing candle may attract the price action sellers to go short. Have a look at the chart below.
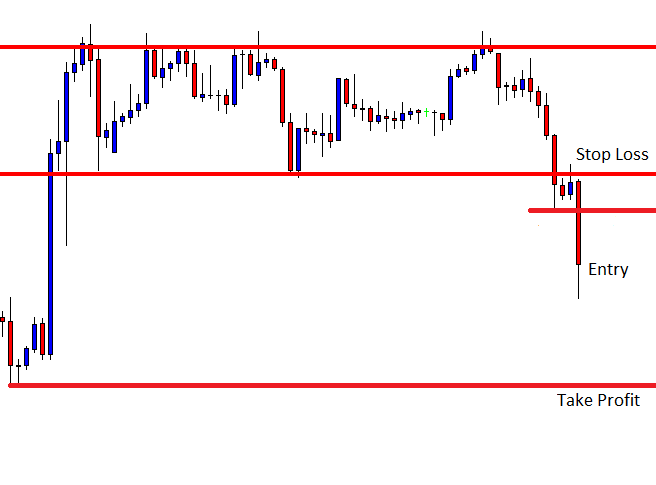
Here it is. A bearish engulfing candle breaches the consolidation support. Look at the red marked take profit level. In naked eyes, it offers an excellent risk-reward. As far as the daily-H4 chart combination trading is concerned, the pair may head towards the take profit level with good bearish momentum. Let us find out how the trade goes.
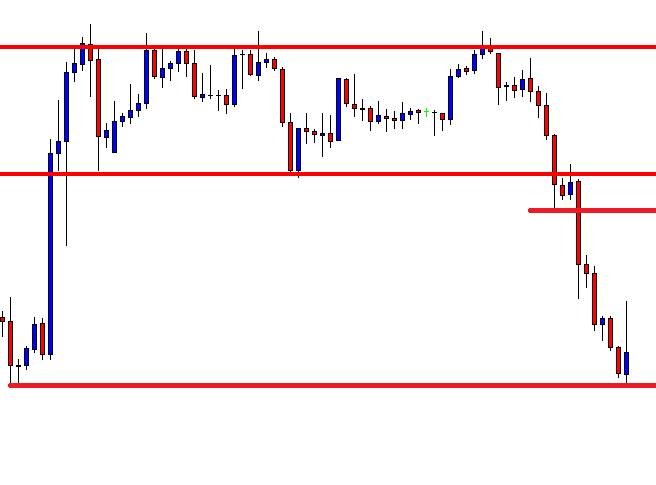
As expected, the price heads towards the downside and hits the take profit with ease.
On the first occasion, the price neither consolidates nor offers an entry. On the second occasion, it consolidates nicely and produces an ideal bearish engulfing candle to offer a short entry with an excellent risk-reward. I am not saying that it never offers an entry on such occasions (first occasion). Risk-reward attracts more traders. Thus, if there is a better risk-reward, most likely, there is more opportunity for traders.
Introduction

Introduction
Now with the knowledge of three type analysis, let us determine the best type of analysis suitable for you.
Before that, let’s brush up through the previous lessons.
✨ Fundamental Analysis – This is a technique to analyze the market by considering the factors which affect the supply and demand of security (currency). Some of the fundamental indicators include interest rates, inflation, GDP, money supply, manufacturing PMI, etc.
✨ Technical Analysis – It is the analysis of the market by understanding the historical price movements of the currency. In other words, it is the study of price movements using technical tools like candlestick patterns and indicators.
✨ Sentimental Analysis – This type of analysis involves understanding the real essence of trading. Here, we get into the shoes of the bug players and determine if they’re buying or selling.
Out of these three, which do you think can help you find success in trading? Well, as a matter of fact, once can succeed in trading only if they have the knowledge of all these three types of analysis. Let us understand with an example of the hurdles that can come your way if you focus only on one type of analysis.
Let’s say a trader named Tim trade only on technical analysis, and he found a good buying opportunity on EUR/USD. But, after he hits the buy, he sees the market falling straight down 100 pips against him due to some news he wasn’t unaware of. This situation brings in emotions in him by which he ends up closing the trade. However, later in the day, he observes that the market ends up going in the direction he predicted.
Here, though his analysis was right, the obstacles like news and emotions took over the technical analysis and put him in a loss. Hence, from this, we can conclude that technical analysis, fundamental analysis, and sentimental analysis are interdependent on each other.
Above, we have discussed how crucial and dependent all three types of analysis are. However, there are traders in the industry who have expertise only in a kind of analysis but still manage to grow their accounts significantly. Below are some of the tips on how one must structure their analysis, considering they specialize in technical analysis.
Therefore, following these three simple steps can drastically bring a change in the way you analyze the markets. Cheers.
[wp_quiz id=”57535″]Flags and Pennants If you’ve ever traded a chart and you’ve seen what looks like a reversal in the trend, but as soon as you enter the trend seems to continue, odds are you were trading against a continuation pattern. Flags and pennants are titles given to patterns that show up as small countertrend moves […]
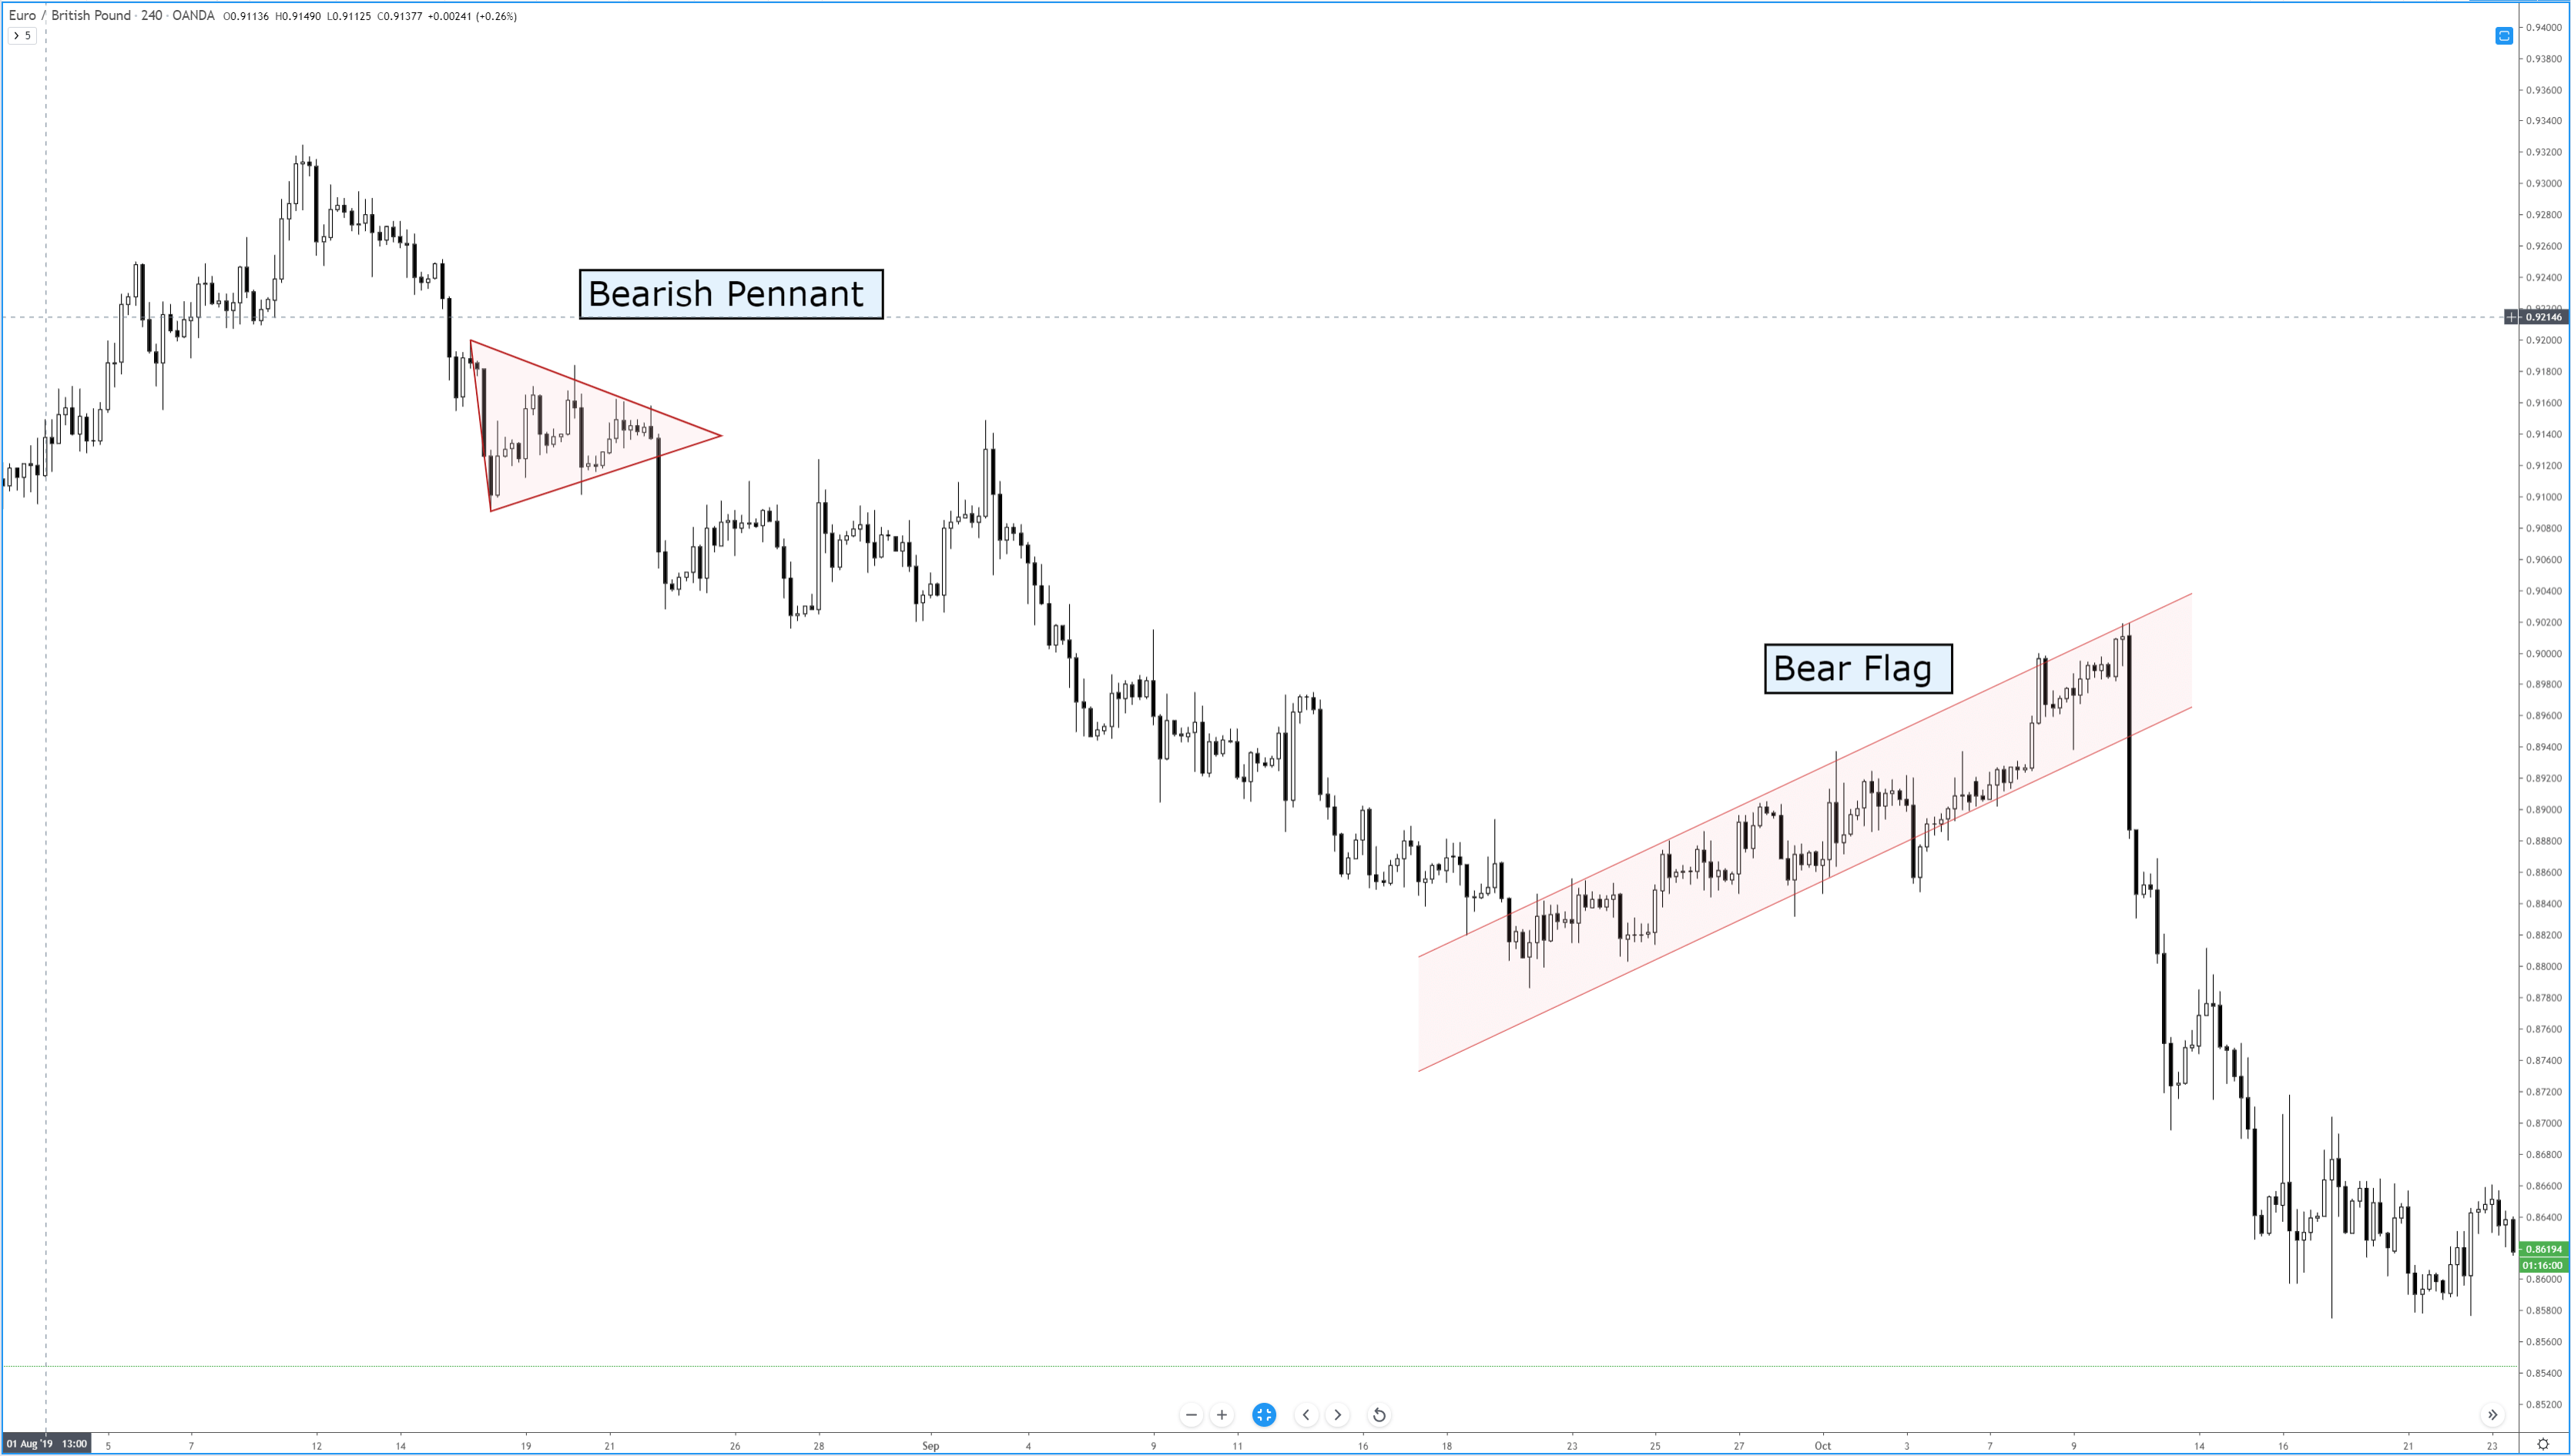
Flags and Pennants If you’ve ever traded a chart and you’ve seen what looks like a reversal in the trend, but as soon as you enter the trend seems to continue, odds are you were trading against a continuation pattern. Flags and pennants are titles given to patterns that show up as small countertrend moves […]
If you’ve ever traded a chart and you’ve seen what looks like a reversal in the trend, but as soon as you enter the trend seems to continue, odds are you were trading against a continuation pattern. Flags and pennants are titles given to patterns that show up as small countertrend moves that ultimately trap participants and then use their momentum to keep the price moving in the direction of the trend. Flags are represented as rectangular channels, and pennants are represented as triangles.
Before a flag or pennant can be identified, we first need a flag pole. A flag pole is any clear trending price action that, well, looks like a pole. See below:
The images above show examples of bearish flags and bearish pennants, as well as bullish flags and bullish pennants. If you are unfamiliar with how to trade triangles or rectangles, refer to the articles that discuss the various triangle patterns. But we can review the basics of entering these great continuation patterns.
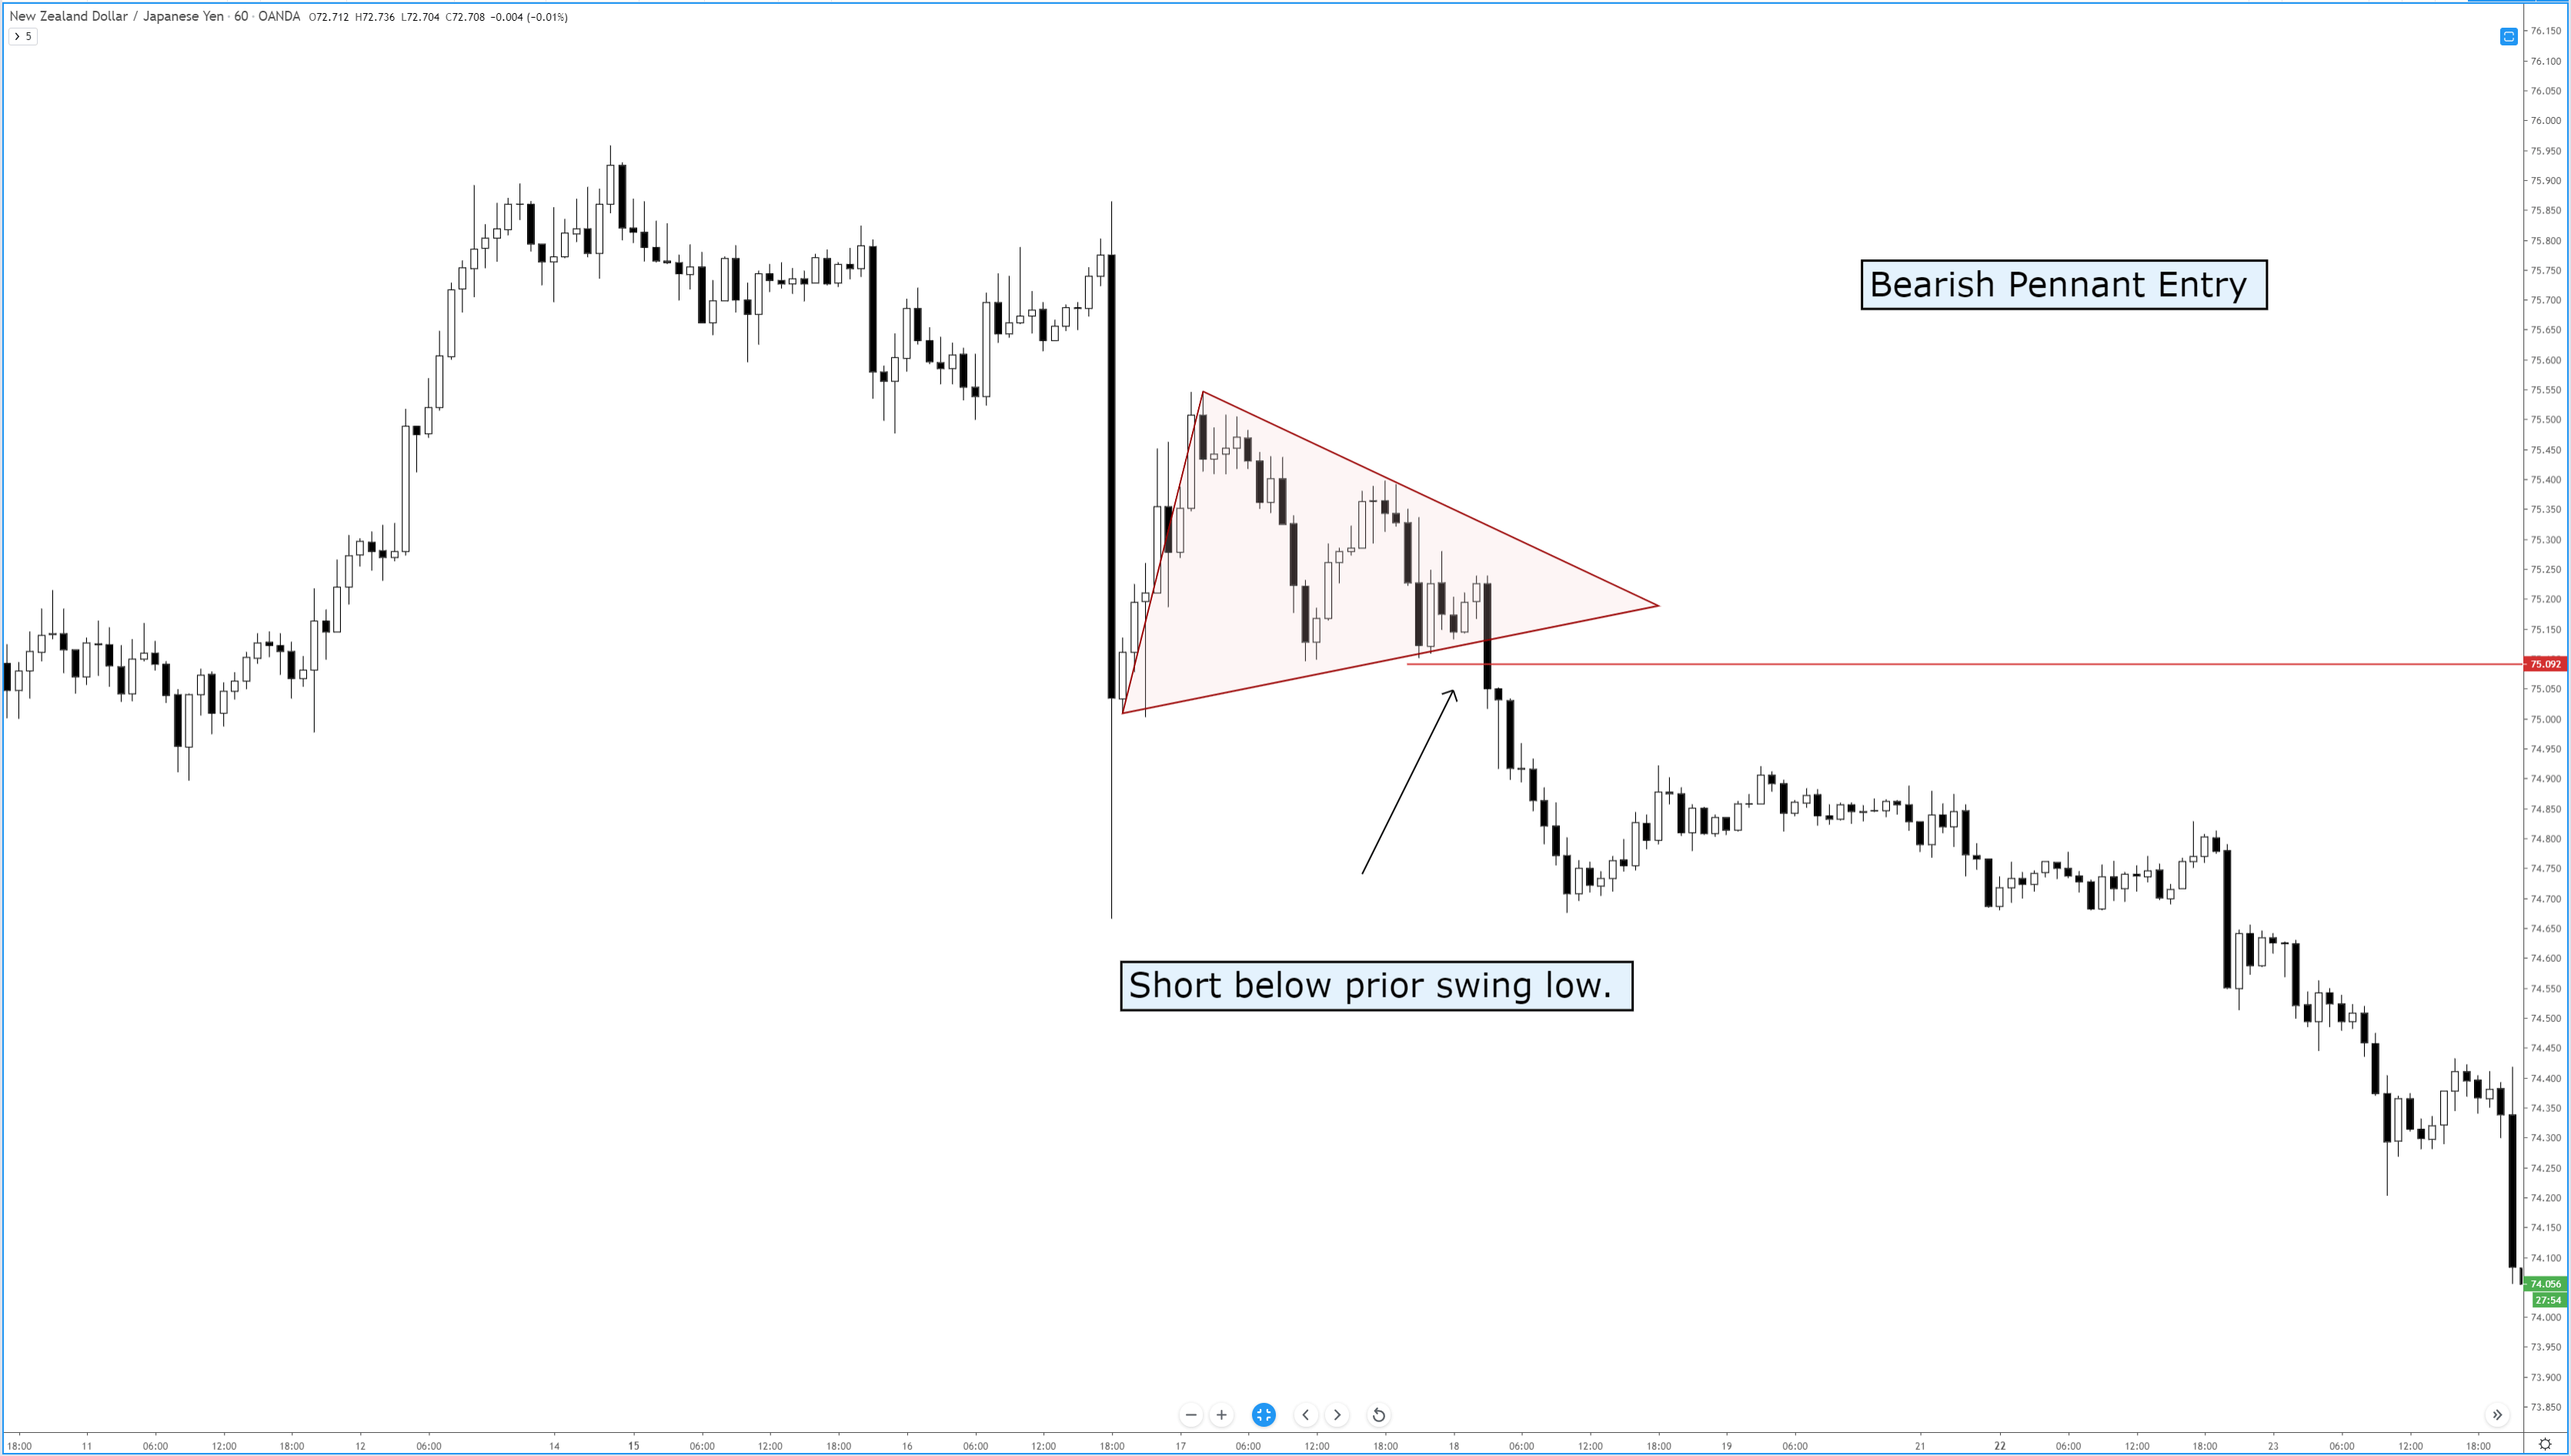

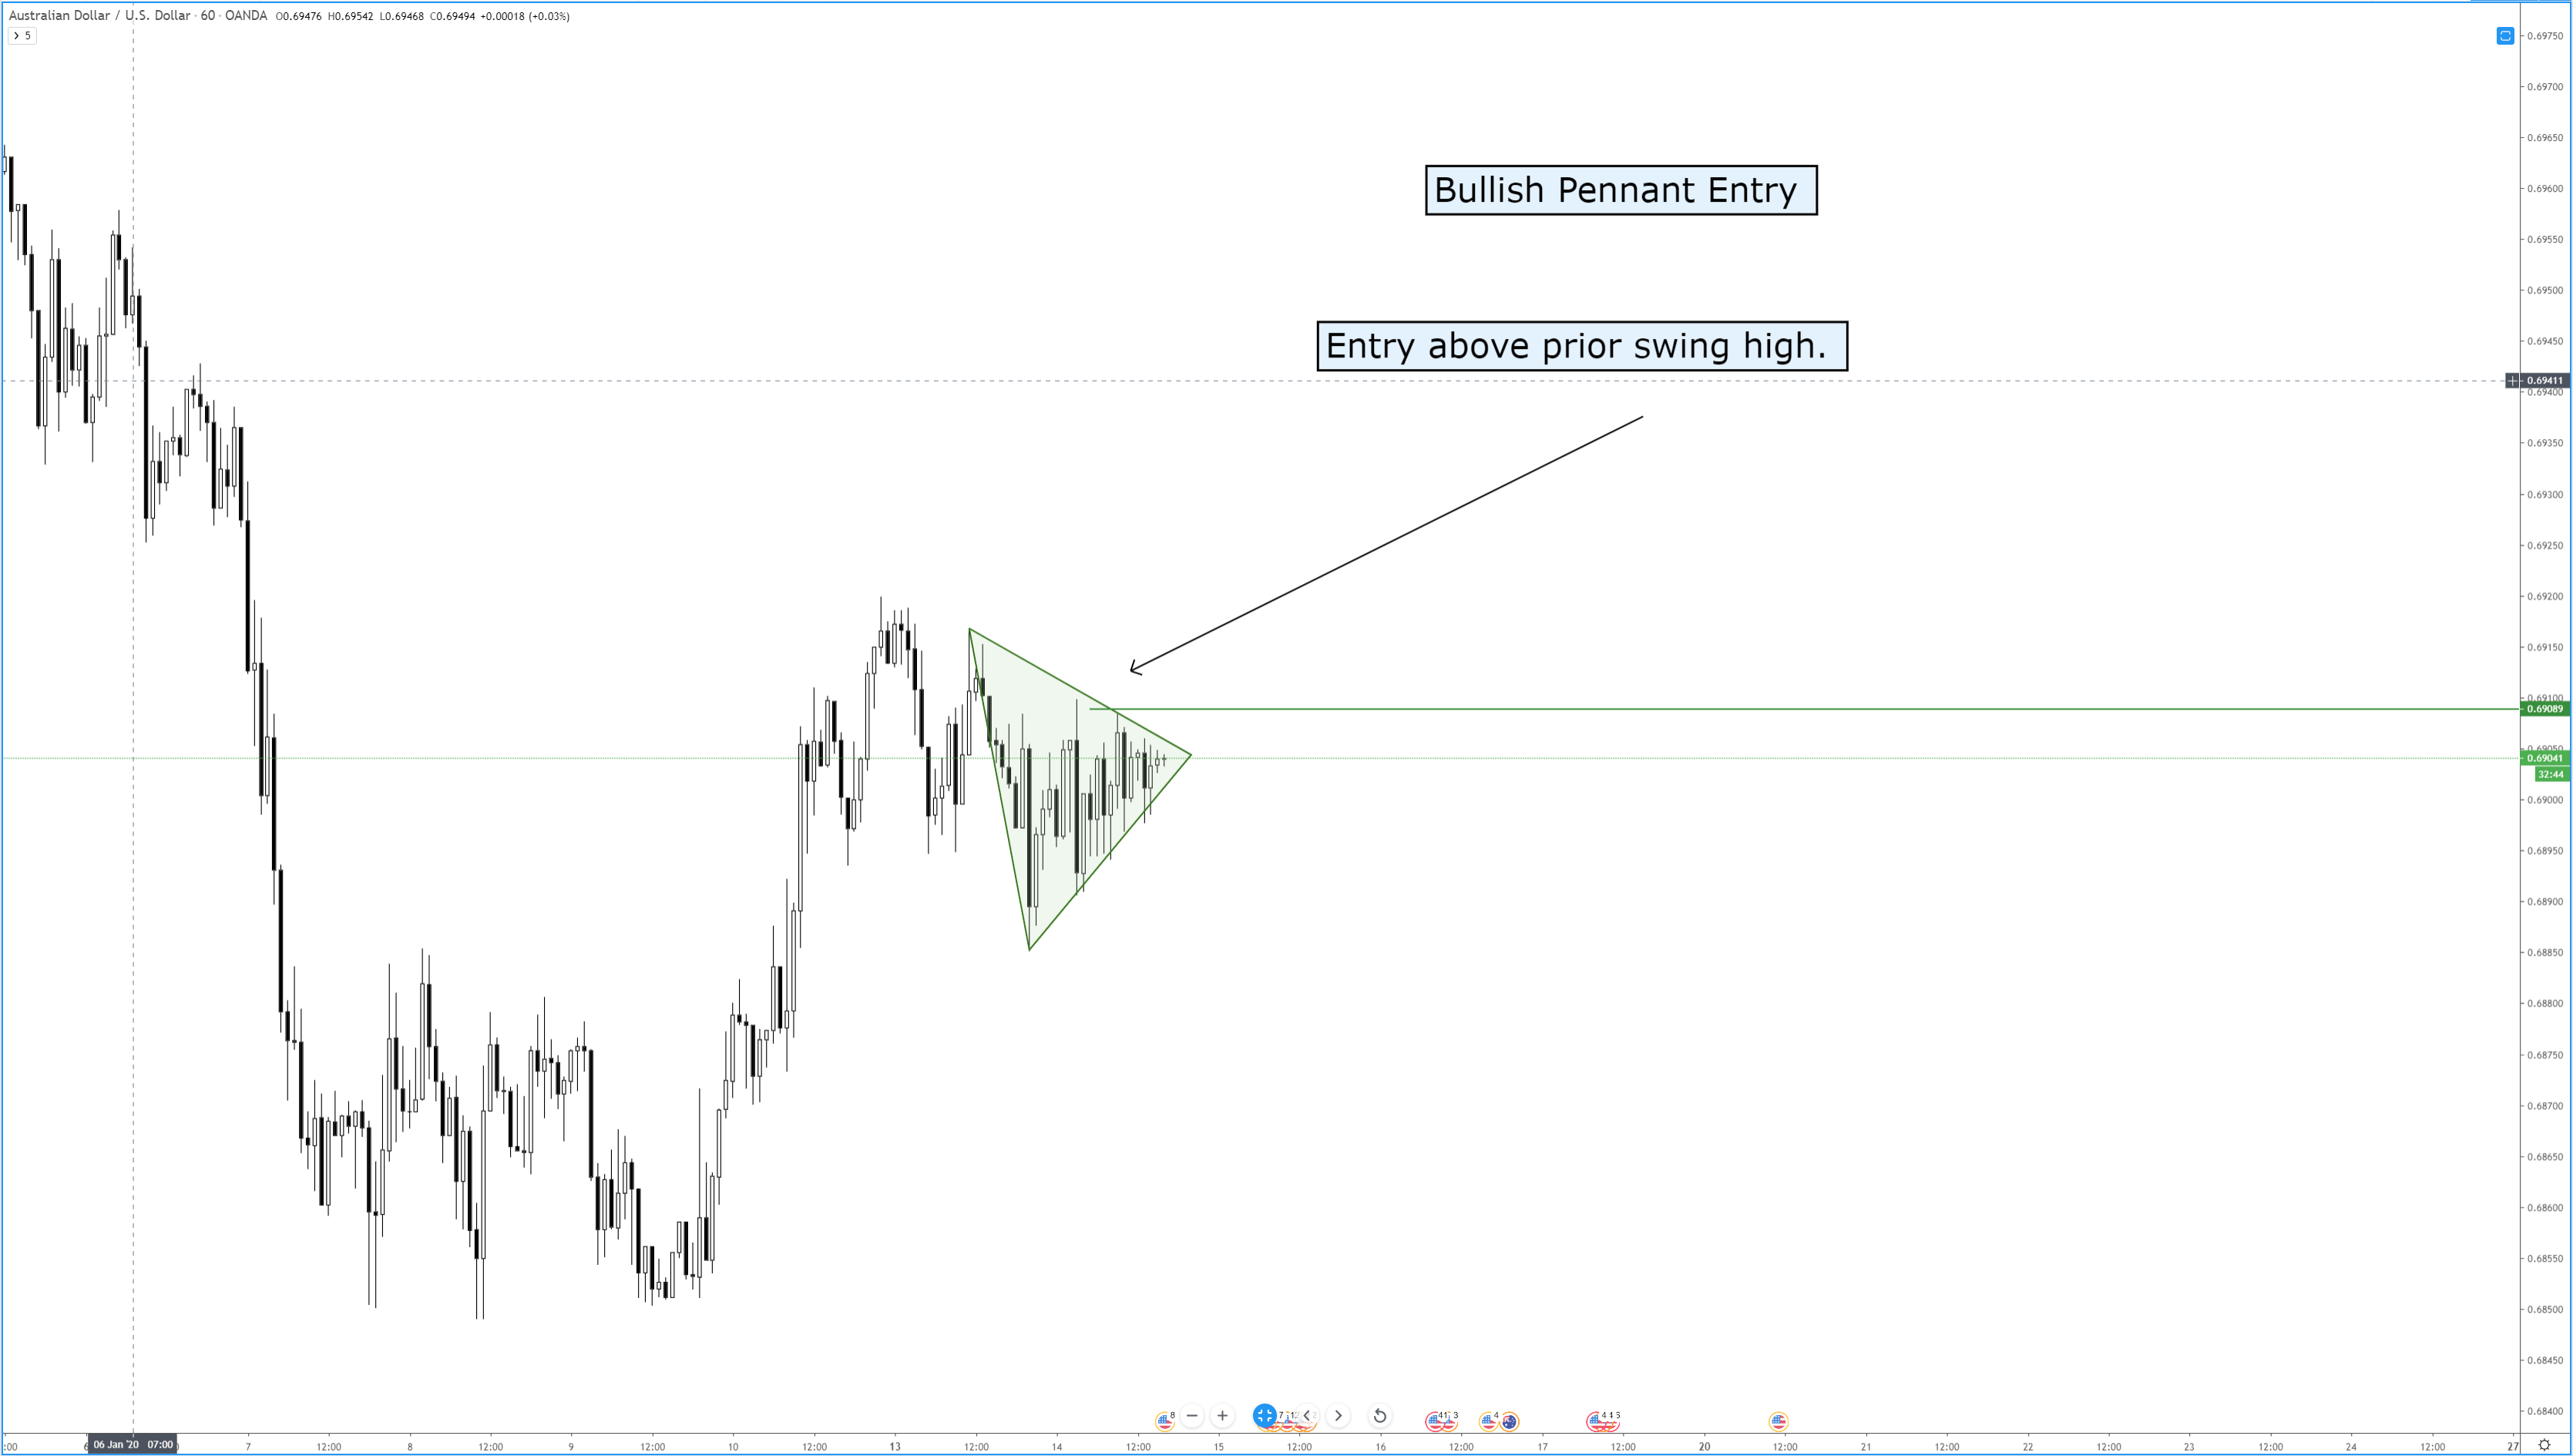
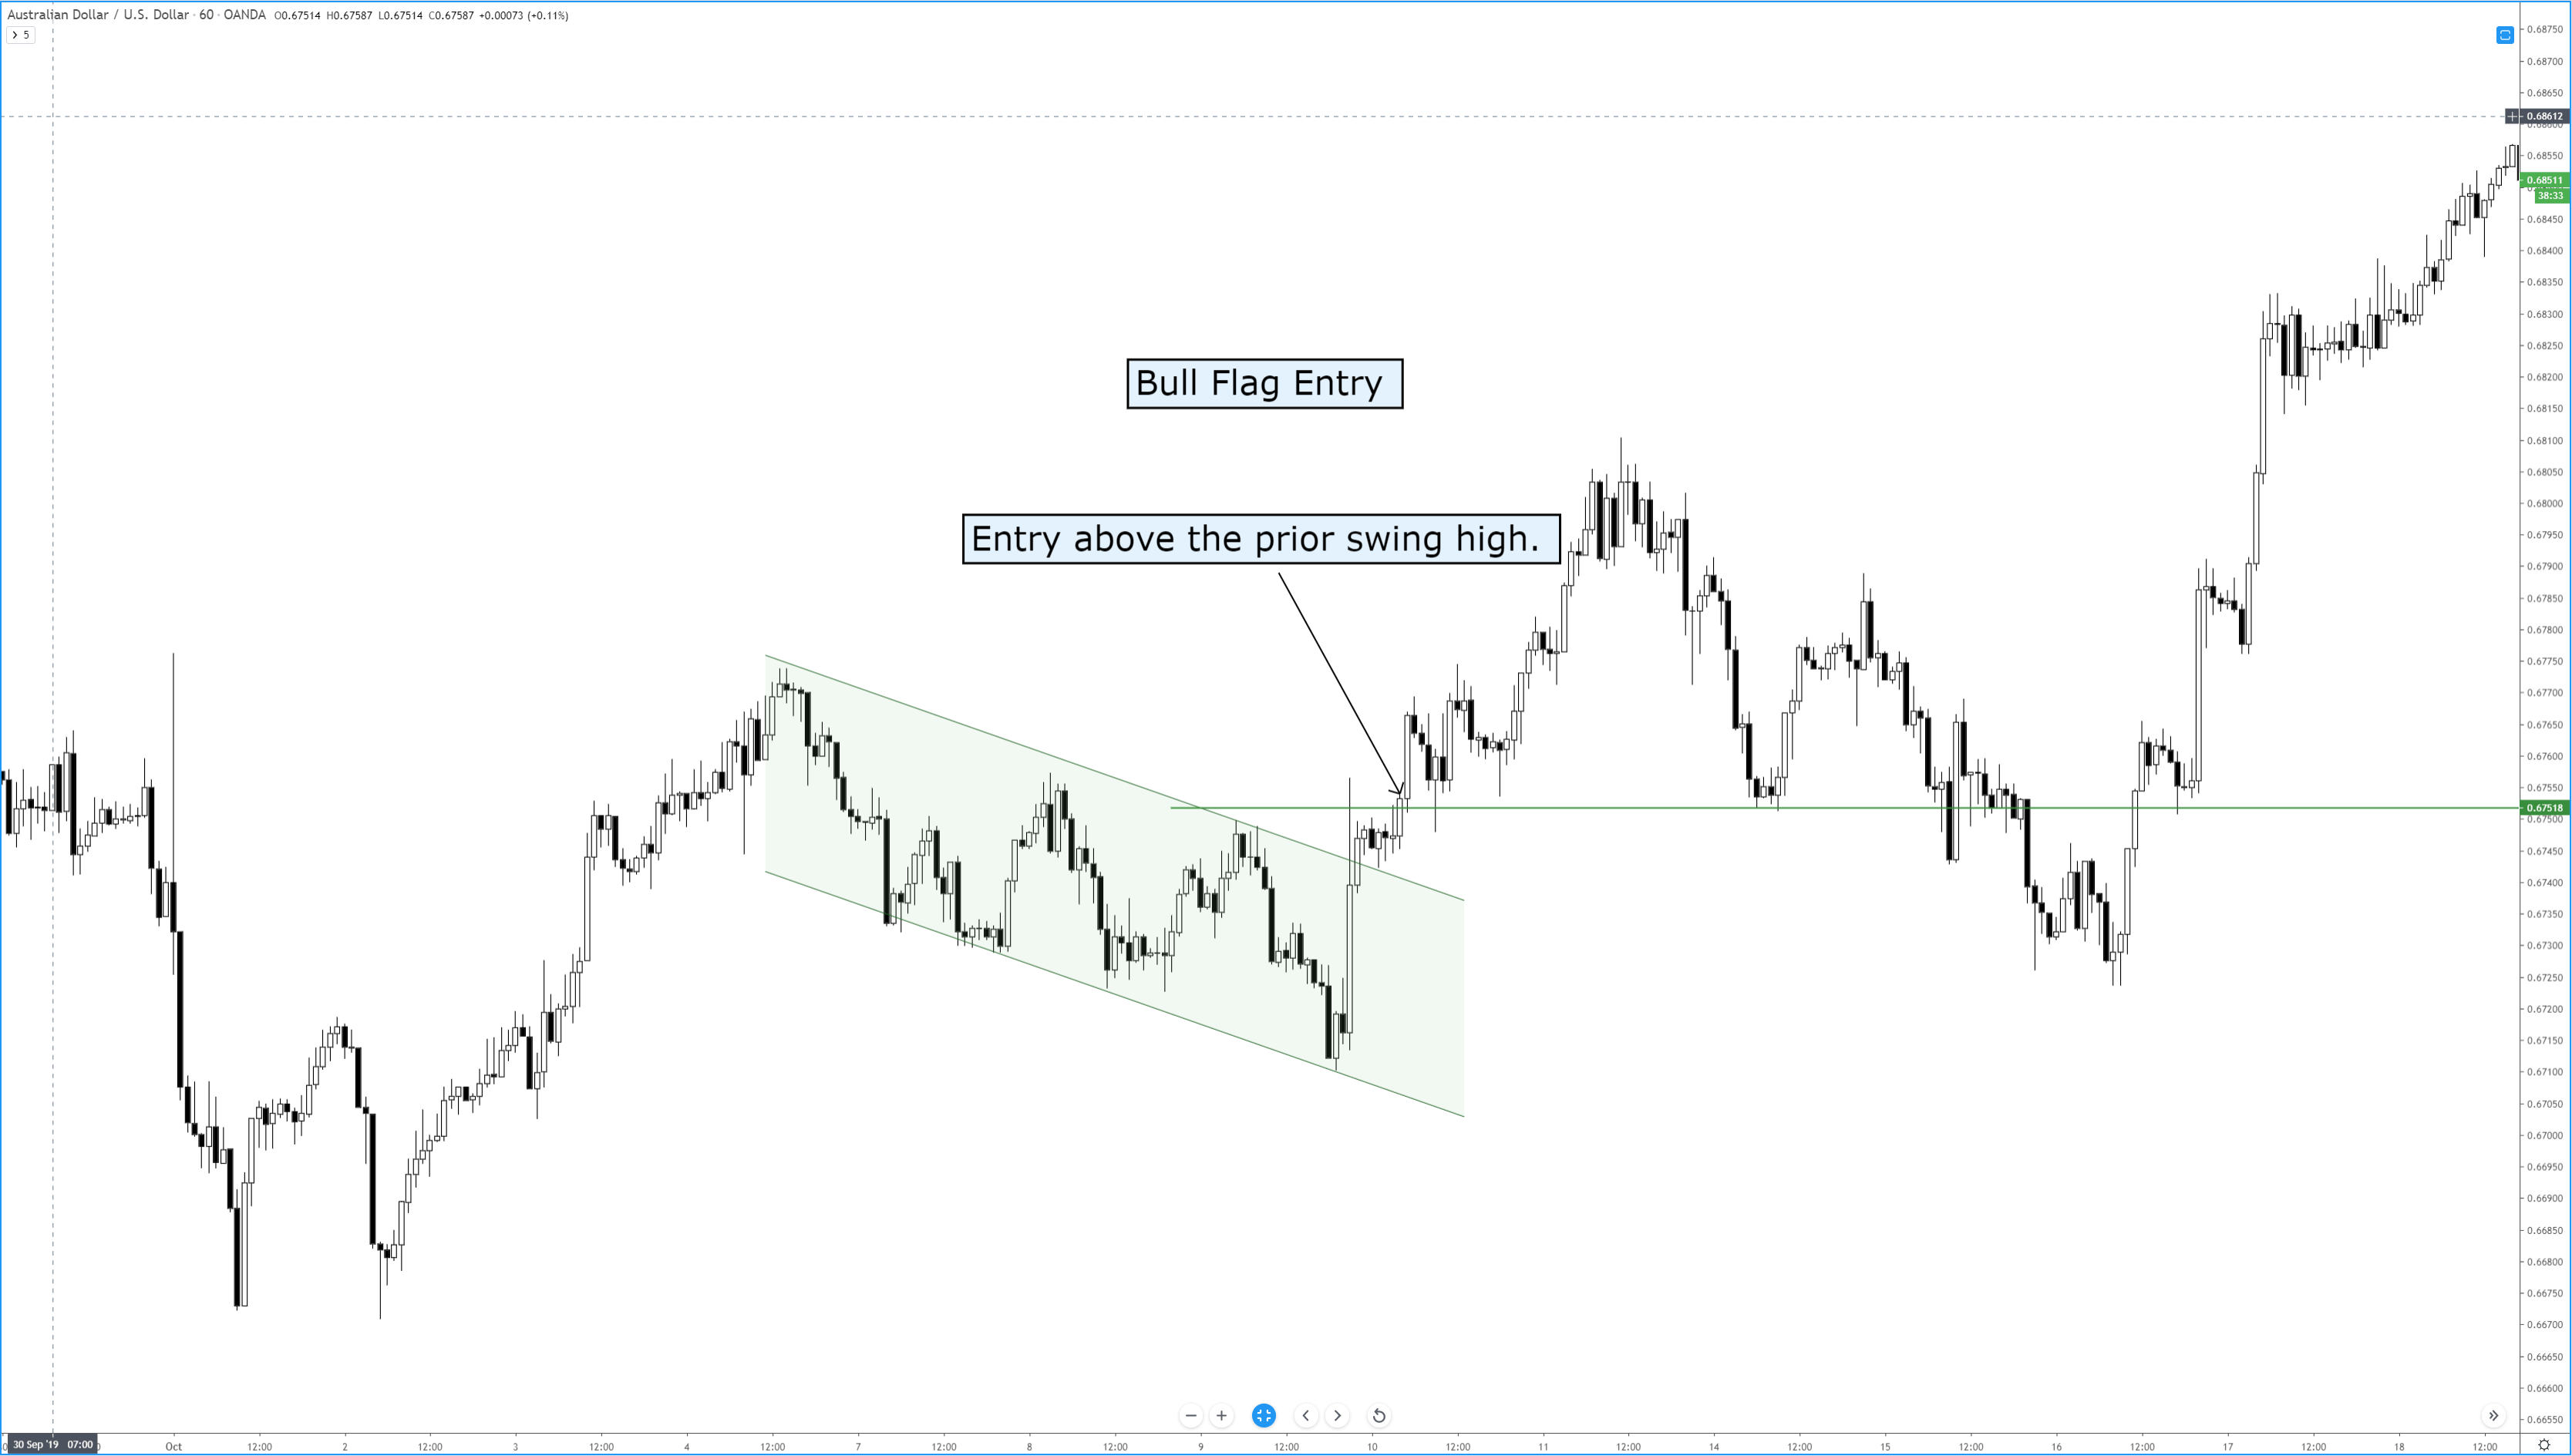
Learning how to trade flags and pennants is one of the most useful and enjoyable things that you can learn – especially as a new trader. Flags and pennants help train your brain to get used to buying dips during bull runs and shorting rallies during bear moves. If you get to a point where you can profitably trade flags and pennants, then you have transitioned into a trader who is very near outperforming the vast majority of your peers. It may seem like an easy thing to do – but it is an entirely different thing to execute. Analyzing and identifying a flag or pennant is easy; trading it is difficult.
I can not stress enough how profitable these patterns can be – and how easily you can miss them even in plain sight. The problem resides with your brain – that ‘lizard’ part that kicks in when you are are fearful of your account. When you begin to feel the fear of your account losing money, that triggers a powerful part of your brain known as the limbic system. The limbic system controls fear and pleasure. And when your fear sense is triggered, it hyper focuses the synapsis across your brain. Things that you would passively identify like flags and pennants are tertiary in their importance when the limbic system is acting in your defense. You need to find ways to ‘pause’ the process with things like alerts. On the images above, you saw horizontal lines above prior swing highs and below prior swing lows. Placing alerts at those points may be enough to interrupt your primary fear response and allow you to make money on your emotions.
Because if you are feeling it, so is everyone else.
Sources:
Kirkpatrick, C. D., & Dahlquist, J. R. (2016). Technical analysis: the complete resource for financial market technicians. Upper Saddle River: Financial Times/Prentice Hall.
Bulkowski, T. N. (2013). Visual guide to chart patterns. New York, NY: Bloomberg Press.
Bulkowski, T. N. (2008). Encyclopedia of candlestick charts. Hoboken, NJ: J. Wiley & Sons.
Bulkowski, T. N. (2002). Trading classic chart patterns. New York: Wiley.
In today’s article, we are going to demonstrate an example of a trade, which does not go according to the price action traders’ expectations. We try to dig out what goes wrong with the trade. Let us get started.

In today’s article, we are going to demonstrate an example of a trade, which does not go according to the price action traders’ expectations. We try to dig out what goes wrong with the trade. Let us get started.
In today’s article, we are going to demonstrate an example of a trade, which does not go according to the price action traders’ expectations. We try to dig out what goes wrong with the trade. Let us get started.
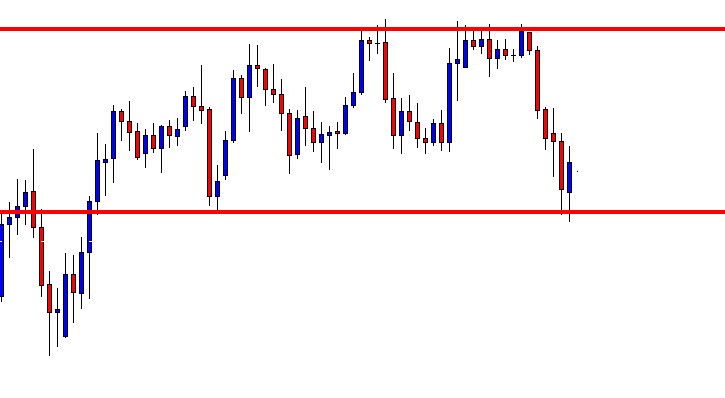
This is a daily chart. The chart produces an inside bar right at the level where the price had a rejection earlier. The buyers, according to price action trading, usually wait for the price to produce a bullish reversal candle around such levels. However, the buyers may remember an important point here that the bullish reversal candle is an inside bar. An inside bar is not known as a strong reversal candle. Nevertheless, it is a daily bullish reversal candle producing right at the level of support, so they daily-H4 buyers are to flip over to the H4 chart.

The H4 chart’s price action is bullish. The last candle comes out as a bearish pinbar. The price may consolidate soon. If that happens, followed by an H4 bullish breakout, buyers may go long on the pair. The next significant swing high is far, offering a tremendous risk-reward.

The price consolidates and produces a bullish engulfing candle breaching the level of resistance. The consolidation does not look an ideal one. Ideally, the buyers may trigger a long entry here. This is what we have been learning on daily-H4 chart trading lessons. Let us assume that we take a long entry here. Let us find out how the trade goes.
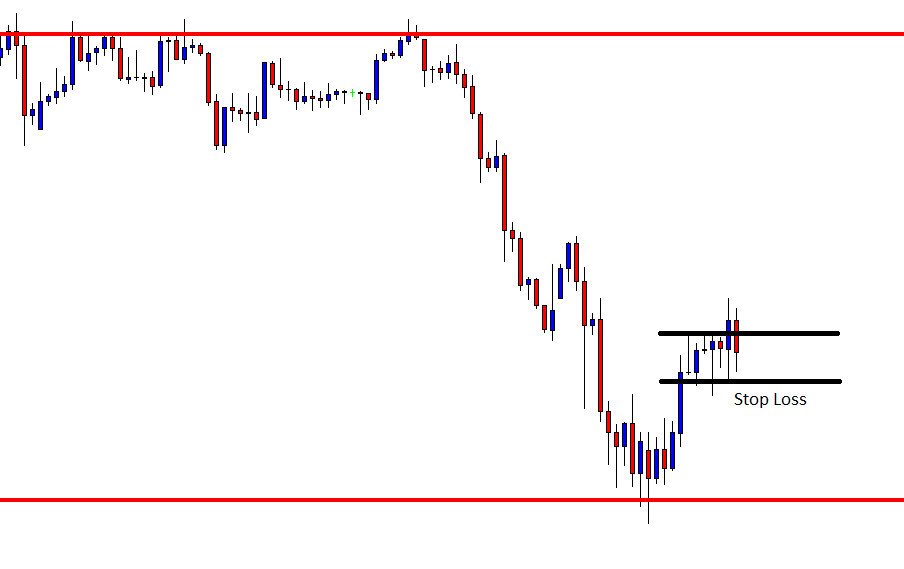
The next candle comes out as a bearish candle. It does not hit the stop loss, but it looks ominous. Since taking a loss is an unavoidable thing in trading, so we may let it go. This is what we have been learning, as well. Let us find out what happens next.

It hits the stop loss. As far as trading psychology is concerned, we must not let it take over us. However, with this trade, two things may hold many price action buyers back taking the entry.
We have demonstrated on many occasions, an inside bar daily reversal candle with good-looking consolidation ends up offering a winning entry. On some lessons, an unusual consolidation but with a daily bullish reversal candle does the same. Over here, a combination of both ends up offering a losing entry. On some occasions, such price action (inside bar daily reversal candle and unusual consolidation) may end up offering a winning entry. However, to have better winning consistency, we may skip taking entry on such price action.
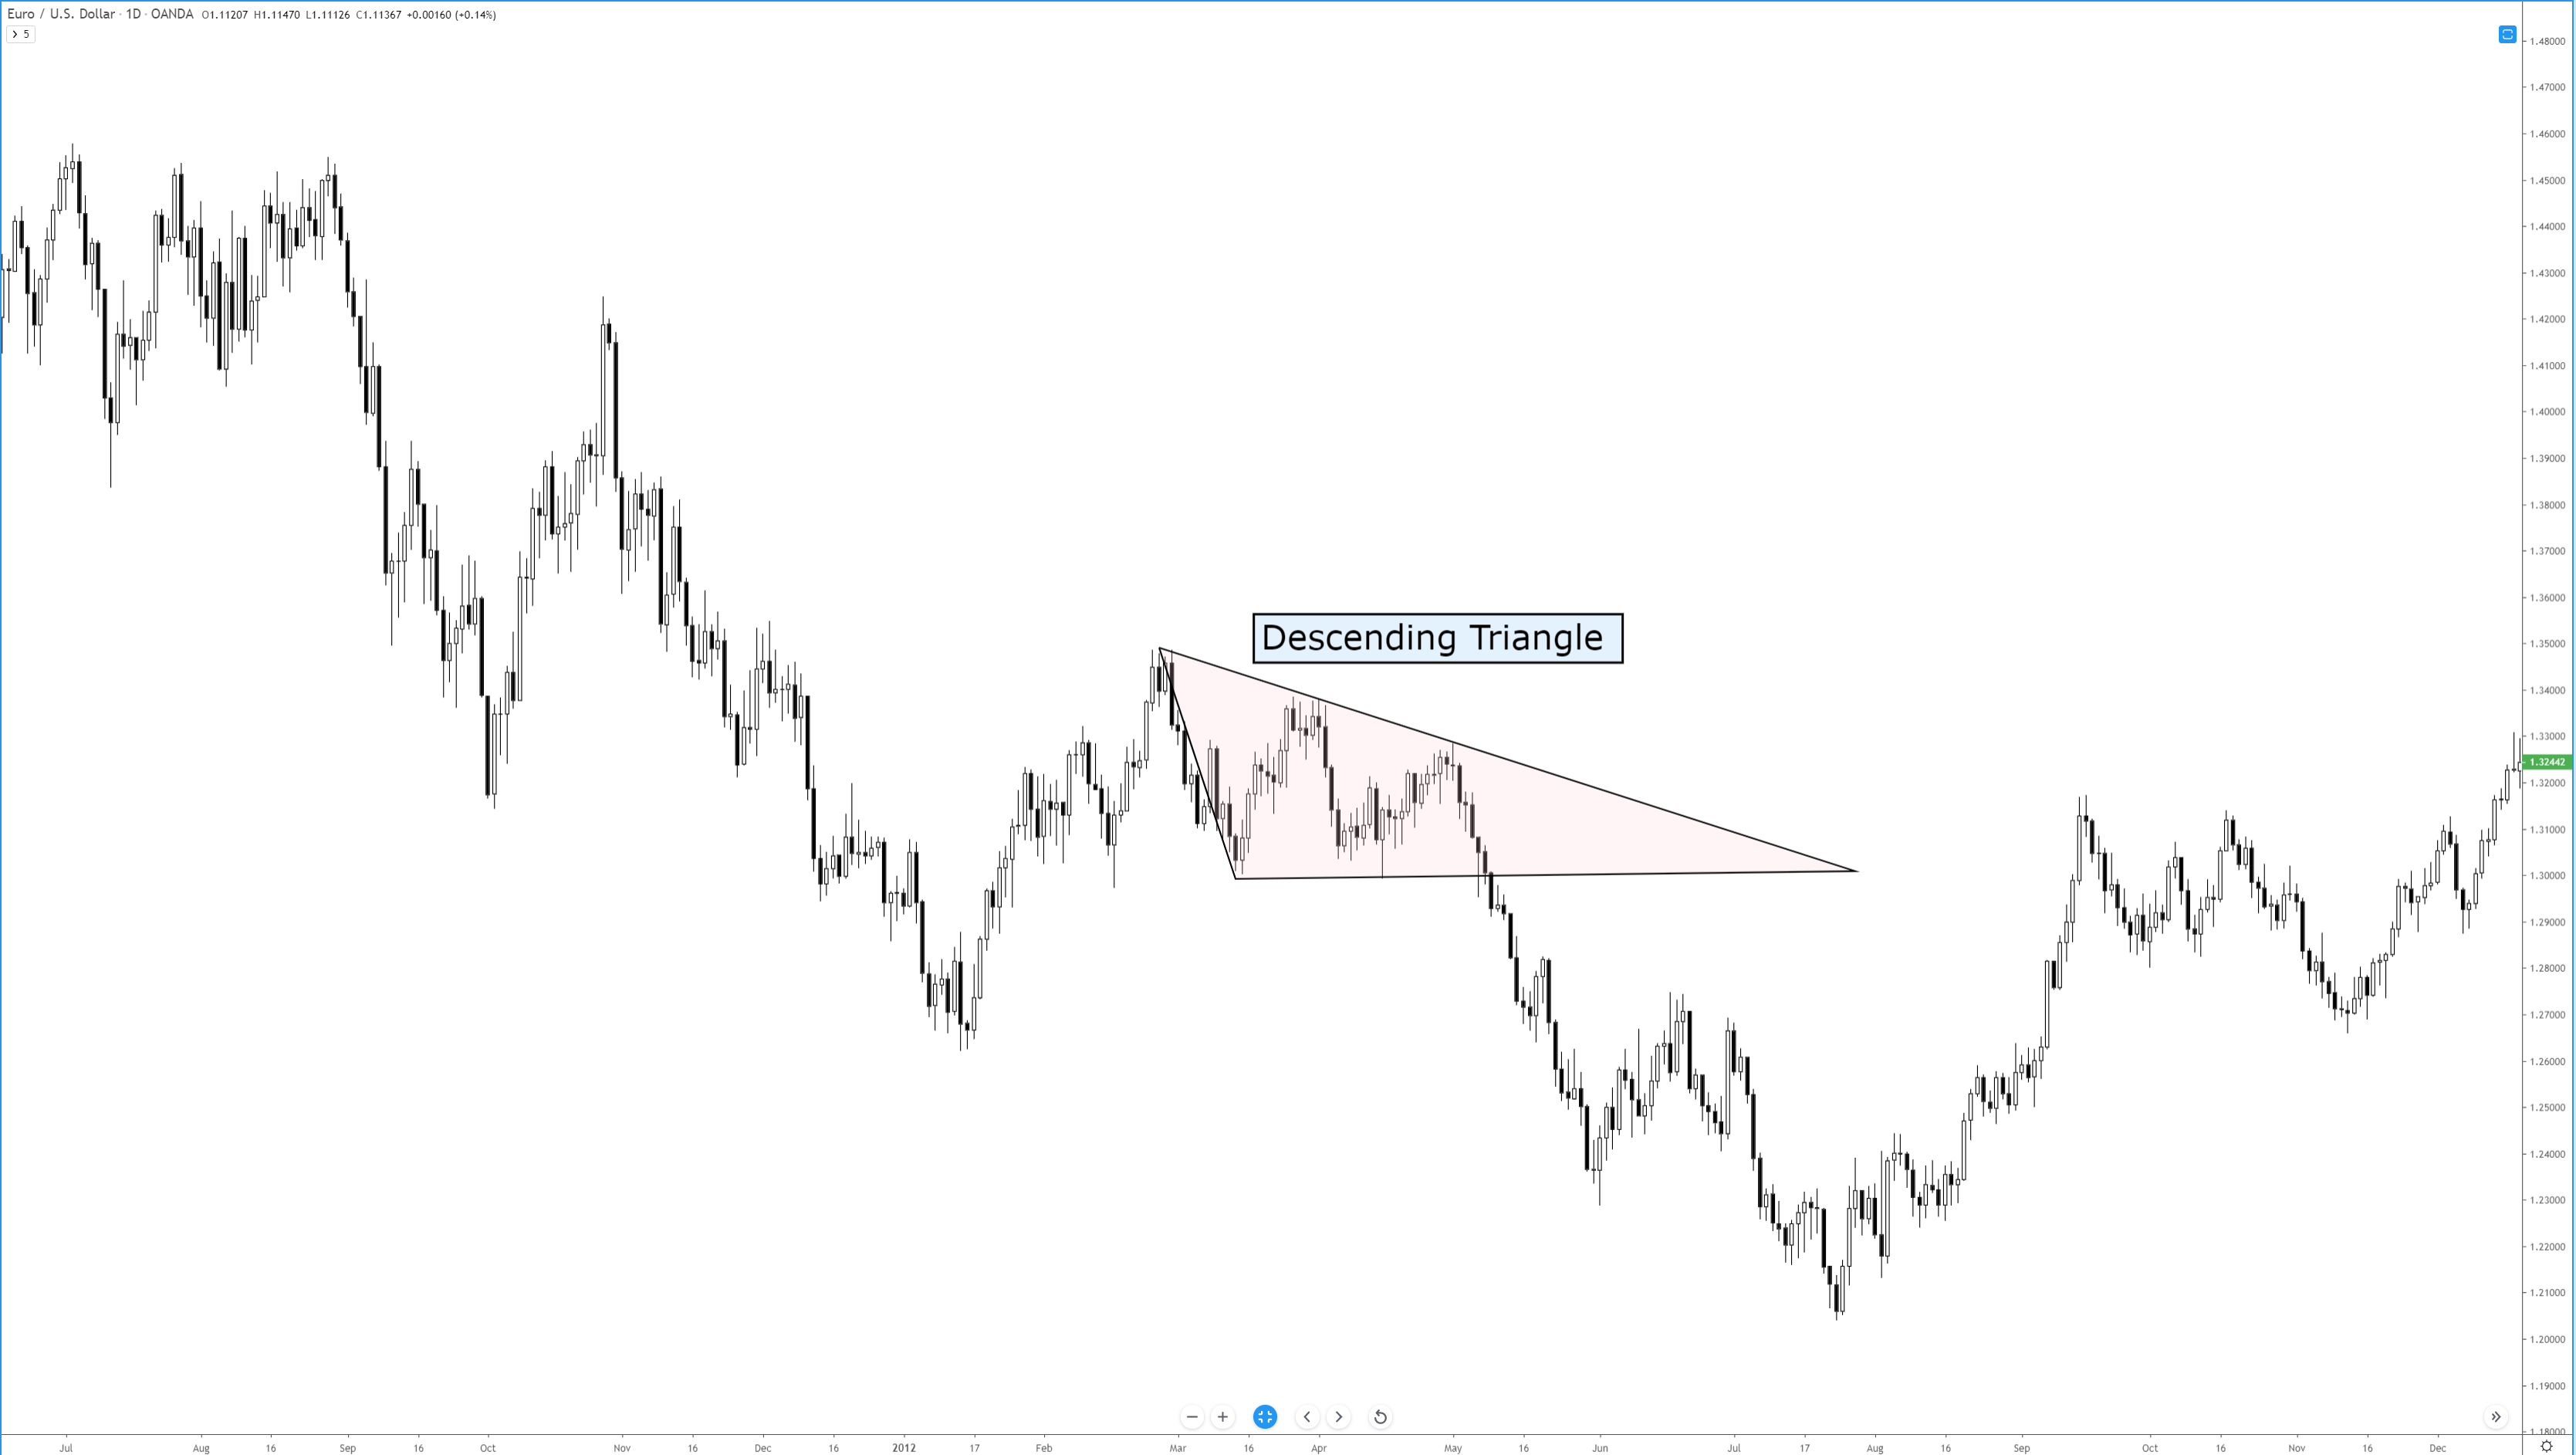
The descending triangle is another version of the many triangle patterns in technical analysis. It is the opposite of the ascending triangle. This pattern is overwhelmingly bearish and is one of the more common bearish continuation patterns. If you’ve read Dahlquist and Kirkpatrick’s Technical Analysis, you will find that this pattern is treated with some considerable positivity. It was one of the best-performing patterns. But there is a caveat to why this is.
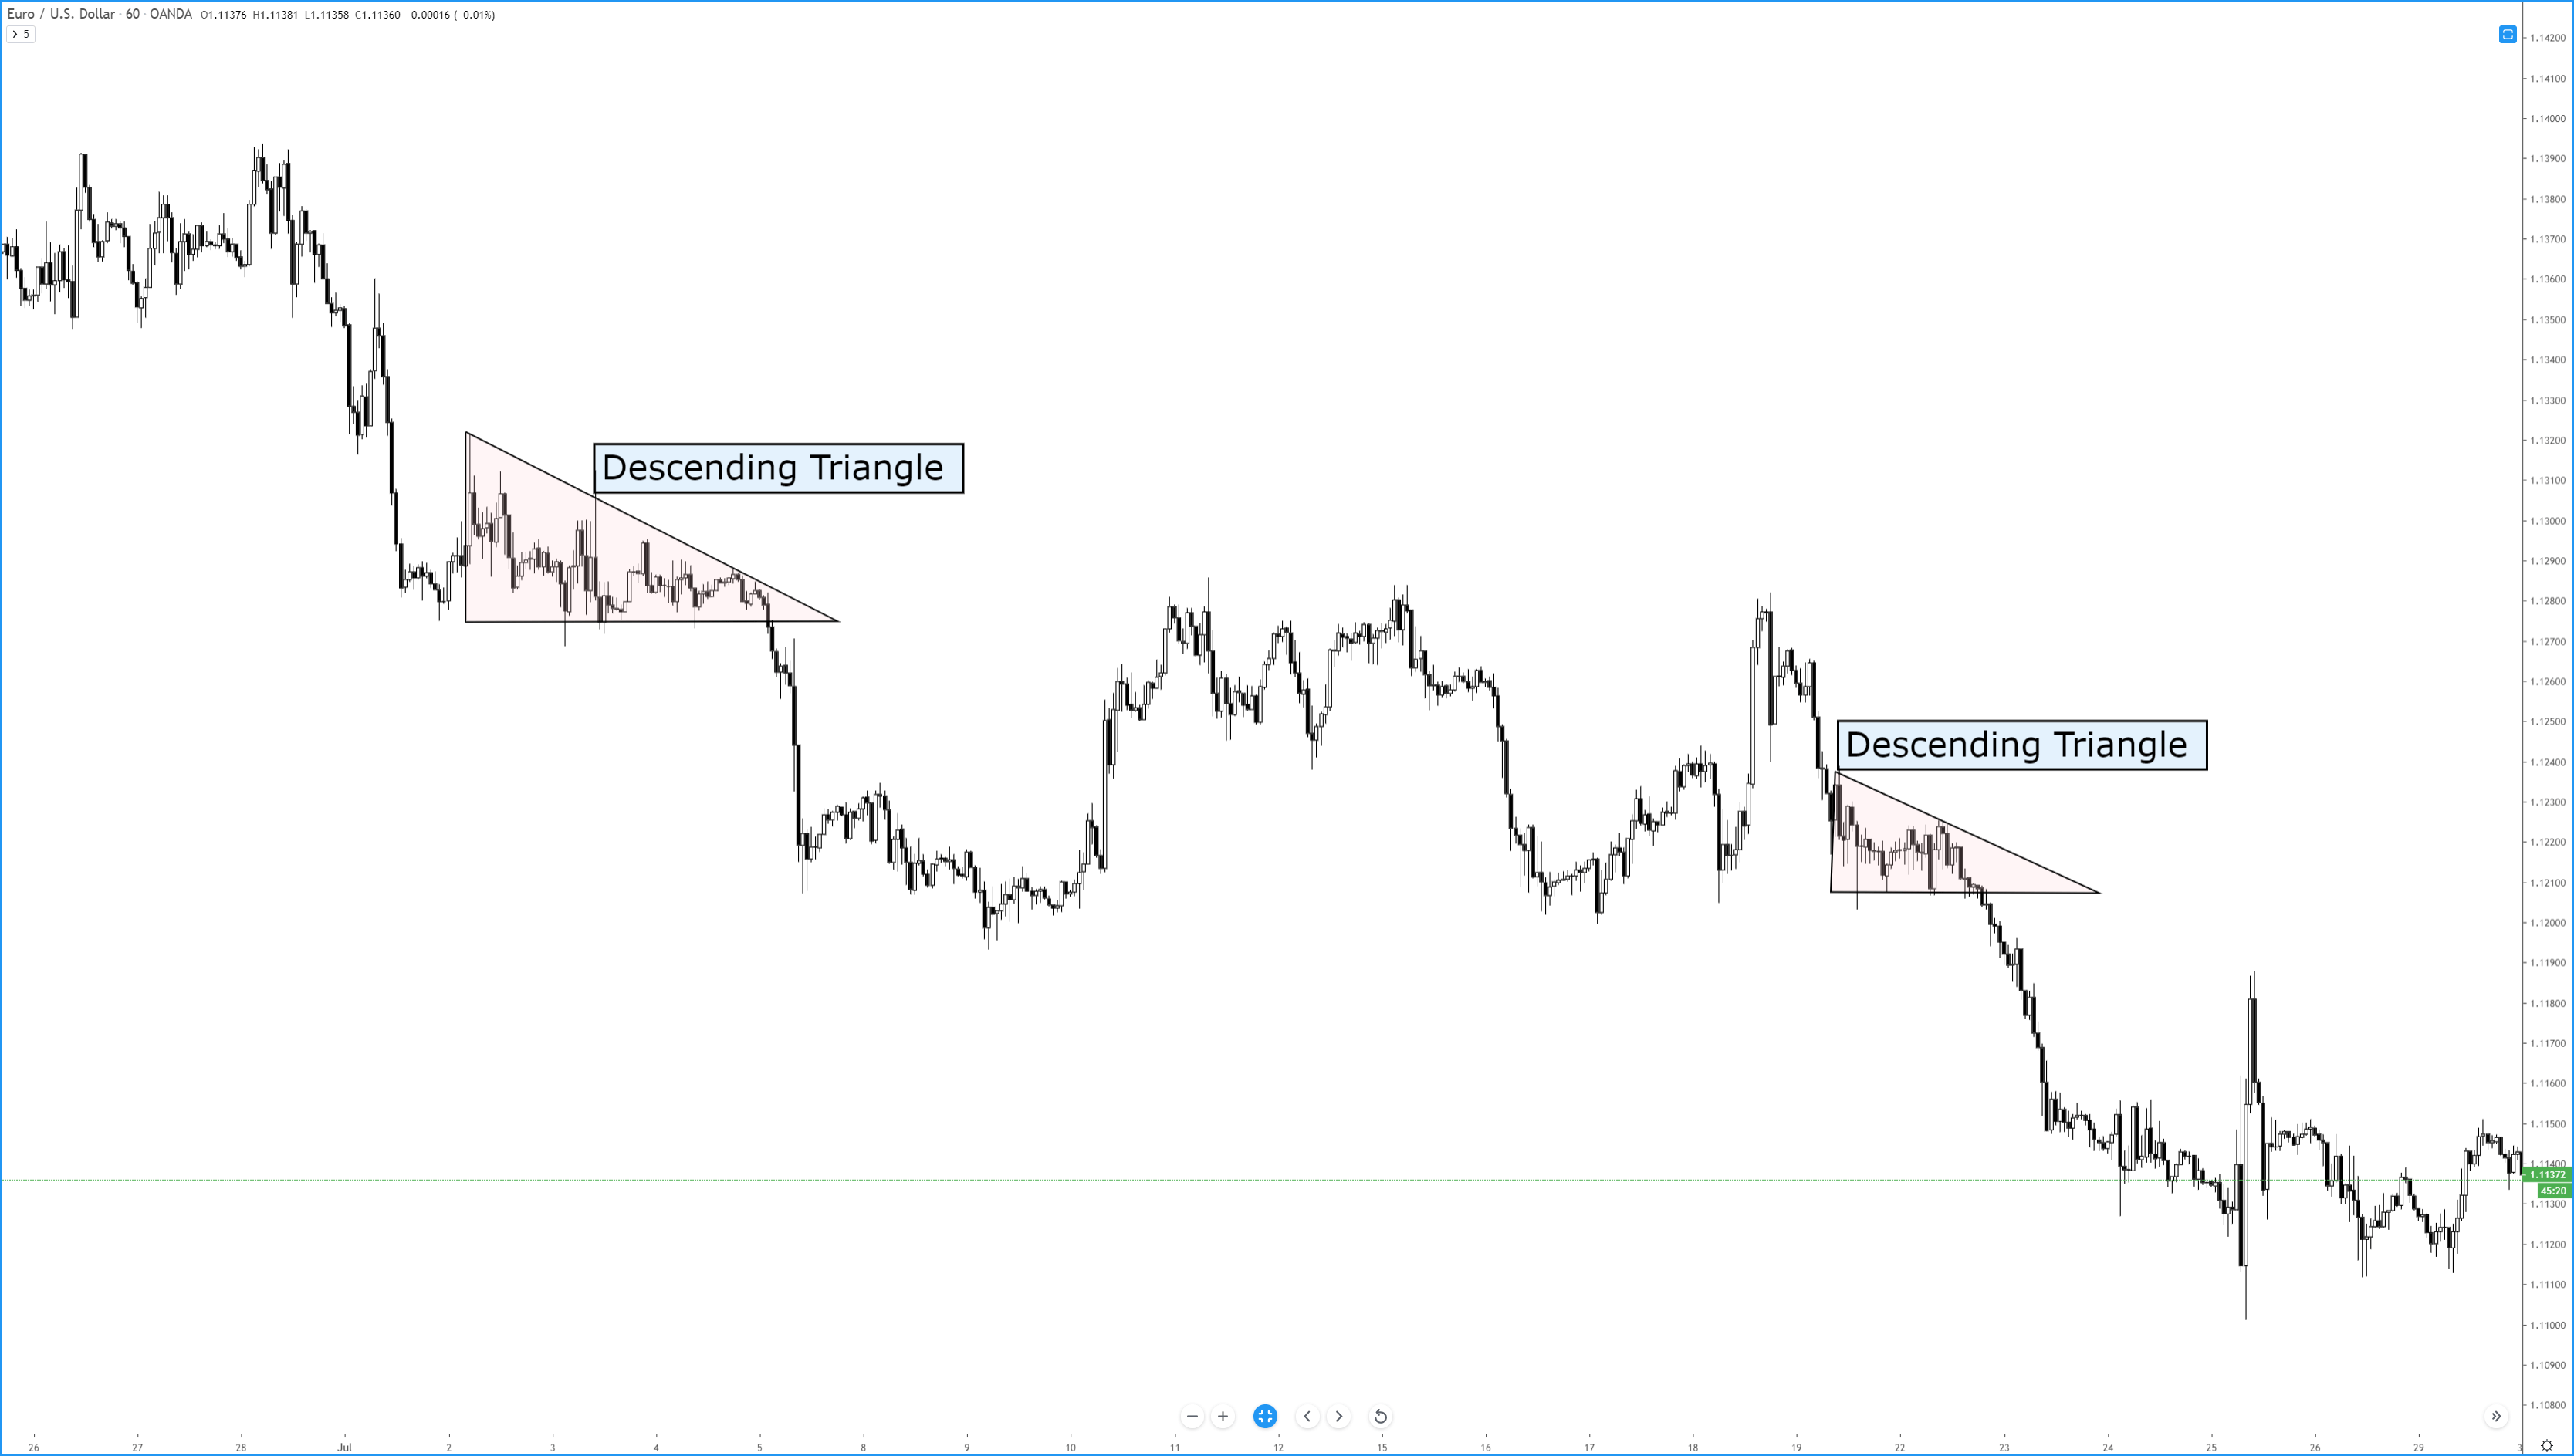
The two trendlines required for the formation of a descending triangle are a flat, horizontal trendline that acts as support with a downward sloping trendline that acts as resistance. Ideally, price should touch both the upper and lower trendlines twice. Volume typically decreases as price gets closer to the apex. Breakouts occur within the final 1/3rd of the pattern. Dahlquist and Kirkpatrick report that increasing volume is actually more favorable for this pattern. The most common breakout is lower at 64% of the time.
I’ve written in prior articles about the dangers of putting to much stock into technical analysis books where the initial testing of patterns and results have been in traditional equity markets (stock markets). I believe that one of the reasons that Dahlquist and Kirkpatrick have reported such powerful and swift moves with a downward breakout is due to the nature of bear moves in equity markets. Because markets like the stock market are exceedingly long-biased, any dramatic drop below crucial support will have an exceedingly more dramatic move when compared to the forex markets – which are primarily range bound. Another factor that may attribute to the overperformance of this pattern in stock markets vs. forex markets is the ease of shorting in forex vs. the stock market.
Sources:
Kirkpatrick, C. D., & Dahlquist, J. R. (2016). Technical analysis: the complete resource for financial market technicians. Upper Saddle River: Financial Times/Prentice Hall.
Bulkowski, T. N. (2013). Visual guide to chart patterns. New York, NY: Bloomberg Press.
Bulkowski, T. N. (2008). Encyclopedia of candlestick charts. Hoboken, NJ: J. Wiley & Sons.
Bulkowski, T. N. (2002). Trading classic chart patterns. New York: Wiley.
The most common term people associate with retracements in price that retest prior areas of support or resistance is a pullback. There is another term that goes with pullback, and that is a throwback. Let’s review the differences between these two definitions. Pullback Pullbacks occur after the price has moved lower. Think of any pattern […]
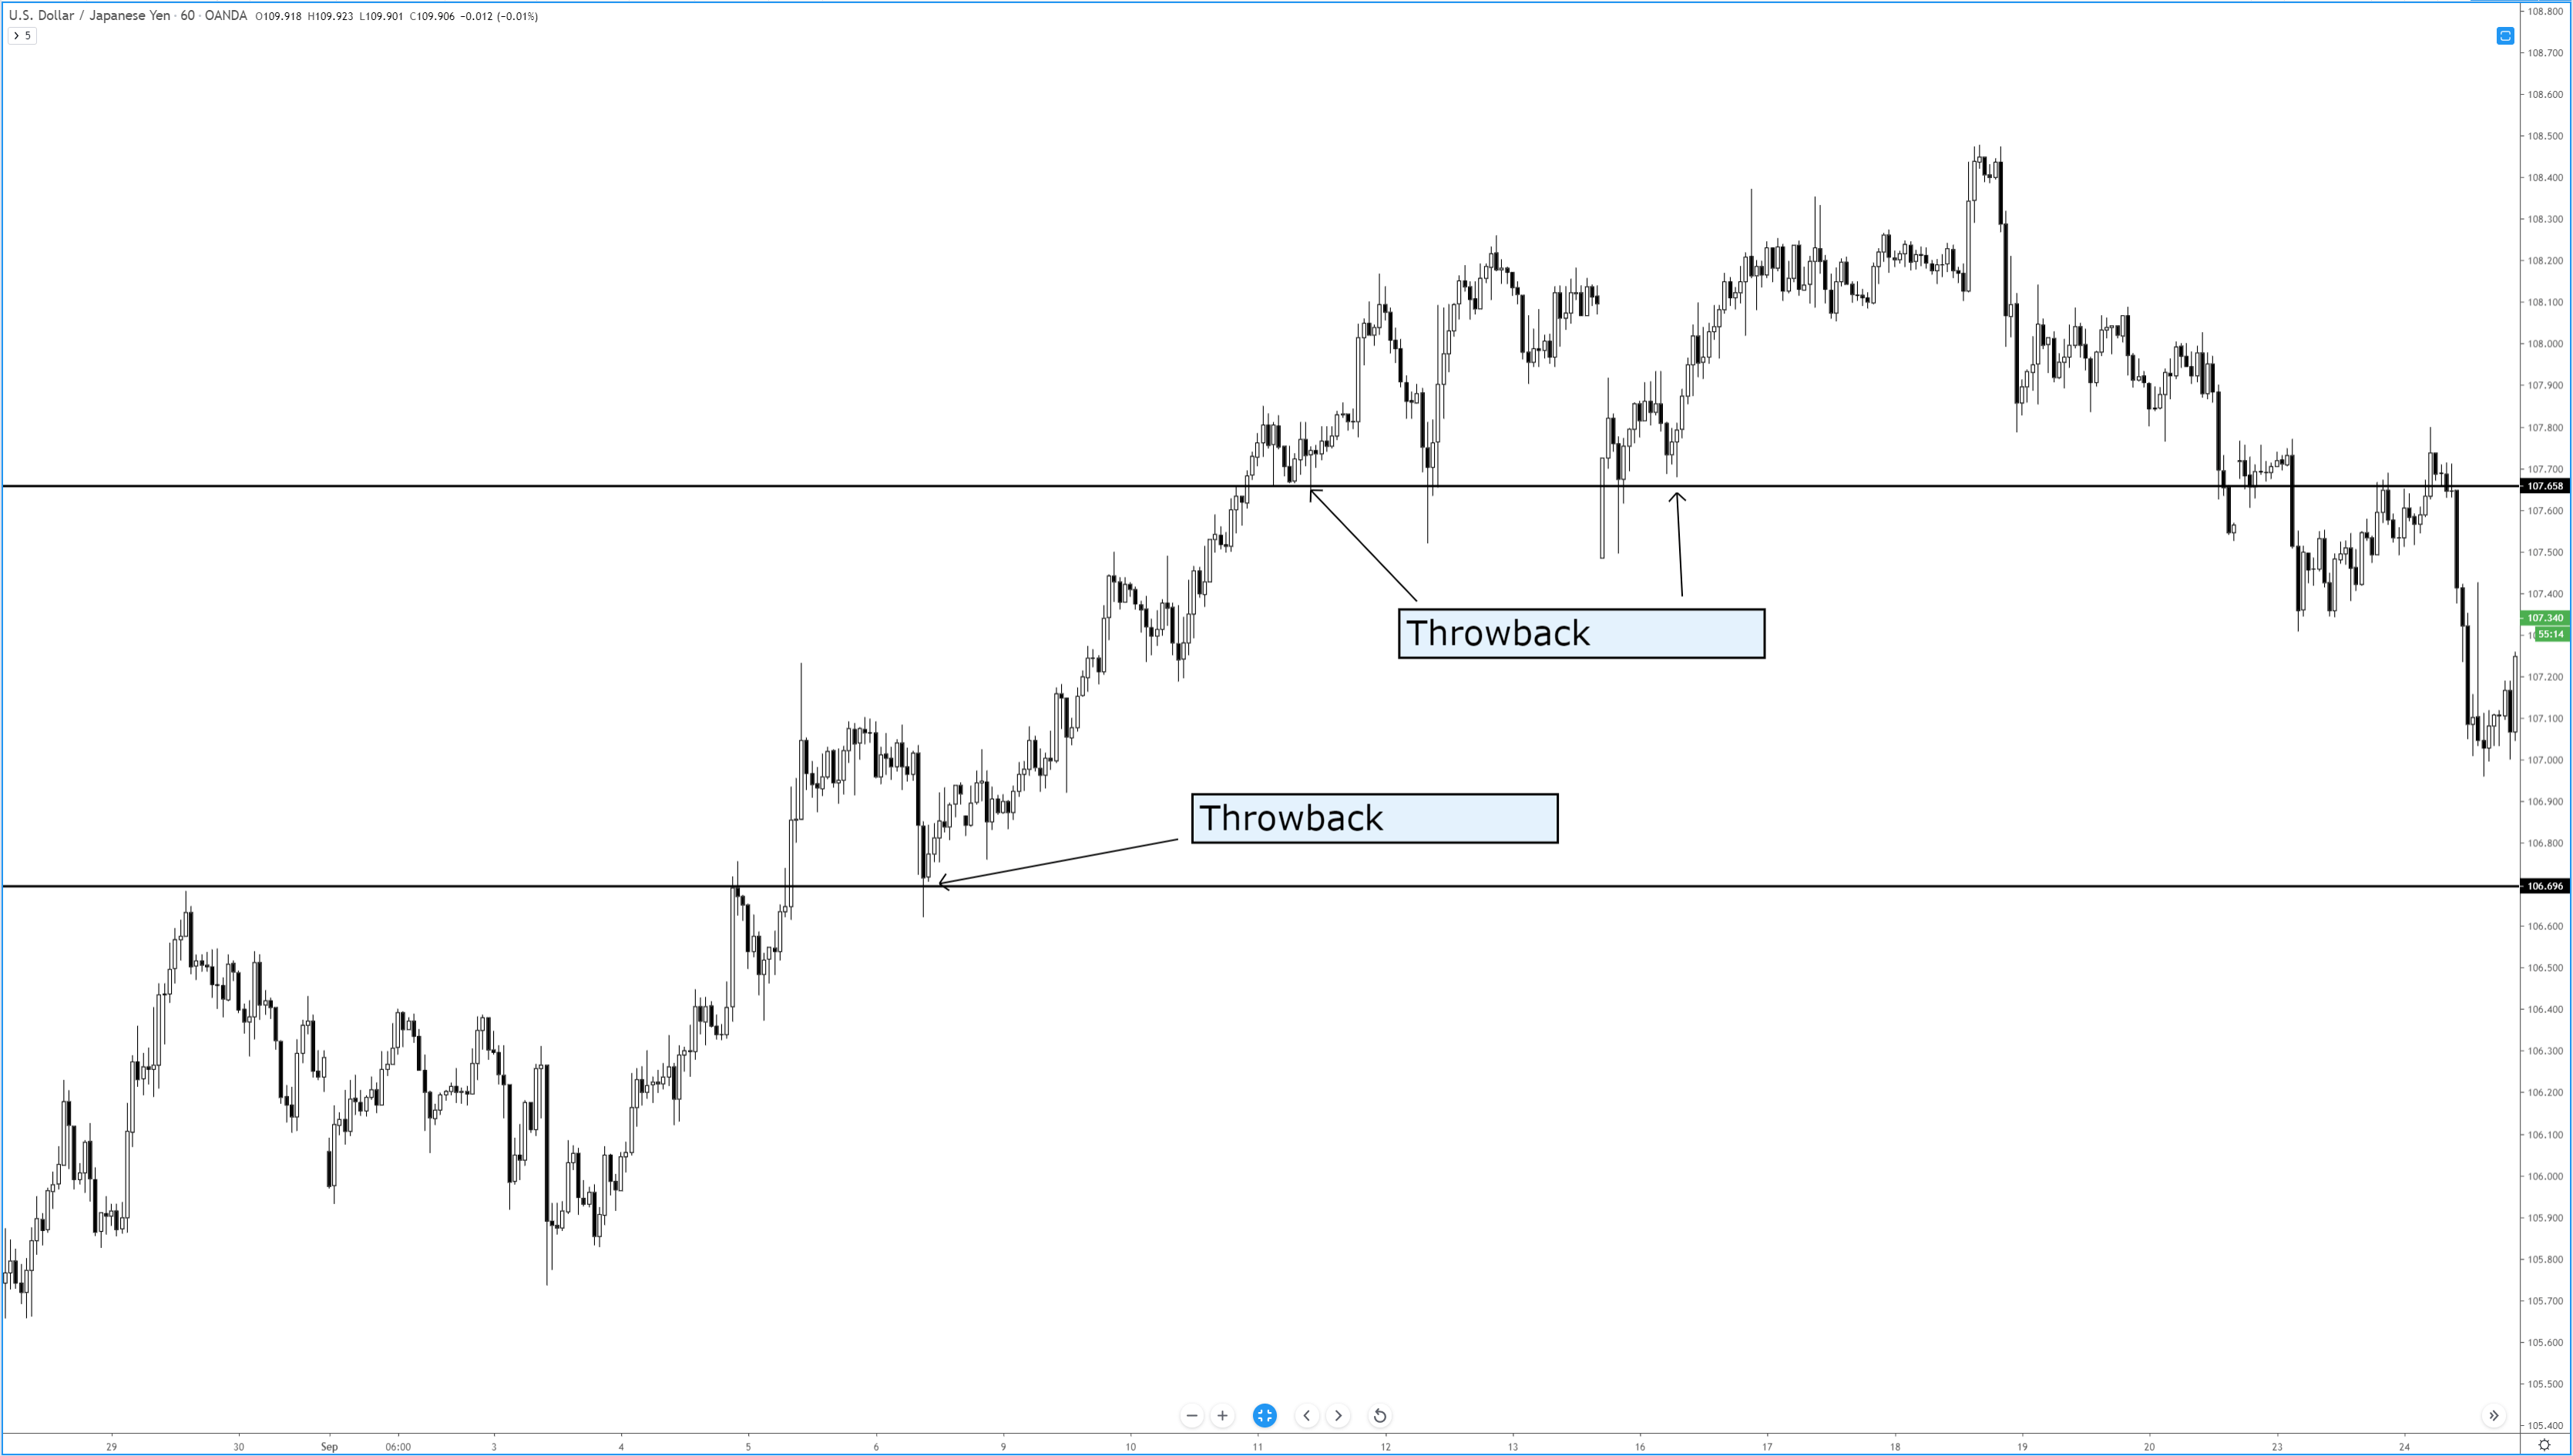
The most common term people associate with retracements in price that retest prior areas of support or resistance is a pullback. There is another term that goes with pullback, and that is a throwback. Let’s review the differences between these two definitions. Pullback Pullbacks occur after the price has moved lower. Think of any pattern […]
The most common term people associate with retracements in price that retest prior areas of support or resistance is a pullback. There is another term that goes with pullback, and that is a throwback. Let’s review the differences between these two definitions.
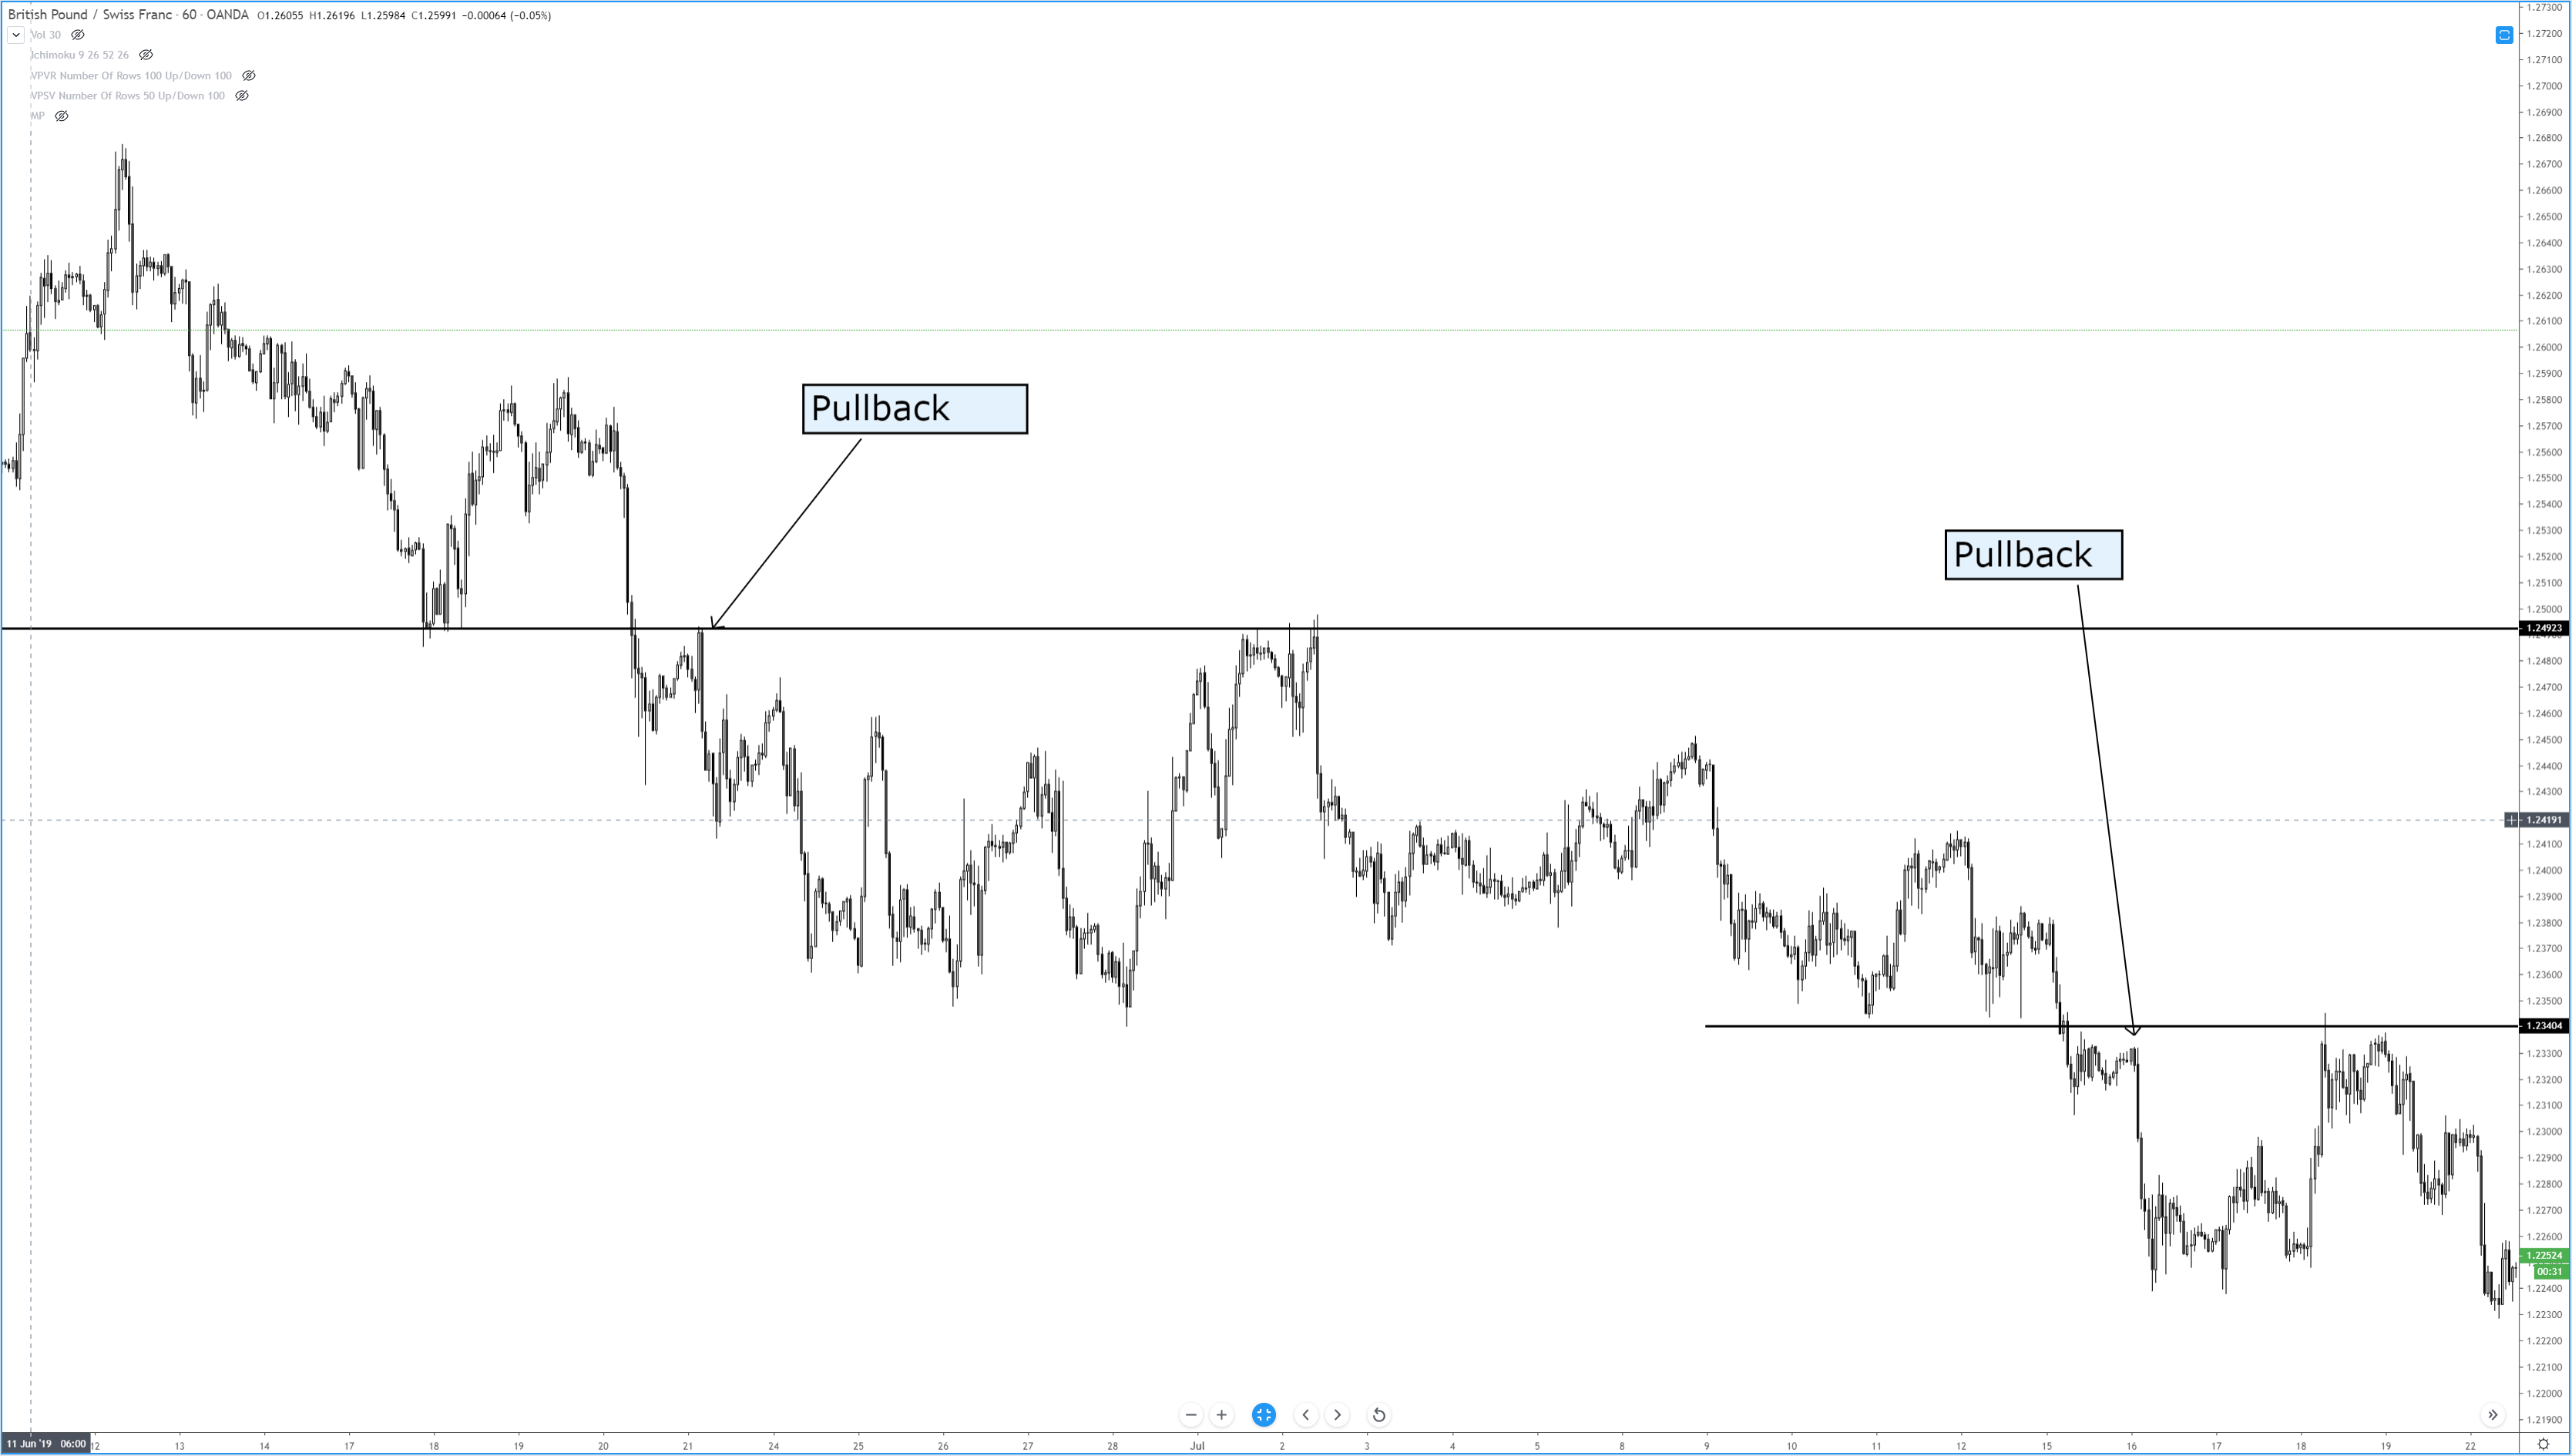
Pullbacks occur after the price has moved lower. Think of any pattern or support line that has price breaking out to the downside. When price pulls back up to the price level of the initial break, that is known as a pullback. Pullbacks occur during breakouts lower.
Throwbacks occur after the price has moved higher. Think of any pattern or level of resistance that has price breaking out to the upside. When the price is thrown back down to the first level of the break, that is known as a throwback. Throwbacks occur during breakouts higher.
While there are different definitions for retests of breakout zones, know that people will often call throwbacks, pullbacks. In practice, the description itself does not matter as much as you see the behavior that price exhibits after breaking out of support or resistance. The table below identifies the average occurrence rate for a pullback or throwback from the following patterns.
|
Pattern |
Pullback Rate (%) |
Throwback Rate (%) |
|
56 |
60 |
|
| Descending Triangle |
55 |
50 |
| —- |
56 |
|
| Inverse Head-And-Shoulder |
—- |
57 |
| Head-And-Shoulder |
59 |
—- |
| Symmetrical Triangle |
58 |
58 |
| Triple Bottom |
—- |
58 |
| 63 |
— |
The table above comes from Thomas Bulkowski’s book, ‘Visual Guide to Chart Patterns.’ His book is part of the Bloomberg Financial Series. Bulkowski is, by far, the authority on the frequency of patterns experiencing pullback and throwbacks. His work focuses extensively on chart patterns. However, there is one problem, and it has nothing to do with his phenomenal work. This is a problem for anyone who focuses primarily on the Forex markets. Why? Because Bulkowski’s work and the broader technical analysis writer/education community focuses primarily on equity markets. This is a big deal because equity markets spend the vast majority of their time in one direction: up. This is especially true over the past decade. Again, this is not a dig towards the truly phenomenal authors and analysts who spend years creating their written work – it’s just a reality of the world we are in. It’s important to understand that the Forex markets, as we know them, are still a relatively new market – especially when compared to the stock market.
If you read Bulkowski’s work or any other work studying the frequency of throwbacks and pullbacks from patterns and support/resistance – I would recommend attributing the same rate of throwbacks to pullbacks in the forex market.
Sources:
Bulkowski, T. N. (2013). Visual guide to chart patterns. New York, NY: Bloomberg Press.
Bulkowski, T. N. (2008). Encyclopedia of candlestick charts. Hoboken, NJ: J. Wiley & Sons.
Bulkowski, T. N. (2002). Trading classic chart patterns. New York: Wiley.
https://youtu.be/Wwhq8UAG8l0
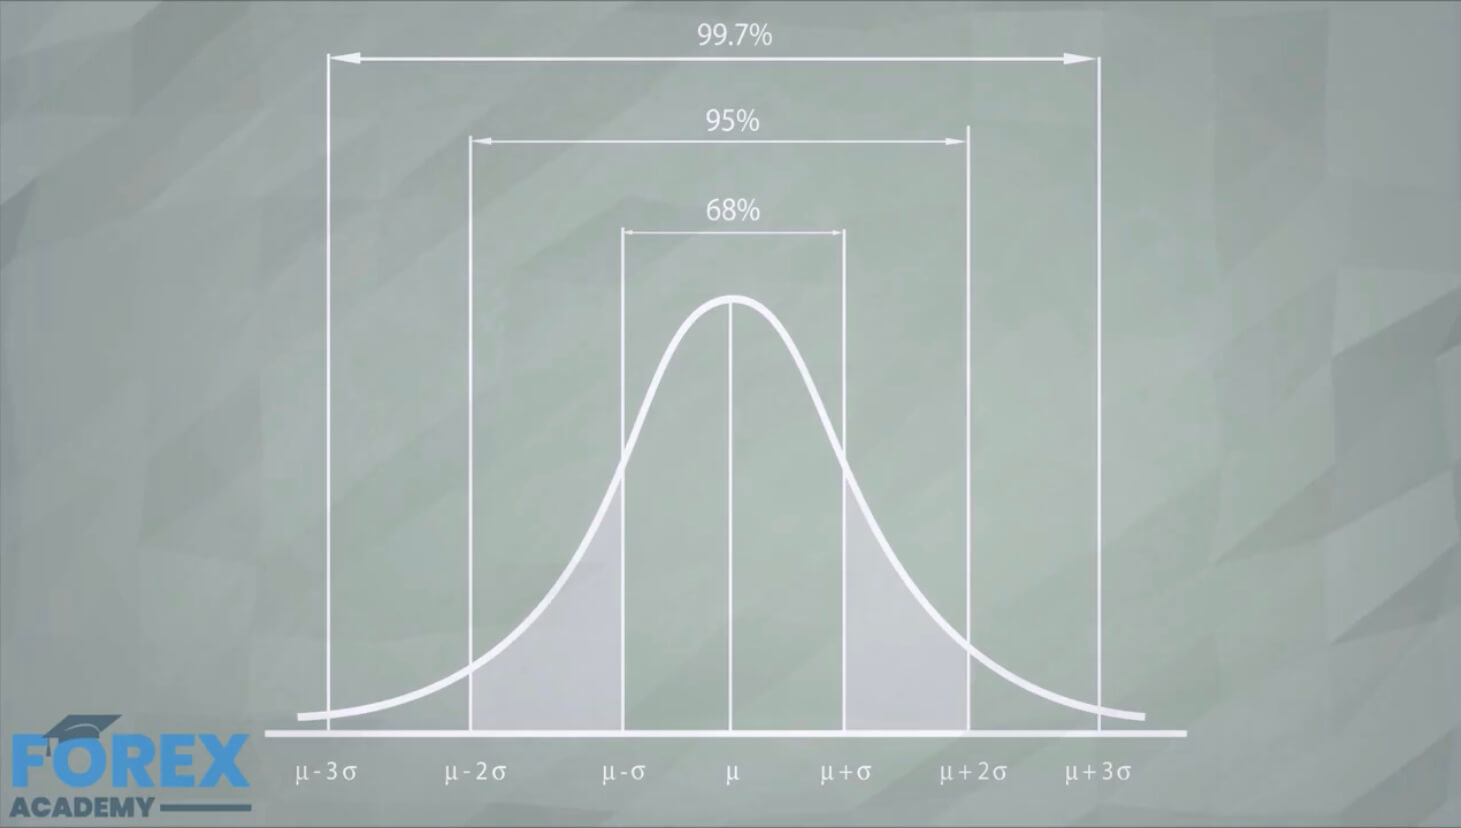
https://youtu.be/Wwhq8UAG8l0
A Distribution comes from our need to measure and qualify objects or items when the potential number of elements is too large to evaluate one by one. It is hardly practical to have a record of all the heights, weights, races, clothes, and shoe sizes of every person. It is impossible to have a record of all possible stock or Forex pairs prices. Of course, we already have a historical record, but we cannot have a record of future prices. But we want and need information about these and other items.

Wouldn’t it be great to have valuable collective information about the properties of the data collection instead of an endless list of prices, heights, or weights?
Let’s imagine that we are to record daily price changes from the current open to the previous day open. We could see that some days the price seldom moves while others there are larger and larger movements. Lets only plot ten possible ranges five on the positive side and five on the negative side, from zero to ±0.21, ± 0.2% – ±0.4%, and on toll ±0.8% -±1%. All changes bigger than 1% will be included in the ±0.8% – ±1% range.
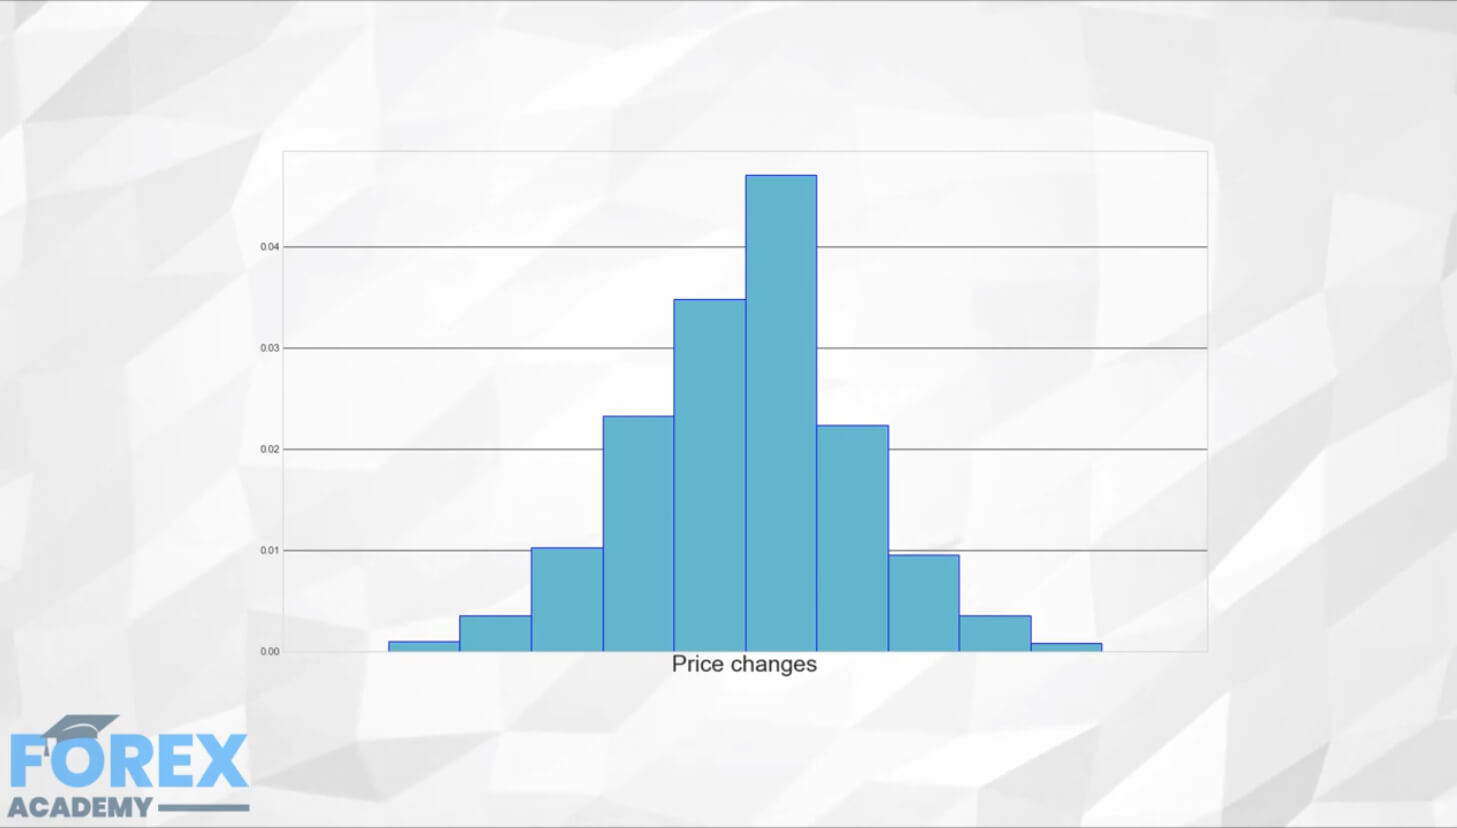
We have made a histogram of price changes. It is a very coarse approach to prices, but it shows useful information. We see that it is more common small changes than large changes, for instance.
We could refine it using more bins. This is how it looks using 40 bins.
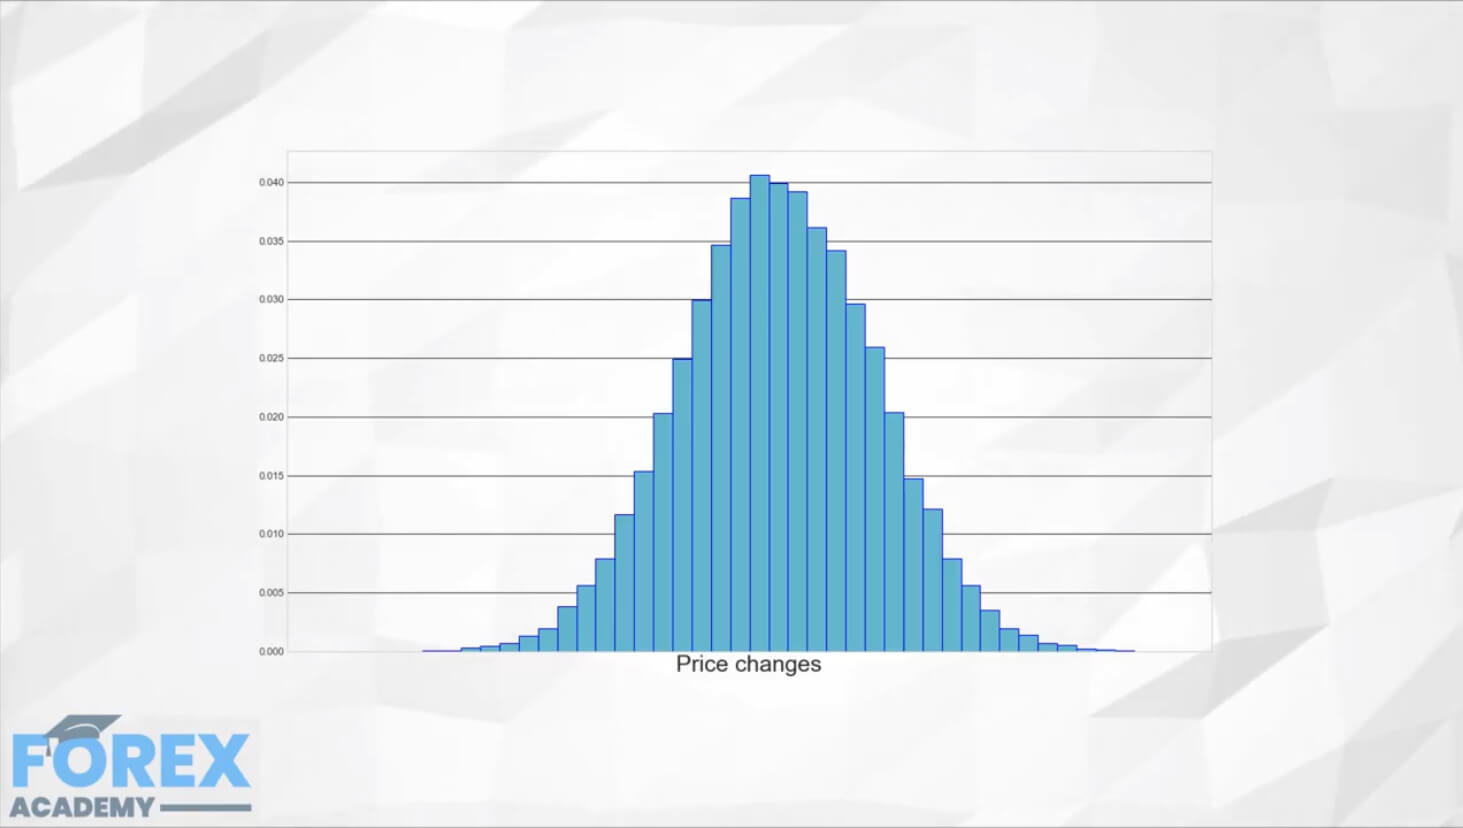
Using fewer bins, we can perceive the same distribution than using more bins. We lose information, but if we chose the bin distribution appropriately binning is quite convenient.
Karl Friedrick Gauss was thought to discover the Normal Distribution, also called Gaussian Distribution, although 100 years earlier was described by Abraham d Moivre. Still, his discovery remained obscured until after Gauss published it. It is considered the most useful distribution in modeling due to the fact that many phenomena follow the Normal Distribution. Measures of height, weight, intelligence levels closely follow the normal distribution. Also, the Normal Distribution is the limiting form of other distribution types.
One of the key statistical applications involving the Gaussian Distribution has to do with how the averages distribute. That is, if we take several random samples of a collection of data, the averages of the samples will approximate to a Normal Distribution, regardless of the distribution of the original data. This is very powerful because it allows us to generalize about future prices from the averages computed using samples of historical data.
The Mean (M)
The most obvious measure of the Normal Distribution is its Average or Mean.
M = SUM ( All elements ) / N (the number of elements)
The mean tells us the most common value of the distribution. If the distribution were about prices, it would tell us the fair value of the asset.
The Standard Deviation (SD)
The other significative measure of the Normal Distribution is the Standard Deviation. Computing it is a bit more complicated than the average, but it is rather easy as well.
The standard deviation tells us how far from the center, on average, are its elements.
1.- We measure the distance of every individual component (dxi) from the mean
dxi = M – xi
2.- Since the differences may be positive or negative, we square this value to take away the sign, creating a collection of squared differences.
dxi2 = dxi^2
3.- We take the average of the squared differences. The result is called the variance (Var).
Var = SUM( dxi2)/ (N-1)
Wait? Why N-1? Well, that has to do with the fact we are dealing with samples, not the whole population. By dividing by N-1 will make the value less optimistic on short samples. As the sample size grows, the Sample Variance gets closer and closer to the population variance.
4.- We take the square root of the sample variance, and the result is the Standard Deviation
SD = √ Var
Normal Probabilities
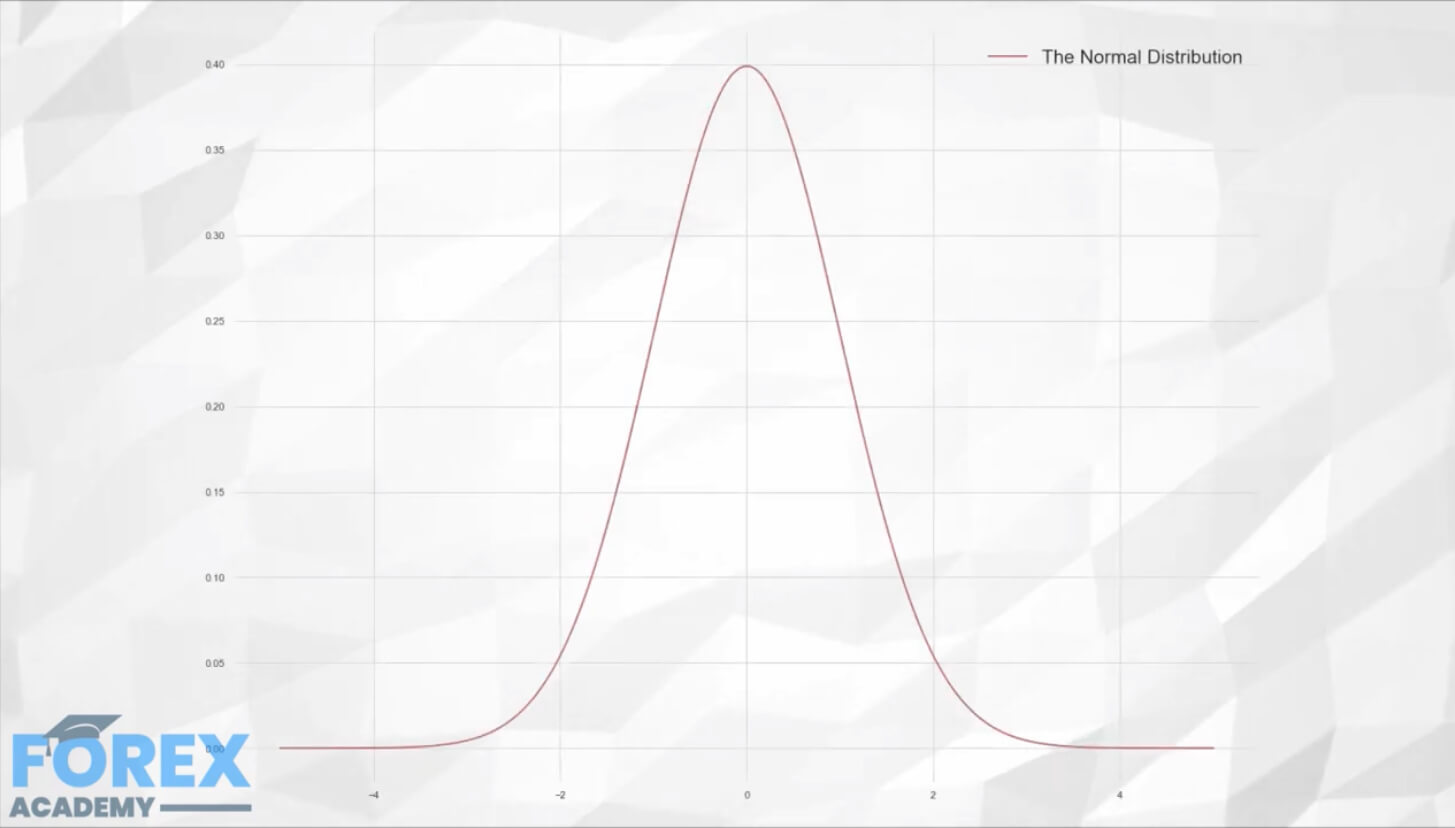
Now that we have our data (prices, trade returns, and so forth), we can use the normal distribution to extract useful information.
If the distribution, for instance, were the returns of our strategy, we would arrive at two main values: The average profit and the standard Deviation of the profits. What can that tell us about what to expect from our future returns?
The Normal Distribution is well known, so we have how values are statistically distributed.
We know that 68.2% of the values lie within one SD from the mean, 95.4% of the values lie within 2SD, and 99.7% of them within 3SD.
Let’s say as an exercise that your mean gain is 100 dollars with an SD of 60. What can we expect from our future profits?
As a caveat, Usually, the distribution of gains and losses is not normally distributed. Therefore we should not expect the percentages shown here. As homework, google about the Chevyshev’s inequality for a more general probability scaling.
Current Account vs. Capital Account
Current Account vs. Capital Account
The Current Account and Capital Account make up the two components of the Balance of Payments in international trade. The Capital Account represents the changes in asset value through investments, loans, banking balances, and real property value and is less immediate and more invisible than the current account.
The Current Account is a record of a country’s transactions with the rest of the world. It records the net trade in goods and services, the net earnings on cross-border investments, and the net transfer of payments over a defined period of time. The ratio of the current account balance to the Gross Domestic Product provides the trader with an indication of the country’s level of international competitiveness in world markets.
Trade balance: which is the difference between the total value of exports of goods and services and the total value of imports of goods and services.
The net factor income: being the difference between the return on investment generated by citizens abroad and payments made to foreign investors domestically and,
Net cash transfers: where all these elements are measured in the local currency.
The current account of a nation is influenced by numerous factors from its trade policies, exchange rates, international competitiveness, foreign exchange reserves, inflation rate, and other factors. The trade balance, which is the result of exports minus imports, is generally the most significant determining factor of the current account surplus or deficit.
When a country’s current account balance is positive, the country is considered a net lender to the rest of the world, and this is also known as incurring a surplus. When a country’s current account balance is in the negative, known as running a deficit, the country is a net borrower from the rest of the world.
A Current Account Deficit occurs when a country spends more on what it imports than what it receives on goods and services it exports. This term should not be confused with a trade deficit, which happens when a country’s imports exceed its exports.
When a country is experiencing a strong economic expansion, import volumes may surge as a result. However, if a country’s exports are unable to grow at the same rate, the current account deficit will widen. During a recession, the current account deficit will shrink if the imports decline and exports increase to countries with stronger economies.
The currency exchange rate has a huge impact on the trade balance, and as a result, on the current account. A currency that is overvalued leads to imports being cheaper and thus making exports less competitive and widening the current account deficit. An undervalued currency can boost exports and make imports more expensive, thus increasing the current account surplus. Countries with a chronic current account deficit will be subjected to investor scrutiny during these periods of heightened uncertainty. This situation creates volatility in the markets as precious foreign exchange reserves are depleted to support the domestic currency. The forex reserve depletion, in combination with a deteriorating trade balance, puts further pressure on the currency in question. This leads countries to take stringent measures to support the currency, such as raising interest rates and curbing currency outflows.
The Organisation for Economic Co-operation and Development (OECD) was founded in 1961 “[…] to promote policies that will improve the economic and social well-being of people around the world” (Source: OECD) and is comprised of 34 countries. The OECD publishes quarterly reports comparing figures on the balance of payments and international trade of its 34 members.
Here you can get detailed information on the 34 listed countries Current Account Balance https://data.oecd.org/chart/5NMc
A way to analyze the markets other than fundamental analysis is technical analysis. In this lesson, we shall exactly understand what technical analysis is, and also the different techniques to analyze the market using technical analysis.

A way to analyze the markets other than fundamental analysis is technical analysis. In this lesson, we shall exactly understand what technical analysis is, and also the different techniques to analyze the market using technical analysis.
A way to analyze the markets other than fundamental analysis is technical analysis. In this lesson, we shall exactly understand what technical analysis is, and also the different techniques to analyze the market using technical analysis.
In simple terms, technical analysis can be defined as the study of price movements.
Unlike fundamental analysis, where people study the factors which affect the supply and demand of the market, technical analysis involves the study of the historical price movements and the present market condition.
Let us answer this question by bringing up an analogy.
The first thing one must understand about the market is that the forex market business is no different from a real-life business.
For instance, let’s say there’s a car dealer and they have been selling one particular car for six months by varying the prices every month. And an illustration of the sales report is given below.
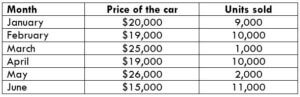
Now, from the above table, can you predict what could be priced in the near future? If yes, then you can consider yourself as a technical analyst, as this is what technical analysts do.
Consider the above table. We can see that initially, the car was priced at $20,000, and 9,000 units of the car were sold. Next month, the owner price reduced by $1,000, and the sales increased by 1,000 units. Seeing this demand in the car, the owner increases the price to $25,000. But, this time the sales drop down to 1,000 units. So, the car owner reduces the price back to $19,000. And he observes that the sales increase from 1,000 to 10,000. Later, he again raises the price to $26,000.
Now, by analyzing the past price movements, we can predict with a high probability that the price will reduce yet again, as the previous time the price came to $25,000, the price dropped drastically. Thus, looking at the price of the car in June, we can see that the price did fall to $15,000.
Therefore, the above example, in a nutshell, is referred to as Technical Analysis.
Switching back to the Forex market, the analysis is done similarly. The only difference being the Forex market involves the trading of currency pairs, and the real market consists of the buying and selling of products.
Hence, from this, we can conclude that a market moves as per the historical price movements. The above example is just to give you a gist of how technical analysis work. There are many more complex ways to accurately predict the market using technical analysis. Price Action traders do their technical analysis using different types of charts (like candlesticks, bars, lines, area, etc.), timeframes, and indicators.
Hence, this brings us to the end of this lesson. In the lessons coming forward, we shall be discussing tons of stuff related to technical analysis. So, stay tuned.
[wp_quiz id=”56618″]Introduction
Introduction
EURNZD is the abbreviation for the Euro area’s euro and the New Zealand dollar. It is classified under the minor/cross currency pairs. In EURNZD, EUR is the base currency pair, and NZD is the quote currency. As a matter of fact, in all currency pairs with euro in it, EUR is the base currency.
The value of this pair defines the New Zealand dollars required to purchase one euro. It is quoted as 1 EUR per X NZD. For example, if the value of value in the market is 1.6650, it implies that to buy one euro, the trader has to pay 1.6650 New Zealand dollars for it.
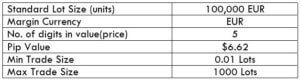 Spread
Spread is a very popular term in the forex industry. This is the way through which the broker makes revenue. Spread is simply the difference between the bid price and the ask price. It differs from the type of account model. The spread on ECN and STP is given below.
ECN: 0.9 | STP: 1.7
For every position that a trader opens, there is some fee associated with it. And it depends on the type of account model. It is seen that there is no fee on STP accounts and a few pips on ECN accounts.
Slippage is the difference between the price the trader had demanded and the actual price the trade was executed. Slippage happens when trades are taken using market orders. Slippage has a significant load on the total cost of the trade. More on this shall be discussed towards the end of this article.
A part of the analysis in trading is knowing the volatility of the market. Volatiltiy will give an close idea on the number of pips the currency pair will move in a given timeframe. The trading range depicts the minimum, average, and maximum pip movement in a specified time frame. Below are the values for EUNZD.
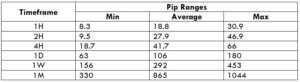
Cost as a percent of the trading range represents the cost percentage that a trader is bearable for each trade they take. The percentage is obtained by finding the ratio between the total cost and volatility. With these percentage values, we come into the conclusion of the best time to enter and exit the market with minimal costs.
Spread = 0.9 | Slippage = 2 | Trading fee = 1
Total cost = Slippage + Spread + Trading Fee = 2 + 0.9 + 1 = 3.9
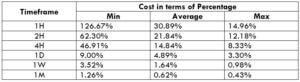
Spread = 1.7 | Slippage = 2 | Trading fee = 0
Total cost = Slippage + Spread + Trading Fee = 2 + 1.7 + 0 = 3.7

By analyzing the percentages obtained above, we can find ways to reduce risk and cost on every trade of EURNZD. Firstly, the percentage tells the cost variation for different volatilities in different timeframes. The values are large in the first (Min) column. Meaning, the costs are high in the min column. Also, since this column represents low volatility, it implies that costs are high when the volatility is low and vice versa. In the average column, the costs are neither too high nor too low. And the volatility is under balance as well. Hence, this turns out to be the ideal time to trade in the market.
Moreover, another feasible technique to reduce cost is by placing limit orders. By the use of limit orders, a trader will eradicate the existence of slippage on the trade, and, in turn, reduce the total cost on the trade considerably. An example of the same is given below.
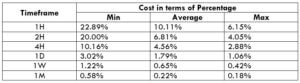
Comparing this table with the previous table, it is evident that the percentages have almost halved. Hence, entering and exiting trades using limit orders can prove to be very advantageous to reduce costs on trade.
Fibonacci Confluence Zones
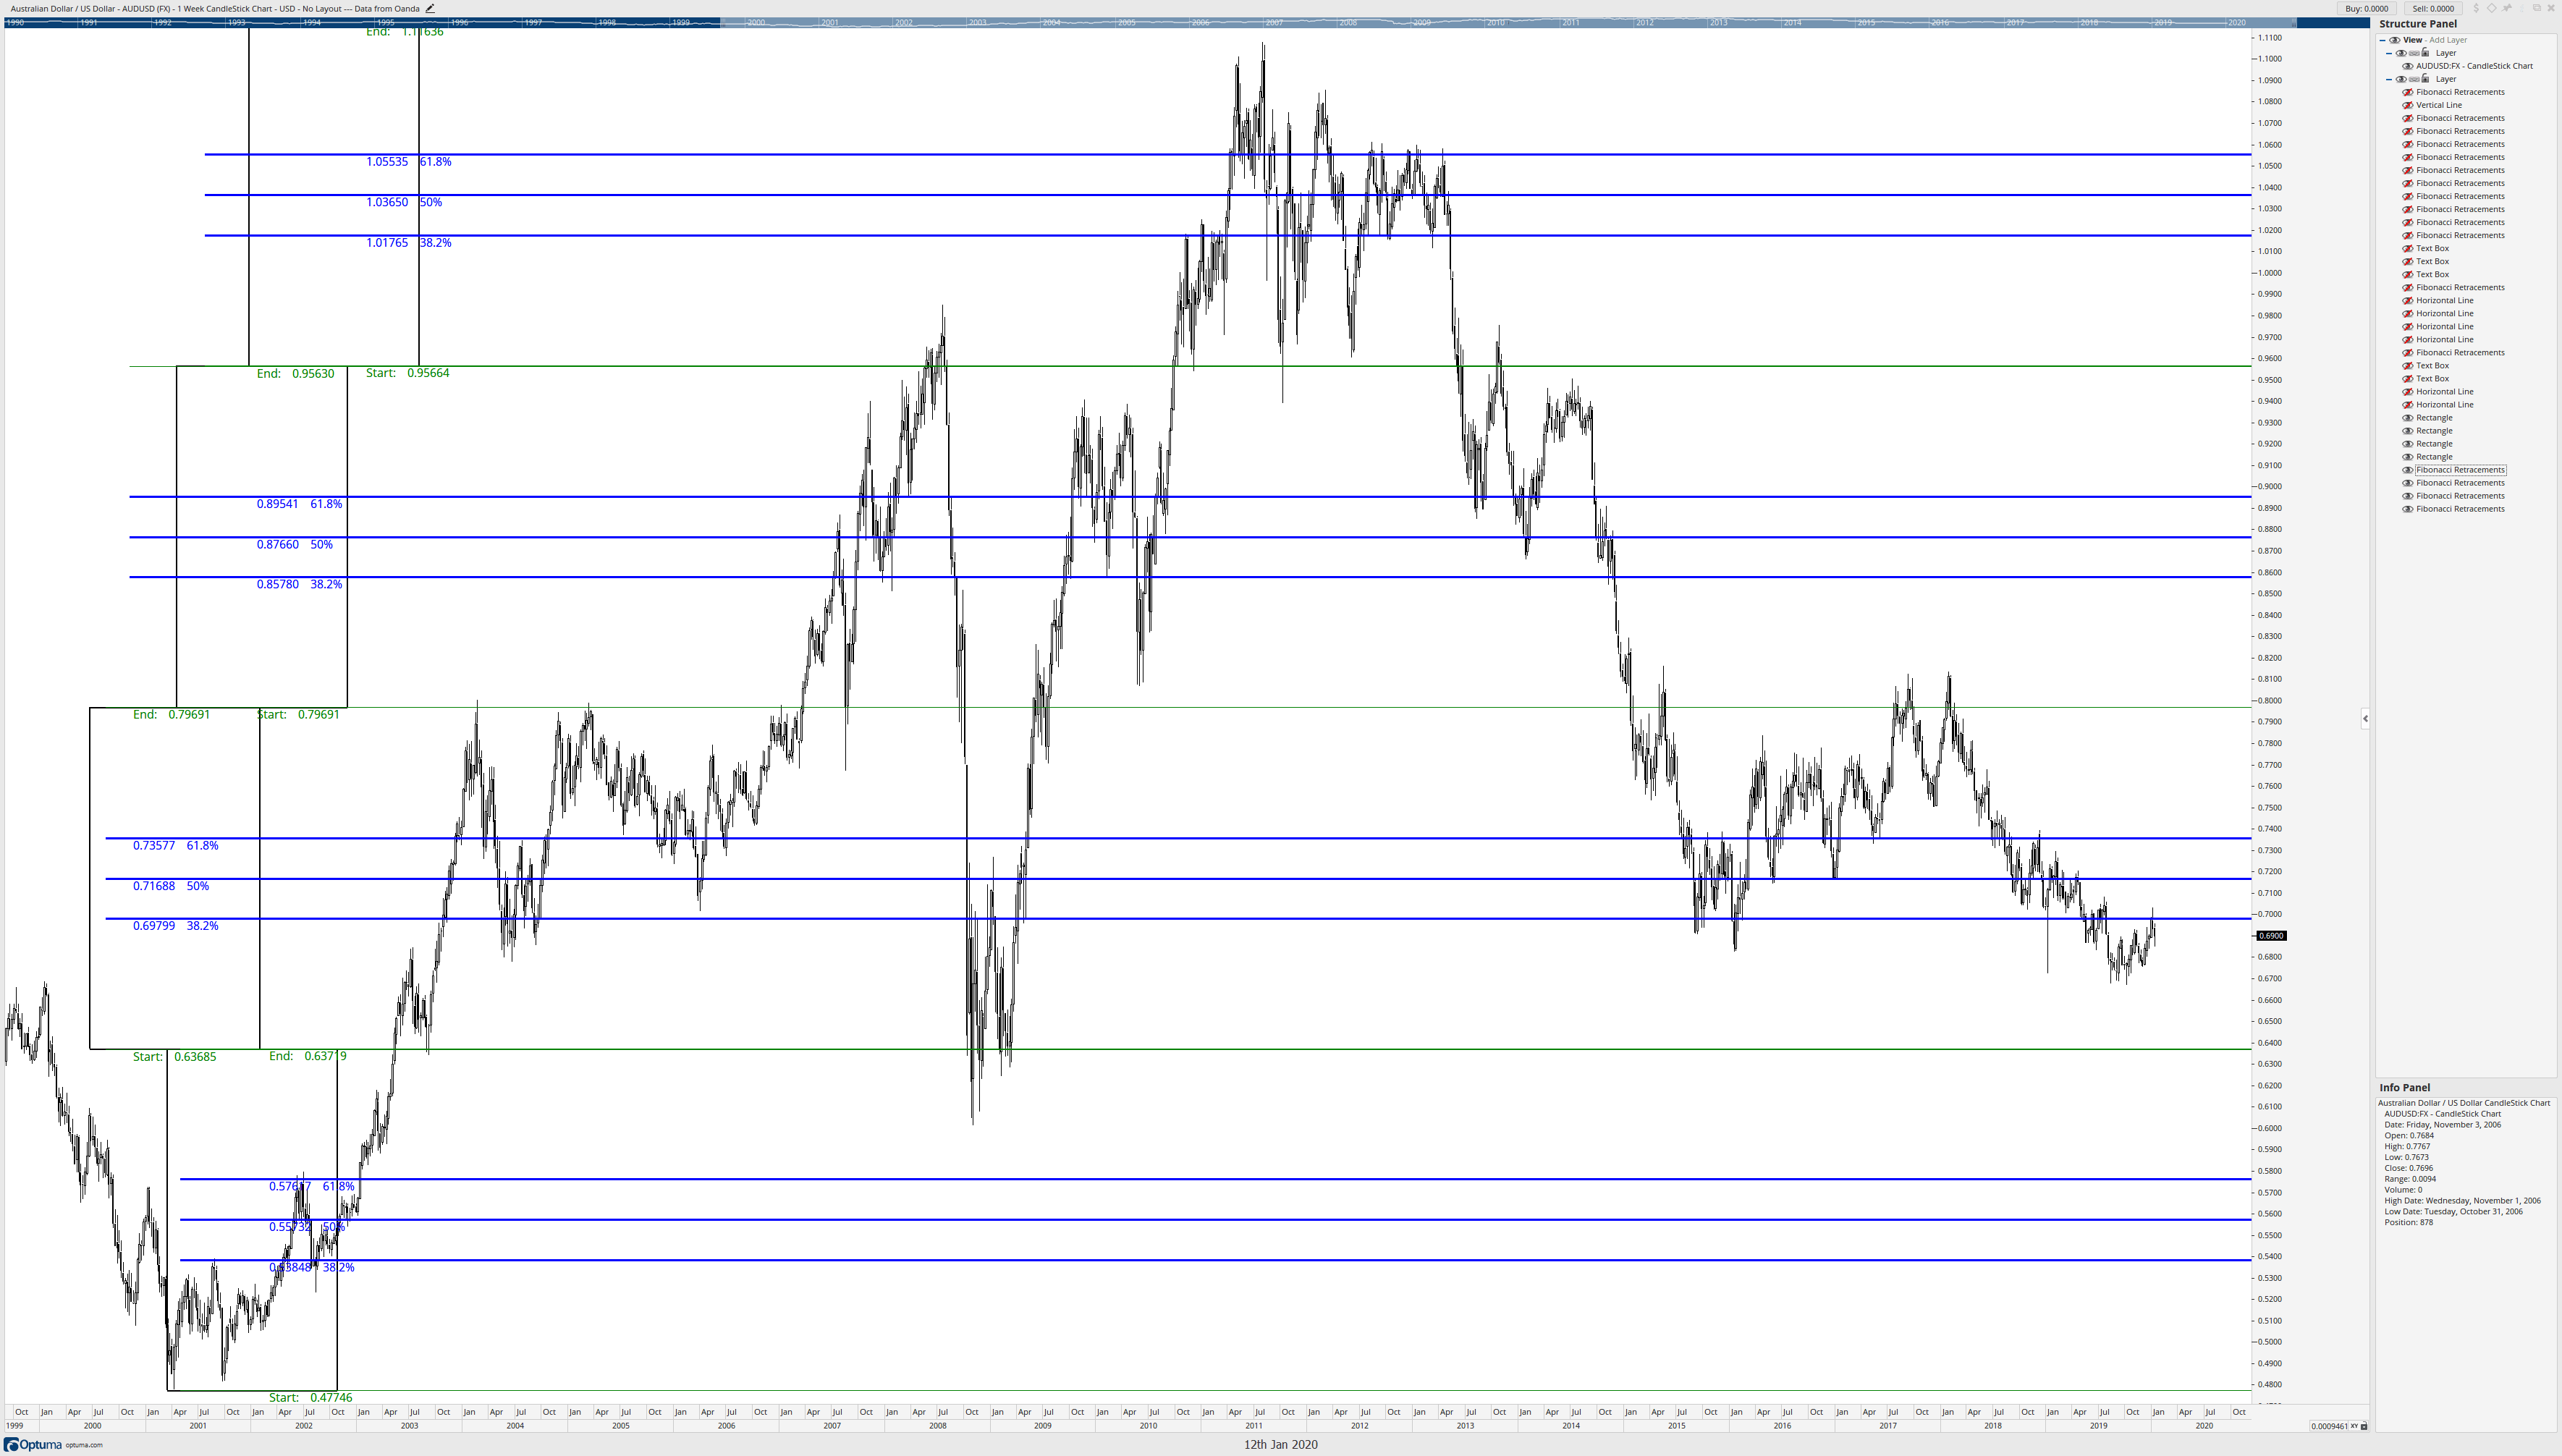
Fibonacci Confluence Zones
If you have not first read my article, ‘You’re still misusing Fibonacci retracements,’ please do so before reading this article. This article will continue where we left off in discussing the new and improved way of drawing accurate and efficient Fibonacci retracements using the Brown Method. I am going to use the same Forex pair that we used in the first article. The purpose of this article is to show you how you can create Fibonacci Confluence Zones to create natural price levels that act as future support and resistance. First, I am going to start my first swing using the March 2001 low and then retracing back to the confirmation swing high in March 1997. See below.
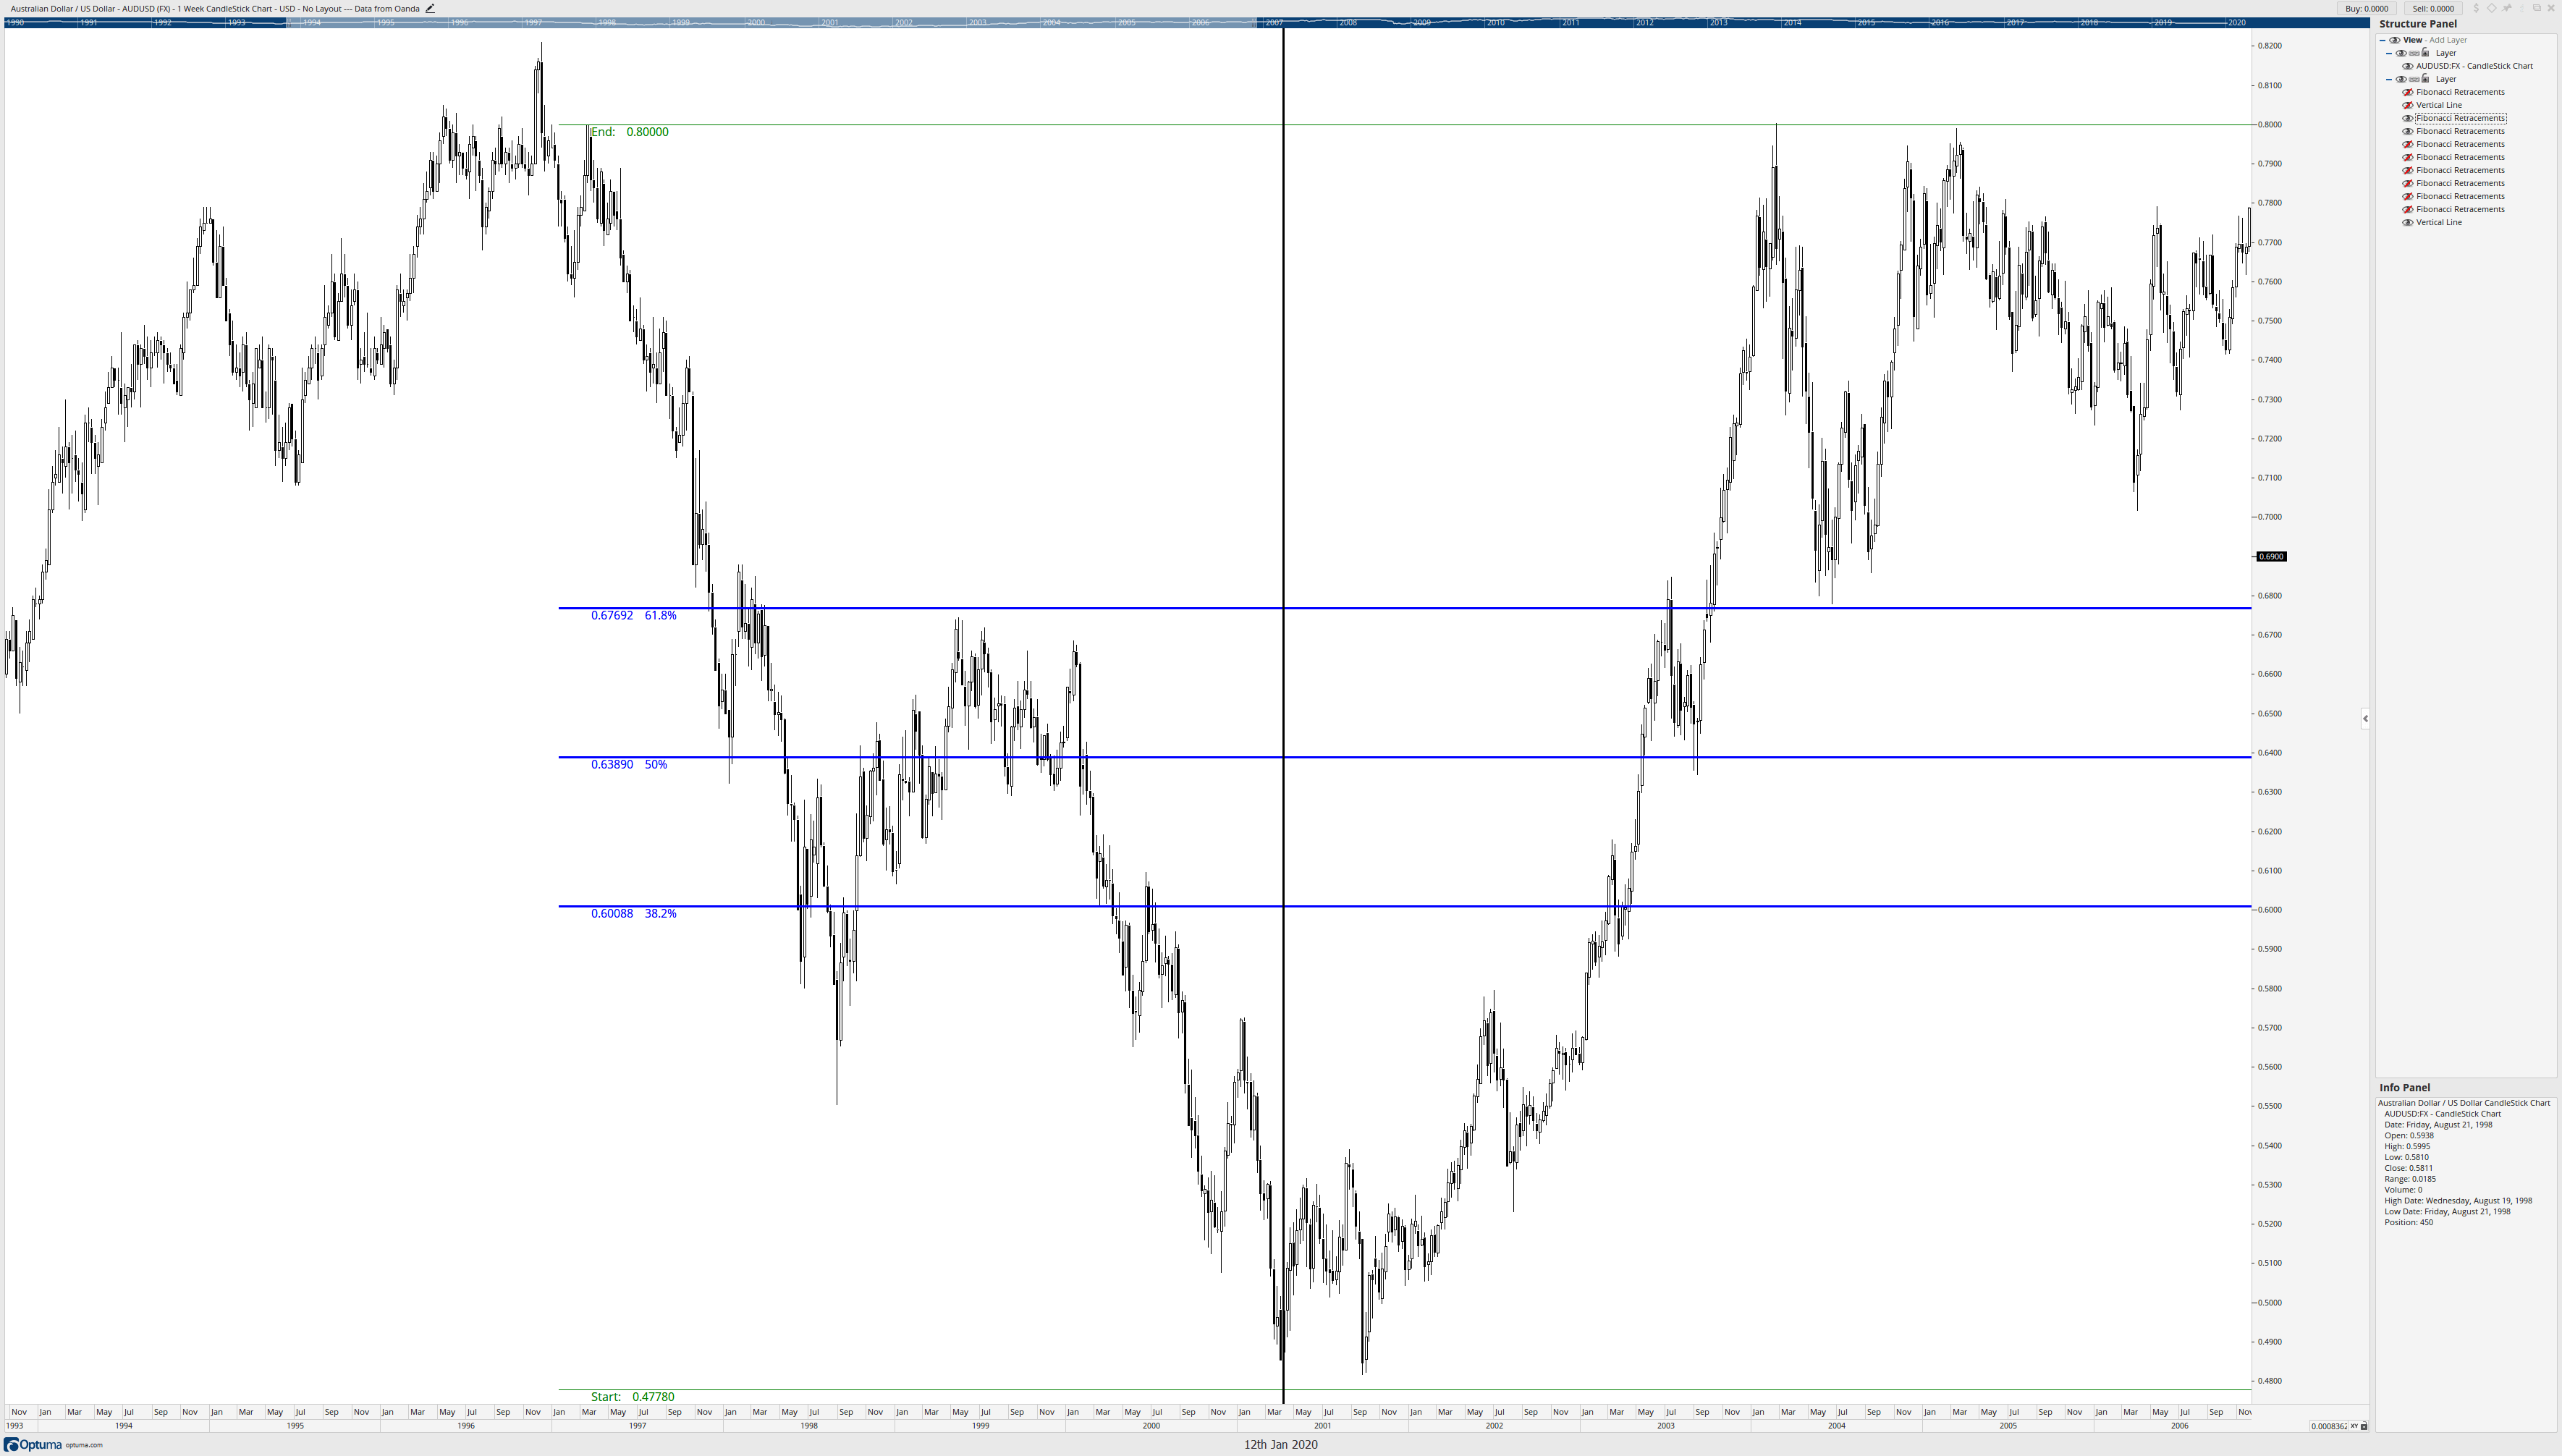
First, I want to know if this retracement is appropriate given how much time has passed – we’re 23 years from the March 1997 high and 19 years from the March 2001 low. Do these Fibonacci retracement levels still work? Do they remain valid? The black vertical line is the start of the retracement, so anything before the retracement is not used, it’s the data afterward that matters. Let’s look.
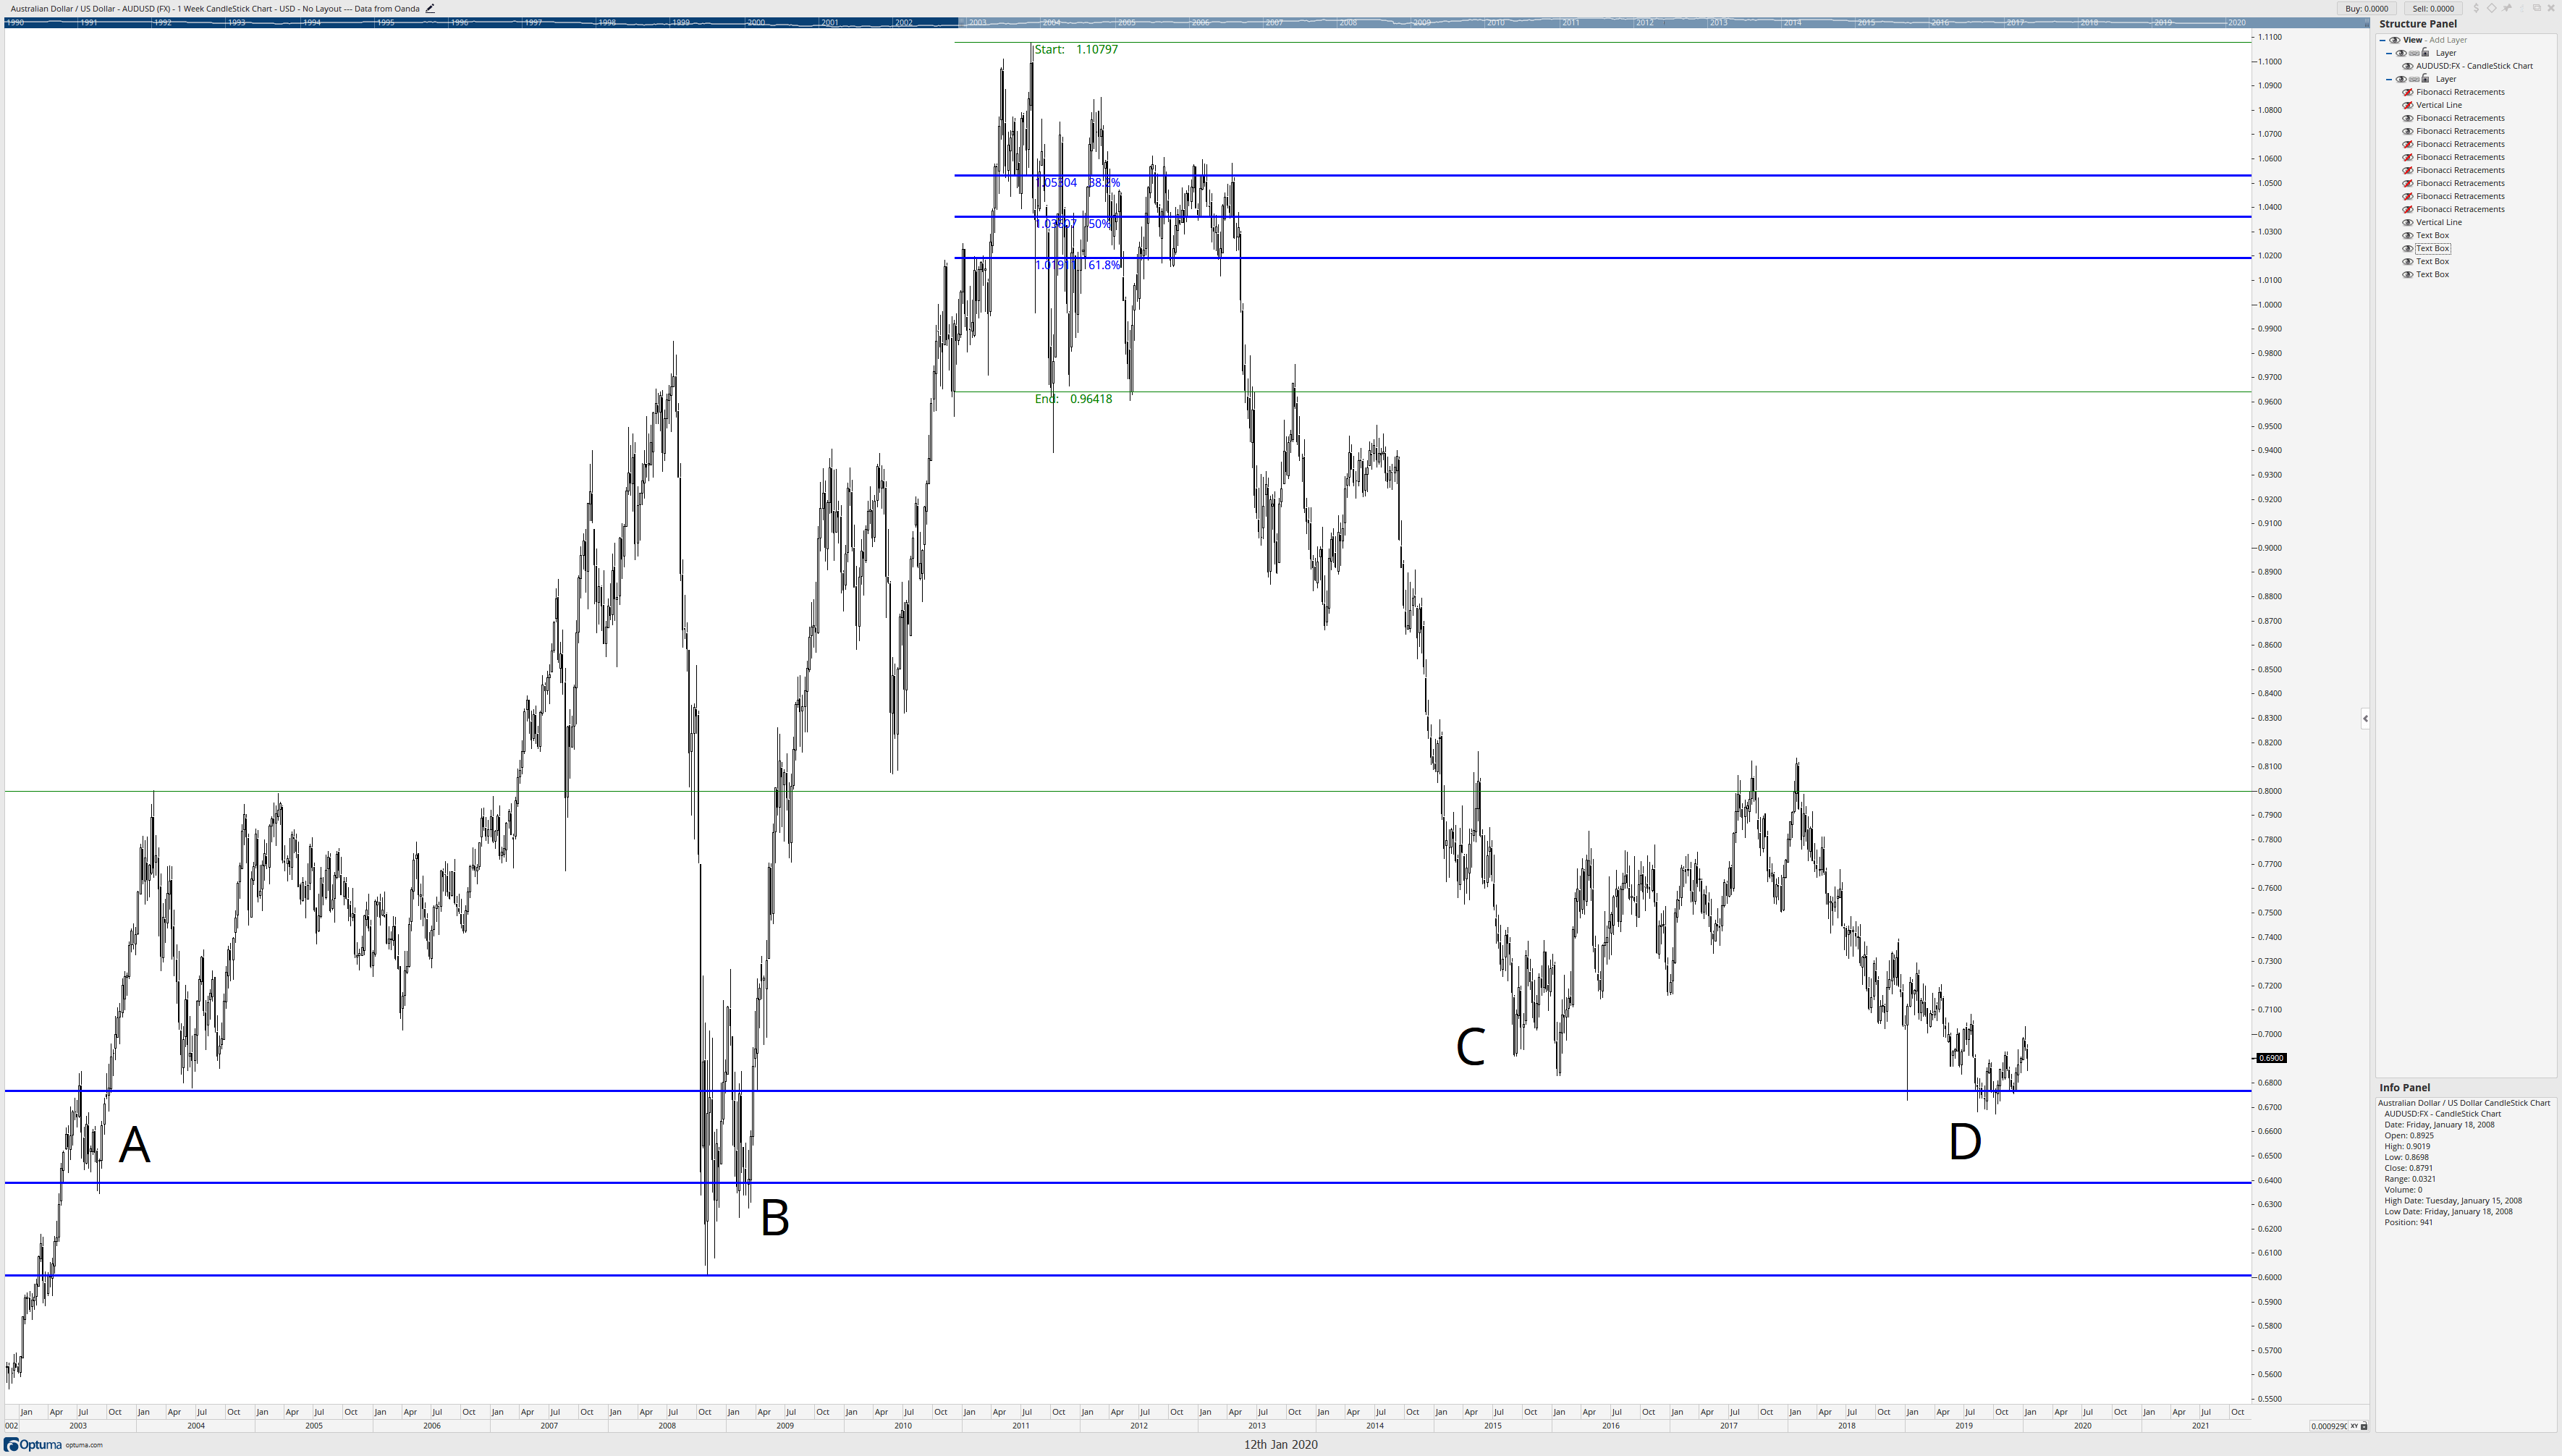
Are these Fibonacci retracement levels we drew still relevant? I would say so. A quick look at A, B, C, and D prove it. Especially for the most recent data at D on the AUDUSD weekly chart – seven-year lows bounce off of the 61.8% Fibonacci retracement level from 20+ years ago! But let’s look at some more Fibonacci retracements made off of other significant swings. Fair warning: there’s going to be several images here.
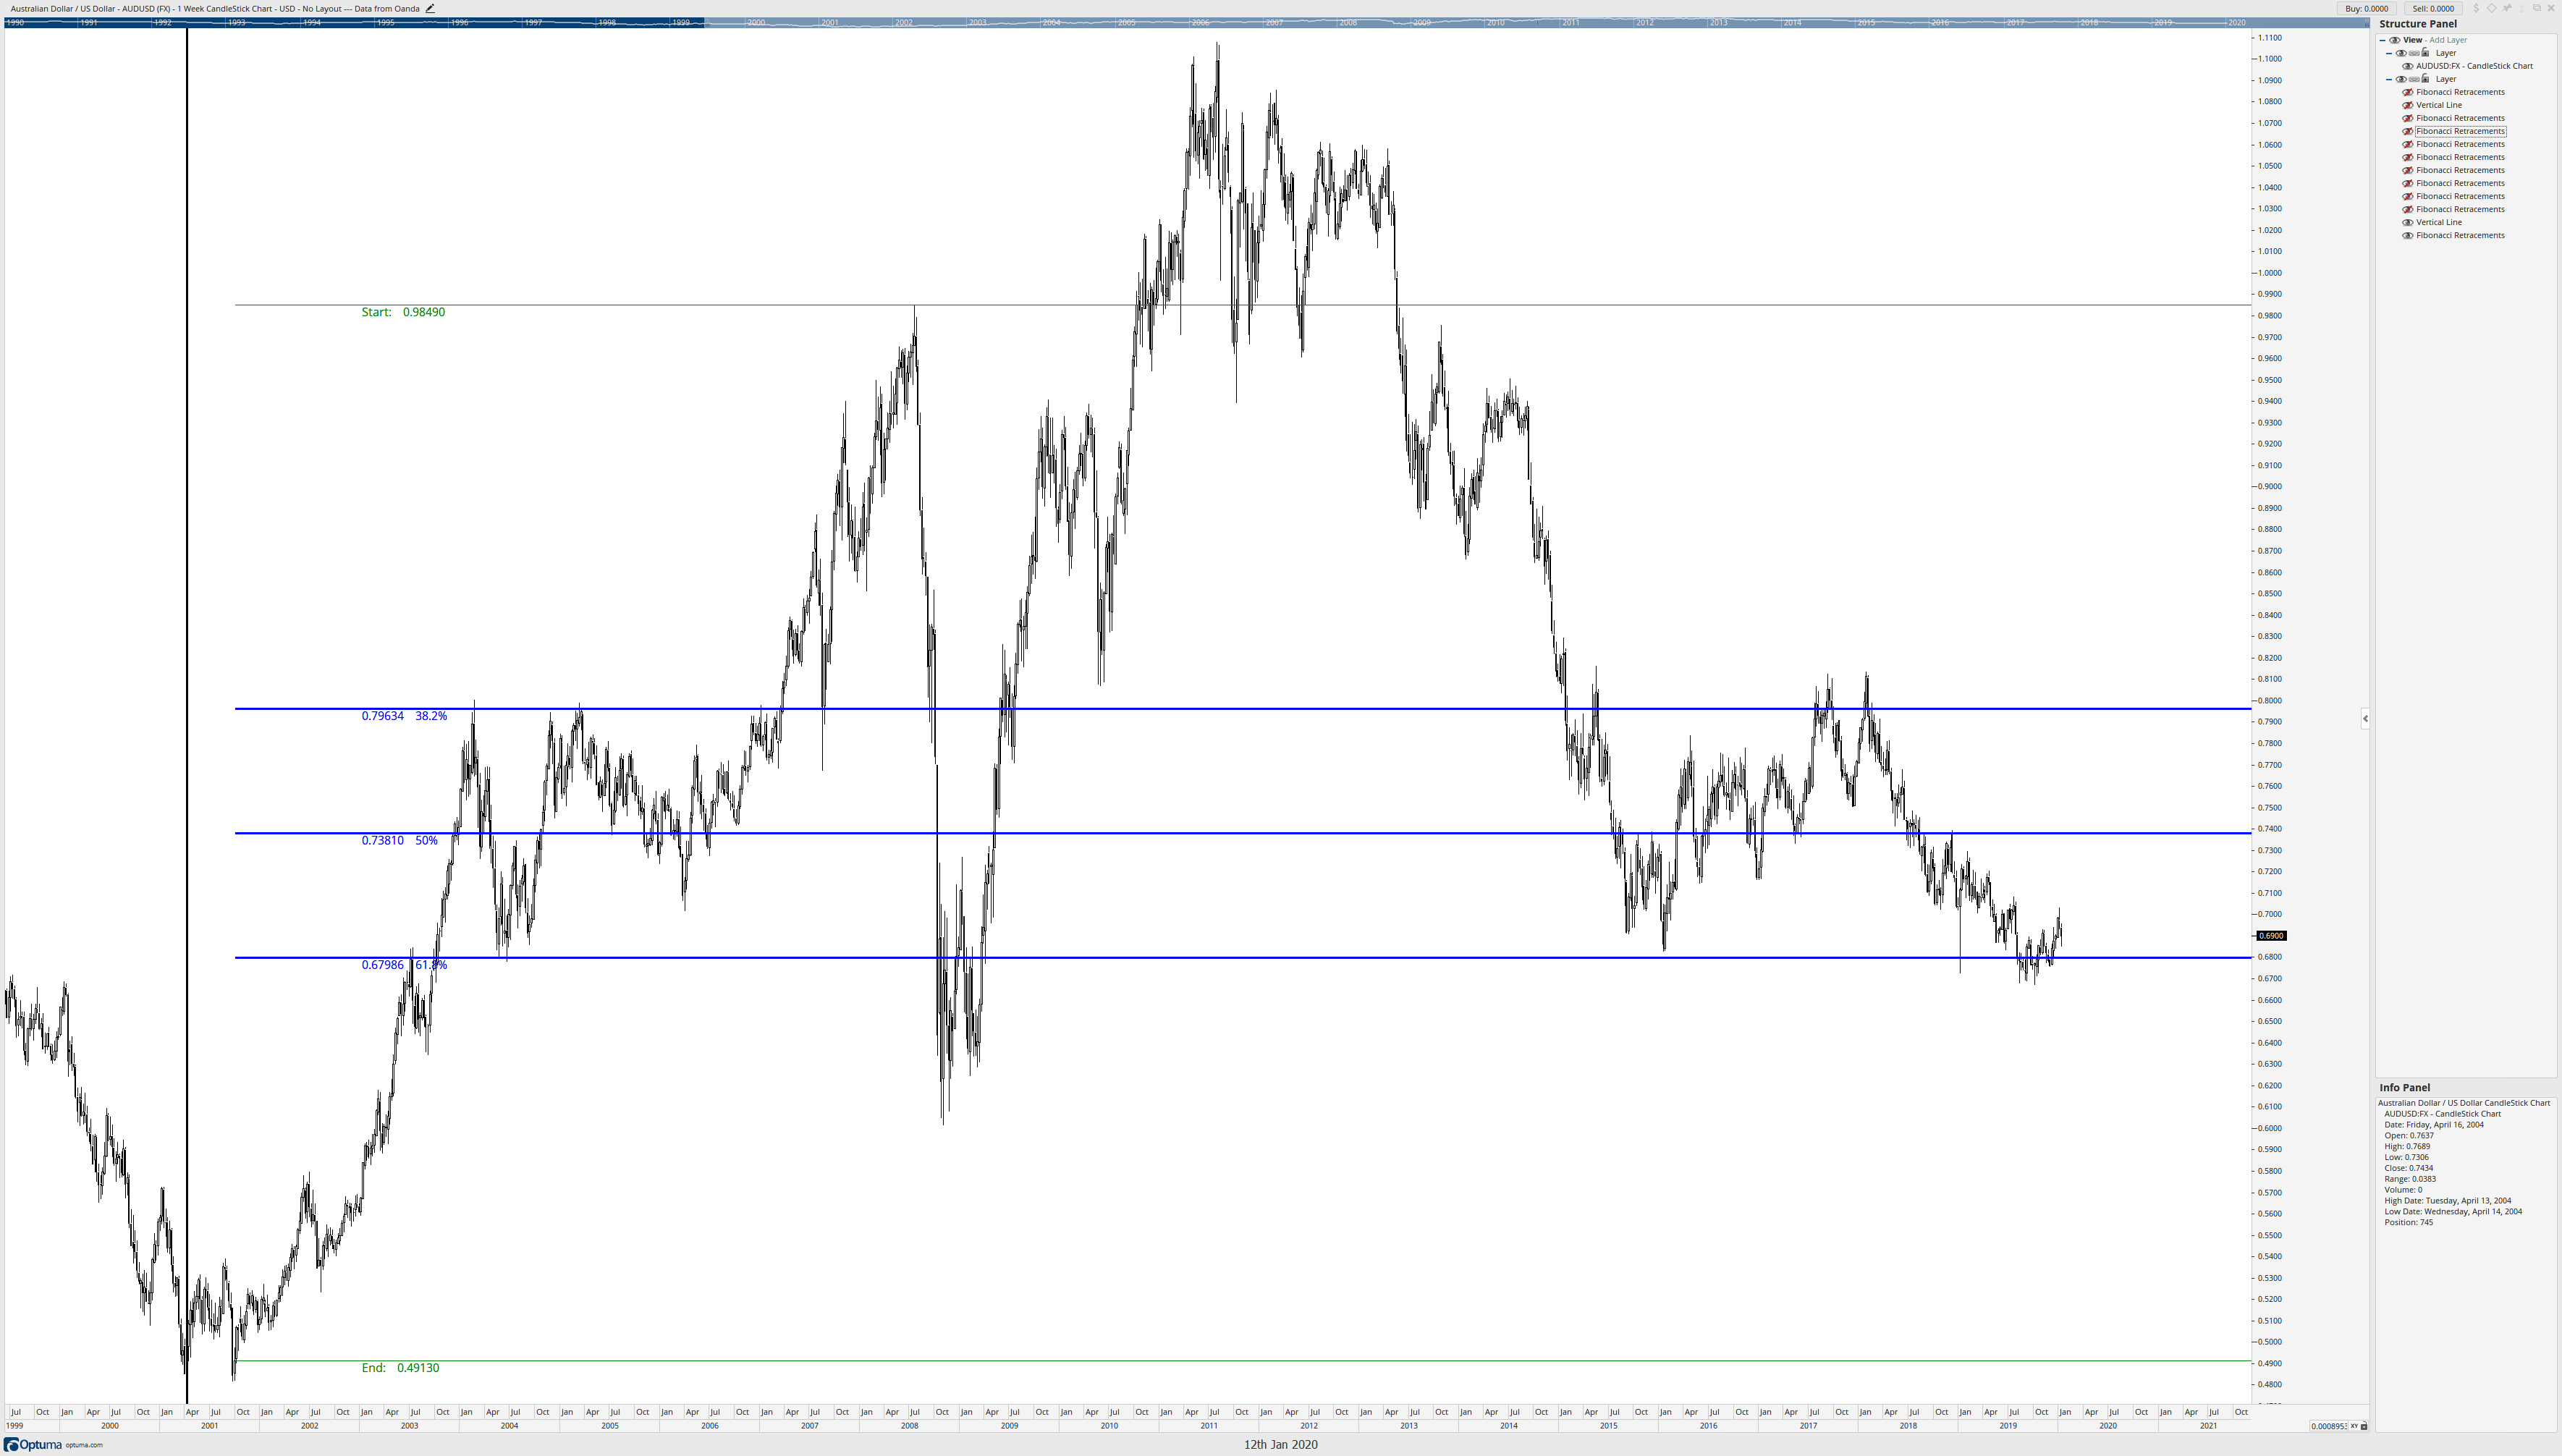
The Fibonacci retracement above is from the swing high in July 2018 to the confirmation swing low in October 2001. Like the previous Fibonacci image, we can see that prices have respected the retracement levels even a decade after the retracements were established. But we’re not done.

The above image is the first retracement we looked in this article (the same swing low in March 2001) using the same swing low; we draw more retracements to the next confirmation swing lower highs. I’ve drawn two additional Fibonacci retracements in Red and Orange. Notice how some of the Fibonacci retracements occur within proximity of one another. Letter A is shared retracement zones of the 50% and 61.8% of two different retracements. B has a confluence zone of three Fibonacci retracement levels, 50%, 61.8%, and 38.2%. And C has two overlapping retracements of 50% and 38.2%. Now let’s get to the fun part.
The previous image showed three Fibonacci retracement confluence zones at A, B, and C. Those confluence zones were just three of many that will appear on any chart on any time frame. What happens if we draw a series of retracements using major swings as the start point of the Fibonacci retracements and then retrace to the next confirmation swing highs and lows? We’ll get a chart that looks like the one below.
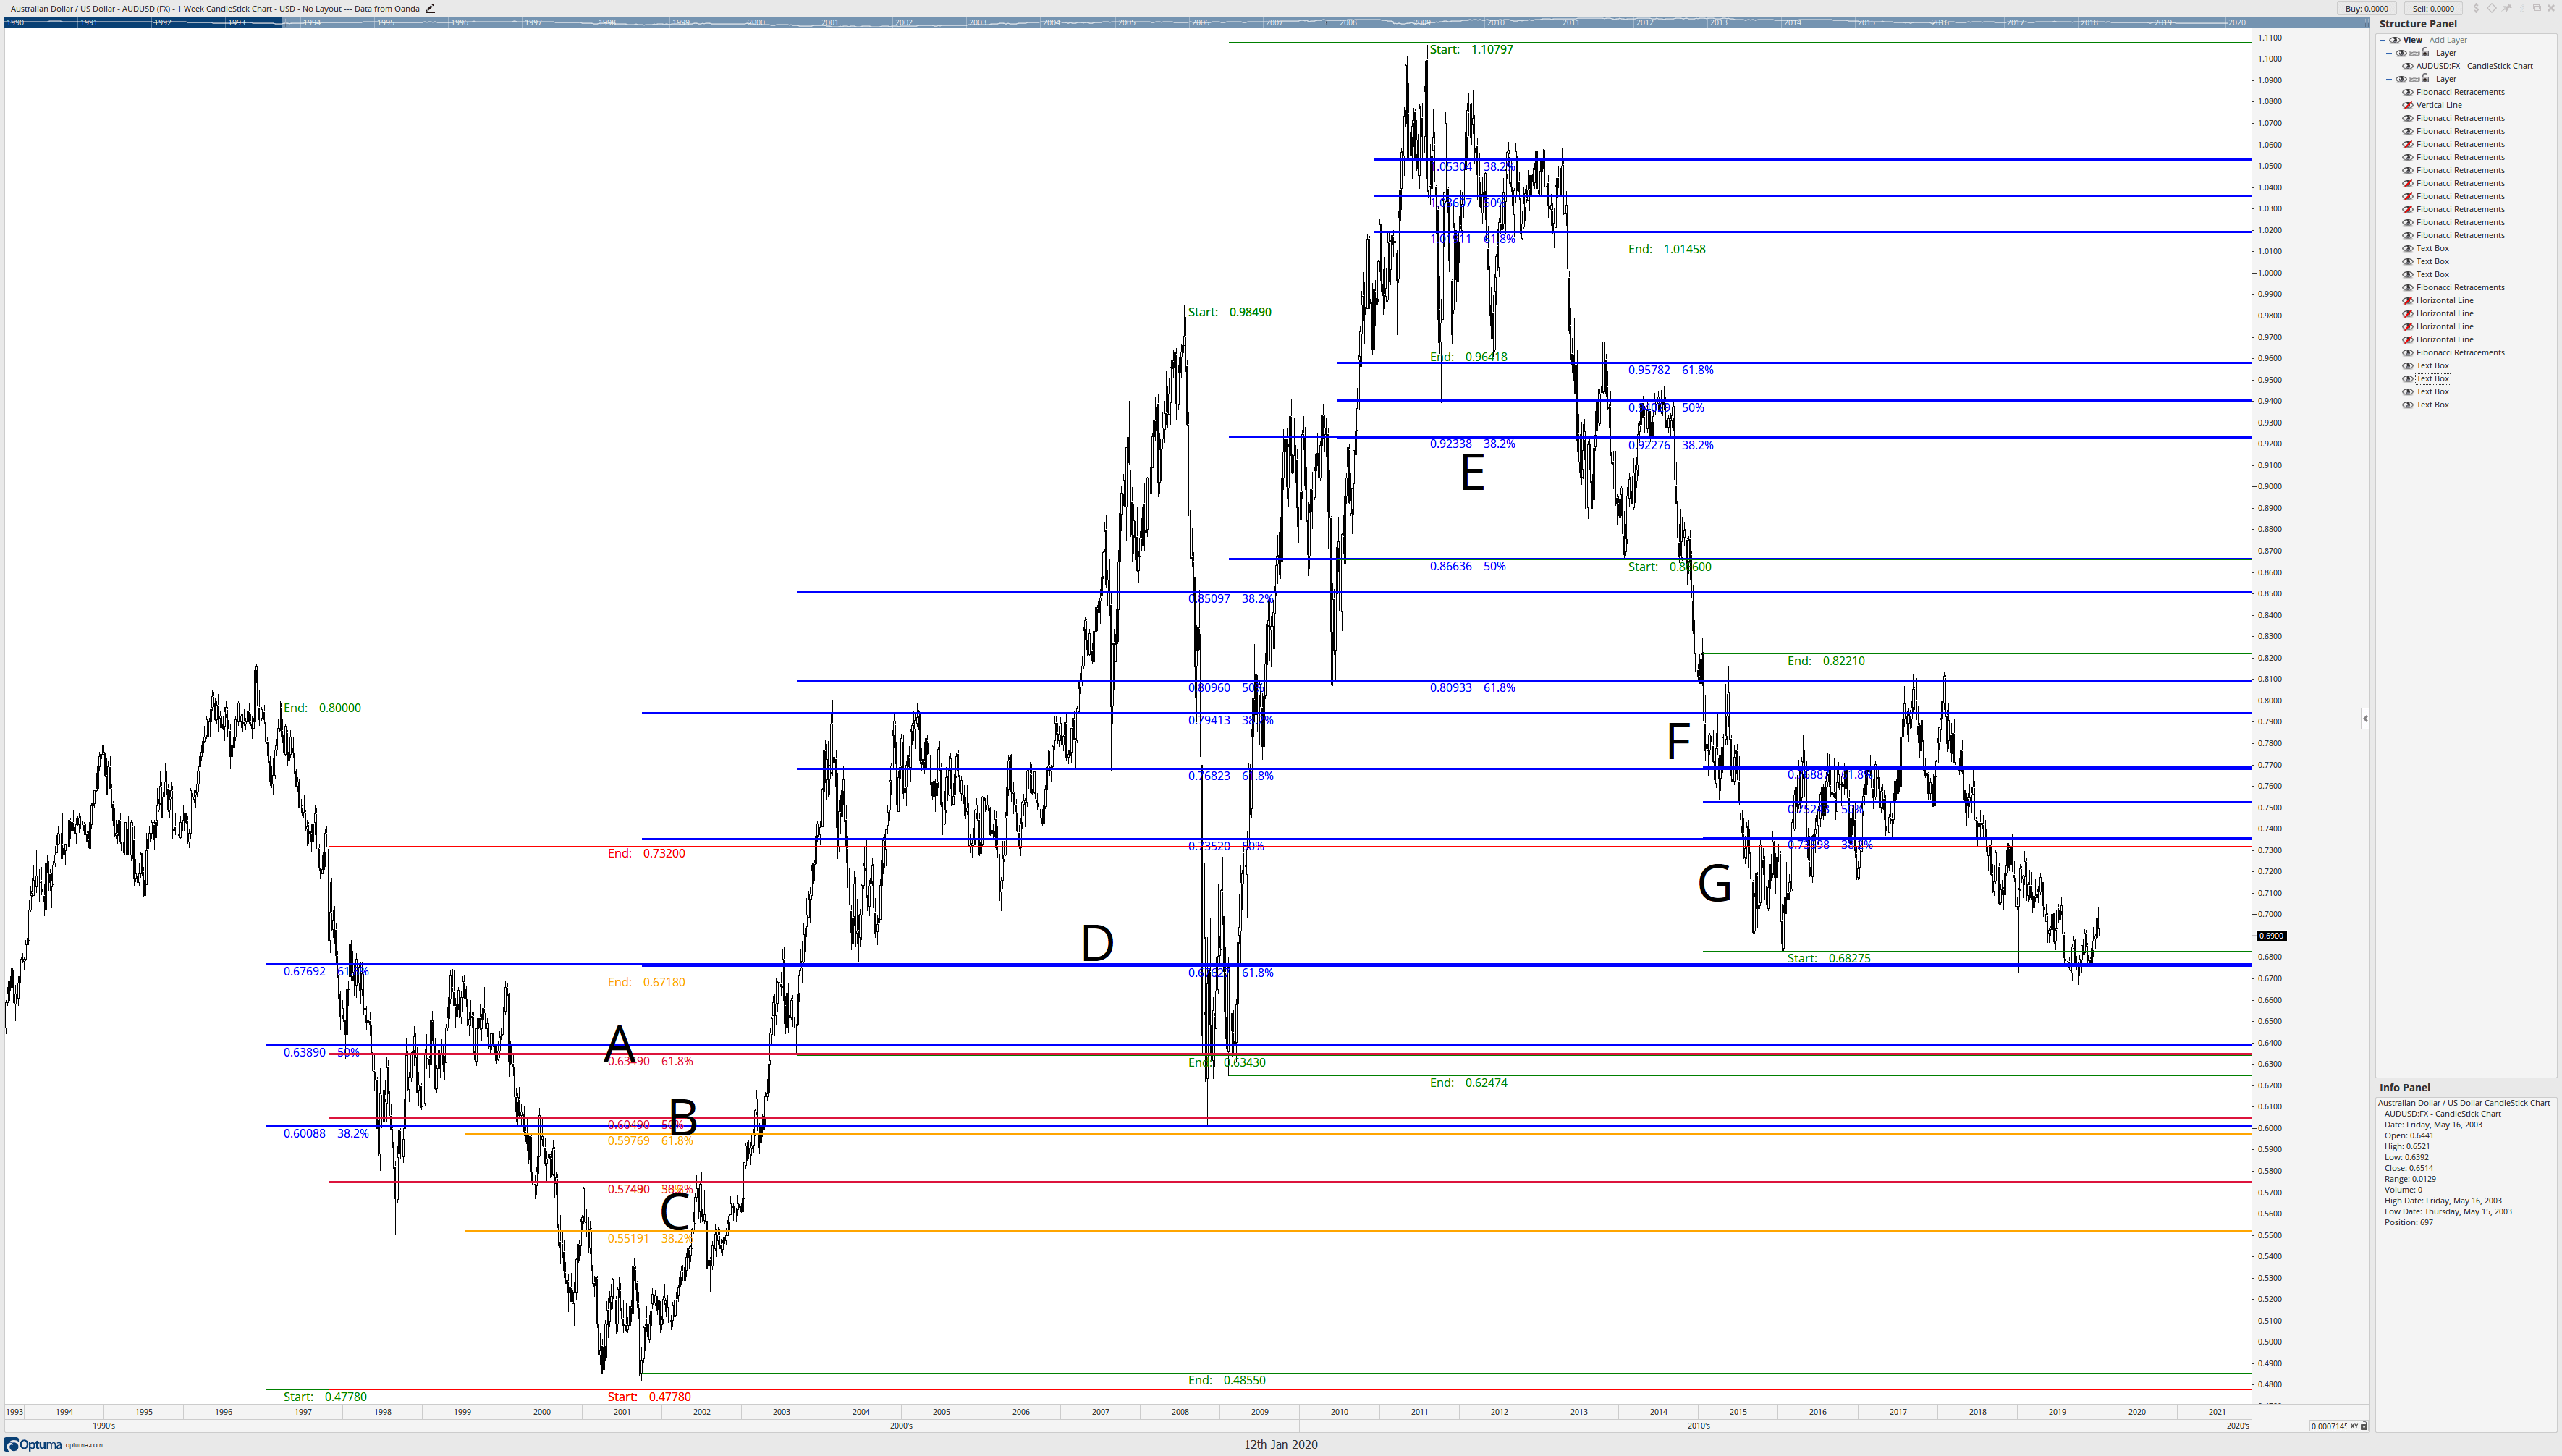
I’ve added some other letters to identify more confluence zones. I admit the chart does look like a mess. And it should. Not every Fibonacci retracement to a new confirmation swing high or low will coincide with shared Fibonacci levels, but they frequently do. Once we’ve drawn out a series of retracements, we should see a set of these confluence zones. Now begins the cleanup phase. We’re going to place horizontal lines where there are confluence zones of Fibonacci retracement levels.
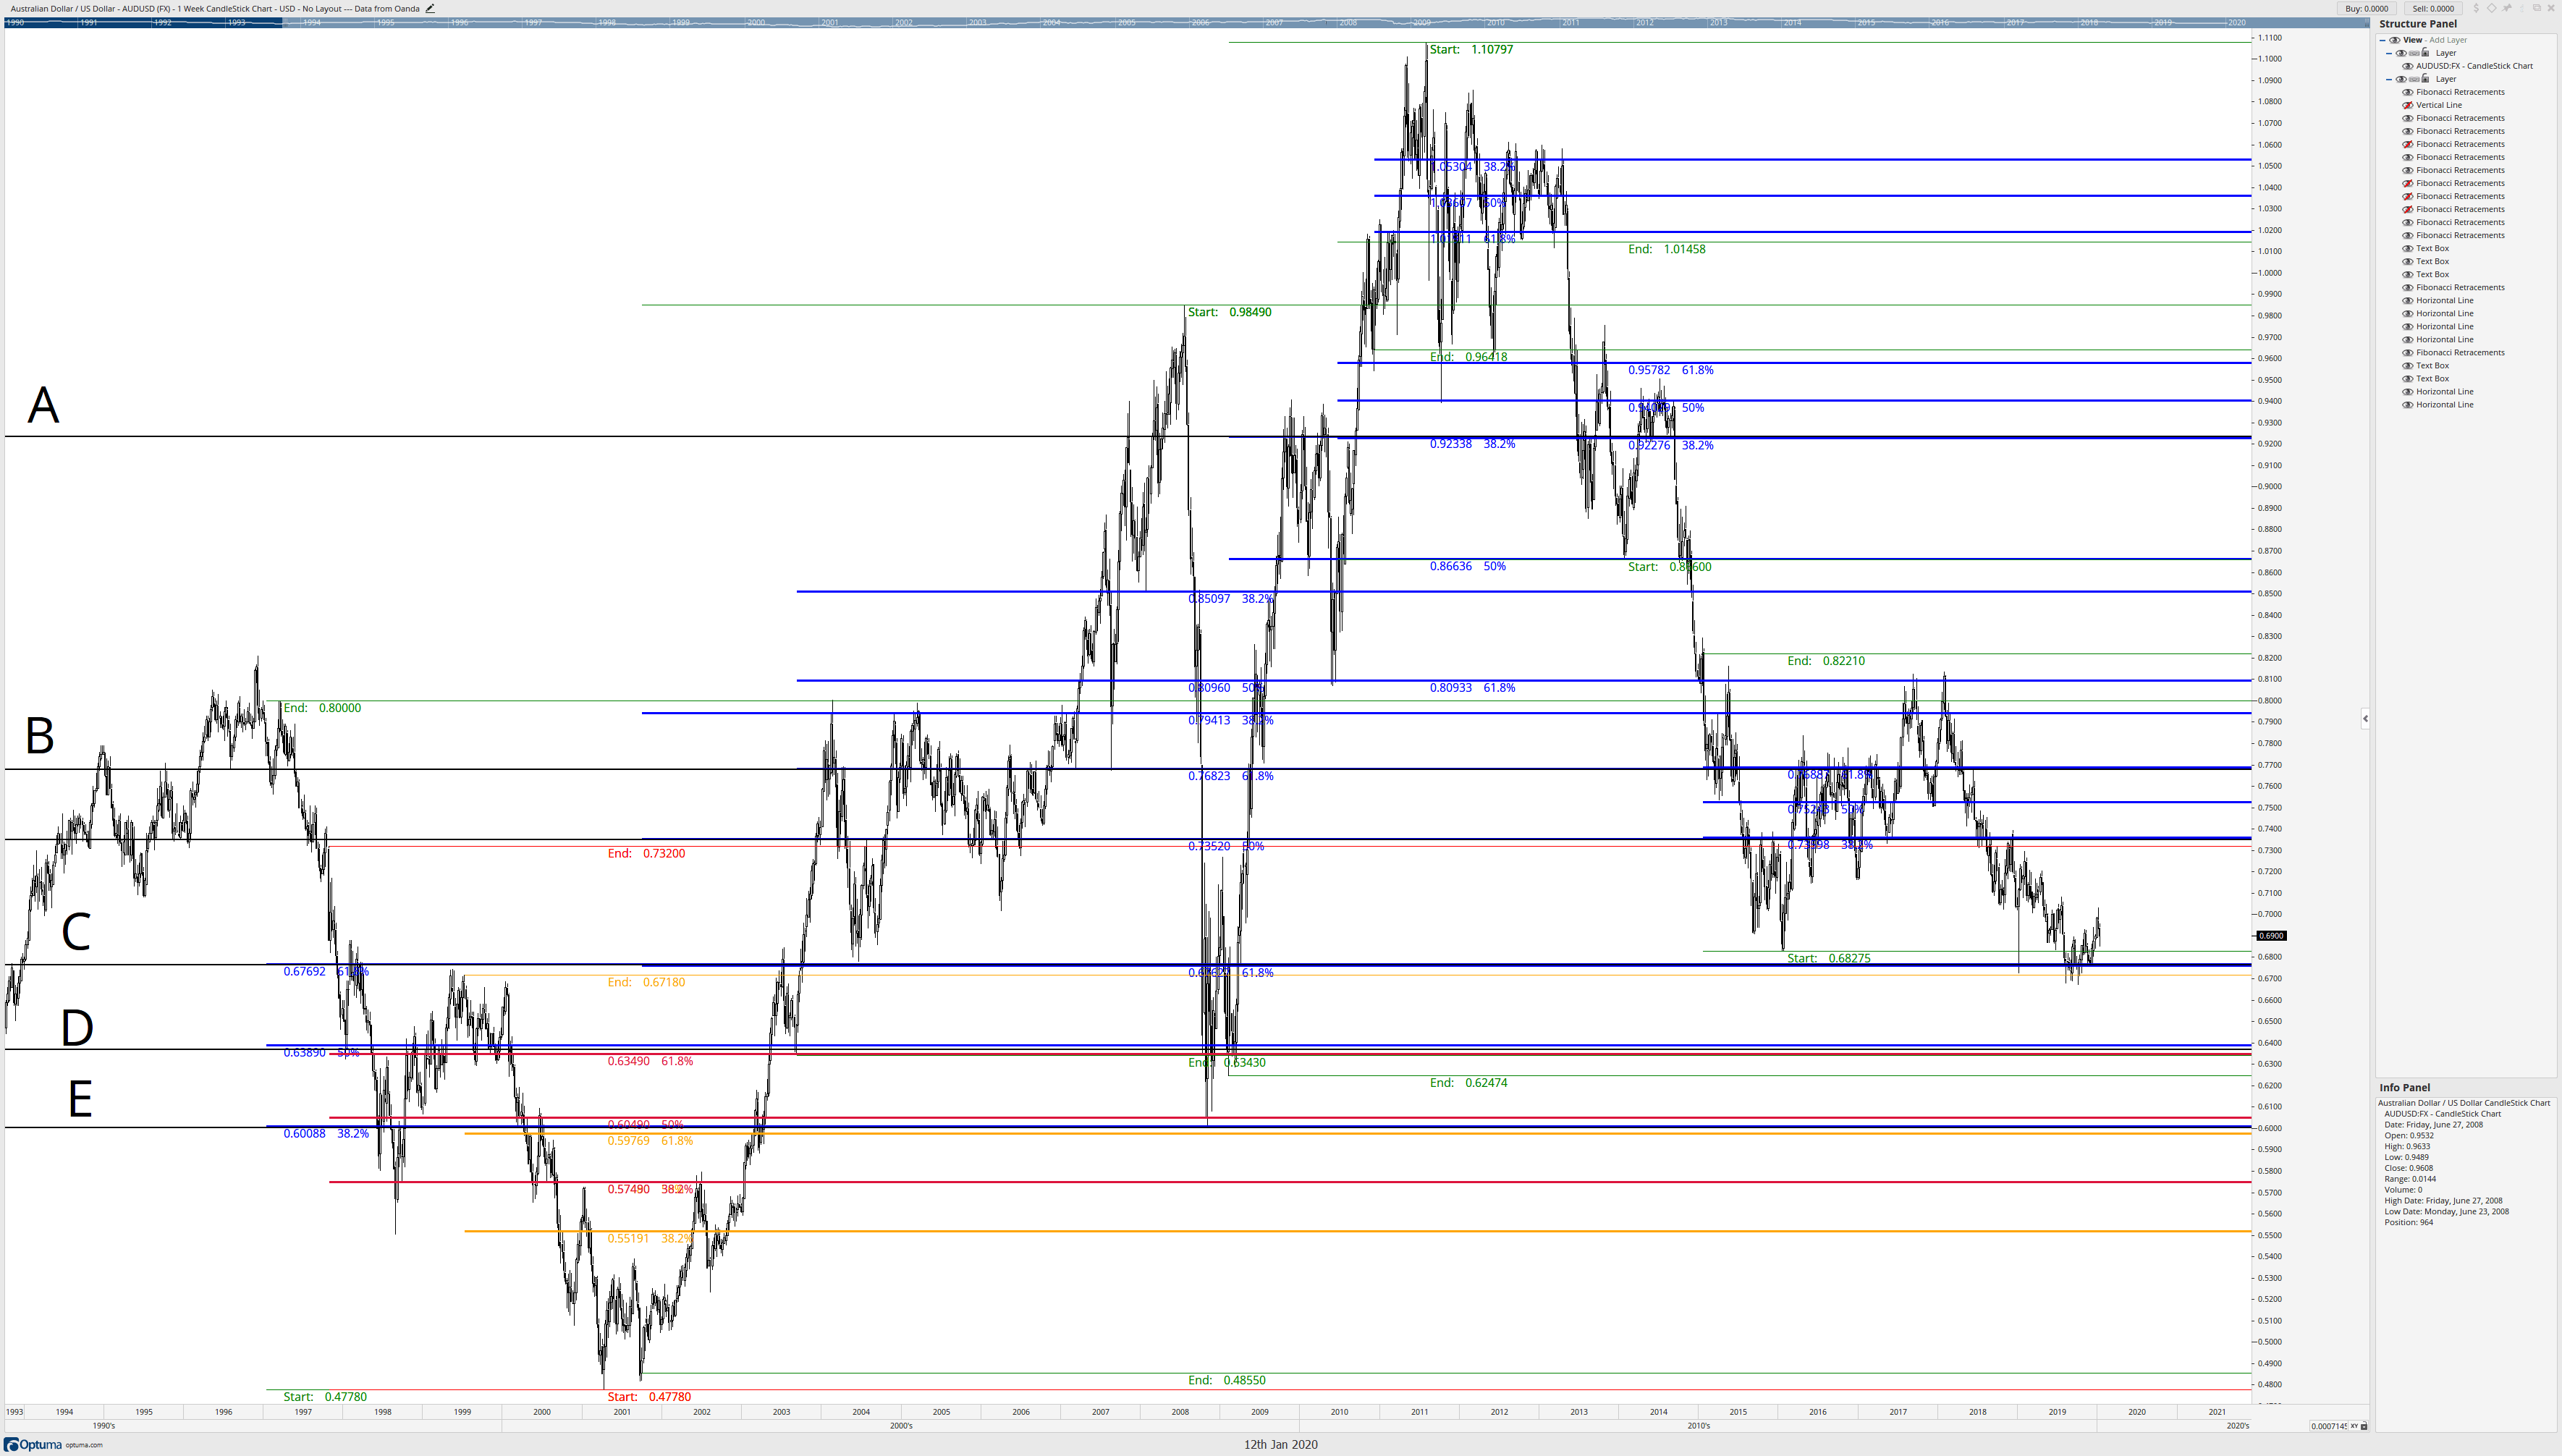
The letters A, B, C, D, and E show where the Fibonacci confluence zones have formed, and are represented by horizontal lines (black) on the chart. Now, you can either delete or hide all of the Fibonacci retracements so that we are left with only the horizontal lines at A, B, C, D, and E.
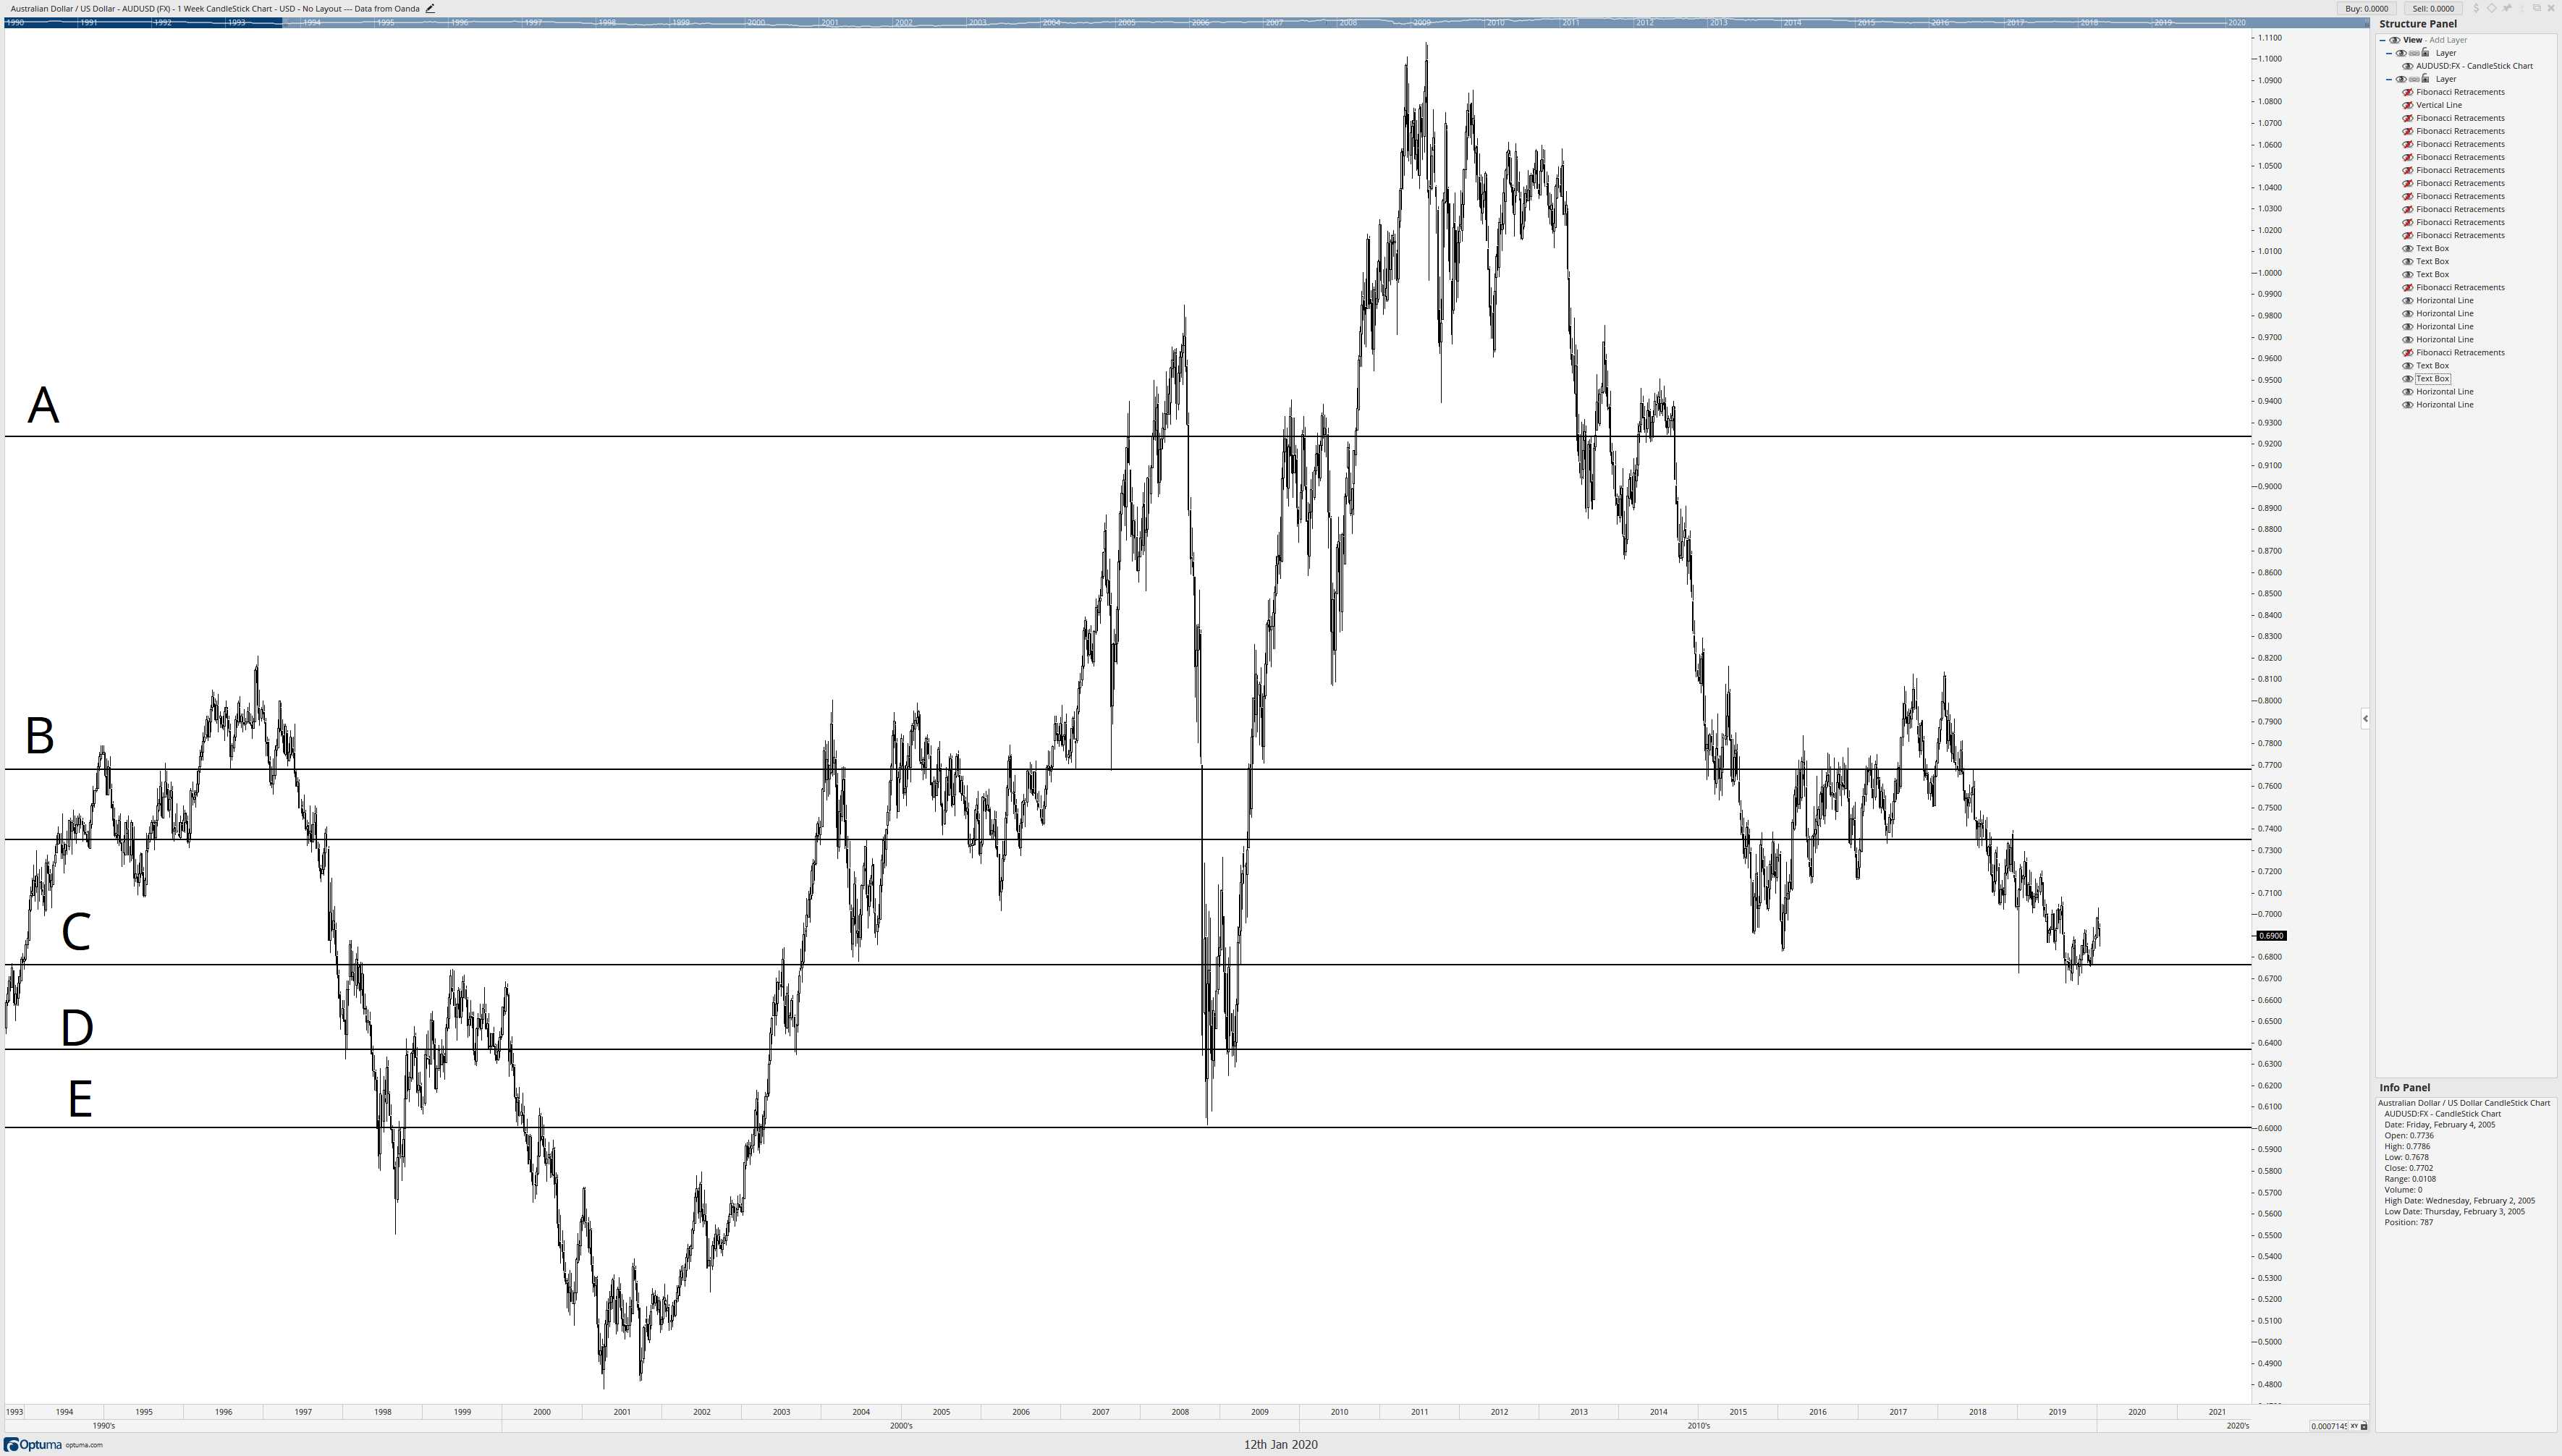
I know that the horizontal line at D represented the most confluence zones on the AUDUSD weekly chart, but it also represented some of the longest-lasting and respected Fibonacci retracement levels. Starting at the horizontal level at D, I draw a box from D down to the major low on the AUDUSD chart. Now, the width of this box doesn’t matter – just the range.
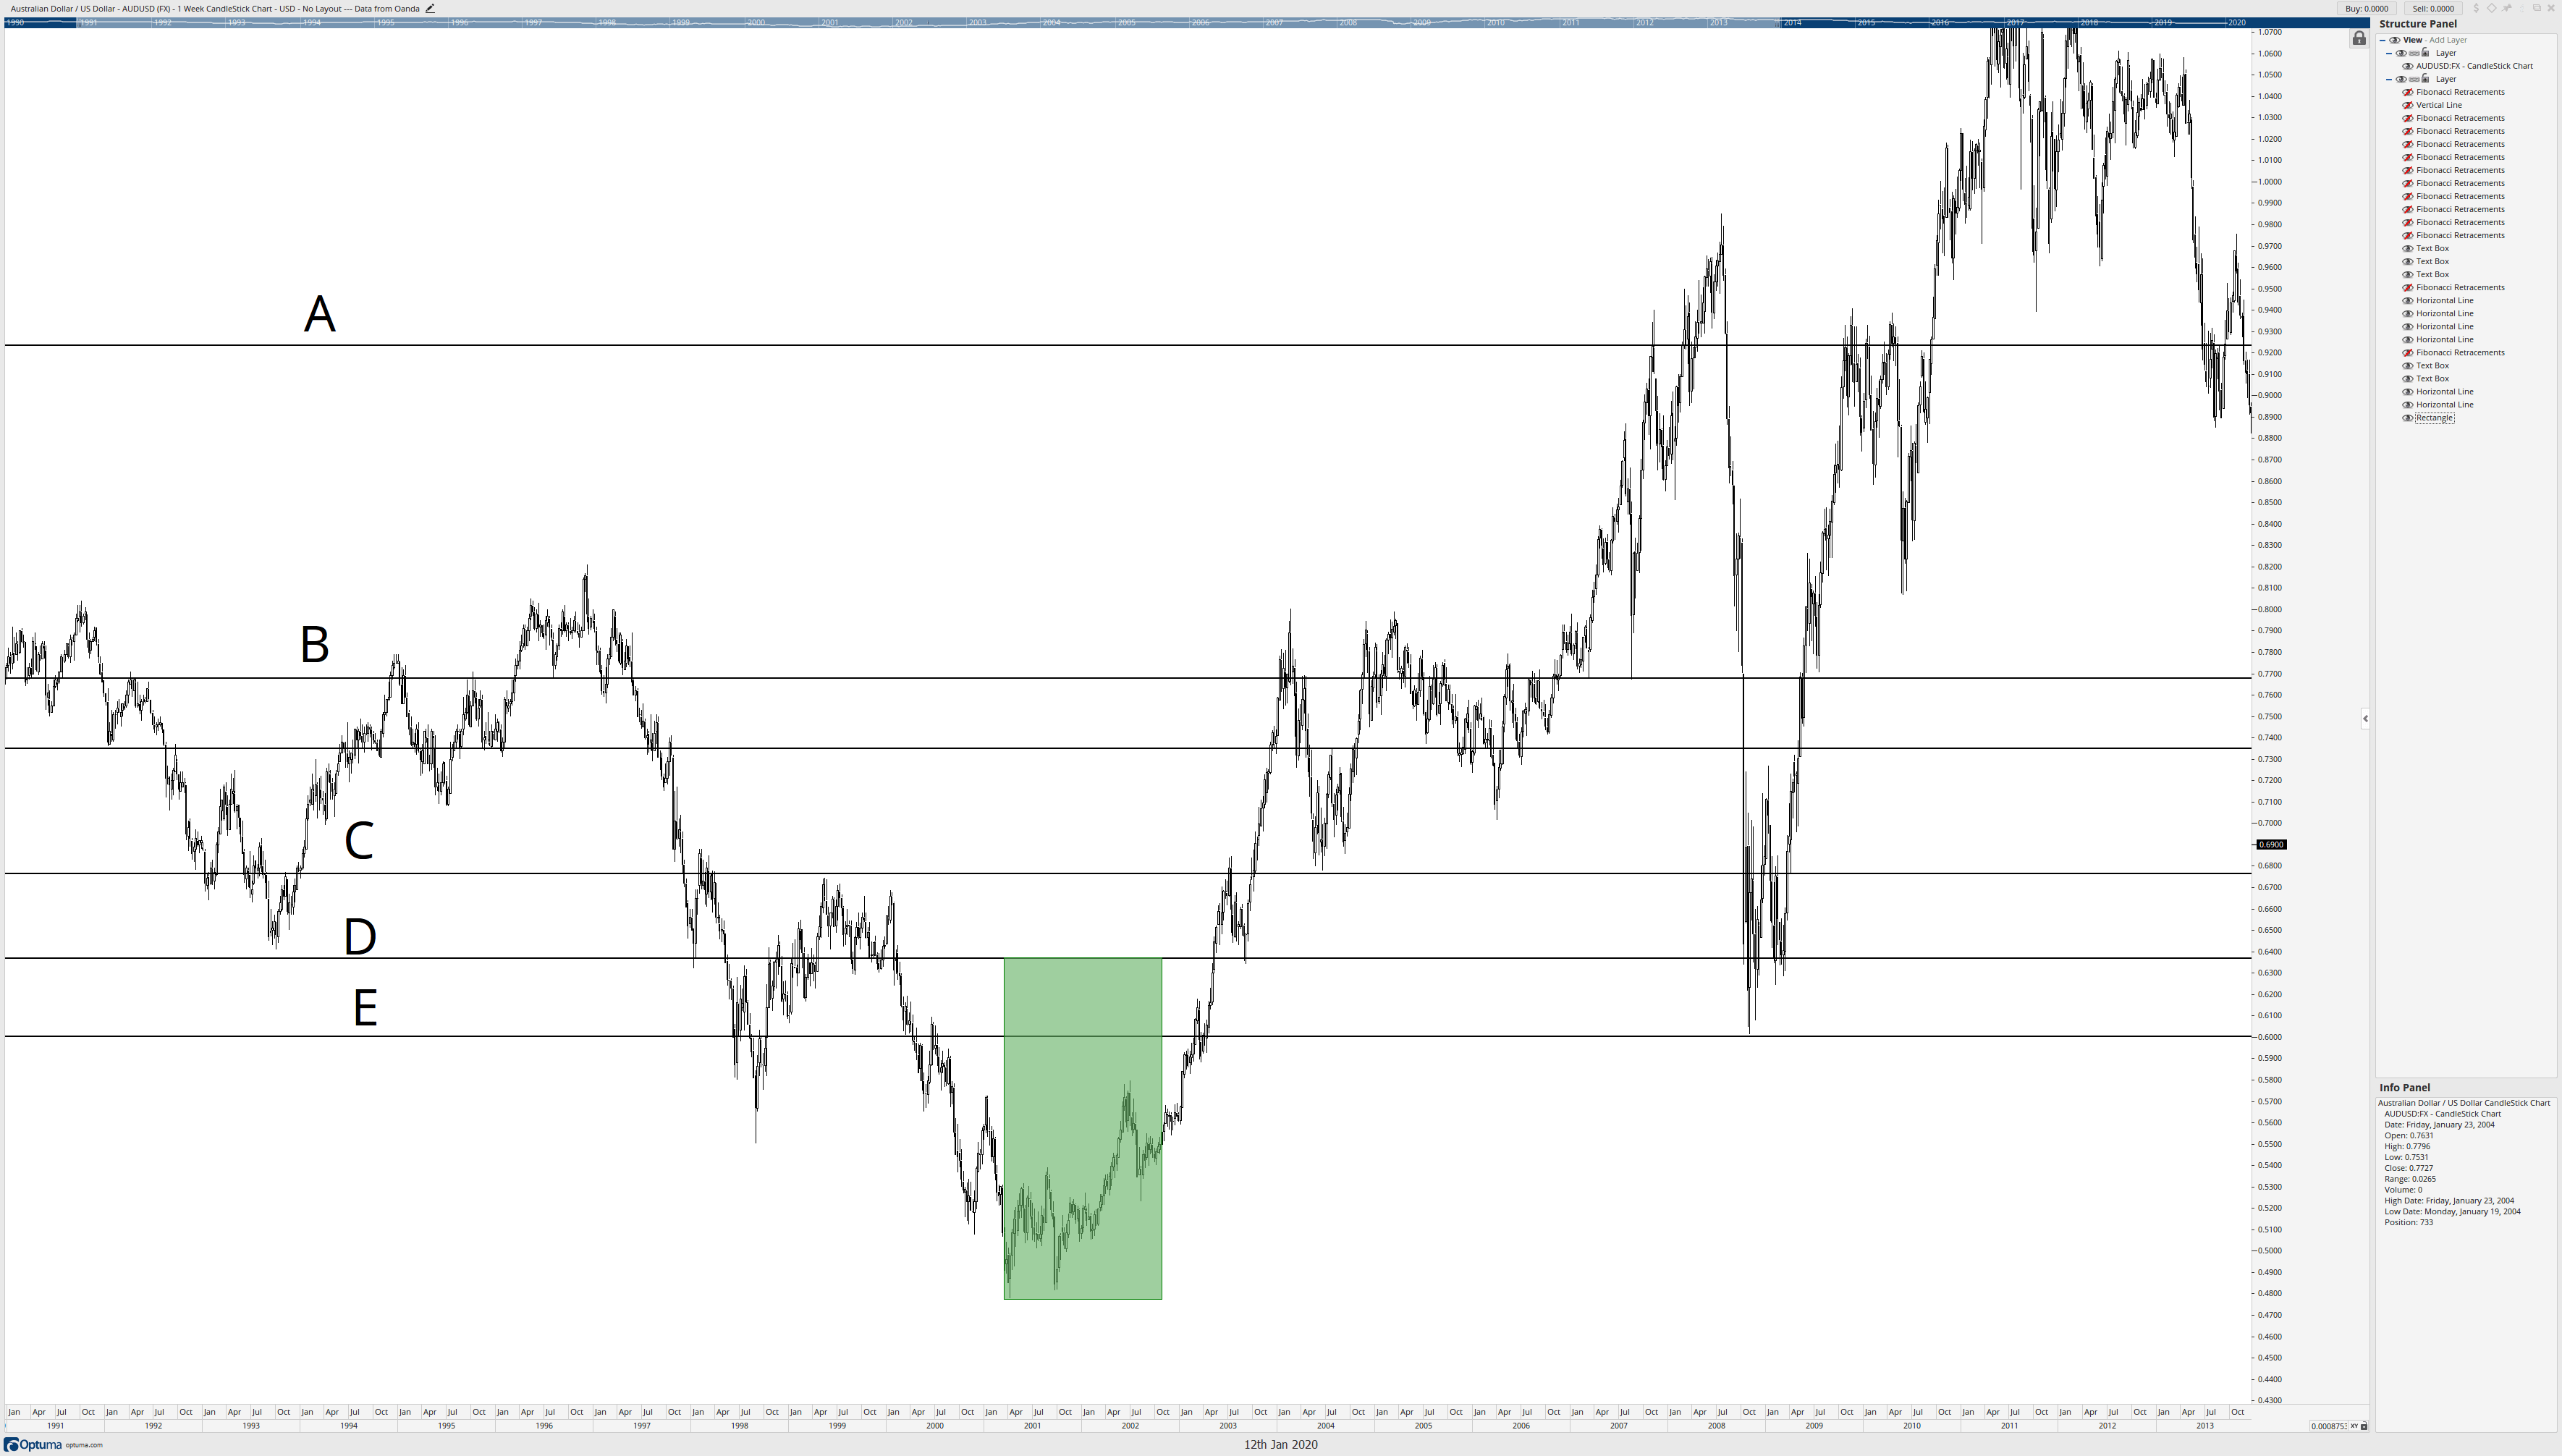
After I’ve established that box from D down to the major low, I can remove the horizontal lines. Then I start to copy the box all the way to the top of the range. All I’m doing here is copying and pasting the box so they ‘stack.’
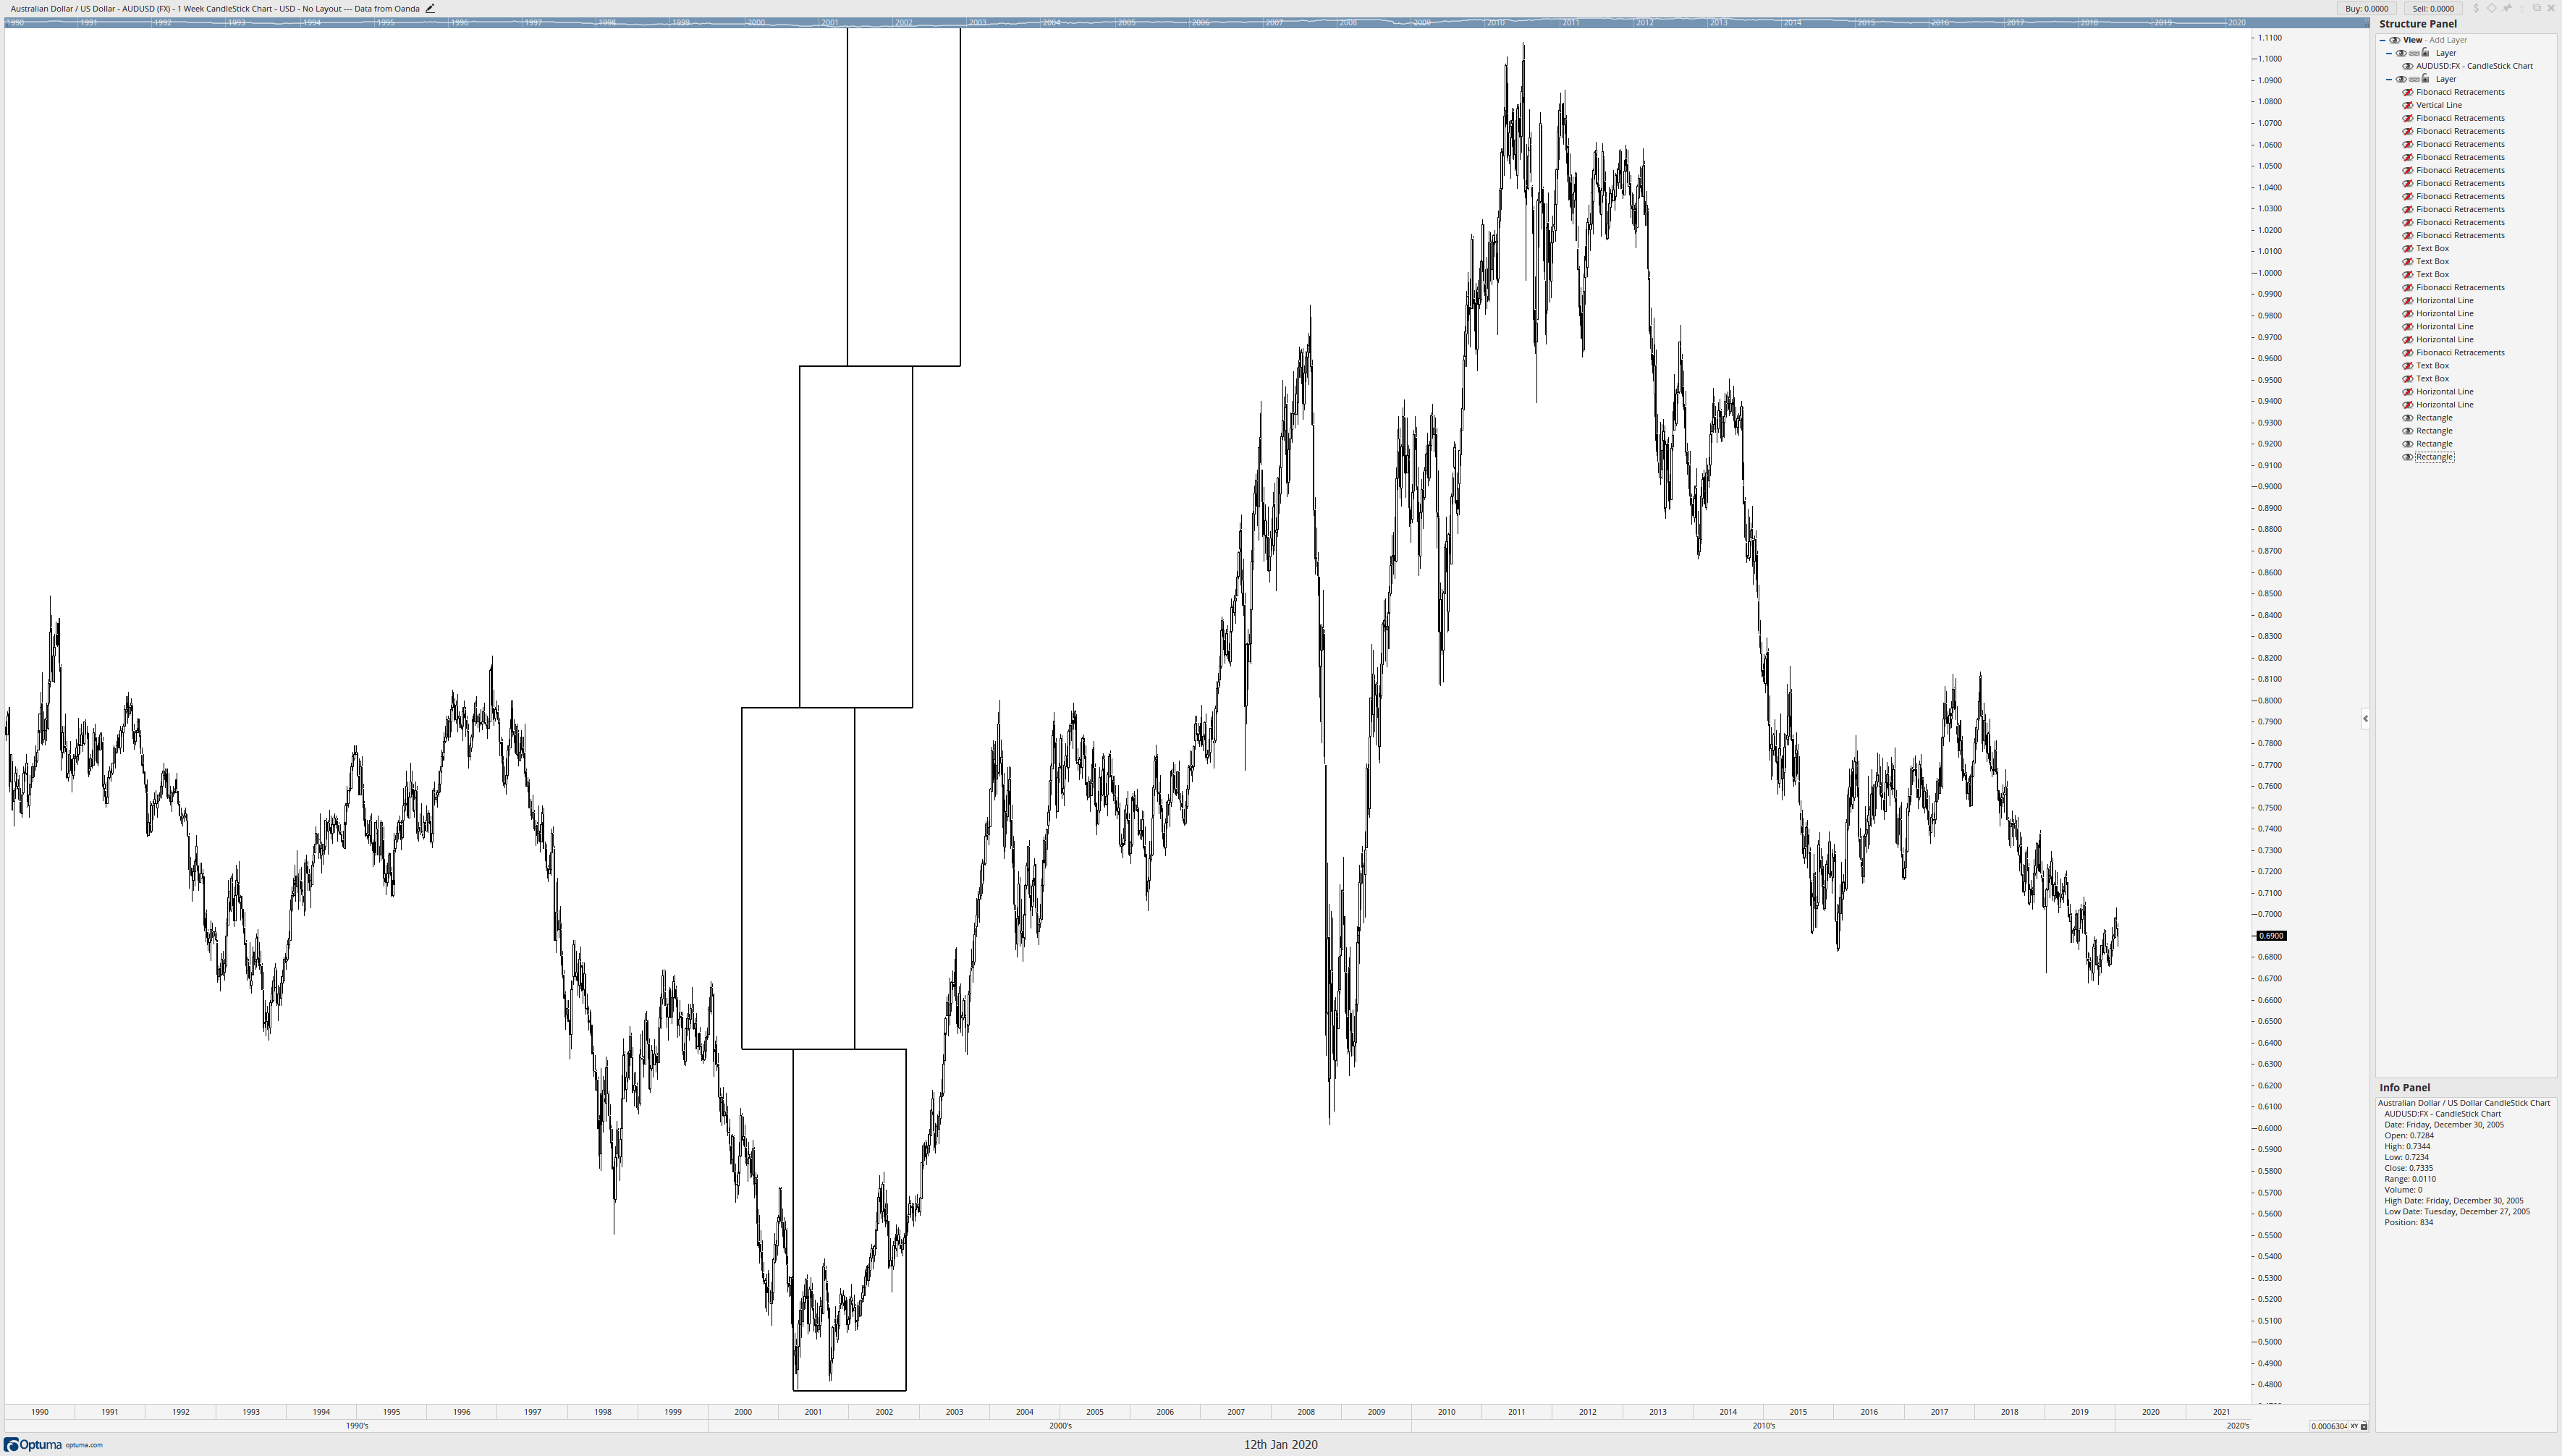
Now comes the cool part. I’m going to treat each box like its own range and place Fibonacci retracements inside each box, moving from bottom to top.
No matter how many times I’ve done this, it still blows my mind. But there is probably a lingering question. You’re probably looking at the chart and saying, ok, cool, but there are some massive gaps between these Fibonacci levels. You are correct if you are thinking about this. Now, Connie Brown never wrote about this next part; it’s something I discovered and developed on my own. The approach comes from the idea that markets are fractalized and proportional, so we should be able to break down like zones into smaller ranges. This is especially important and useful for traders who prefer to trade on faster time frames like four-hour or one-hour charts. Using price action that is more recent and relevant, I can draw a Fibonacci retracement from the 50% level at 0.71688 to the start/end of the box at 0.6368.
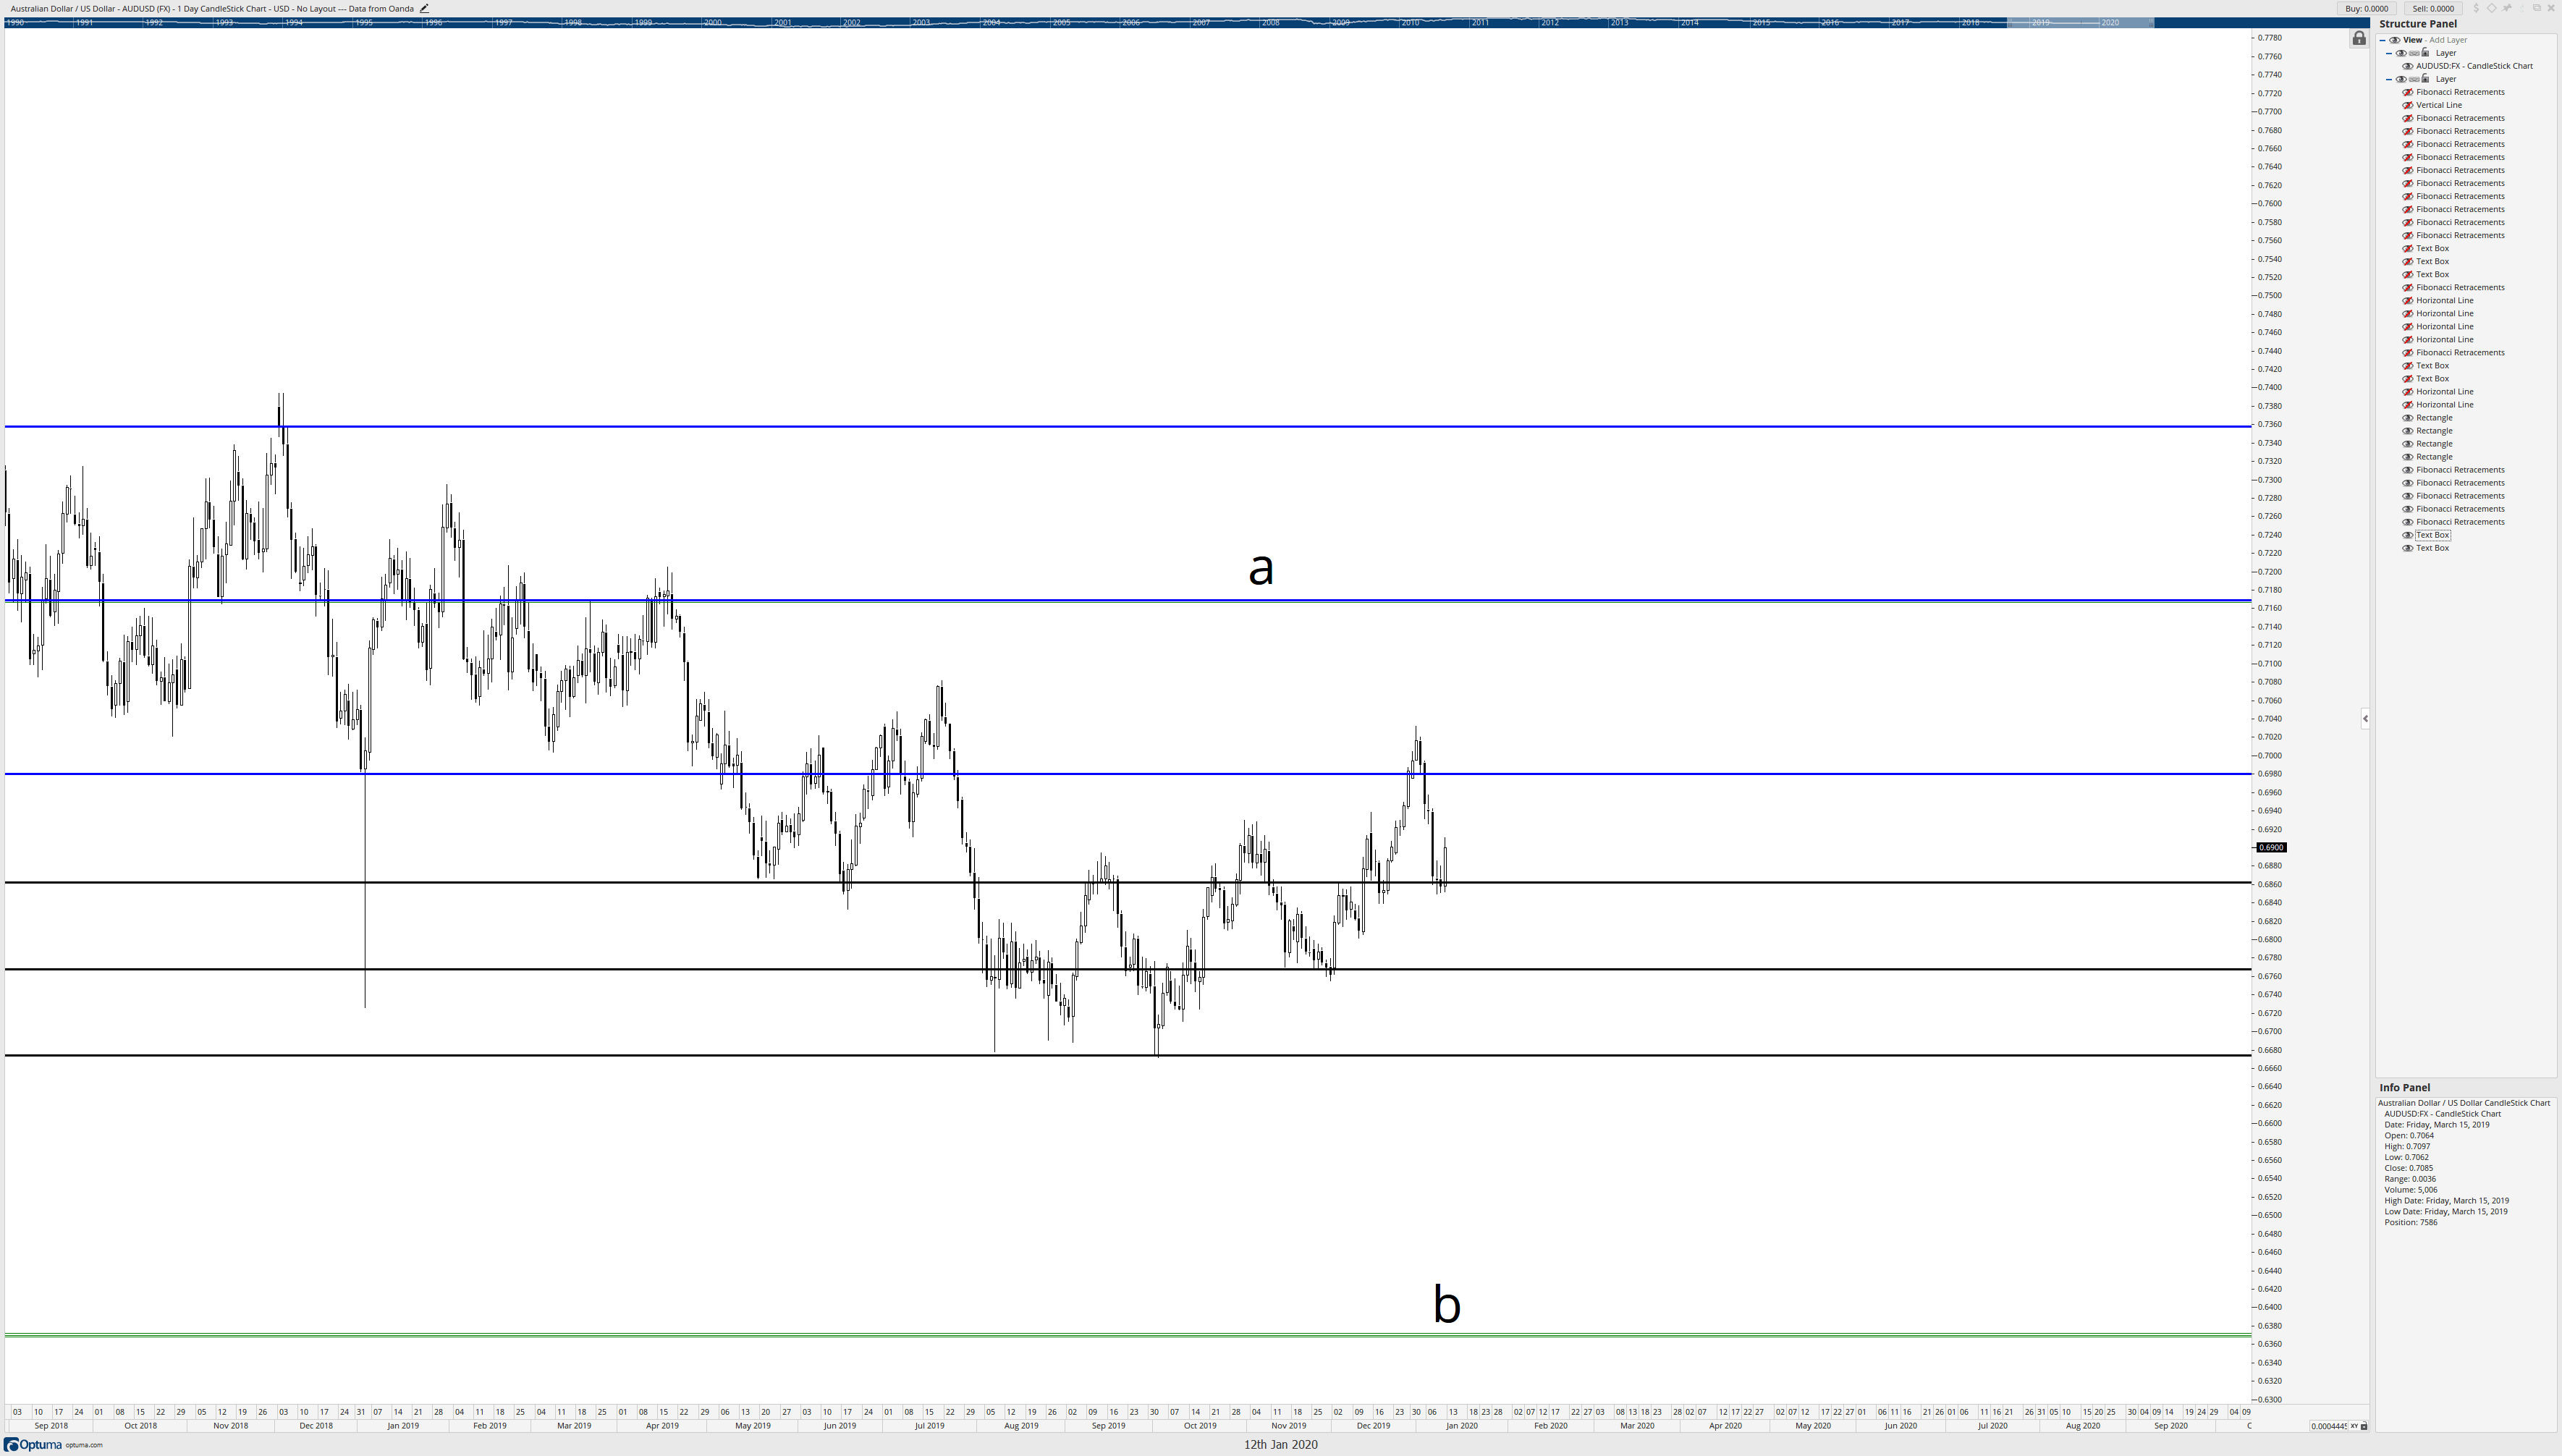
Letters a and b on the chart above identify the 50% Fibonacci level and start/end level described in the prior paragraph. The black horizontal lines represent the Fibonacci retracement drawn from a to b. I’ve also switched the chart from a weekly chart to a daily chart. When we see that daily chart, we get a real idea of how powerful the Brown Method of Fibonacci analysis is and how precise the study of these confluence zones can be.
In summary, to utilize the Brown Method, the followings steps are as follows:
Sources:
Brown, C. (2010). Fibonacci Analysis: Fibonacci Analysis. Hoboken: Wiley.
Brown, C. (2019). The Thirty-Second Jewell: Thirty Years Behind Market Charts From Price To W.D. Gann Time Cycles. Tyton, NC: Aerodynamic Investments Inc.
Introduction
Introduction
We’ve now come to one of the most exciting topics in this course, which is analyzing the Forex market. Now that we know the history and the working of the Forex market, we’re all set to predict the future of the market. Several types of analyses are used by traders across the world to analyze the Forex market. However, these analyses can broadly be classified into three types.
In this lesson, and the lessons coming forward, we shall be discussing all these three types of analyses.
The three types of forex market analysis are:
Now, you must be wondering which one of them is best for analyzing the markets. Well, if you look at the most successful professional traders in the industry, they analyze the market by considering all the types. In this lesson, let’s understand the most essential Fundamental Analysis.
Fundamental analysis, as the name pretty much suggests, is the way of analyzing the market by studying the economic, social, and political forces in the country. These factors are considered because they affect the supply and demand of an asset.
The whole idea of trading using fundamental analysis is by considering the factors that affect the supply and demand of a currency. These factors are technically referred to as fundamental or economic indicators.
The concept behind this type of analysis is straightforward. If a country’s currency or economic outlook is good, then there is a high probability that the currency will show strength in the future and vice-versa.
Below are some of the economic indicators which have the power to shift the economic situation of a country.
One of the most popular and important economic indicators are interest rates. There are several types of interest rates, but we will be focusing on the basic form of the interest rates set by the central banks. Central banks are the creators of money. This money is borrowed by private banks. And the percentage (interest) or the principle the private banks pay to central banks for borrowing the money is called a nominal or a base interest rate.
If the central banks wish to boost the economy, they decrease the interest rates. This then stimulates borrowing by both private banks and other individuals. And this, in turn, increases consumption, production, and the overall economy. Lowering the interest rates can be a good way to inflate the economy but can be a poor strategy too. Because in the long term, low-interest rates can over-inflate the economy with cash and create an unbalance in the money supply.
So, to avoid this, central banks increase interest rates. And this increase results in less money in the hands of private banks, businesses, and individuals to play around with.
Inflation, as the name pretty much says, is fluctuation in the cost of goods over time. Inflation, too, is a vital indicator for economists and investors to forecast the future economy. Inflation will have a good effect on the economy if done uniformly. But, too much inflation can bring the balance of supply and demand on the tip in favor of the supply. And this eventually will bring down the value of the currency.
Apart from these two, there are many other macroeconomic indicators that traders consider to do their fundamental analysis. Some of them include GDP, PPI, CPI, Unemployment Rate, Government Debt, etc. Indicators like these help the investors & traders in analyzing the market and predicting its future.
This completes the lesson on fundamental analysis. In the next lesson, let us understand the insights about technical analysis. Don’t forget to take the quiz below before moving ahead!
[wp_quiz id=”56601″]https://youtu.be/1I1D5BE2LHQ

https://youtu.be/1I1D5BE2LHQ
In this video, we will continue to uncover the basic ideas about probability and the rules of summation and multiplication.
Probability is the term given for the measure of the likelihood of an event to occur. If we are entirely certain that the event will occur, the probability is one, or 100 percent. If an event can’t occur, the probability is zero. If the event is equally likely to occur or not, its probability is 0.5 or 50%. Thus, we see that the probability ranges between zero and one. No probability can be greater than one or less than zero.
Usually, In science (and trading), there is no way to know the probability value in advance. In this case, the usual way to assess it is to do a finite number of trials and calculate the relative frequency of occurrence or the proportion of the event. This value is not the real probability, but an estimate of the probability. The larger the number of trials, the more accurate this estimate is.
The concept of estimated probability is really important because a lot of people think that the probability obtained using a sample is the real one when, in fact, it might be too optimistic or pessimistic. That is, the sample, by pure luck, can bee too good or too bad.
There are other cases, for example, the roulette, the roll of a die, or a fair coin toss, where the probability of occurrence is known in advance. In that case, it is quite easy to compute it.
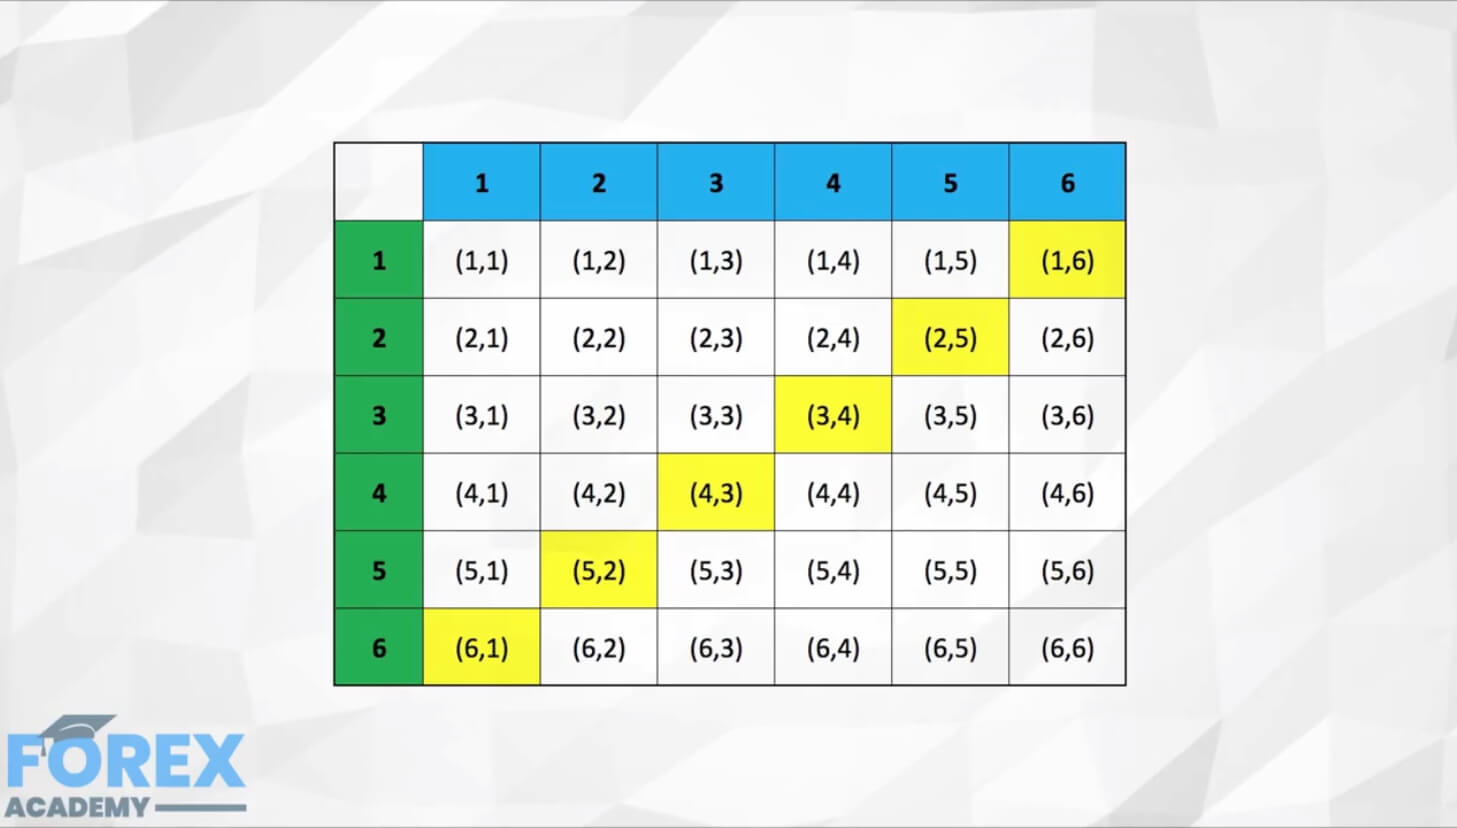
The probability of an event happening is the number of ways that event can occur divided by the total number of cases. For example, the probability of obtaining a one in a die rolling is one divided by six, or 1/6. The probability of a seven to occur in a two dice rolling is six occurrences out of a total of 36 combinations. Thus one in six. The probability of a two-coin toss obtaining one head and one tail is two possible cases divided by four total combinations of head and tail, thus, 0.5 or 50%.
Fair odds is another quantity which gives information about the probability and comes from gambling. If a game is to be fair, each player should expect no advantage, no edge. Then, if the likelihood of the possible outcomes is different, the amounts to bet should be modified to compensate for this fact.
Let’s say the probability of one result is 2/3, then the probability of failure is 1 – 2/3 = 1/3. Thus, to make the game fair, for every dollar rewarded on the success, two dollars should be paid on the failure.
In general if P_success = p, then P_failure = 1-p, and the odds in favor are
p/(1-p) to 1.
Also, the odds against success are
(1-p)/p to 1.
Adding probabilities mean answering the OR question, such as “what are the odds of event A or B or C happening.”
For the addition rule, we have two cases.
With mutually exclusive events there is no overlap. If one event happens, the other events cannot occur. In this case, the probability of occurrence of A, or B, or C is the sum of the probabilities of each.
For example, what are the odds of getting an even number on a rolling die?
We know that there are three even numbers in a die: two, four, and six, each having 1/6th probability of occurrence. Thus the likelihood of getting an even number is 3 times 1/6 or 0.5.

If the events are not mutually exclusive, there can be overlap between them. This can be visualized in a Venn diagram. In that case, the probability of the overlap must be subtracted from the sum of separate events.
For Example, If one card is drawn from a 52-card deck, what is the likelihood the card is a Jack or Heart?
P_Jack = 4/52
P_Heart = 13/52
P_[Jack and heart] = 1/52
Then the answer is:
4/52 +13/52 – 1/52 = 16/52
Multiplying probabilities answer the AND question, such as “what is the probability of A and B happening?
If the events are independent, then the occurrence of one event does not affect the appearance of the others. in this case, the odds of several events happening together is the product of their probabilities.
For example, what are the odds in a coin toss game of having two heads in a row?
We know the odds of each head is 0.5, then the odds of having two heads in a row is 0.5×0.5 = 0.25 or 25%.
To know the odds of an N losing streak of a trading strategy is rather easy: We just need to know the percent losers of a system, which is 1- Percent_winners, and multiply it by itself N times ( which is the exponential operator).
For example, which are the odds of obtaining eight losers in a row if the percent winners of my strategy are 45%?
Answer: If P_win = 0.45, then P_loss = 0.55.
P_8_Drawdown = 0.55^8 = 0.84%
If the events are not independent, we should use the conditional probability formula, but this is an advanced subject beyond the scope of this video.
Introduction
Introduction
Ever wondered how brokers make money from their clients? Well, it is through a simple concept of Spreads.
In the previous course, we discussed the terminologies such as pip, pip value, bid price, ask price, etc. In this lesson, we shall be extending our discussion and touch base on ‘Spreads’ in Forex.
The difference between the ask price and the bid price is called the spread.
The “bid” is the price displayed by the broker at which one can Sell a currency pair. Similarly, the “ask” is the price offered by the broker at which one can Buy a currency pair. In both, “bid” and “ask,” Buying and Selling happen on the base currency.
So, the difference between these two prices yields some pips. And these pips become the profit of the brokers. This is how brokers make money without any commission.
In Forex, clients need not pay any additional fee to make a trade, as all the charges are built into the buy and sell prices itself. So, people must not get carried away by brokers who claim that they charge “Zero commission,” because traders will indirectly be paying commission in the form of spread.
In the forex market, the spread is typically measured in pips, which is the smallest unit of price movement in a currency pair.
For example, let us say the current price of EUR/USD is 1.1500 / 1.1504. Here, the left quoted price is called the bid price, and the right quoted price is called the ask price.
Now, to calculate the spread, we just find the difference between the two prices.
So, Spread = ask price – bid price = 1.1504 – 1.1500 = 0.0004
Hence, the spread for this currency pair is 4 pips.
Note: Always subtract the lower price with the higher price.
Moving forward, let us say a trader wants to buy one mini lot of EUR/USD at this price. So, to do the buy, he/she will be paying the ask price (1.1504). And, to close the trade, he/she will be given the bid price (1.1500).
Assuming that they bought and closed (sold) immediately, they would be in a loss of 4 pips. Now, to obtain the loss in terms of cost, we need to multiply the cost of one pip by the number of lots they are trading.
Assuming that the value per pip is $1 for every mini lot, the total cost would sum up to $4. Total cost = 4 pips * 1 mini lot * $1 (per mini lot) = $4
Similarly, if they were trading eight mini lots, the total transaction cost would turn out to be $32. Total cost = 4 pips * 8 mini lots * $1 (per mini lot) = $32
Hence, this brings us to the end of this lesson. And in the next lesson, we shall elaborate more on this topic by understanding the types of spreads in forex.
[wp_quiz id=”54428″]
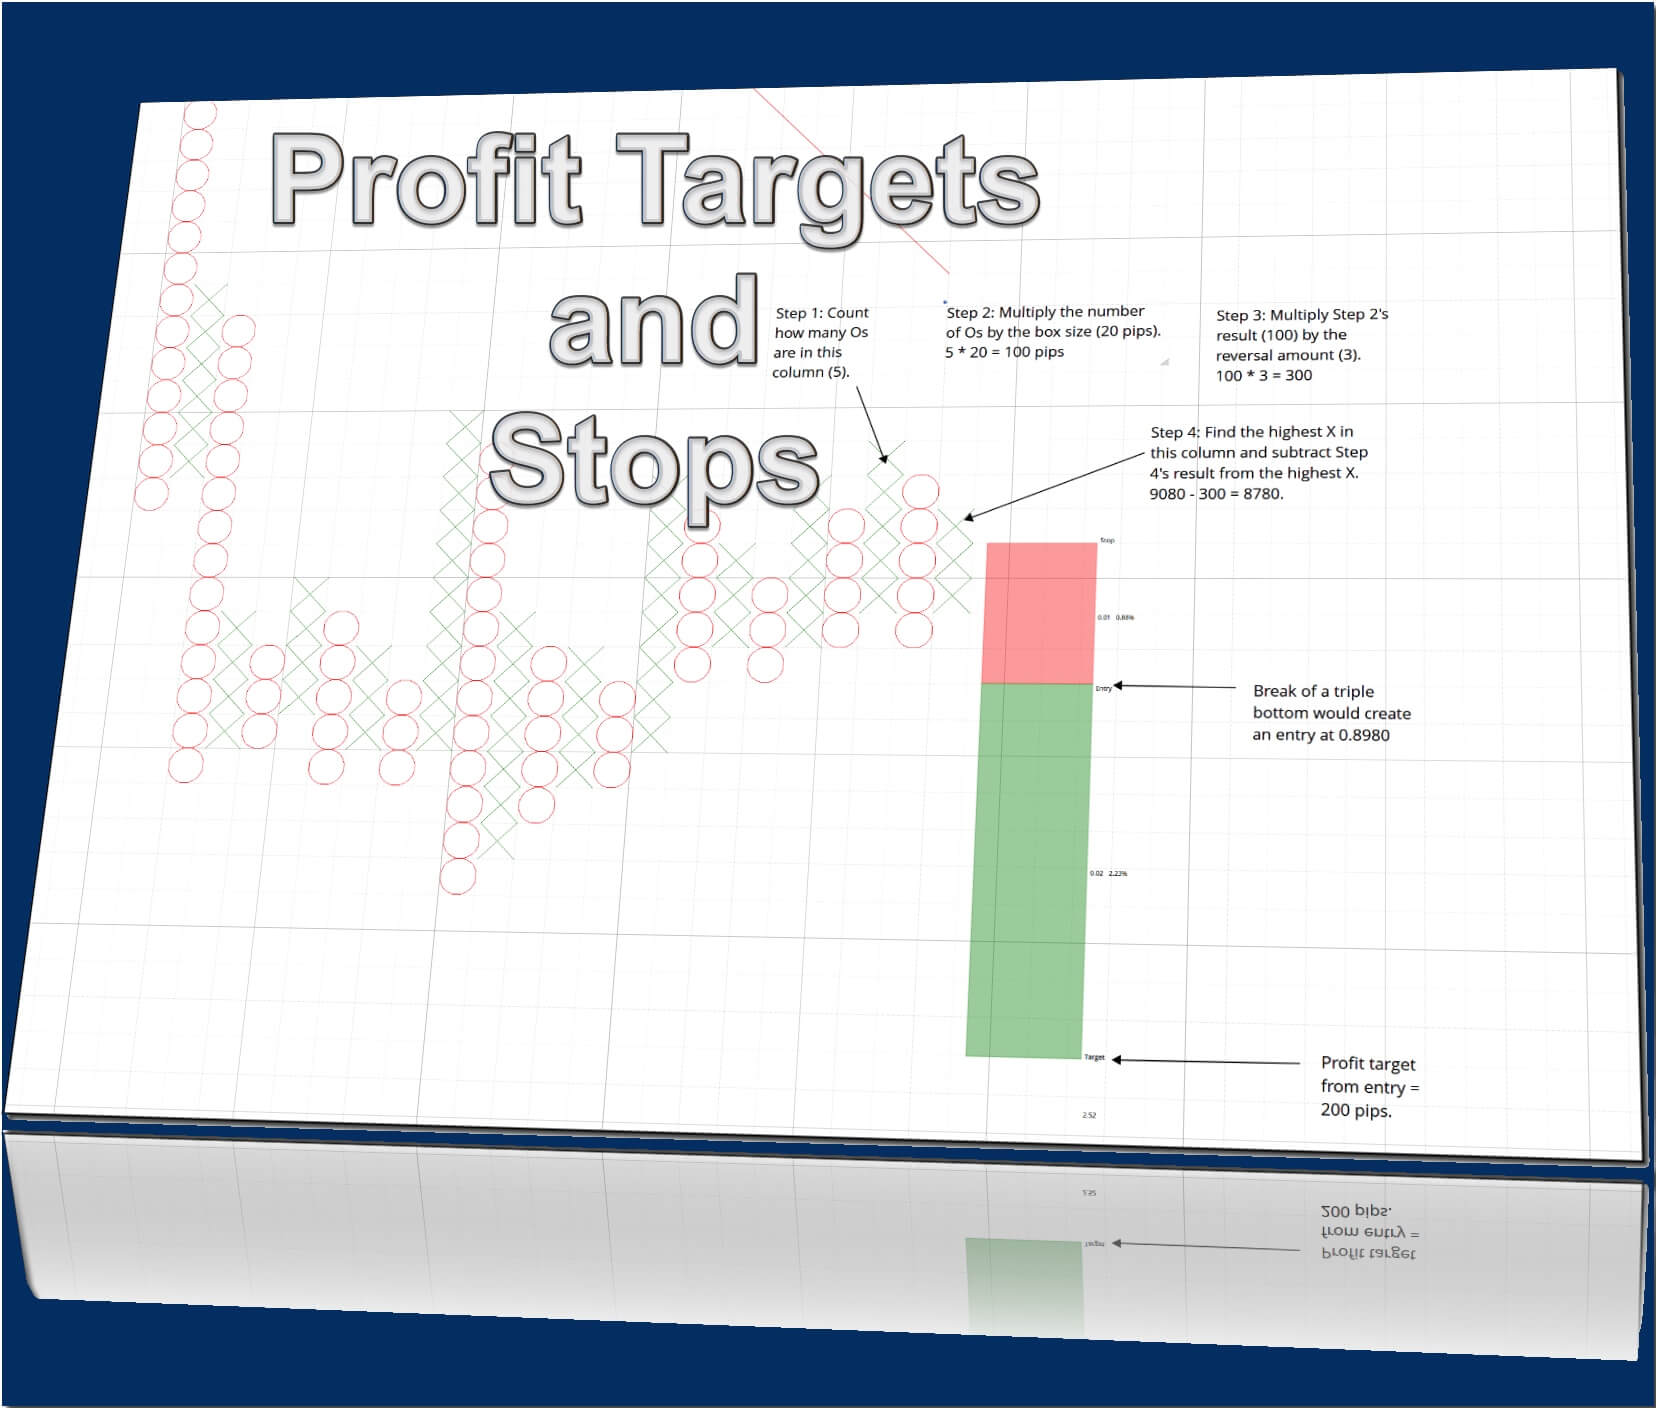
Something new traders struggle with is trying to find appropriate profit targets and stop targets. Point & Figure charts make a process that is a struggle into something that is very, very easy. Two methods can be used to identify profit targets on a Point & Figure chart: Vertical Method and Horizontal Method. I am only going to show you the Vertical Method because the entire series I’ve done here has strictly been on the use of 3-box reversal Point & Figure charts.
The Horizontal Method can be found in Jeremy Du Plessis’s work. The Horizontal Method is more applicable to the most traditional form of Point & Figure – the 1-box reversal chart. There’s a formula for calculating the profit target on Point & Figure. Don’t get freaked about the word formula – the process is very simple.
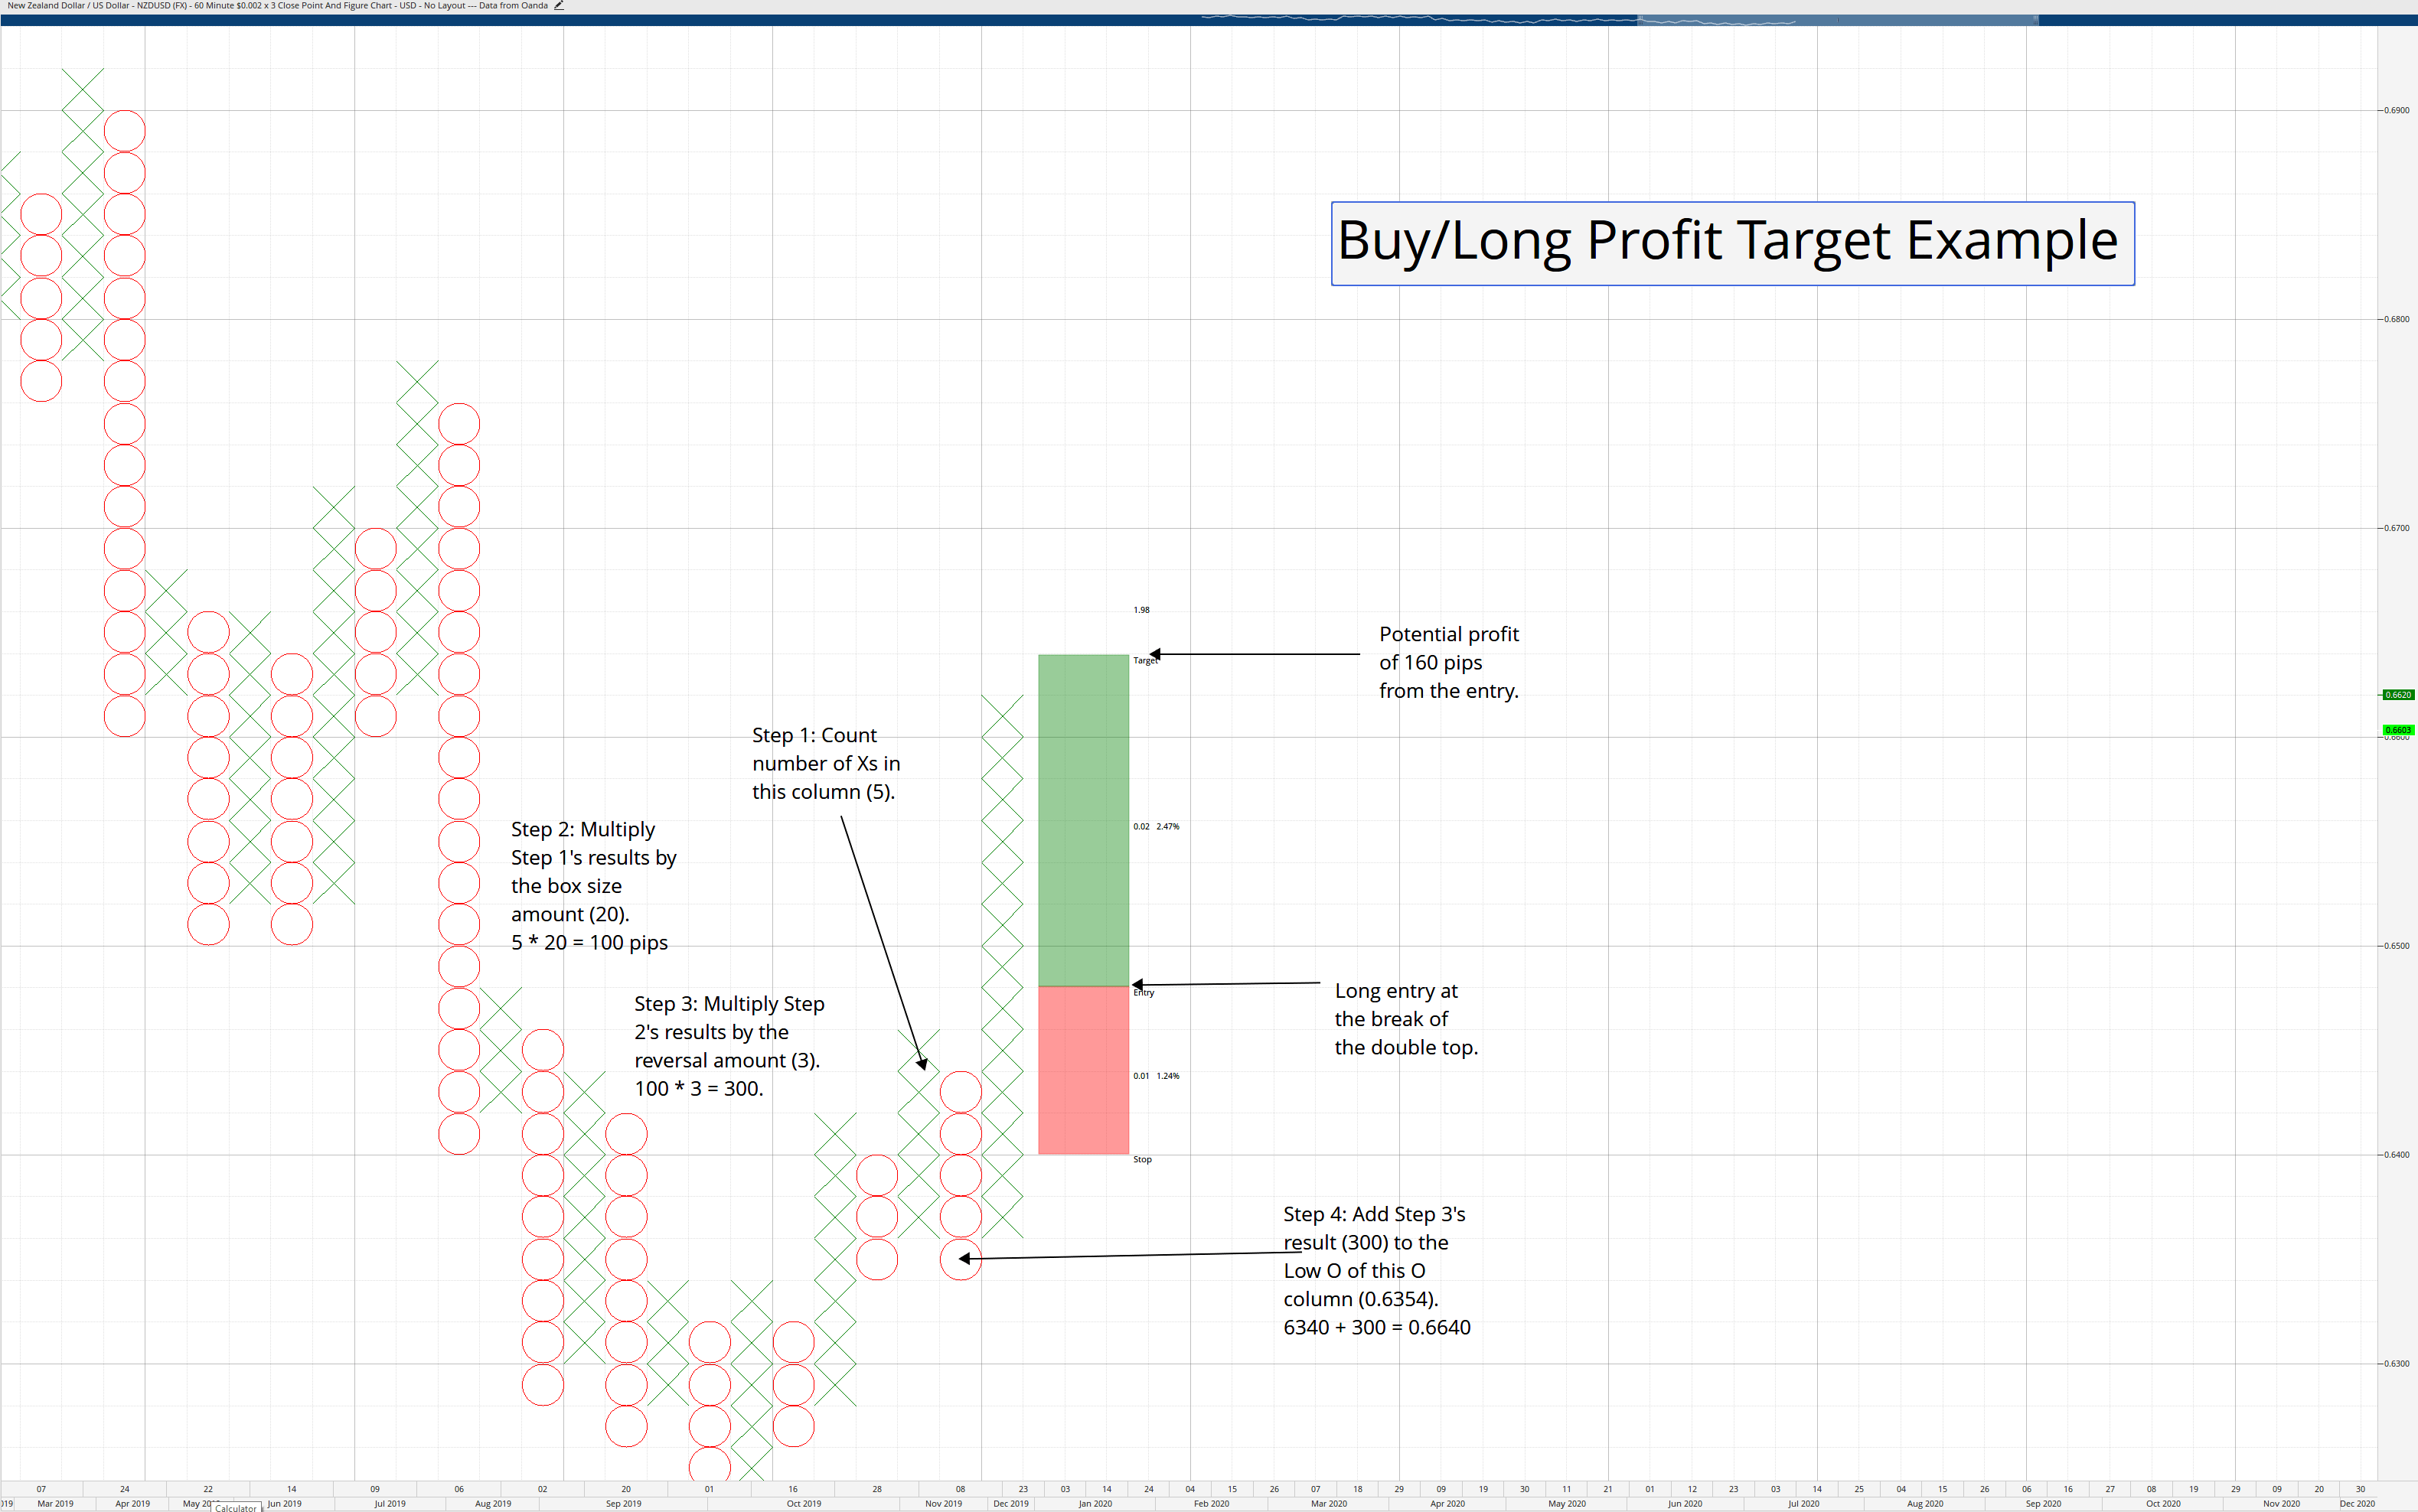
Buy/Long Profit Target = (number of Xs in prior column * box size) * (reversal amount) + lowest O of the current O column.
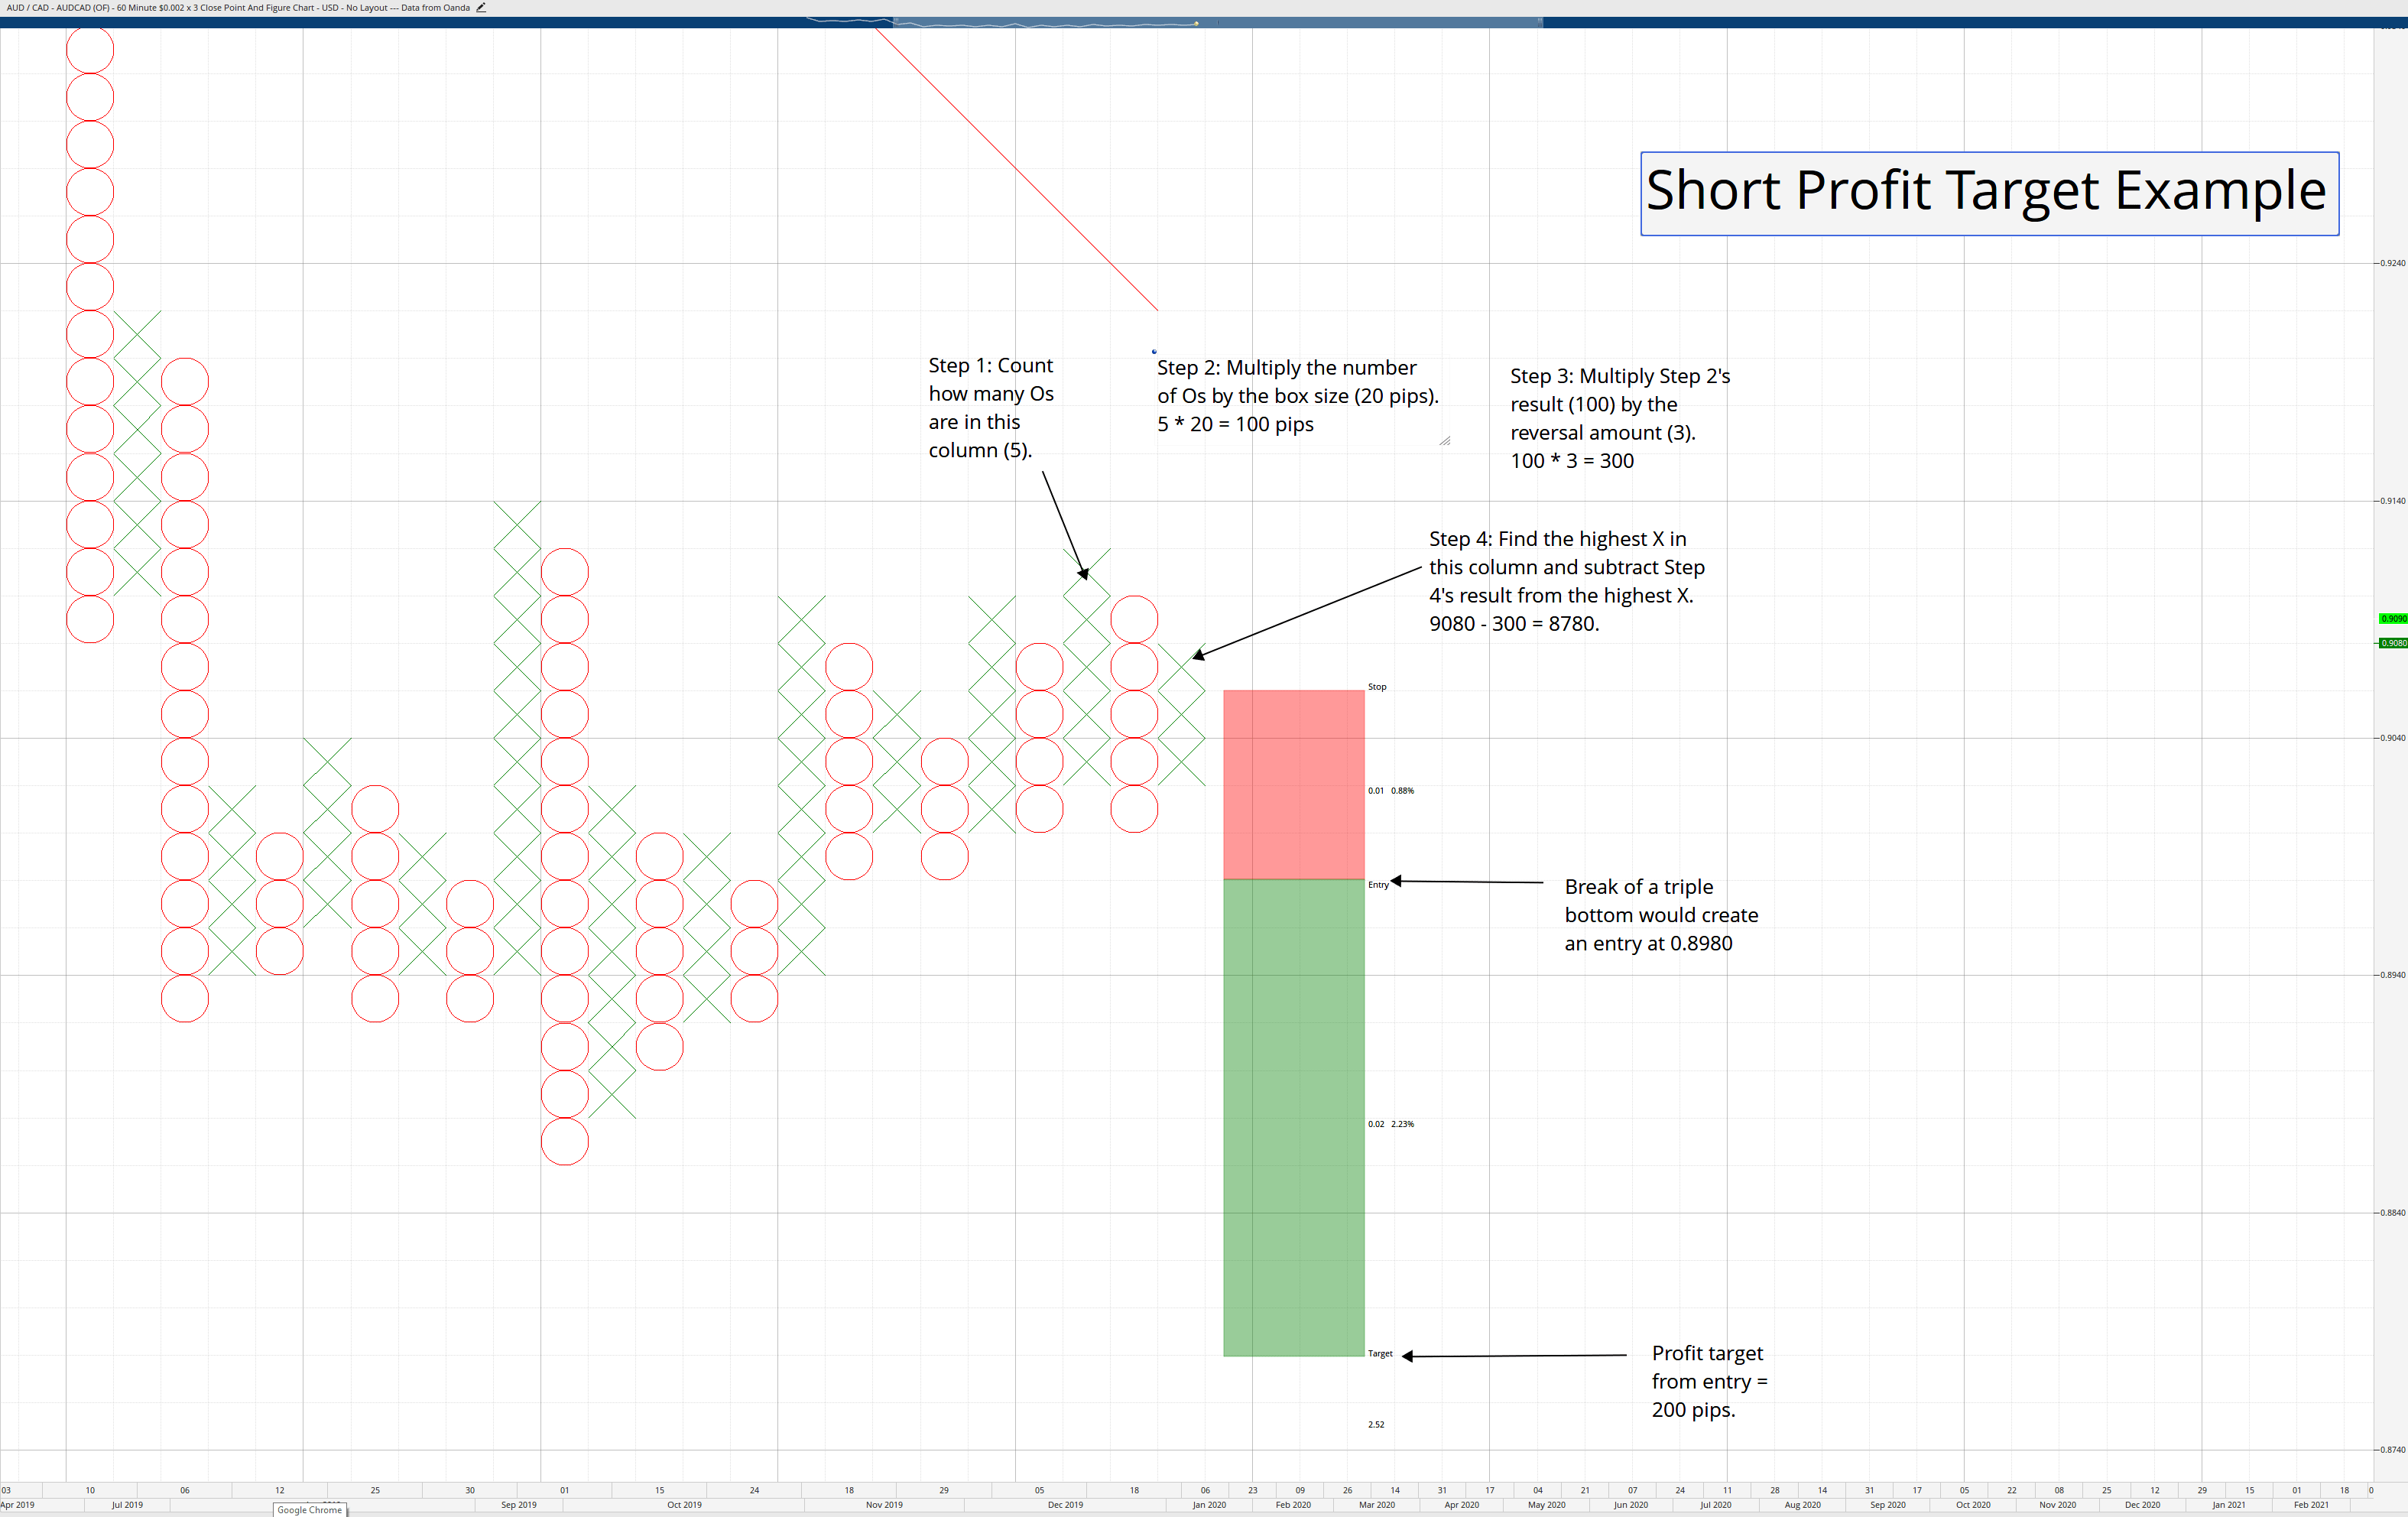
Short Profit Target = (Number of Os in prior column * box size) * (reversal amount) – highest X of the current X column.
Stops
Regarding stops, I always stick with the reversal amount – so my risk is always, no matter the trade, 3-boxes worth. On my standard 20-pip box size Point & Figure charts, 60 pips are my max loss on any trade. Some authors suggest putting the stop one box below (or above) the reversal amount, but I’ve always stuck with the reversal amount being my stop.
The Blind Entry Trading System
I want to tell you something that might be a little mind-boggling. I’ve been teaching Point & Figure to another class this year, and we’ve focused on live testing the ‘blind entry’ trading strategy in Point & Figure – which is nothing more than taking every single multiple-top or multiple-bottom break without any other filter. We focused on the following pairs:
GBPUSD, AUDUSD, USDCAD, USDJPY, GBPJPY, EURGBP, EURUSD, and AUDJPY.
We did not use any profit targets. We exited trades only when the reversal column appeared. So our losses were always limited to just 60 pips on a 20-pip/3-box reversal Point & Figure chart. We traded from March 1st, 2019 through December 7th, 2019. The results below detail the net pips at the end of our trading period:
GBPUSD = +1,060 pips
AUDUSD = -60 pips
USDCAD = +200 pips
UDSJPY = +1060 pips
GBPJPY = + 2,620 pips
EURGBP = +480 pips
EURUSD = -280 pips
AUDJPY = +1,200 pips
Net Total pips = +6,280 (the average for the class was +5443 pips).
To put that into perspective, with a 0.1 (10,000 unit) Lot size, that’s a net $6,280.00. A full Lot would have equaled a net $62,800. I had one woman who traded an odd 3.33 Lots as her standard position size (I guess it is not that odd if you think about it). She led the pack with her real net pip count at +6,880 – with a 3.33 lot size that meant she made a net $229,104. I was and remain very envious of her performance – she should probably be teaching!
Sources:
Dorsey, T. J. (2013). Point and figure charting: the essential application for forecasting and tracking market prices (4th ed.). Hoboken, NJ: John Wiley & Sons.
Kirkpatrick II, C. D., & Dahlquist, J.R. (2016). Technical Analysis: The Complete Resource for Financial Market Technicians (Third). Old Tappan, NJ: Pearson.
Plessis, J.J. (2012). Definitive Guide to Point and Figure – a comprehensive guide to the theory (2nd ed.). Great Britain: Harriman House Publishing.
DeVilliers, V., & Taylor, O. (2008). Point and figure charting. London: Financial Times/Prentice Hall.
If you’re regularly tuned to cryptocurrency subject, no doubt you’ve heard the term ‘distributed ledger’ or DLT, thrown around once or twice. You’ve probably also heard some people use the phrase to refer to blockchain – the technology underlying everyone’s most familiar cryptocurrency. But does a distributed ledger and blockchain mean the same? And what is this distributed ledger thingy anyway?

If you’re regularly tuned to cryptocurrency subject, no doubt you’ve heard the term ‘distributed ledger’ or DLT, thrown around once or twice. You’ve probably also heard some people use the phrase to refer to blockchain – the technology underlying everyone’s most familiar cryptocurrency. But does a distributed ledger and blockchain mean the same? And what is this distributed ledger thingy anyway?
If you’re regularly tuned to cryptocurrency subject, no doubt you’ve heard the term ‘distributed ledger’ or DLT, thrown around once or twice. You’ve probably also heard some people use the phrase to refer to blockchain – the technology underlying everyone’s most familiar cryptocurrency. But does a distributed ledger and blockchain mean the same? And what is this distributed ledger thingy anyway?
In this guide, we dive full form into the world of DLTS: some of their popular examples, how they can be integrated into real life, and that burning question – whether they are the same thing with blockchain. But first, a little background is in order.
A distributed ledger is simply a database that is shared and replicated across multiple locations or institutions and among multiple participants. No central authority or third party is involved. Every entry in a distributed ledger is immutable – that is, it cannot be changed, and every participant in the network has an identical copy of it.
We can think of a distributed ledger in terms of its opposite – a centralized ledger. A centralized ledger has one point of control and has a single point of failure. On the contrary, it’s hard to attack a distributed ledger because all the distributed copies would have to be attacked simultaneously for the attack to be successful.
Ledgers have existed for centuries. People in the early days would record transactions on clay or papyrus. Over time, these were replaced by paper, and then computers, and now we’re entering into the realm of distributed ledger technology.
In the past, the word ledger referred to financial records. Distributed ledgers are used to refer to the database, without any specific inference for the contents. Nowadays, the uses cases of distributed ledgers are numerous and varied.
Distributed ledgers function via nodes – which, in simple terms, are connection points within the network that can receive, store, share, or synchronize data. The connection points allow users within the network to be linked to each other – facilitating peer-to-peer, decentralized transactions between individuals on the network.
All updates to the ledger are first agreed upon by the nodes via a voting process known as consensus. Once consensus has been reached, the distributed ledger automatically updates this, and the latest version of the ledger is saved on every single node.
A lot of people use the terms ‘blockchain’ and ‘distributed ledger’ as if they meant one and the same thing. However, it helps to remember something simple: all blockchains are distributed ledgers, but not all distributed ledgers are blockchains. Any database that’s shared across multiple sites and participants, decentralized, and that needs consensus among nodes can be described as a distributed ledger.
A blockchain is simply a subset of DLTs. It’s a series of blocks of data chunks known as ‘blocks,’ which are encrypted after every transaction. ‘’Miners’ validate transactions and ensure they are accurate – that is, ensuring a coin is not being double-spent. Miners then get rewarded with coins of the native cryptocurrency or a fraction of the transaction fees.
On the other hand, DLTs do not feature or require such a chain, nor are there miners to validate transactions. DLTs also do not need to have a data structure in the form of blocks.
Suffice it to say, many DLTS today were designed to circumvent the shortcomings of blockchain – issues like scalability, processing time, massive computational power, transaction fees, and so on.
There are a few types of distributed ledger technologies today, with some being more popular than others. We’ll look at four of these – specifically blockchain, Directed Acyclic Graph (DAG), Holochain and Hashgraph.
Each of these DLTs has their strong and weak points, but they all aspire to offer the same solution – a decentralized, transparent, fast, and safe avenue for relaying transactions and/or data. Let’s take a look at each, starting with the most familiar one – blockchain.
Satoshi Nakamoto, the creator of Bitcoin, noted that a network would collect and record information in blocks – which would be linked to each other, hence blockchain. Each block in the blockchain is identified by a unique hash generated by the SHA256 cryptographic hash algorithm. Due to the uniqueness of each block, it’s impossible to alter a transaction since that would result in the creation of a new block – indicating an invalid transaction.
In addition, transactions are added on a public ledger and are accessible to every participant in the network. This distributed and transparent nature of the ledger makes it even more difficult for any actor to modify the details of a transaction.
These qualities of immutability (unchangeable, and hence tamper-proof) and transparency are the major factors that make the blockchain so revolutionary. Its ability to inject integrity and transparency in processes and data storage is the chief reason blockchain is disrupting entire industries.
Hedera hashgraph is a type of distributed ledger that works like blockchain but uses a different kind of consensus mechanism that relies on the concept of gossip, gossip about gossip, and virtual voting. Gossip here means that information is relayed by each participant repeatedly to another randomly selected member – informing him everything about the transaction.
This “gossip protocol” utilizes this mechanism for building network consensus as more and more people become aware of the information, whether in full or partially. In hashgraph, transactions are arrived at fully by consensus. As such, unlike blockchain, nodes or members do not have to validate transactions that are conducted on the network, and service requesters do not have to submit “proof of work.”
With the blockchain, proof of work causes transactions to be bulky, leading to very low transactions per second (transactions take place every 10 minutes.) By contrast, the gossip protocol enables hashgraph to support up to 10.000 transactions per second.
Hashgraph’s creators claim that it has overall efficiency than blockchain, “making it suitable for enterprises and commerce.” The CEO maintains that “…it’s a different data structure, different technology and looks nothing like blockchain, but solves the same kind of problems with better security and better performance.”
Directed acyclic graphs are a type of distributed ledger that requires newly added data to be validated previously entered data. Usually, every new transaction involves the confirmation of at least two previous transactions before it is added onto the network. As more transactions are submitted, more are validated and recorded, and we end up with a mesh of doubly-confirmed transactions.
Directed acyclic graphs are by no means a new concept. In Mathematics, a DAG is a graph that has no cycles connecting to the other edges. As such, it’s impossible to navigate through the entire graph by starting from one point.
In a DAG ledger, all transactions are linked to at least one transaction in the following way:
DAGs do not require miners to validate the authenticity of transactions since each transaction is automatically verified by at least two earlier transactions. The result of this process is that transactions are confirmed almost instantaneously, and it also removes the need for miner’s fees, helping to keep transaction fees at a minimum.
DAG is commonly applied to processes dealing with data processing, scheduling, navigation, and data compression. ByteBall, Nano, and Fantom are some of the cryptocurrency projects utilizing the technology.
Holochain, according to the project’s white paper, is an amalgamation of blockchain, BitTorrent, and Github. With the DLT, each node runs on a chain of its own. It has a feature known as distributed hash table (DHT) where users can store data using certain keys. However, the data stays in actual locations “distributed” globally.
The distribution of locations around the globe decongests the network – rendering it a good candidate for scalability and poising it to achieve even millions of transactions per second.
Scalability is an issue that’s been dogging the traditional blockchain – since developers need validation from a majority of the network participants. On the other hand, a developer only needs confirmation from the single chain that makes up the whole Holochain network, dramatically reducing the wait time that is associated with the traditional blockchain.
Distributed ledgers can be applied across many industries – both as the driver of processes or to improve existing processes.
Blockchain, thanks to the world’s most popular cryptocurrency – Bitcoin, is the mostly applied DLT today. The most obvious application of blockchain is Bitcoin. The technology is also being applied in finance to reduce duplication of information that creates delays and confusion in many aspects of financial services.
The blockchain is also helping to reduce intermediaries in international remittances who not only prolong waiting times but are also expensive. Furthermore, blockchain allows securities trades to be settled within minutes – instead of the traditional several days.
DLT networks are also being used in supply chains to increase transparency and enhance accountability by tracking and logging details, flow, and payment of goods in real-time.
They can also be used to prevent fraud in financial transactions by providing immutable – and hence unchangeable audit trails and demanding more transparency and a higher standard of data integrity than the existing system.
DLTs could also be used in the food industry to prevent food fraud. Food can be tracked ‘from farm to plate’ so that customers can see the origin and handling of food.
Smart contracts – which are pieces of code on a DLT are another case of use of DLTs. Smart contracts define the terms of the agreement between parties – with the agreement unalterable and available for every party to see and refer to. They can be used in such cases as invoicing, shipping, procurement systems, quality assurance, compliance, and so on.
DLTs are still a nascent technology. However, they present a fundamentally new way to run processes, conduct business, and carry out transactions. For now, it remains to be seen if they will gain mainstream traction and change how businesses, institutions, and industries operate.
As of now, academic and financial experts question whether DLTs – in their current form, are reliable enough to be adopted for full-scale use. Still, influential finance institutions such as the World Bank recognize their potential to transform various sectors such as manufacturing, government financial management systems, and clean energy.”
What’s clear, though – their incorporation into systems will likely be done incrementally – by first replacing redundant and manual procedures and activities. They could come handy in areas such as record-keeping in payment and settlement processes, tracking agricultural systems, syndicated loans, and so on.
DLTs hold vast potential for changing the way we organize our lives and societies – thanks to their radically transparent, unalterable, and democratic nature. From food to finance to supply to negotiations – incorporating DLTs could transform our very lives and societies. This, however, is entirely contingent on whether they will transcend the current scalability issues, or whether they will gain widespread acceptance across industries.
Point & Figure Charts
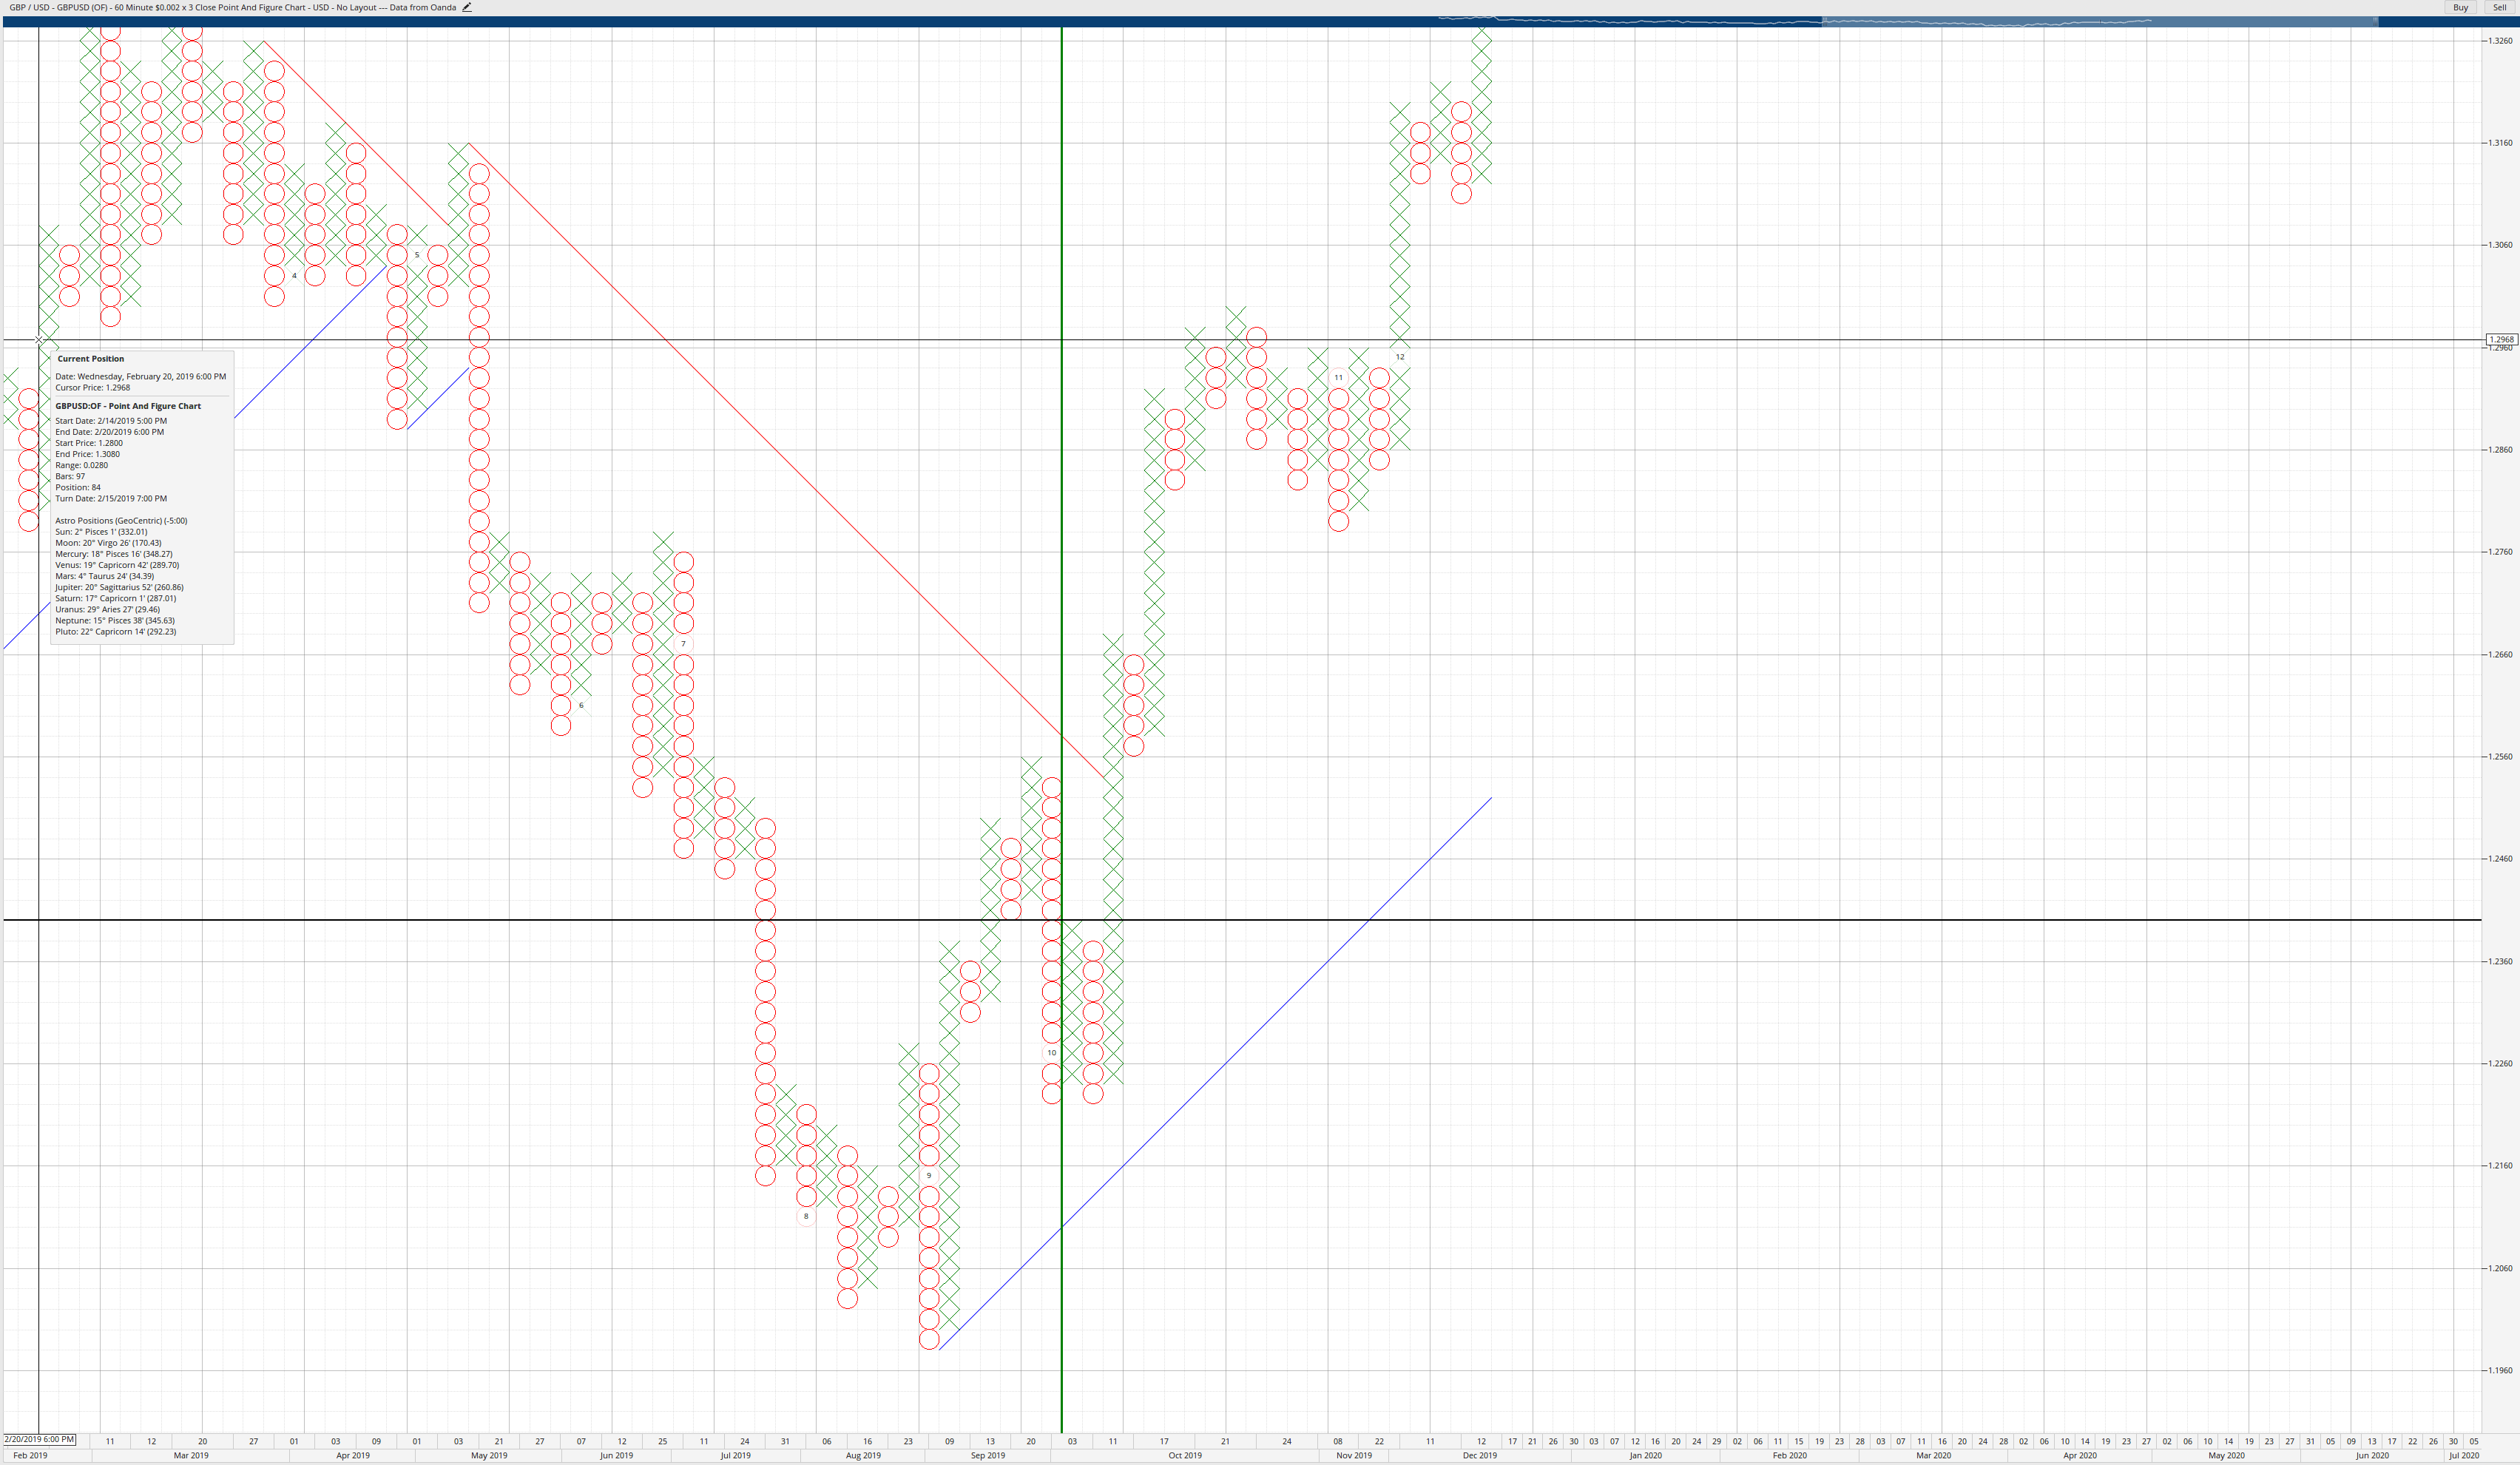
Point & Figure Charts
If the only chart style you have ever been familiar with is Japanese candlesticks or American bar charts, then no doubt Point & Figure charts will look very foreign. They have the appearance of random and new while also being very organized and very old looking. Point and Figure charts are the earliest known forms of technical charting that we know of, and many civilizations have generated some Point and Figure charts out necessity. Another concept that may be difficult to grasp if you are new to price action only chart styles is that Point and Figure charts are an intraday charting style, but is void of any time component. Live data is necessary when using Point and Figure charts. The fact that Point and Figure is an intraday chart style will confound most people who are familiar with charts that utilize the component of time, like Japanese candlesticks. Most of you who are learning about Point and Figure charts will assume that Point and Figure is a long term chart form. It is tough to create the mindset that time is not a factor in Point and Figure. But let’s get to the chart.
Point & Figure Chart Basics – Box Size and Reversal Amount
Point & Figure charts are represented by a Box Size and a Reversal Amount. Boxes are represented as Xs and Os. The trader or analyst determines the Box Size. Depending on the market you are trading and the Reversal Amount, the Box Size will vary from one market and instrument to the next. I will provide a table with the box sizes I use in my trading at the end of this article. On a Point & Figure chart, Xs and Os represent price direction. Xs, often colored green, represent price moving up. Os, usually colored red, represent price moving down.
The trader or analyst also defines the Reversal Amount. Historically, Point & Figure charts were 1-box Reversal charts. Today, 3-box reversal charts are the most common. There is no limit on the number of boxes required for a reversal. I only use 3-box reversal charts – they perform exceptionally well in Forex markets. The Reversal Amount dictates how many boxes price needs to move to print a new column of Xs or Os. Let’s look at the Box Size and Reversal Amount on the chart below.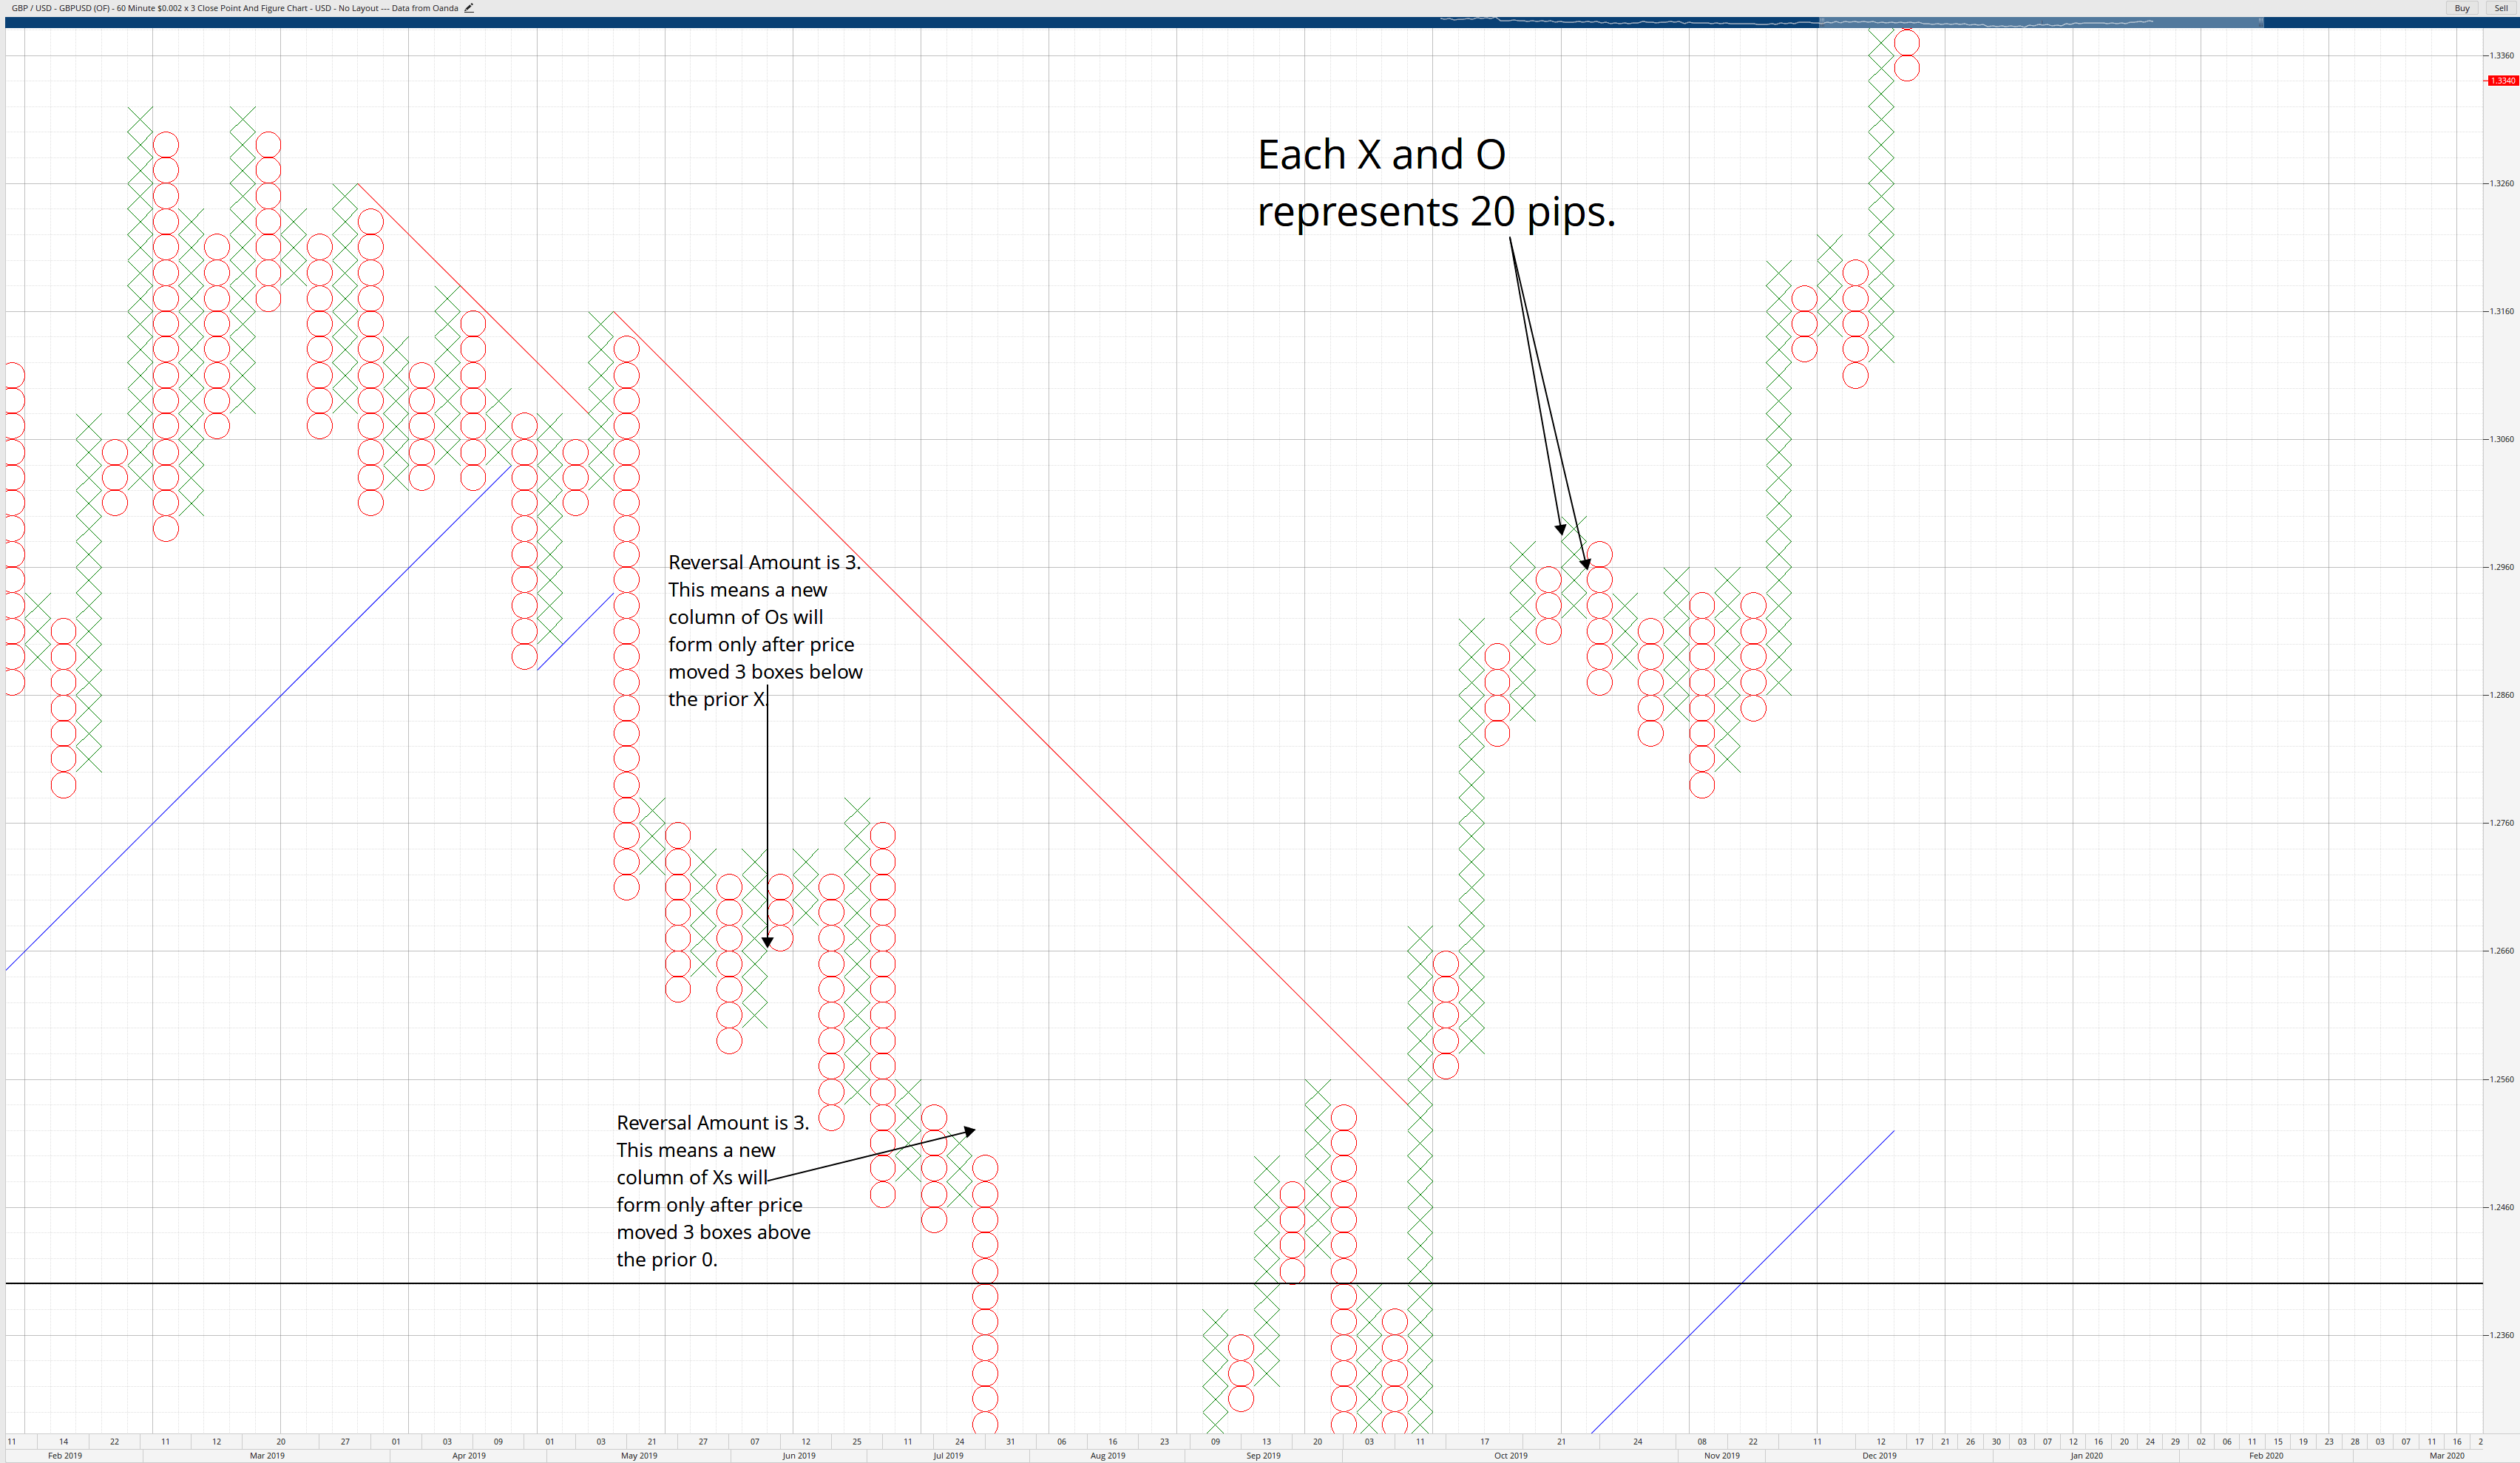
Box Size & Reversal Amount
| Pair | Box Size (in pips) | Pair | Box Size (in pips) |
| AUDCAD | 20 | GBPAUD | 40 |
| AUDCHF | 20 | GBPCAD | 40 |
| AUDJPY | 20 | GBPCHF | 20 |
| AUDUSD | 10 | GBPJPY | 20 |
| CADJPY | 20 | GBPNZD | 40 |
| CHFJPY | 20 | GBPUSD | 20 |
| EURAUD | 40 | NZDCAD | 20 |
| EURCAD | 20 | NZDJPY | 20 |
| EURCHF | 20 | NZDUSD | 20 |
| EURGBP | 20 | USDCAD | 20 |
| EURJPY | 20 | USDJPY | 20 |
| EURNZD | 40 | USDCHF | 20 |
| EURUSD | 20 |
How much time does it take for a column to change from X to O?
Your transition to a price action only chart from a Japanese candlestick chart is going to continually be hampered by continuing to think that ‘time’ has someplace on a Point & Figure chart. You will look at a chart and say to yourself, ‘Well, that column of Xs has been there for a while, it can’t move anymore, it will probably reverse.’ While the concept of time is not used, some pieces of software will allow you to imprint the month on the chart where the month’s number will appear at the price level it was trading at when the month started. This can give those who are transitioning to Point & Figure as a new chart style some ‘grasp’ of time. See below.
Some traders may find having the month displayed as a benefit. Is it useful? I think so. It does at least give a sort of perspective of time and how long something has remained in a single column or how many reversals have been printed on the screen. Additionally, cycle analysis teaches that we often see some of the highest probabilities of trend changes or corrective moves occurring at the start of a new month. If we observe a new month starting near an extreme high or low, we could be looking at an imminent reversal with at least a high probability short term trade option.
Trend Lines and Patterns
Another concept that people new to a price action only chart style might find difficult to understand is that P&F charts are always in a bear or bull market. And depending on the time frames you trade on a Japanese candlestick chart, Point & Figure charts may change bull and bear trends frequently or infrequently. Two types of trendlines can be drawn on a Point & Figure chart:
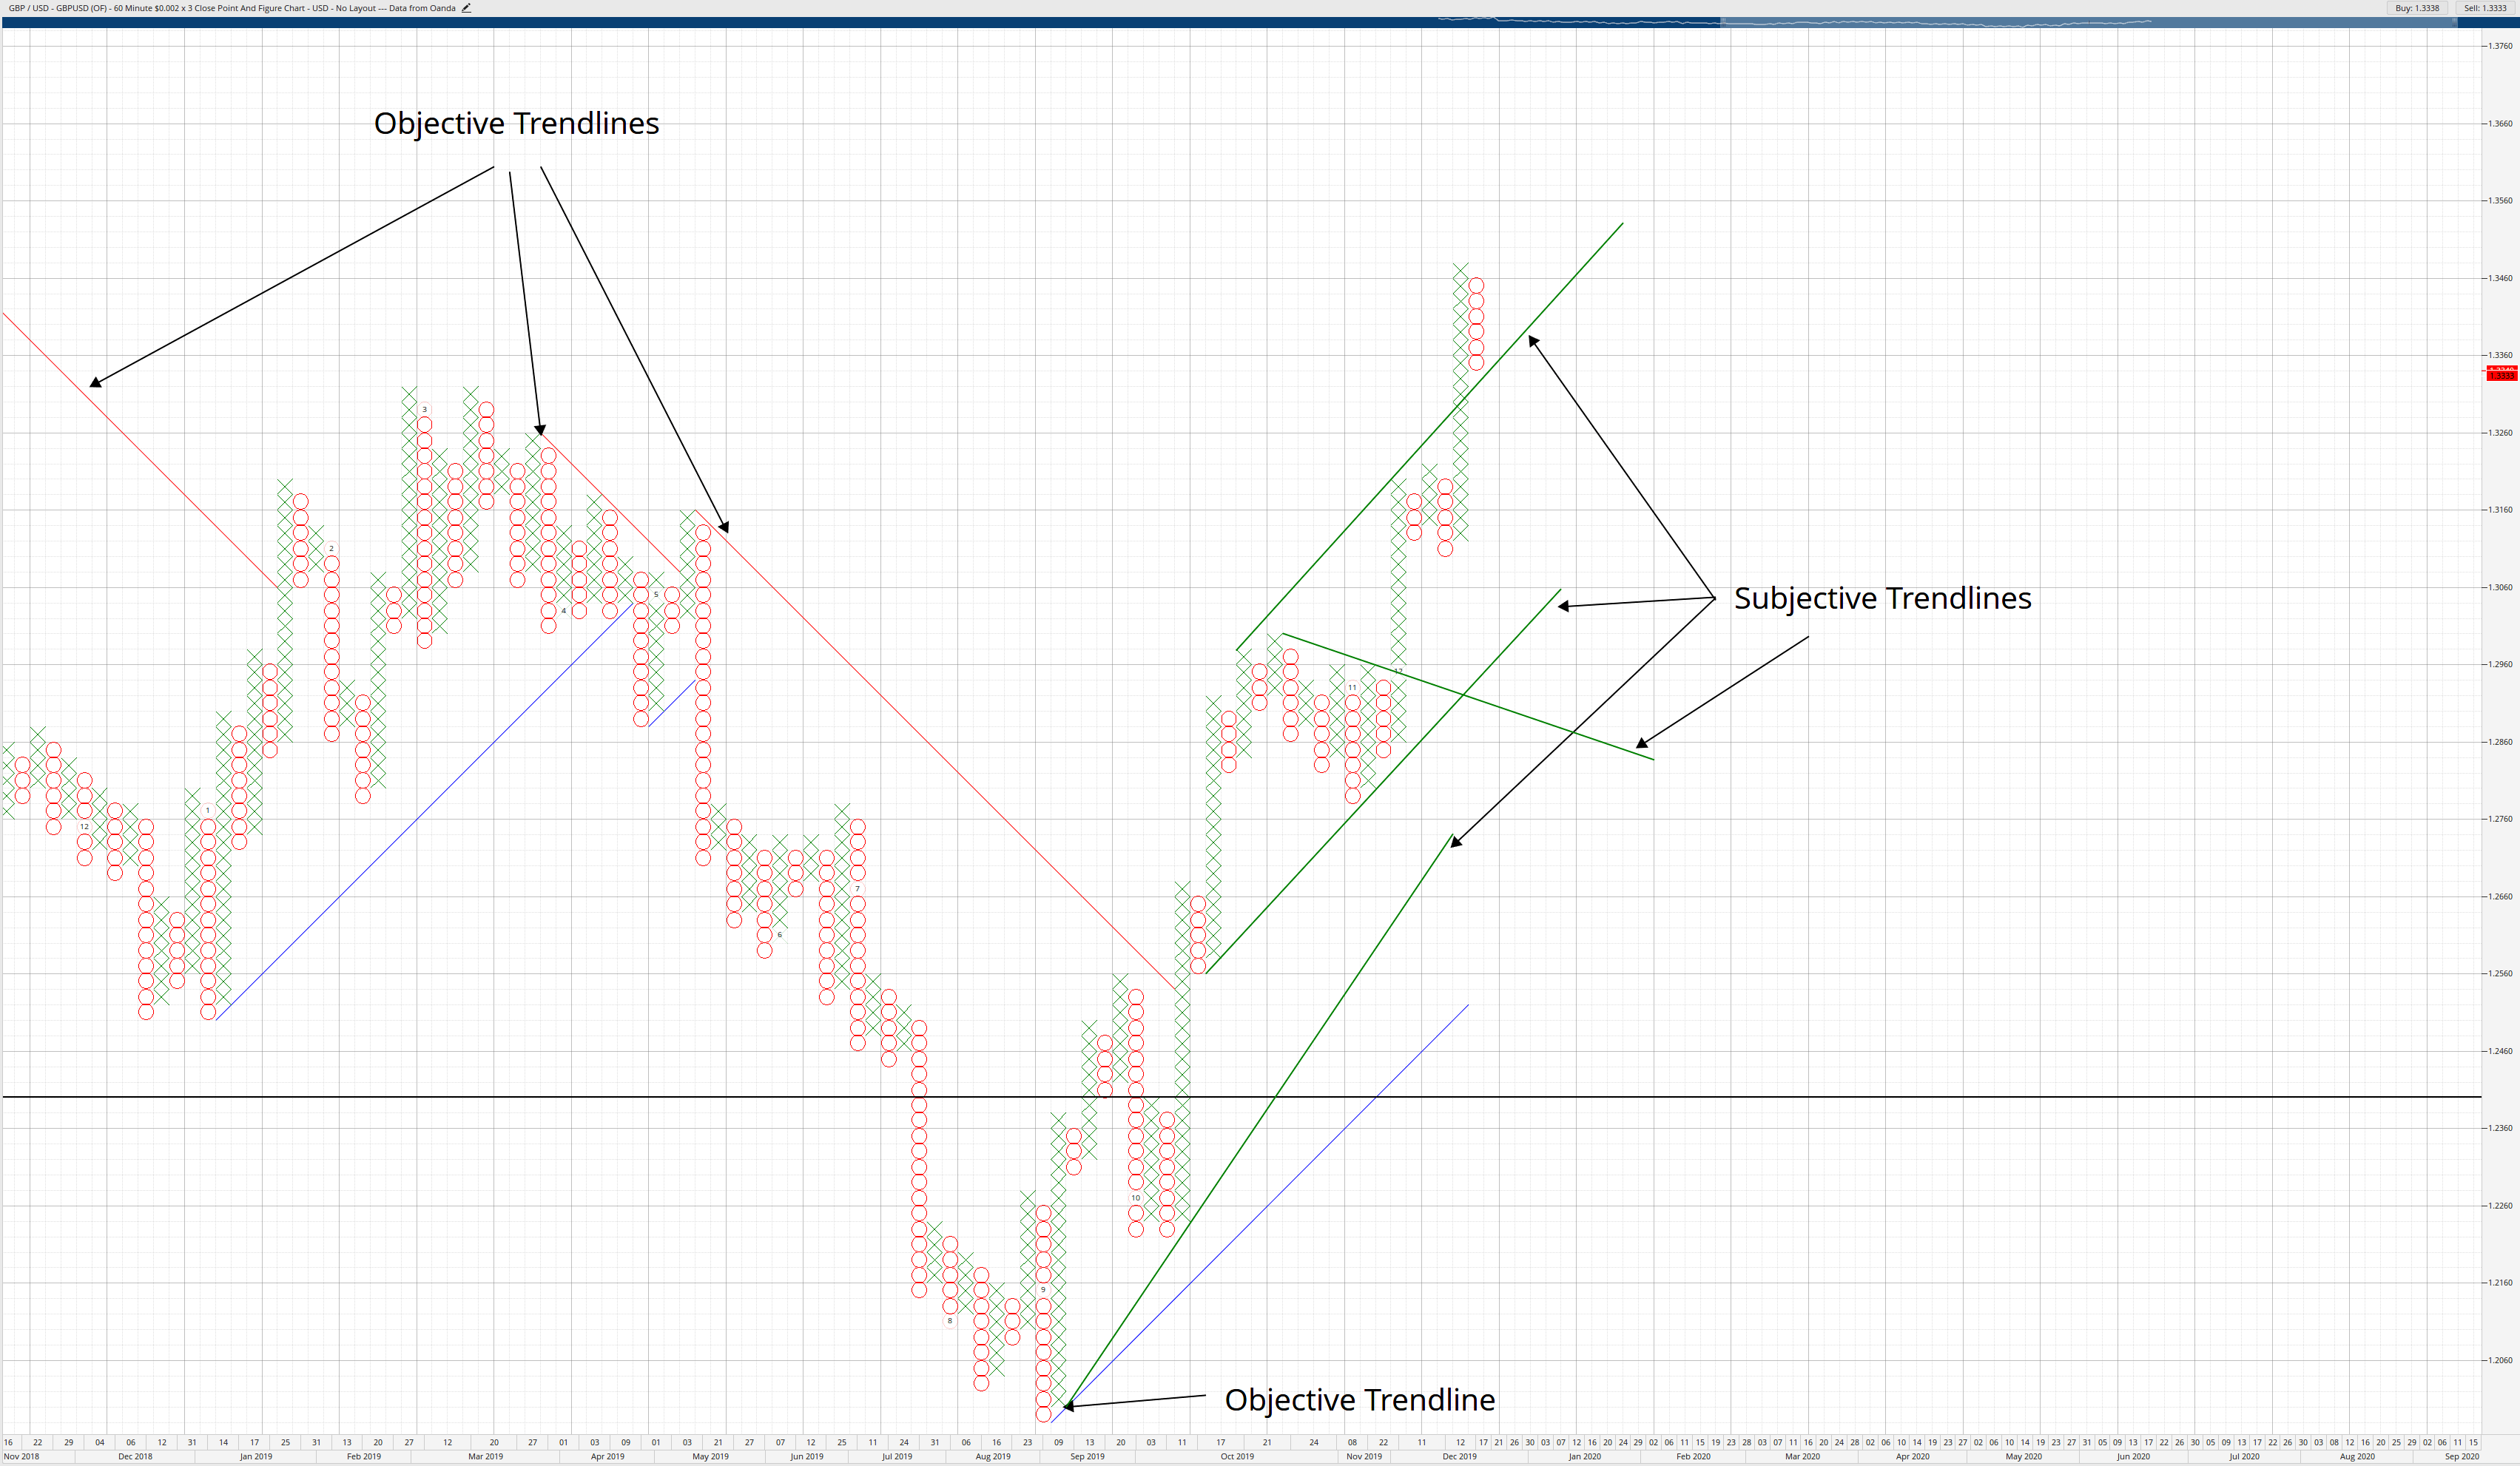
Objective Trend Lines or Dominant Angles are also called 45-degree angles. Dominant angles only require one point to be drawn, and they are always drawn from O to X or X to O (in 3-box reversal charts) – and always to the column right next to eachother. The software I am using for these articles is called Optuma by Market Analyst. In Optuma’s software, they auto-draw some of the dominant trend lines. Subjective trendlines are drawn the same way you would draw any other trendline on a Japanese candlestick chart. I rarely, if ever, utilize subjective trendlines. In some of the strategies I will go over, the dominant/45-degree trendlines are useful in determining the direction of the trading you should take.
Patterns such as flags and pennants will show up on Point & Figure charts just like you would see on Japanese candlestick charts. The same principles that we would apply in trading continuation patterns like flags and pennants are the same on a Point & Figure chart. There are some stark differences between the breakouts of a pattern on a candlestick chart versus a Point & Figure chart. There is a primary difference between how we treat breakouts of patterns and trendlines on a Point & Figure chart versus a candlestick chart.
Most Important Rule To Follow
There is one primary rule that must be followed when trading on Point & Figure charts.
Only Enter Trades After Multipletops/Multiplebottoms have been broken.
I’ve said that Point & Figure charts are unambiguous. The entry rules in Point & Figure reinforces that statement. When a multiple top appears, the entry is always on the next X above the multiple top. When multiple bottoms appear, the entry is always on the next O below the multiple bottom. See the charts below:
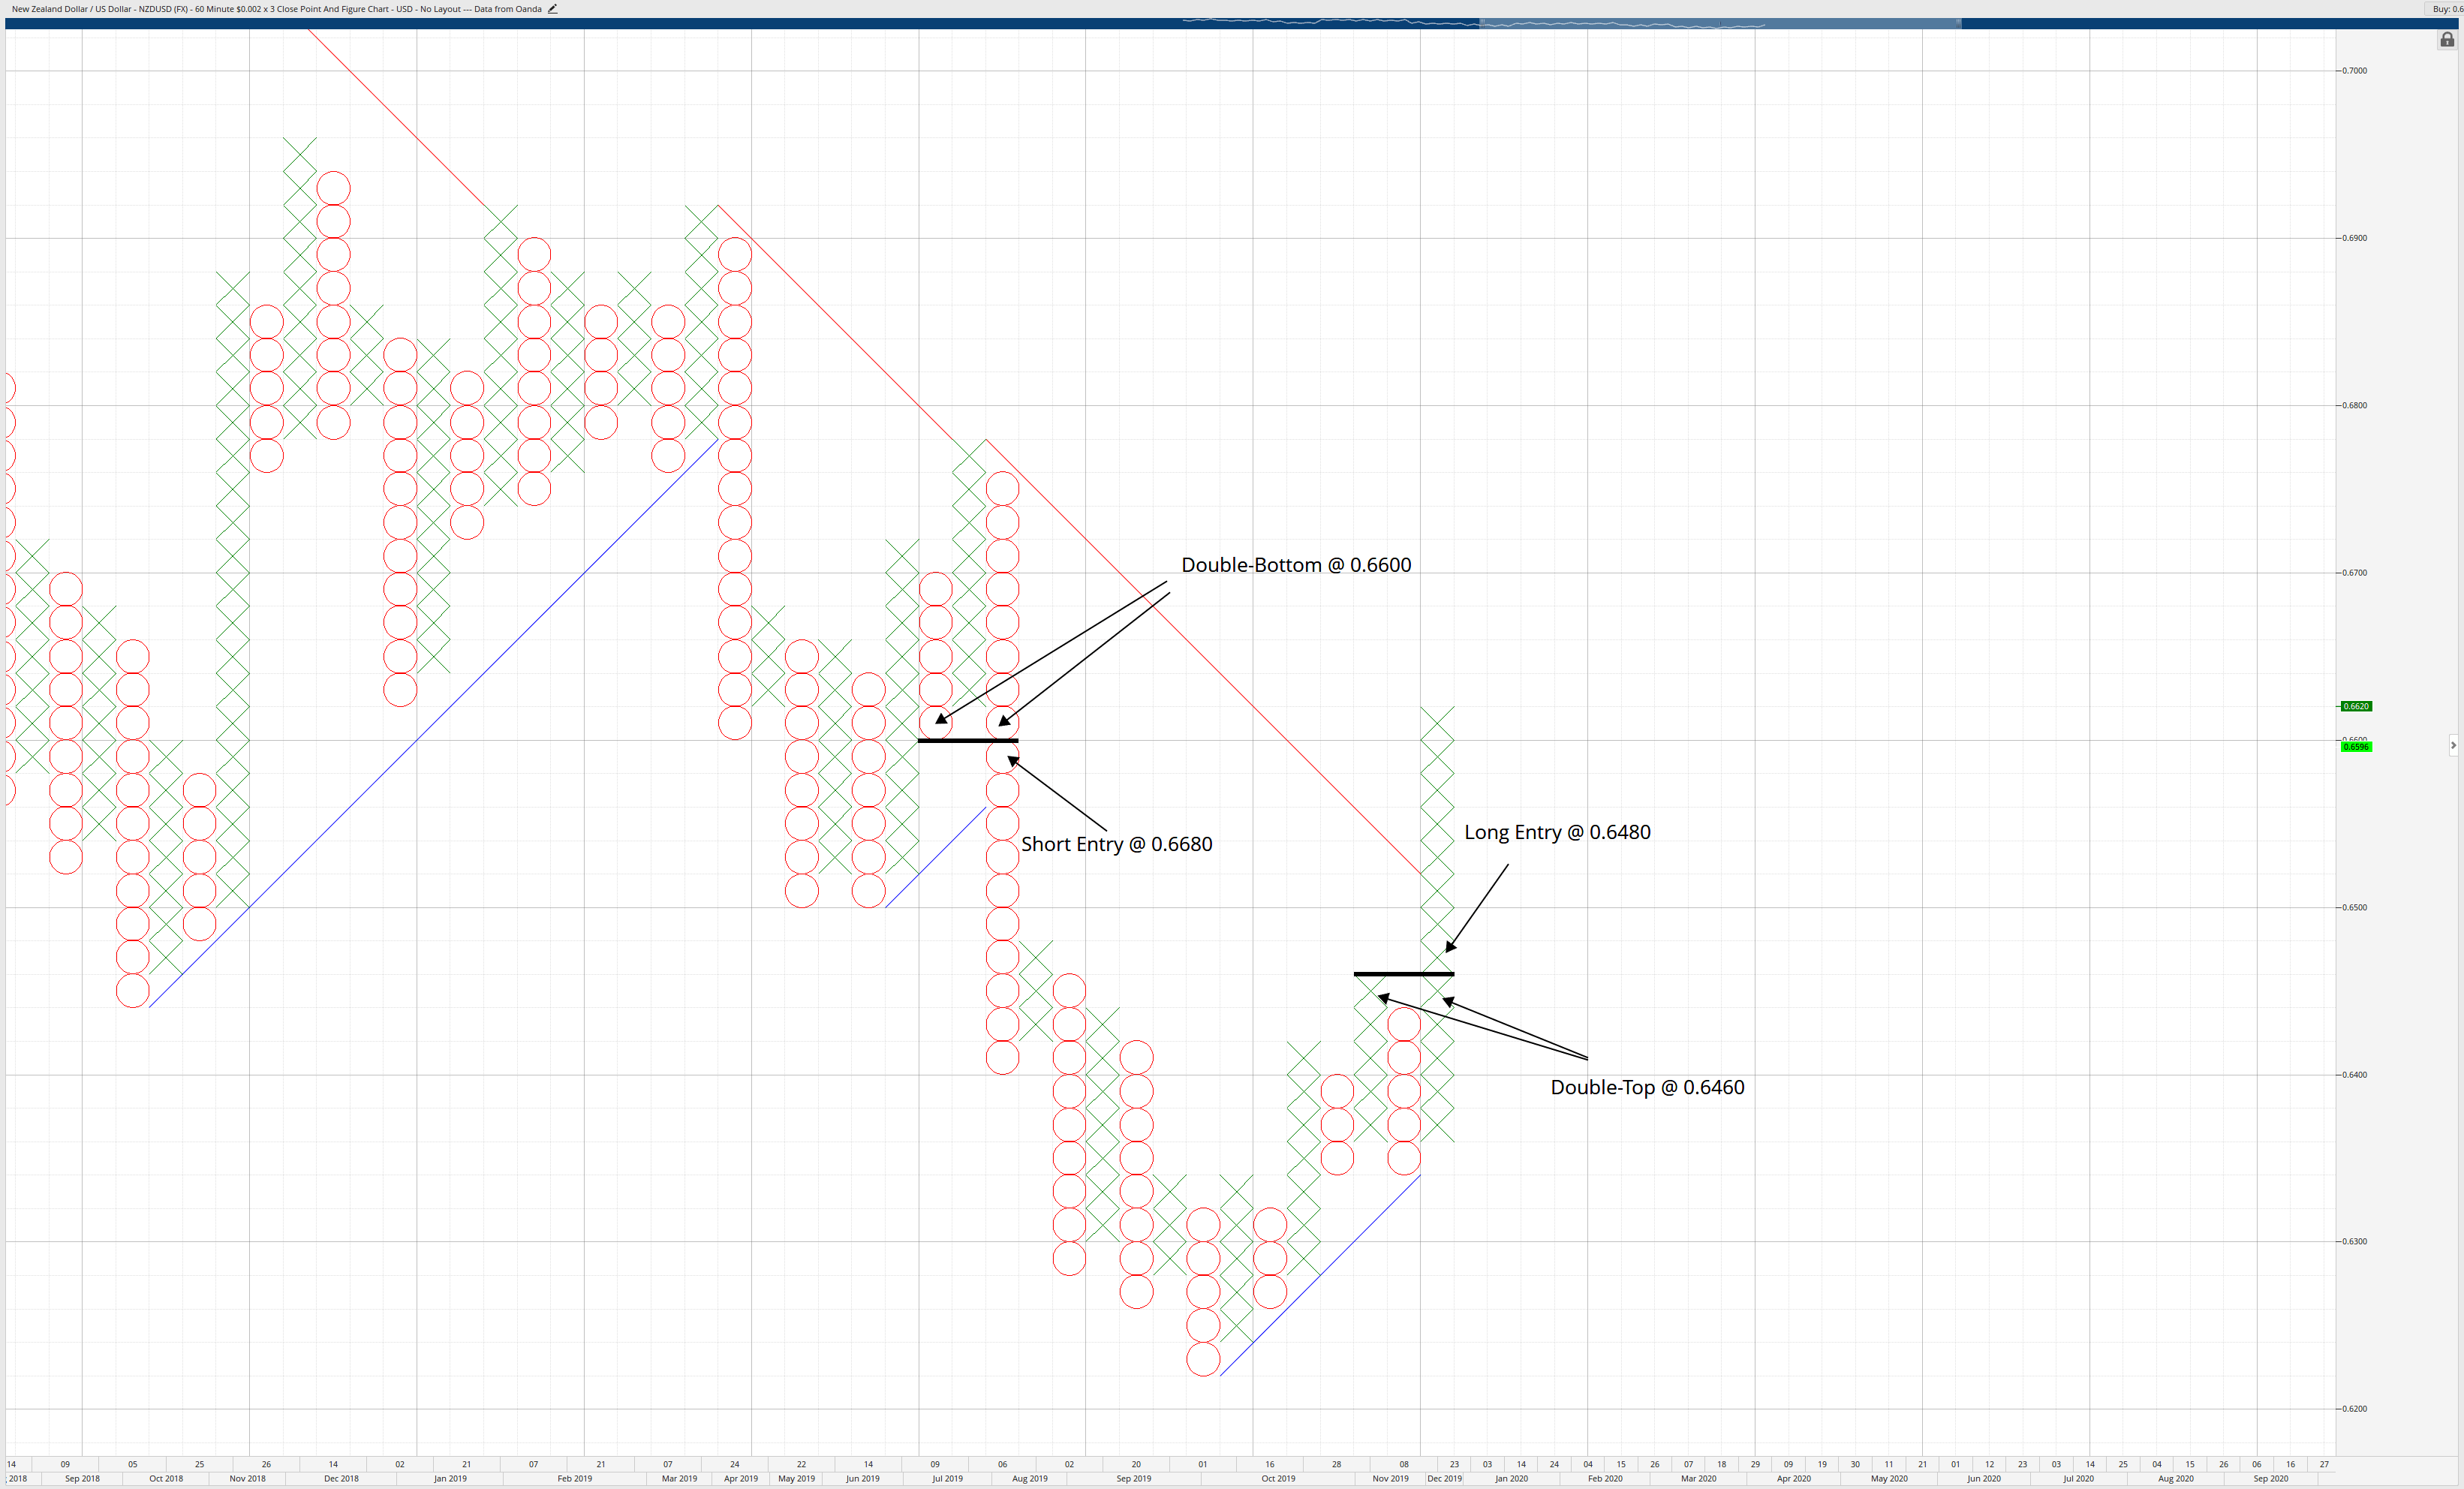
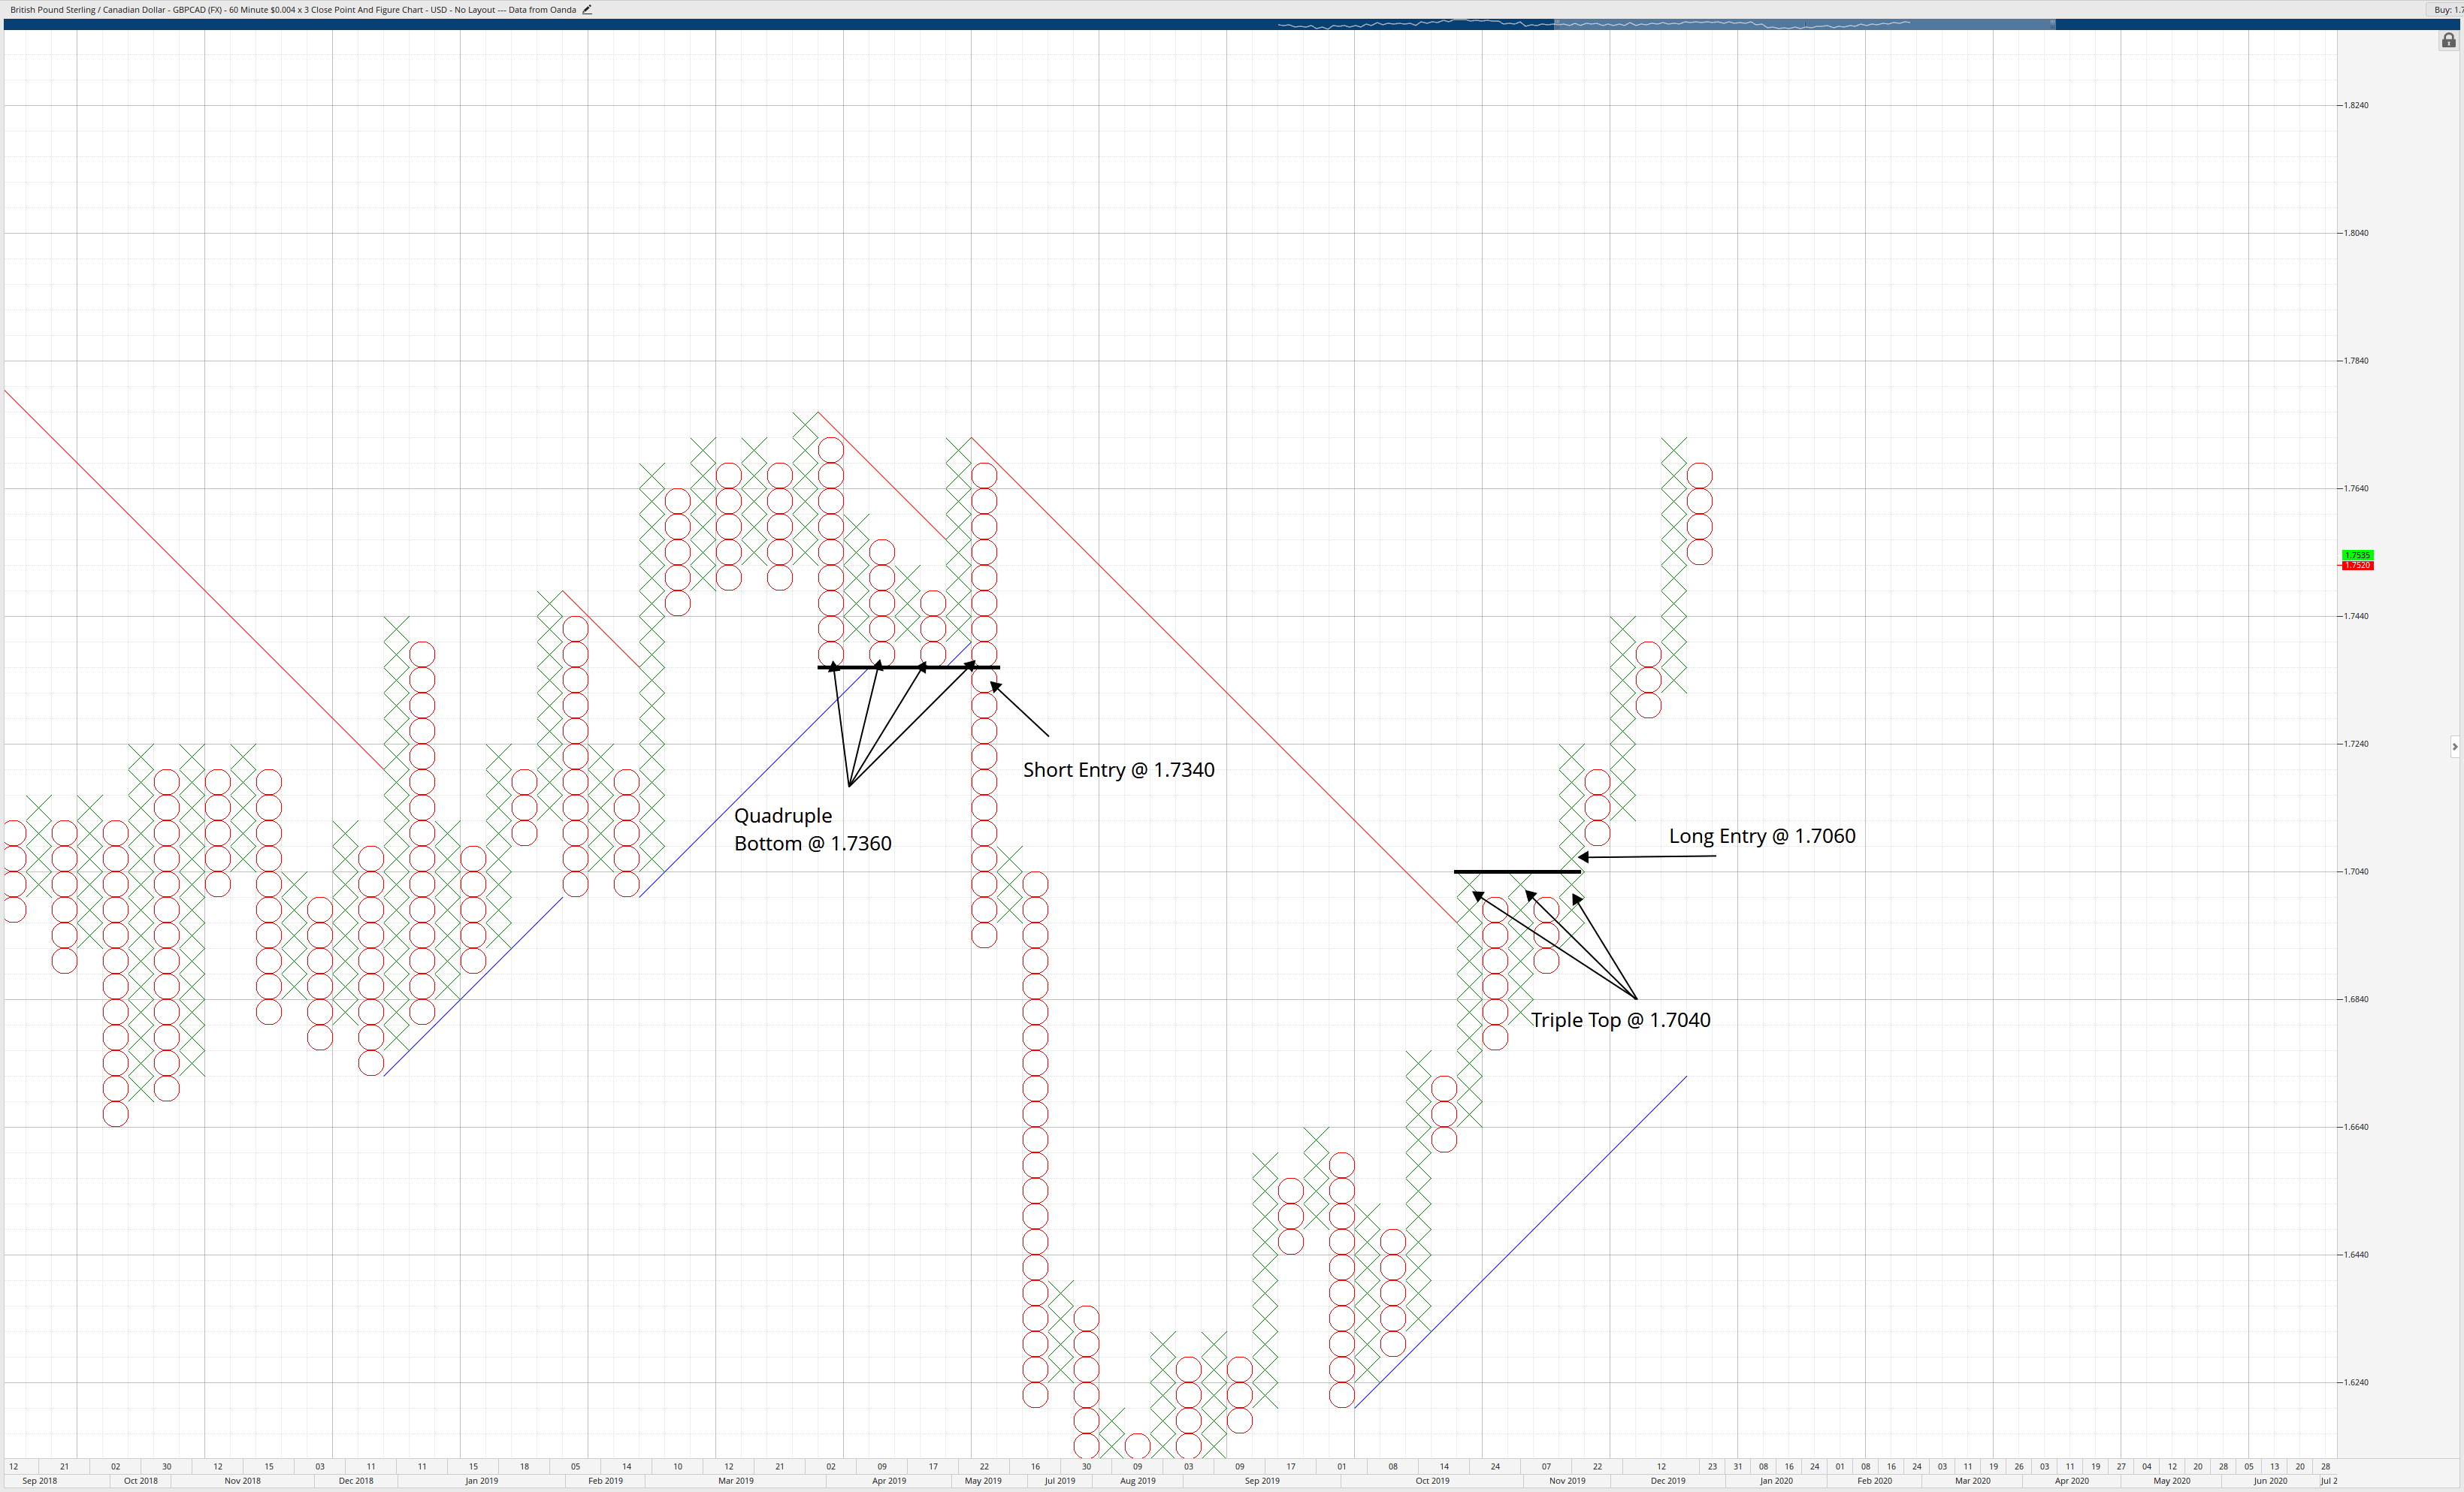
A question often arises when an X or O breaks a trendline: do you enter a trade when the trendline is broken? It depends. The entry rules of multiple tops and multiple bottoms still apply. Even if the price breaks a trendline, a multiple top or bottom needs to be broken to take an entry. Further discussion into entry rules and entry strategies will be discussed in further articles.
Sources:
Dorsey, T. J. (2013). Point and figure charting: the essential application for forecasting and tracking market prices (4th ed.). Hoboken, NJ: John Wiley & Sons.
Kirkpatrick II, C. D., & Dahlquist, J.R. (2016). Technical Analysis: The Complete Resource for Financial Market Technicians (Third). Old Tappan, NJ: Pearson.
Plessis, J.J. (2012). Definitive Guide to Point and Figure – a comprehensive guide to the theory (2nd ed.). Great Britain: Harriman House Publishing.
DeVilliers, V., & Taylor, O. (2008). Point and figure charting. London: Financial Times/Prentice Hall.
https://youtu.be/xBZdIh4GtSw
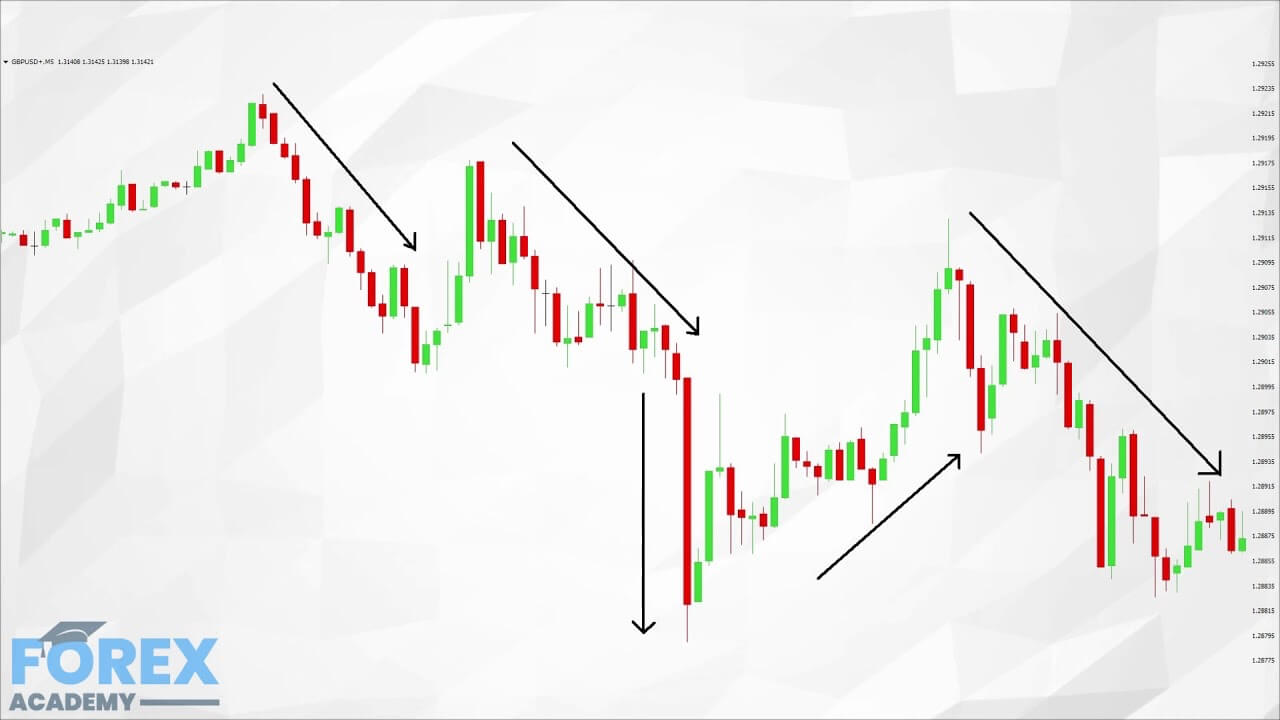
https://youtu.be/xBZdIh4GtSw
When it comes to technical analysis, there are literally dozens of indicators which are available to traders. Choosing the right one for you will depend on your trading style and methodology. Most new traders will go through a process of trial and error when it comes to choosing the correct technical indicators for them. However, it is critical that you know how they work and how they can affect your trading.
Technical indicators are tools and fall into two brackets: leading and lagging indicators. Lagging indicators capture the movements of historical price action data and plots this information onto a chart screen. Traders decipher the patterns and then use it to determine entry and exit points by accessing if a pair is overbought and likely to fall, all or if it oversold and likely to rise, or if it is sideways trading.
Example A
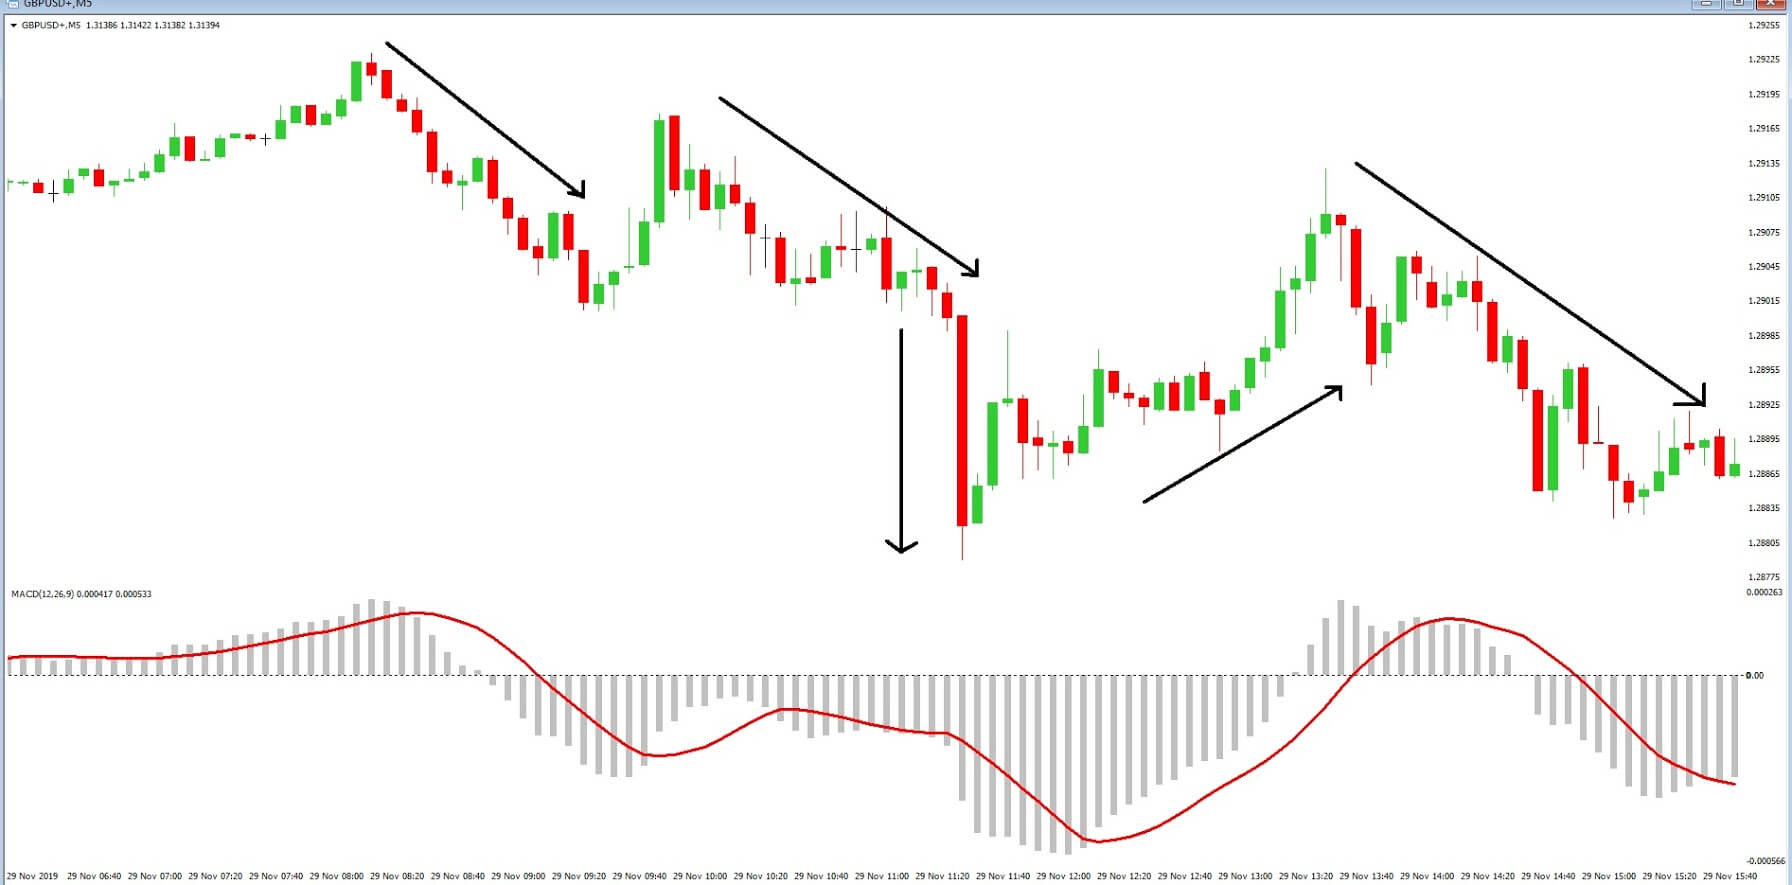
Example ‘A’ is an example of a lagging indicator; the Moving Average Convergence Divergence or MACD takes the average move of historical price action over a set period of time and plots the information onto a chart. In this chart of the GBPUSD pair with the 5-minute time frame, we can see that the price action of the pair is very similarly reflected in the MACD with its moving average, which both fluctuate around its 0 axes. Traders use the imagery to back up their theory of future price action.
Example B
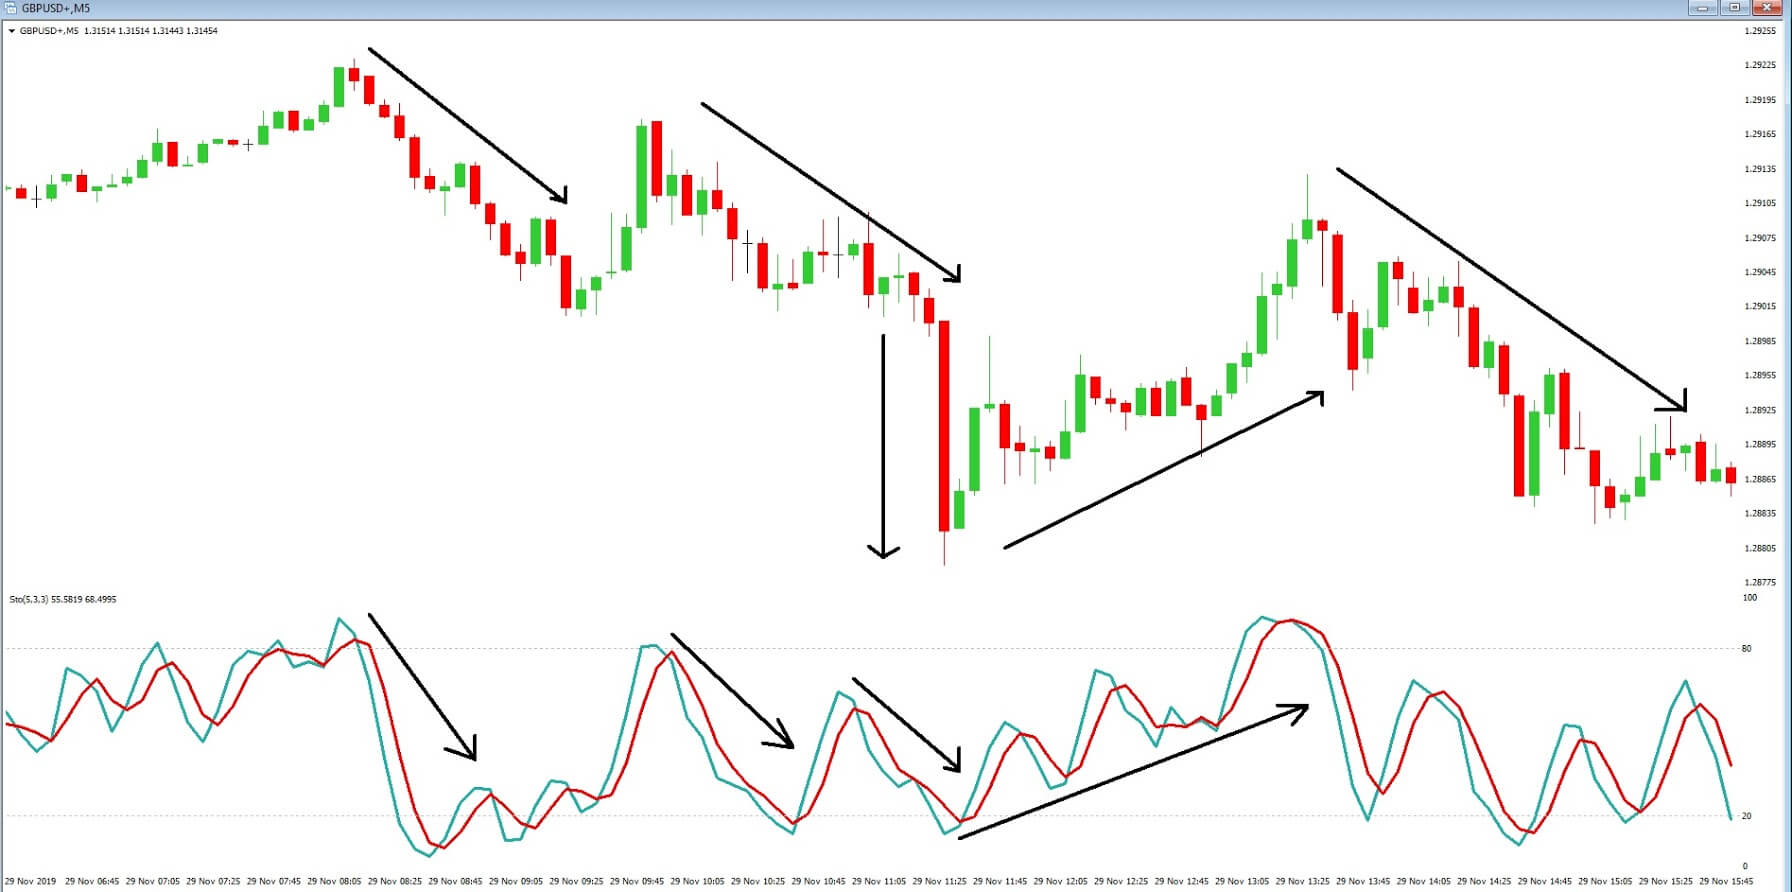
Example ‘B,’ on the same pair and time frame, is of another lagging indicator, the Stochastic oscillator, which plots historical price action data and tells a trader when a pair is entering into overbought territory such as above the 80-line and when a pair maybe oversold such as below the 20-line. Again, traders use the data to help predict future reversals in price.
Example C
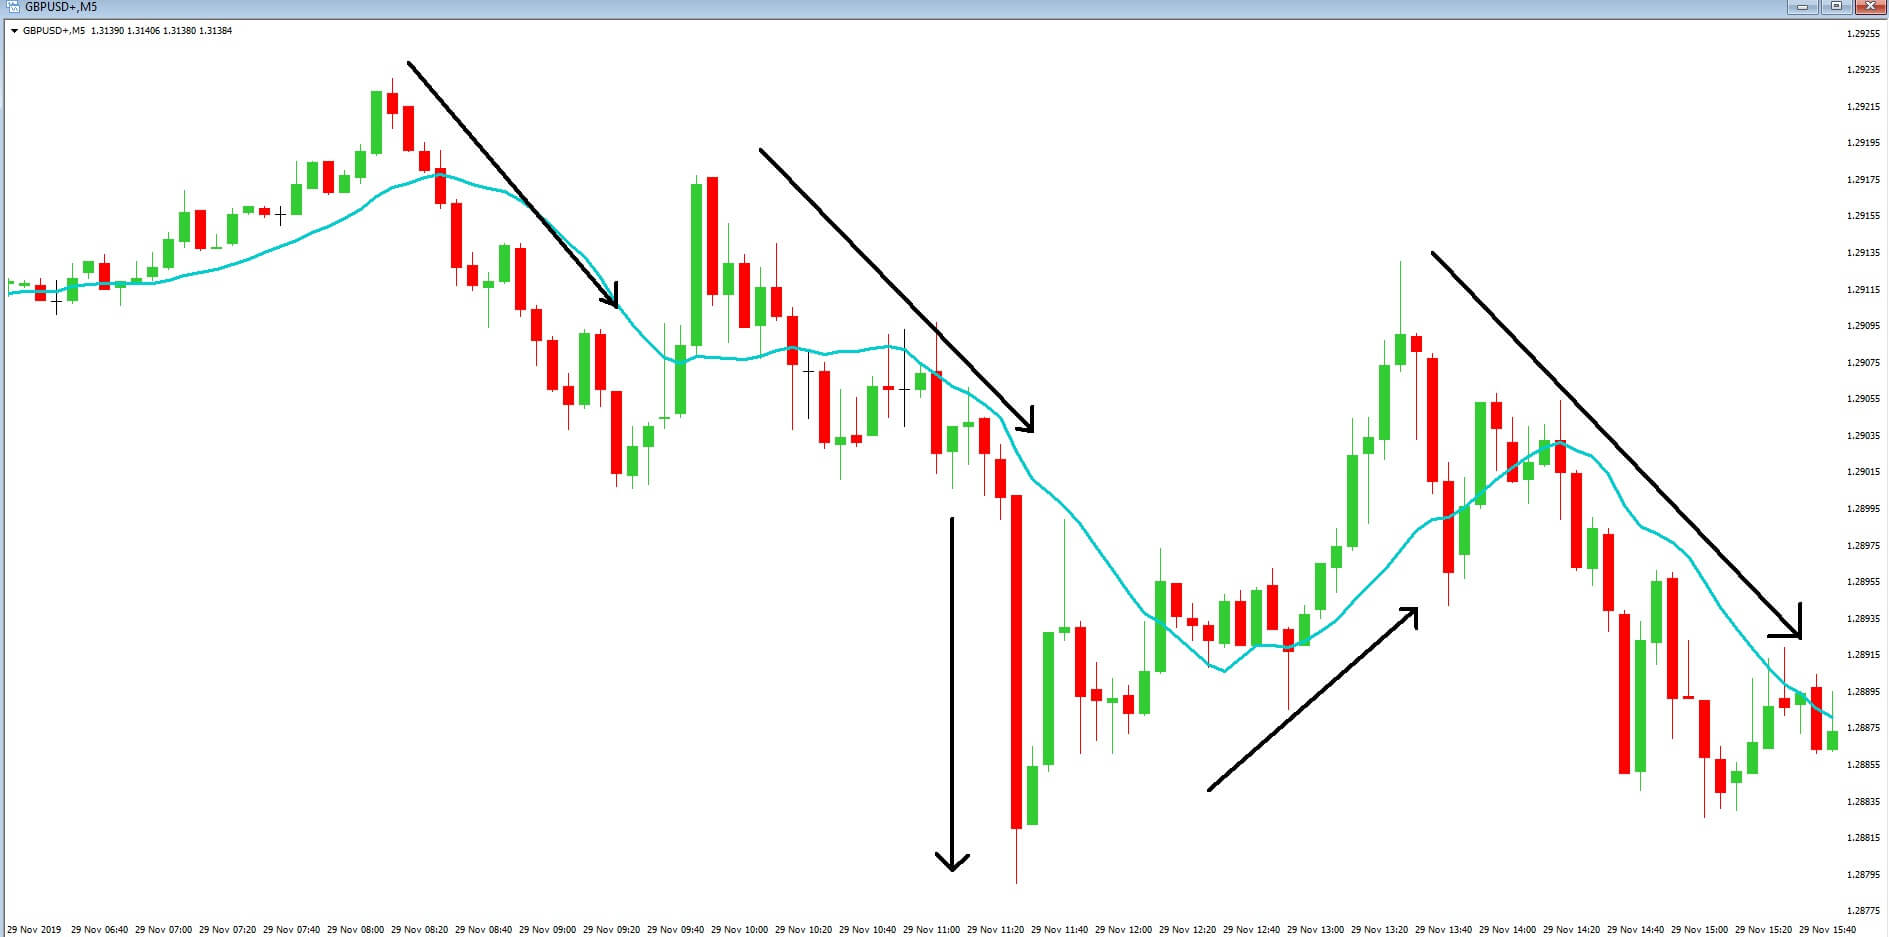
Example C, again on the same GBPUSD, a chart, is a simple moving average lagging indicator, which plots the average move of the previous price action, where, in this case, a continuous line is formed onto the chart of the average of the previous 14 candlesticks. As we can see, when price action falls underneath the moving average, it tends to trend lower, and it is also easy to identify on this chart that when price action moves above the moving average, a tren higher follows.
Example D
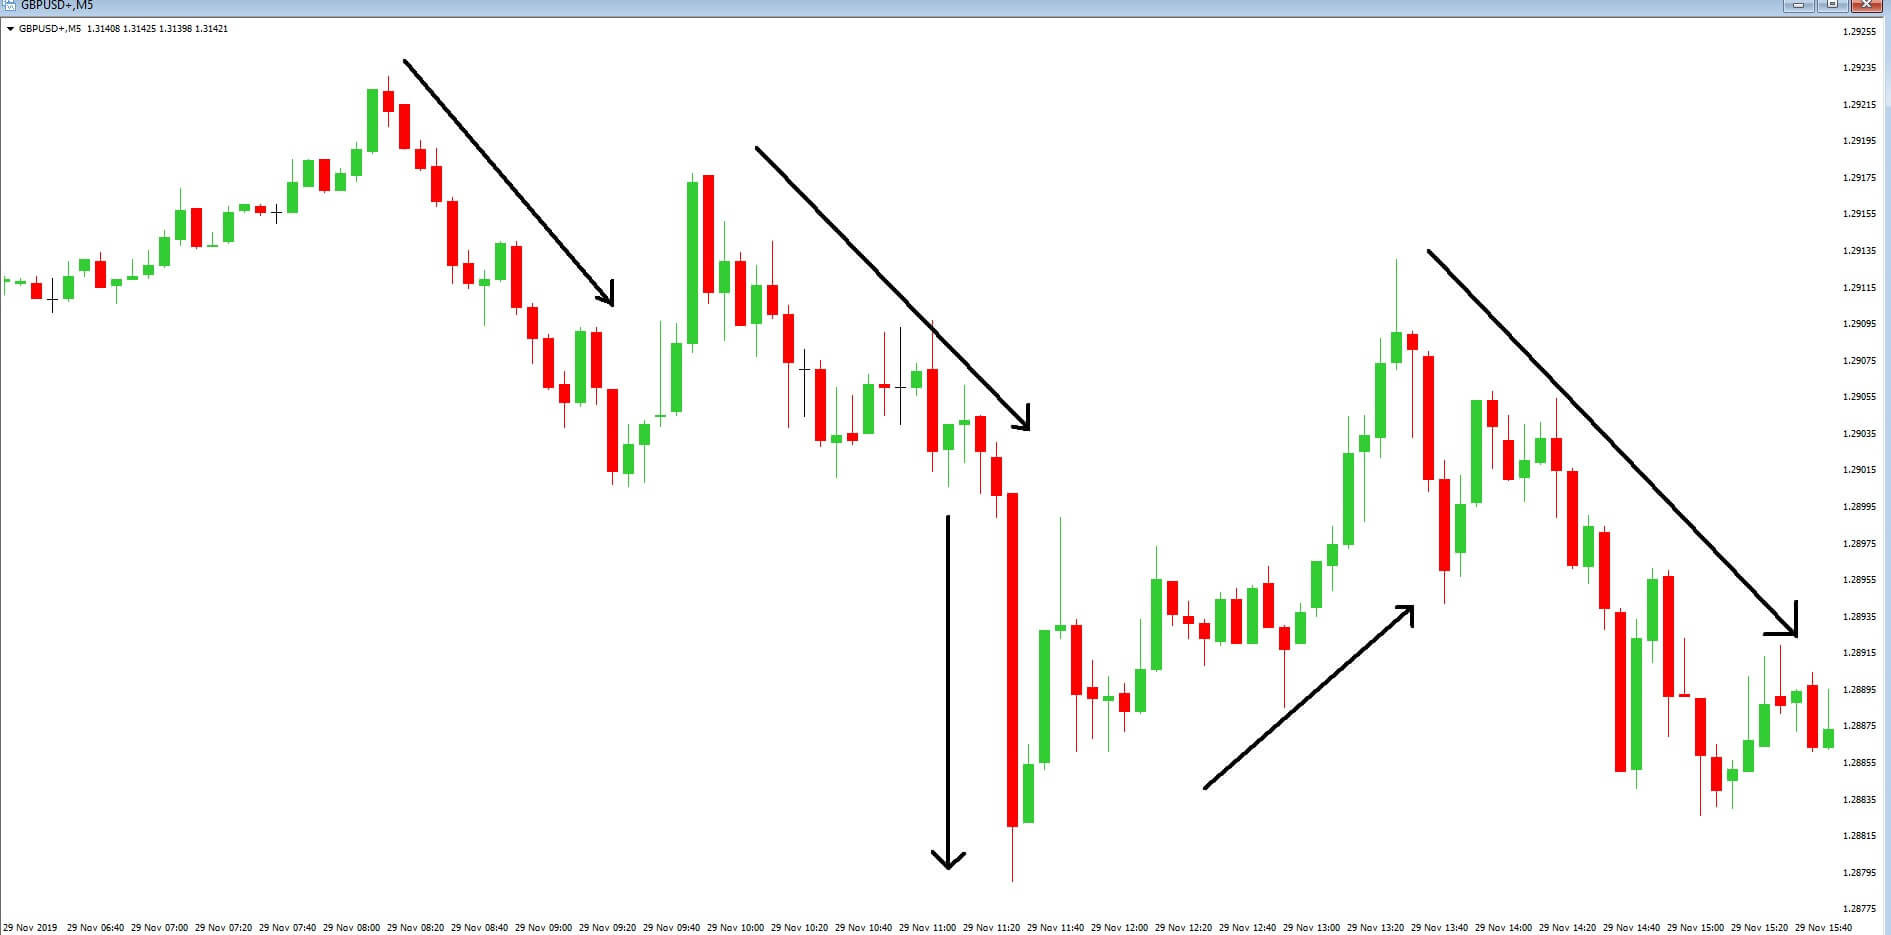
Example D is price action itself on the same chart as defined by our Japanese candlesticks, and where the price action itself is a leading indicator. Leading indicators are the most widely used by professional traders to help anticipate future price movements and help to define entry and exit points with much greater accuracy the lagging indicators. When traders use price action in the form of candlesticks, they study the size shape and patterns of the candlesticks to predict future movements.
Example E
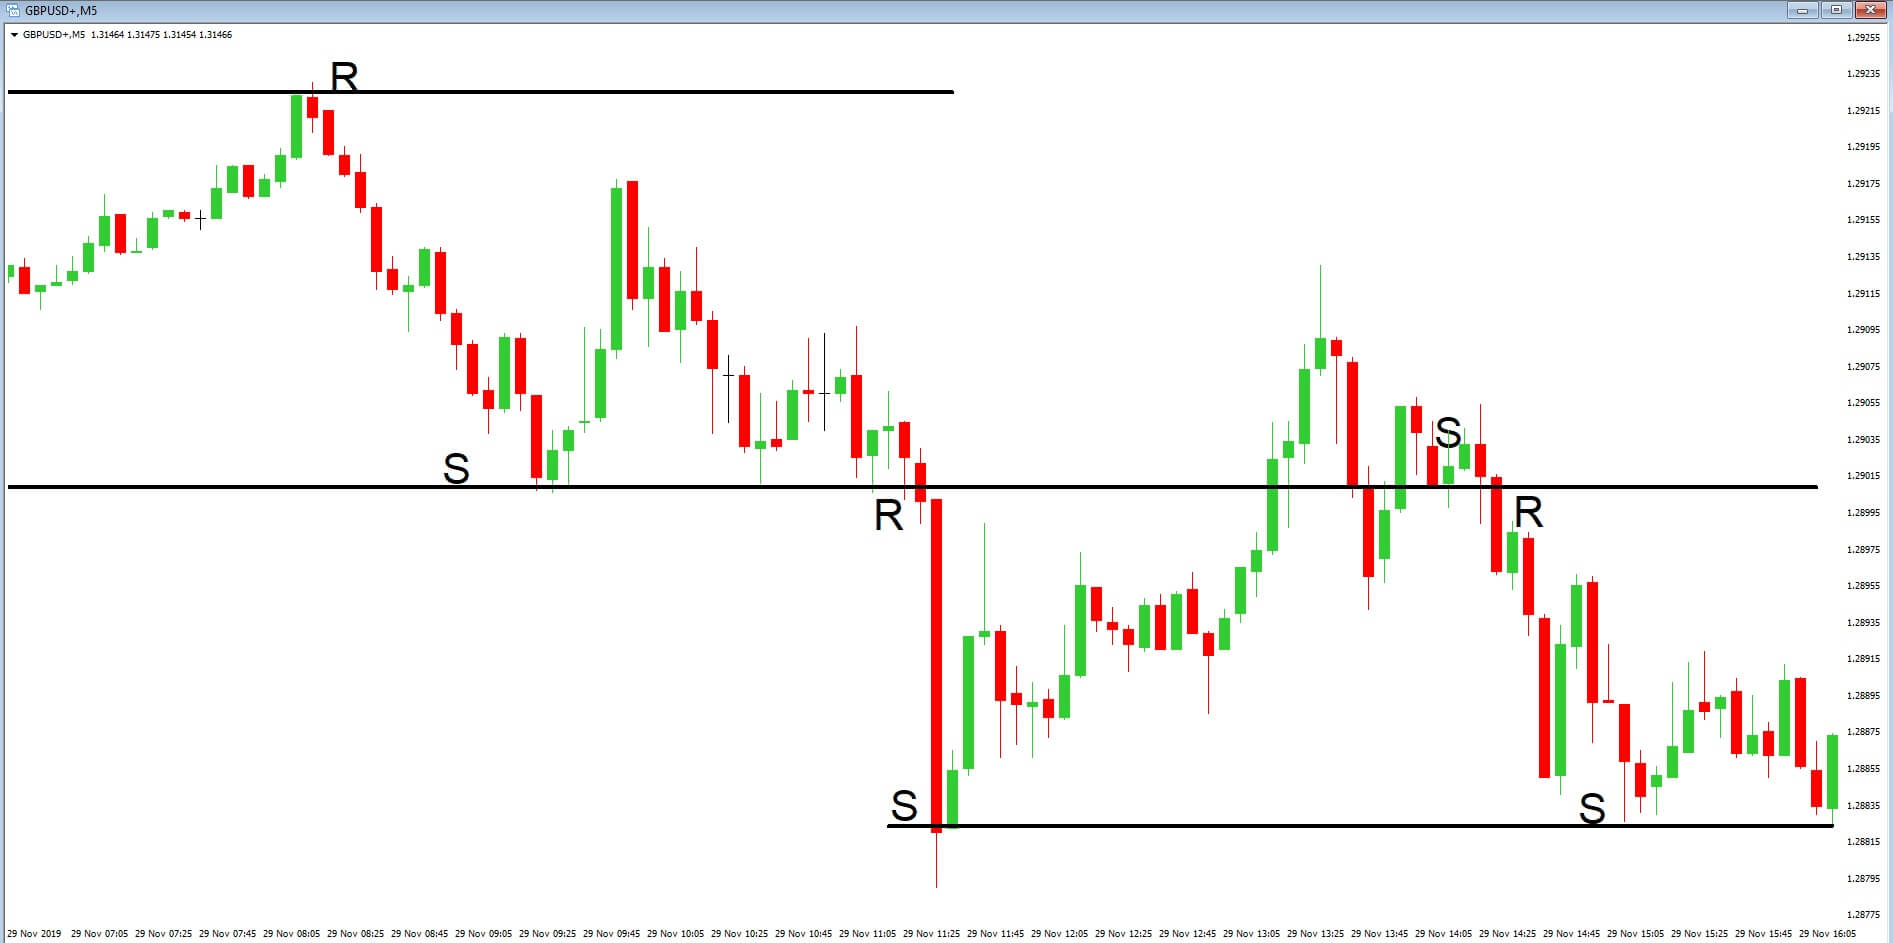
Example E, on the same chart, is another leading indicator. These are support and resistance lines, Which Traders will draw onto the grass themselves at ware price action tends to find support which it is likely to move up from and resistance where the price is likely to fall from, in order to decipher future price action. As you will see from our screen-shot, these lines will often alternate between being levels of support and levels of resistance due to price action retracement.
Example F
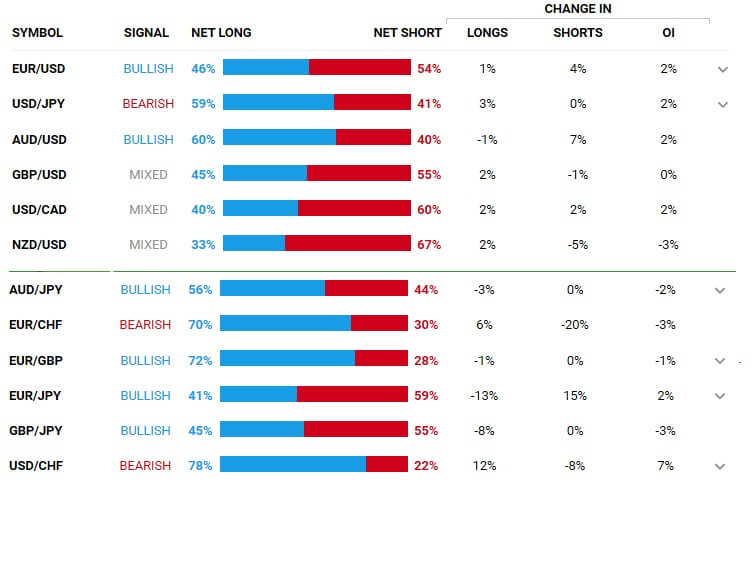
Example F is another leading indicator. This is a screenshot from a forex broker’s clients’ positions table, which shows the net positions of how their traders are positioned on various currency pairs. Many brokers now offer this superb facility which will give traders added comfort when it comes to taking on trades, or act as a warning if the majority of traders on the position table are trading in the opposite direction.
https://youtu.be/ZFdJd04OLOc

https://youtu.be/ZFdJd04OLOc
If anyone is serious about cryptocurrency mining, they’ll have to learn how to maximize their equipment and their invested resources. Not knowing which equipment is profitable and how to optimize its use may end up with you having a negative balance. On top of that, not knowing the mining profitability of your rig might make you spend a lot more money without a cause or overestimate your earnings. This guide will try to show how to calculate the profitability of your mining setup as well as which tools to use to increase your profits.

Many factors influence the outcome of a person’s mining profitability. The most significant factor are undoubtedly the cryptocurrency’s price, mining algorithm, the hardware that a person utilizes to mine crypto as well as the total hash rate of the network.
Mining cryptocurrencies involves solving complex mathematical algorithms by utilizing computational power. There are many consensus algorithms out there, but we will list the most popular ones.
The SHA-256 algorithm uses brute computational power to process the cryptographic equations. Bitcoin was easily mined with the CPUs and GPU cards that are used in regular PCs before it was popular. However, as the years progressed, and the market matured, mining hardware ended up evolving to keep up with the increasing mining difficulty. At the moment, Bitcoin is mined purely by using ASIC miners.
The scrypt consensus algorithm uses a substantial amount of RAM as well as parallel processing to generate cryptocurrencies. This means that you can use GPUs to mine them instead of CPU, which is required for the SHA-256. Scrypt-based ASICs are quite unpopular at the moment, which brings the mining difficulty at a lower level than what it currently is with Bitcoin.
Many websites can be used to calculate the mining profitability for a specific coin. They take into account the mining equipment you use, power consumption, electricity cost as well as and other details. More straightforward calculators with fewer factors are available for free, but so are much more advanced ones, with features such as:
Hash rate,
Power consumption,
Power cost,
Mining difficulty,
Block reward,
Cryptocurrency price in USD.
Mining profitability can be calculated for various time-frames: hourly, daily, monthly as well as yearly.
Mining is a great way to earn cryptocurrencies passively. On the other hand, you need to take various factors that can affect mining profitability into consideration. Having an accurate prediction about all of the factors can be quite tricky, especially when some factors are out of your control. Be careful and do all of the calculations before investing in cryptocurrency mining gear.
https://youtu.be/okv2-YqHMUk

https://youtu.be/okv2-YqHMUk
Last time we talked about what volatility is and how it is maturing in the crypto markets. We also talked about bad press and fraudulent activity that envelops the industry. Now, we will continue talking about what affects volatility and go more in-depth.
The cryptocurrency market has received a great deal of attention from both profit-seeking traders and technology supporters. However, the market as a whole is still quite young and not as big as it can be. If we take a further look at its size, it cannot even be compared to traditional markets. It is a fact that the market size does affect volatility significantly.
Small markets allow smaller investors to influence the price both ways in a greater way. Broader markets, on the other hand, handle bigger market orders with ease and without much of a price impact. However, the overall size of the crypto market on top of overleveraging greatly affected its volatility.

Liquidity is directly tied to the market size as well as market order size. Liquidity can be defined as the ease or difficulty of buying or selling an asset on a specific market at a certain price. Liquidity is often directly tied to the market volume, as more market makers provide bigger liquidity. If more people traded cryptocurrencies, cryptocurrencies would be more stable price-wise. However, the crypto market in its current state is not as liquid as it should be to support large market orders or possible market manipulations that occur. If we take a look at the altcoins market individually, we can come to the conclusion that they are tiny when compared to the Bitcoin’s market, let alone the individual fiat currency markets. Low liquidity markets often suffer from sudden and aggressive fluctuations in prices.
As the crypto market is still immature, and investors have no real price to anchor to, the market is mostly driven by speculation. Typically, we can determine the value of an asset by its utility and adoption (and various other factors), but crypto markets are currently not operating that way. Speculation is the main thing that extends the trend up or down. Therefore, the only way to invest in any cryptocurrency is to speculatively bet on its future use cases, adoption, and traction.
Markets guided by speculation are, in every single case, recorded so far, volatile by nature.
A survey done by Fidelity Investments shows that 22% of surveyed institutional investors already purchased cryptocurrency in some quantity. If this survey can be translated to the institutional interest as a whole, crypto markets can be proud to show a remarkable increase from near-zero institutional investment in 2016 to the current numbers. However, the funds invested by the institutional investors are negligible compared to how much they invest in traditional markets.
Even though institutions are increasingly more interested in crypto, lack of proper guidelines, and transaction mediums such as ETF’s made it harder for them to get ahold of a large amount of cryptocurrencies. As time passes, institutions will undoubtedly dip their toes in cryptocurrency markets on a larger scale.
As the market lacks institutional investors, price stability is lacking, as well. Institutions are often using trading algorithms to perform trades for them, which in turn increase the liquidity as well as the stability of the markets.

Many little things influence the crypto market volatility. No one can calculate the impact of any single factor. However, we often see some misconceptions when talking about which factors do have an effect on the market. Some factors are portrayed as much more significant just because they are eye-catching.
One such factor is the lack of regulation and how it affects the volatility of the markets.
The crypto market is not regulated by any government or institution. However, this lack of regulation does not affect the volatility of the market itself. People often connect high volatility with the lack of regulation, which is not correct. Cryptocurrency markets are self-regulated by the consensus. They require no government regulation to operate efficiently. However, they could use the government’s approval, which will probably never happen as crypto can be considered a direct competitor to fiat currencies.
Is market volatility even that good?
After understanding which factors affect the volatility of the cryptocurrency markets, people are mostly unsure whether increased volatility is a good thing after all. Volatility represents different things to different kinds of investors. We can look at it from two major standpoints:
The trader’s perspective.
The investor’s perspective.
The trader’s standpoint says that the volatility is quite good as long as the markets are liquid enough. The level of volatility considered useful varies depending on the person’s risk tolerance. A risk-averse individual would avoid high-volatility trades as they value stable investments more. However, cryptocurrency traders are considered to be risk-takers in most cases.
An investor, however, might consider volatility as a bad thing when it reaches a certain threshold, which is extremely low when compared to one of the retail traders. An investor wants to preserve their wealth rather than turning a quick profit. Also, investors are mostly here in the long run because they support the underlying technology.
Cryptocurrencies are a fairly young asset class, and its concepts are already revolutionizing the world we are living in. However, until full adoption happens, the cryptocurrency markets remain volatile.
Bitcoin inspires all sorts of motivations – from noble ones to less noble ones. It’s an asset class that’s targeted by scammers at an incredibly high rate. Each year, individuals and crypto exchanges lose millions of dollars to such theft.

Bitcoin inspires all sorts of motivations – from noble ones to less noble ones. It’s an asset class that’s targeted by scammers at an incredibly high rate. Each year, individuals and crypto exchanges lose millions of dollars to such theft.
Bitcoin inspires all sorts of motivations – from noble ones to less noble ones. It’s an asset class that’s targeted by scammers at an incredibly high rate. Each year, individuals and crypto exchanges lose millions of dollars to such theft.
But that doesn’t mean Bitcoin or other cryptocurrencies are a security nightmare. It all really depends on how careful you are – and the measures you take to secure your Bitcoin assets. Let’s look at some easy steps you can take to protect your holdings.
The keywords here are ‘long’ and ‘complicated.’ Even if your password is complicated enough, it’s still an easier hack than a long and complex one. For instance, a hacker would more quickly guess “pas$w0rd” than they would “Hell0Thi$isMyPas$Word”. Also, a single uppercase letter is not enough to cushion you against hacking. At the very least, make sure your wallet and account passwords meet these criteria:
Now, the longer and stronger password is, the harder it is to remember. There are a few resources you can use to prevent this from happening, including a password management software or secure offline storage, like an encrypted USB drive. Also, remember never to use the same password for more than one account. A single security breach could result in a hacker getting access to all your funds.
With a 2FA, you’re required to use two authentication factors to verify your identity. One identifier is your password, and the other could be a phone call, a biometric factor, etc. That said, you need to watch out for 2FA’s that are still vulnerable – e.g., phone calls or text messages. Hackers have devised a new trick of calling up phone companies and successfully impersonating customers, which makes a phone call or text message 2FA insecure. Instead, you could enable a 2FA via:
An authenticator app, like Google authenticator –which automatically generates 2FA codes for your account every 30 seconds, and is entirely free,
or:
A universal second factor (U2F), which is like an encrypted USB that you can insert into your device as a form of 2FA. Some trusted U2F’s include FIDO and YubiKey.
Whitelisting is a security feature that allows you to create a list of trusted IP addresses that can interact with your funds. Ensure your crypto exchange has these security settings:
It’s worth noting that not all exchanges have enabled whitelisting options, so make sure to ascertain that before you sign up for any wallet.
Public WiFi connections in restaurants, hotels, airports, etc. are an easy target for hackers.
If you must access your crypto account on a public network, it’s highly advisable to use a reputable Virtual Private Network (VPN) such as ExpressVPN, NordVPN, Tunnel Bear, or VyprVPN. This precaution will prevent your account login information, i.e., passwords, private key, and recovery phrases from being intercepted. A VPN is an extra layer of encryption that will also conceal your identity, location, and IP address.
If you’re a regular trader, separate your trading funds from the rest of your funds. Keep the rest of your funds in a cold storage, e.g., a hardware wallet or a paper wallet.
This precaution is essential because storing all your funds on your exchange renders them vulnerable to hacking, phishing attacks, etc. There are many stories of hackers successfully getting away with lump sums of crypto from crypto exchanges – so be careful.
Backing up your back-up means having a second line of defense in case you forget your account or wallet details.
You can do this by first encrypting a flash drive and then adding a text file of information on all your passwords, private keys, and seed phrases. To encrypt a flash drive, simply right click on the drive in your “My Computer” window and select “encrypt,” follow the instructions, and set up a password.
The second step is storing the flash drives in separate and safe places, like a safe deposit box. For an added layer of security, you could even split your private key into two flash drives, i.e., one half in one drive and the other in a second drive. That way, even if someone manages to get hold of one flash drive, they can’t access your crypto. Make sure you don’t forget the passwords, however.
Treat your crypto holdings like any other asset – you need to ensure they go to your beneficiaries when you’re gone. But, leaving a will for your crypto assets for your loved ones requires a bit more planning than that for traditional assets. So how do you go about it? While you will eventually have to talk to an estate planning lawyer, you can get started with the following steps:
Some people may find it challenging to understand how to handle cryptocurrency. To make it easier for your inheritor(s), try writing down the instructions in a manner that a crypto novice would understand. Let details include how to access your wallet, exchanging of cryptos to traditional currency, etc.
Finally, when it comes to cryptocurrency, discretion is key. You’re much safer that way. There are a lot of people who have been targeted in extortion to ransom attacks. Often, these people were known traders, investors, or just people who couldn’t keep quiet about their hoard.
One common ploy is for extortionists to offer to buy crypto at a price way higher than the market price, and suggest a face to face meeting. Once the person arrives, they ambush them and strong-arm them into transferring the funds without payment.
It’s better to remain tight-lipped about your crypto holdings. And just to be extra safe, consider splitting your cryptos into more than one wallet to mitigate the risks of any such occasion.
Just like you would take steps to protect your other valuables – you should (and even more so) take steps to protect your cryptocurrency. Securing your crypto shouldn’t be a daunting task. Follow this guide and get started on safer interaction with your cryptocurrency today. Also, remember to do more grounded research on best practices to secure your crypto – and you’ll be good to go.
https://youtu.be/R-5dYUd_5uE
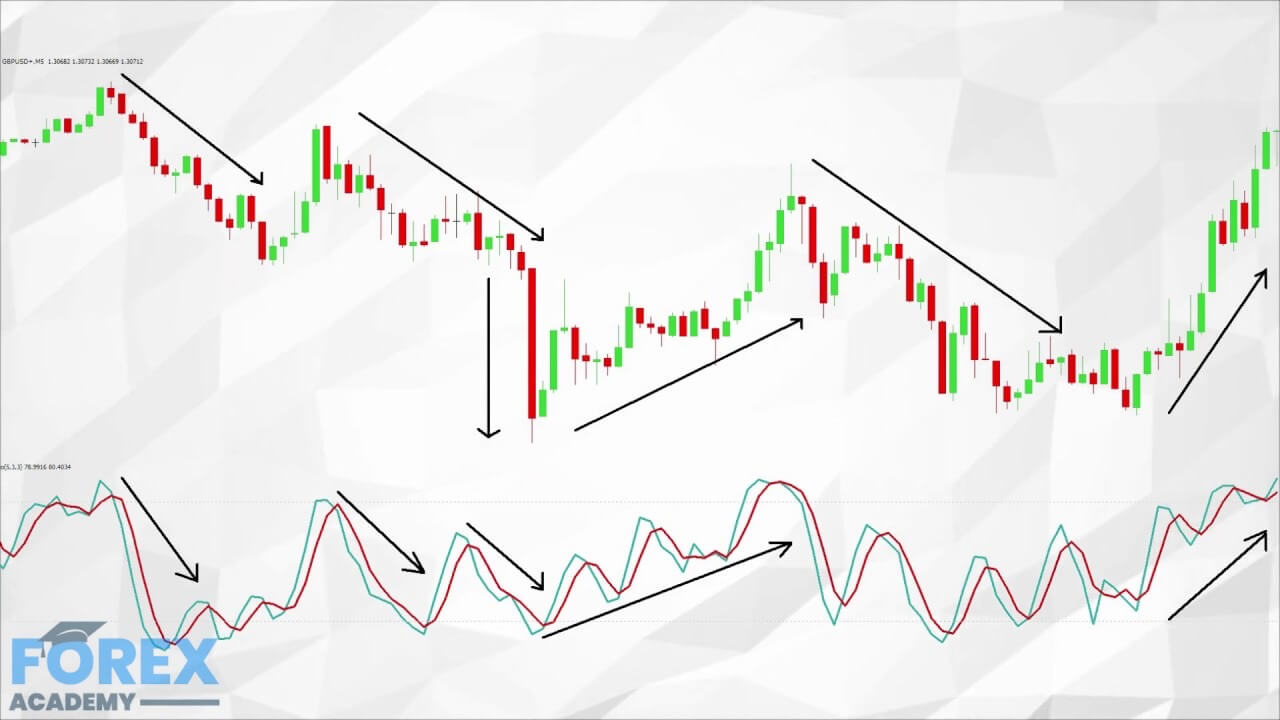
https://youtu.be/R-5dYUd_5uE
Thank you for joining us for session 3 of forex trading for absolute beginners. Forex Academy has all your forex trading educational needs from complete novice through to professional trader, and it’s all free to our followers!
In session 1 and 2 we mentioned that Forex trading is very similar to gambling when trading with no understanding of how the market works, and where the odds can be stacked in your favor and where Forex trading becomes a profession when novice traders take the time to learn the ropes before opening a live trading account and diving in.
We also mentioned that Forex is mostly traded by using Technical Analysis, where traders use tools they drag onto their screen charts in order to visually see when markets are going up or down, and trade accordingly.
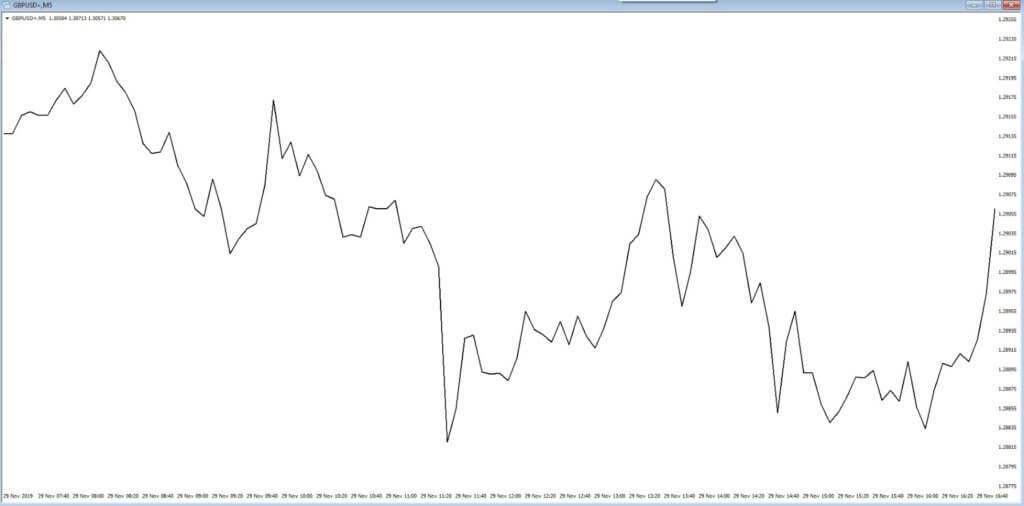
In Example A, we can see a line graph chart of the exchange rate of the British pound, with the black line showing the price moving up and down against the US dollar, AKA GBP:USD. On the face of it, it looks extremely erratic.
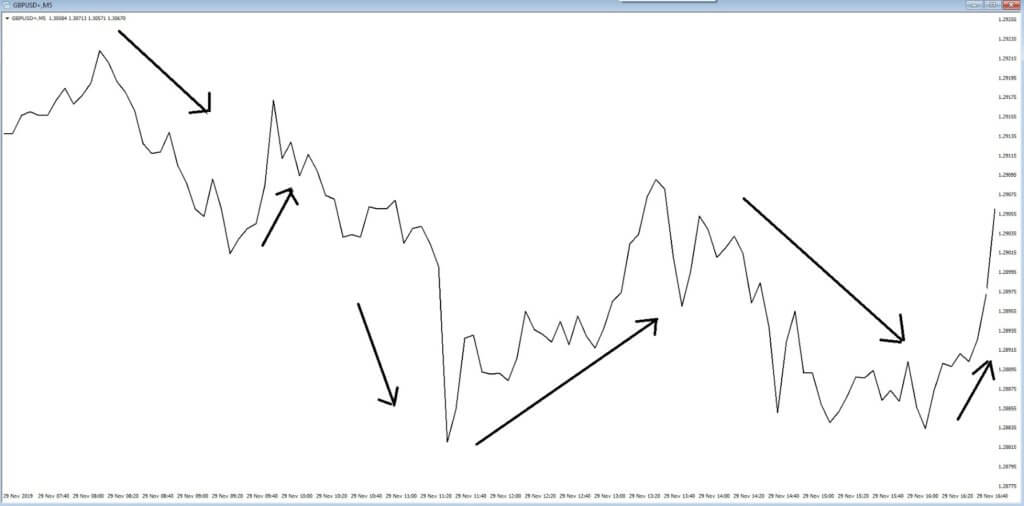
Let’s take a closer look in example B, where we have drawn some arrows showing the pair moving up and down, but it would be almost impossible to know when to trade.
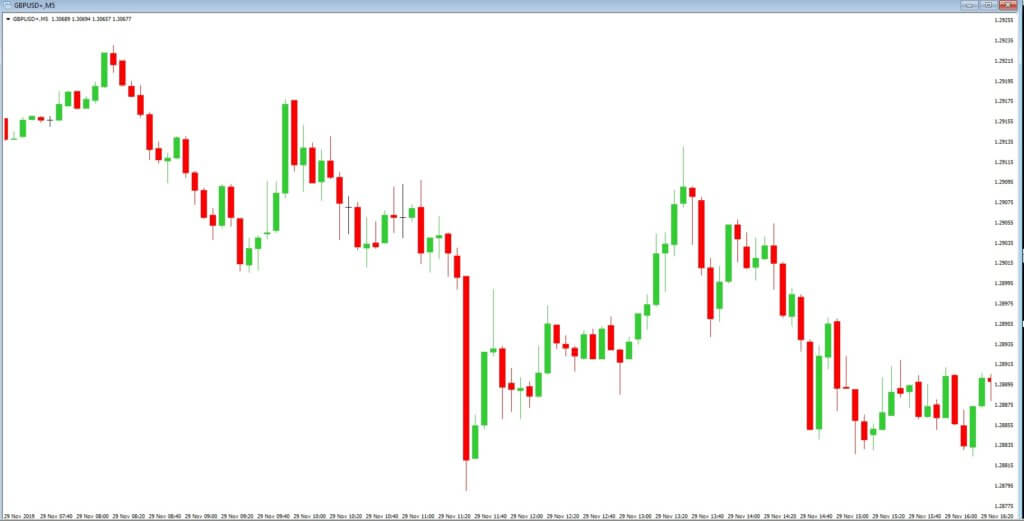
But in example C, where we have changed the line graph for coloured bars, which are known as candlesticks, we can clearly see that the red candles help us to see when the price is moving down, and the green ones help us to identify with the price is moving up, such as in example D.
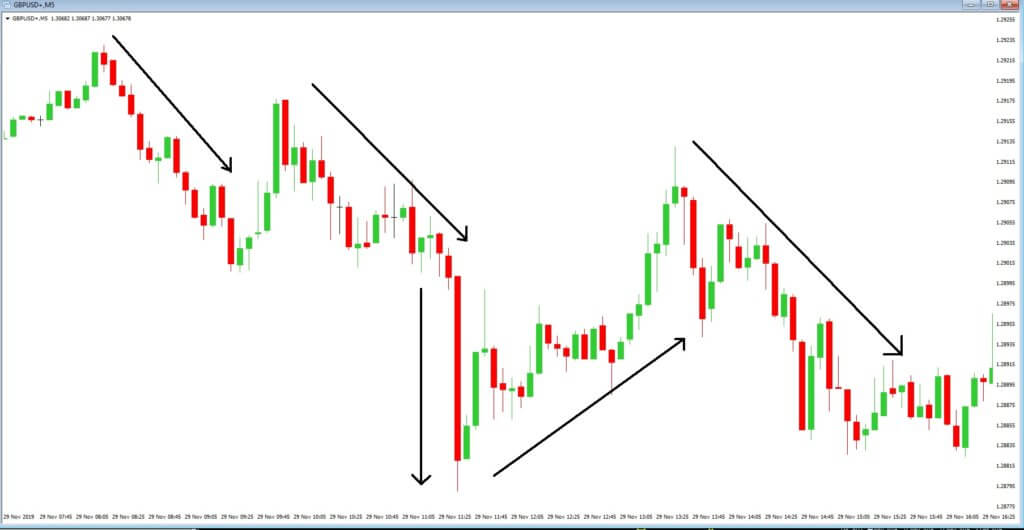
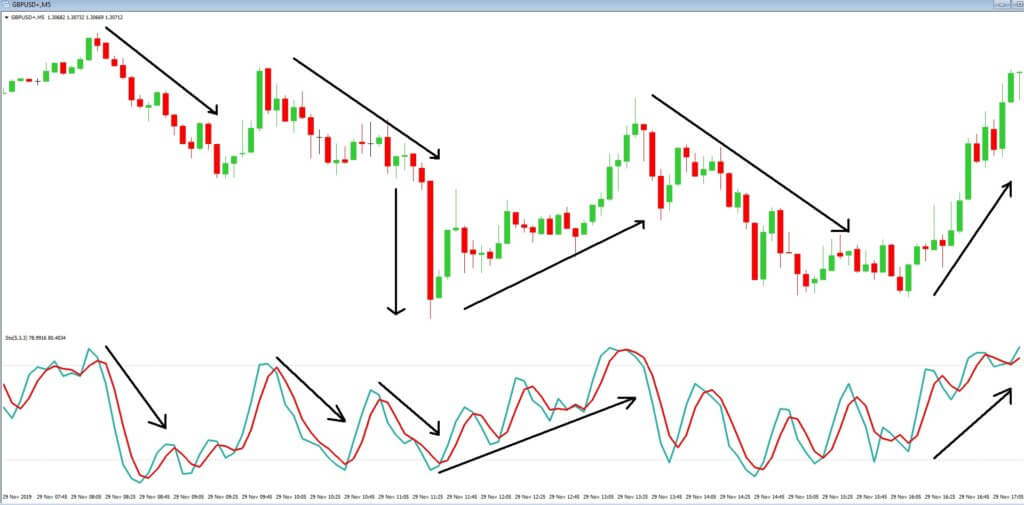
In example, E, we have added our first technical analysis indicator, which is called a stochastic oscillator. This tool tells traders when a pair may have gone too high or too low, which are also known as periods of overbought and oversold. It is clear to see that when the redline of the stochastic has moved to a high point and then crossed over the green, and they are both moving down, that the price of the pair moves lower, and when the green has crossed over the red after they have moved to a low, then the currency pair moves higher.
Here are just two simple tools that traders use to stack the odds in their favour.
But none of this would be any use at all without another aspect of trading, which we will discuss in session 4.
https://youtu.be/CaiQFg_5BIo

https://youtu.be/CaiQFg_5BIo
The cryptocurrency market as a whole is known for being volatile from its very conception. The past couple of years have undoubtedly been a rough ride for millions of investors, but things are starting to look better. While some people managed to make their fortune investing in cryptocurrencies, many had lost large sums in the bubble that burst at the beginning of 2018, which is when the bear market started.
However, Bitcoin, as well as other cryptocurrencies, are not made to be volatile, but for the reason of fulfilling their purpose. Certain cryptocurrencies were created to provide specific utility to its users, while others are designed to be digital money and to compete with fiat currencies directly. To understand why cryptocurrencies are volatile, we first have to understand the factors surrounding the industry.

Traditional finance defines volatility as the fluctuation of an asset’s price in a particular time period. An asset is volatile if its price is rising or falling constantly and aggressively. The cryptocurrency market is a definition of a really volatile market, as the extreme fluctuations add and remove billions of dollars worth of market capitalization to and from the market every single day.
Bitcoin and the cryptocurrency market, in general, is a relatively new concept when compared to other well-established traditional asset classes. A cryptocurrency must have a large user base to fulfill its role. The larger the user base of an asset, the less volatile and safer it will be. People have to learn how cryptocurrencies work and how using them will change the world. Only after fully grasping the concept of cryptocurrencies they become less volatile. As more people start using cryptocurrencies, prices will even out, and volatility will decrease to a point where the fluctuations will be so small that they will not matter.
One thing to note is that an average cryptocurrency investor is not a financial expert by any means. This makes concepts such as “FOMO” and “FUD” an even more significant factor than they are in the traditional markets.
Speaking about adoption brings us to the maturity of the cryptocurrency market. A young market backed by a brand new technology will, by nature, be more volatile than the already well-established traditional markets. Cryptocurrencies are going through an “infancy” period that is very similar to the one that the internet-based companies had to go through in the 1990s. New technologies require time to get perfected. They also have a high probability of failing.

News reports, whether positive or negative, can easily affect the crypto volatility. With an average investor being relatively uneducated of how the markets work, each wrong portrayal of cryptocurrencies can spark a new wave of “FUD.”
News reports such as ones about hacking incidents, certain countries declaring stances on crypto as well as people with questionable past being tied to the industry instill a negative reputation of cryptocurrency markets in the minds of people. At the moment, cryptocurrencies are incredibly vulnerable to all the bad press and news, while they rarely react to the good news. News portals are often catering to the short attention spans of their millennial readers by writing outrageous (and often fake) biased texts.
Cryptocurrencies have been a place where fraudulent activities occur more often than with other markets without any doubt. The crypto market has mostly seen two types of such activities:
Ponzi schemes are a not-so-rare occurrence in markets governed by greed, and the crypto market is no different. Whenever people that lack knowledge of the markets try to get rich quickly, Ponzi schemes appear.
Ponzi schemes are a form of fraud where the company promises quick and substantial returns to the first investors by paying them the money from investors that come to the project later. The most famous Ponzi scheme in the crypto market is the notorious Bitconnect. Their “high-yield investment program” promised high returns to all of their investors. They used their native BCC token to pay out their old investors. Seeing high yield and great payouts automatically attracted the new investors. Bitconnect was undoubtedly not the only Ponzi scheme organization in the market. Many have successfully attempted to defraud people of their cryptocurrency holdings by creating “high-yield investment programs.”
Markets gain in volatility when an aggressive event strikes the space, and cryptocurrencies are no different. There have several occasions where security breaches, as well as hacks, caused extreme volatility spikes. None of these hacks happened to the cryptocurrencies specifically, but rather to the exchanges that stored them. One good example of increased volatility is the infamous Mt. Gox hack. This hack caused the biggest cryptocurrency exchange at that time to close their doors made 850,000 Bitcoin “vanish.” Later on, 200,000 Bitcoin were somehow found and retrieved, and are now handled by a trustee who sells them as he pleases. This trustee was one of the main reasons for increased volatility as he reportedly sold Bitcoin on the open market rather than over-the-counter as should be done with such quantities of cryptocurrencies.
https://youtu.be/pgaFpXu0nFU

https://youtu.be/pgaFpXu0nFU
Many people see the amazing returns cryptocurrencies can bring and decide to invest their life savings or take out a loan. DO NOT do this. The volatility of the cryptocurrency market can slaughter you your investments, meaning that your life savings or loan would be gone. You can lose all your money by investing more than you are willing to spend on things you don’t understand properly. No one should fall into the trap, thinking this is a “get rich quick scheme,” as it is exactly the opposite of that.
It took years for early Bitcoin investors to gain big returns, increasing from a few pennies to where it is now. With how young this technology is, people should invest only when they see the true potential of crypto in the long-term.
Cryptocurrency hype factor
Cryptocurrencies bring a lot of hype with them. The simple explanation of why would be because most people do not know what they’re investing in and would rather listen to the crowd.
As the crowd is a quick decider on the cryptocurrency trend, prices either skyrocket or plummet. Taking out loans or investing life savings in such investments would be unreasonable. Even though the hype factor has diminished as the technology is maturing, there are still more than just traces of it on the market.
One should be informed and armed with knowledge before jumping on the hype-train. This would significantly reduce the investment risk. Most importantly, this way of thinking would position your investments to be aimed towards the long-term fundamentals of the technology. There are plenty of opportunities to make enormous profits in the cryptocurrency market. All the investors should have is patience as well as wisdom to acquire the right knowledge before investing. The worst thing that can happen is to be the person that invests based on the current hype without researching the project first. If the project seems too complex, then you should seek answers. The cryptocurrency community is filled with individuals that will be more than willing to simplify things and help you understand each and every concept that is important to certain projects.
Ponzi schemes and HYIP’s
One of the most important skills that you absolutely must possess is the ability to identify cryptocurrencies with solid fundamentals. There are thousands of cryptocurrencies available, which make people overlook the fundamentals, and make investment decisions based on the hype for some reason. There is, however, one thing that can be worse than investing in a project that is more hyped up than it should be, and that is scam projects. There are numerous of Ponzi schemes as well as HYIP’s (high yield investment program) on the current market, though the number of such projects greatly reduced in the past year.
To clarify, a high-yield investment program (or HYIP for short) is a type of Ponzi scheme where investors get promised an unsustainably high return on investment by paying previous investors with the money invested by new investors. Investing in such programs is extremely good until it is not. At some point, these projects simply vanish, keeping all your money as theirs. No matter how appealing the returns sound, no one should invest in such projects.

The most famous Ponzi scheme cryptocurrency market has seen was Bitconnect. This organization promised investors fixed daily returns in return for investing in their project by buying their cryptocurrency. After working for a couple of months and paying people from their new customers, Bitconnect started to generate extreme amounts of hype. People promoted it willingly and were able to make insane returns – on paper. Almost no one managed to pull their funds out of the company before it got shut down in January 2018.
Conclusion
Cryptocurrency investors should watch out as there are many dangers in this unregulated field. There is a potential to make great returns, but to also lose a lot of money. One should be careful and wise when it comes to investing in cryptocurrencies, both regarding the size of the investment and the projects they invest in. Don’t be led by hype and other people’s opinions, but rather form your own.