The Head And Shoulders Pattern
Of all the patterns that exist in any market, the most well known is the Head And Shoulder Pattern. Kirkpatrick and Dahlquist’s book, Technical Analysis, detailed many studies on the performance of this pattern. The result of all the data is that the Head And Shoulder Pattern is the most profitable of all standard patterns. Interestingly, Dalquist and Kirkpatrick made no distinction between the performance of the head and shoulder pattern and the inverse head and shoulder pattern (sometimes called the bottom forming head and shoulder pattern). While this pattern is successful across many markets, it is also the pattern that causes the most losses to new traders. We’ll get into the specifics of why this pattern destroys a good number of traders. First, we need to understand what the pattern is.

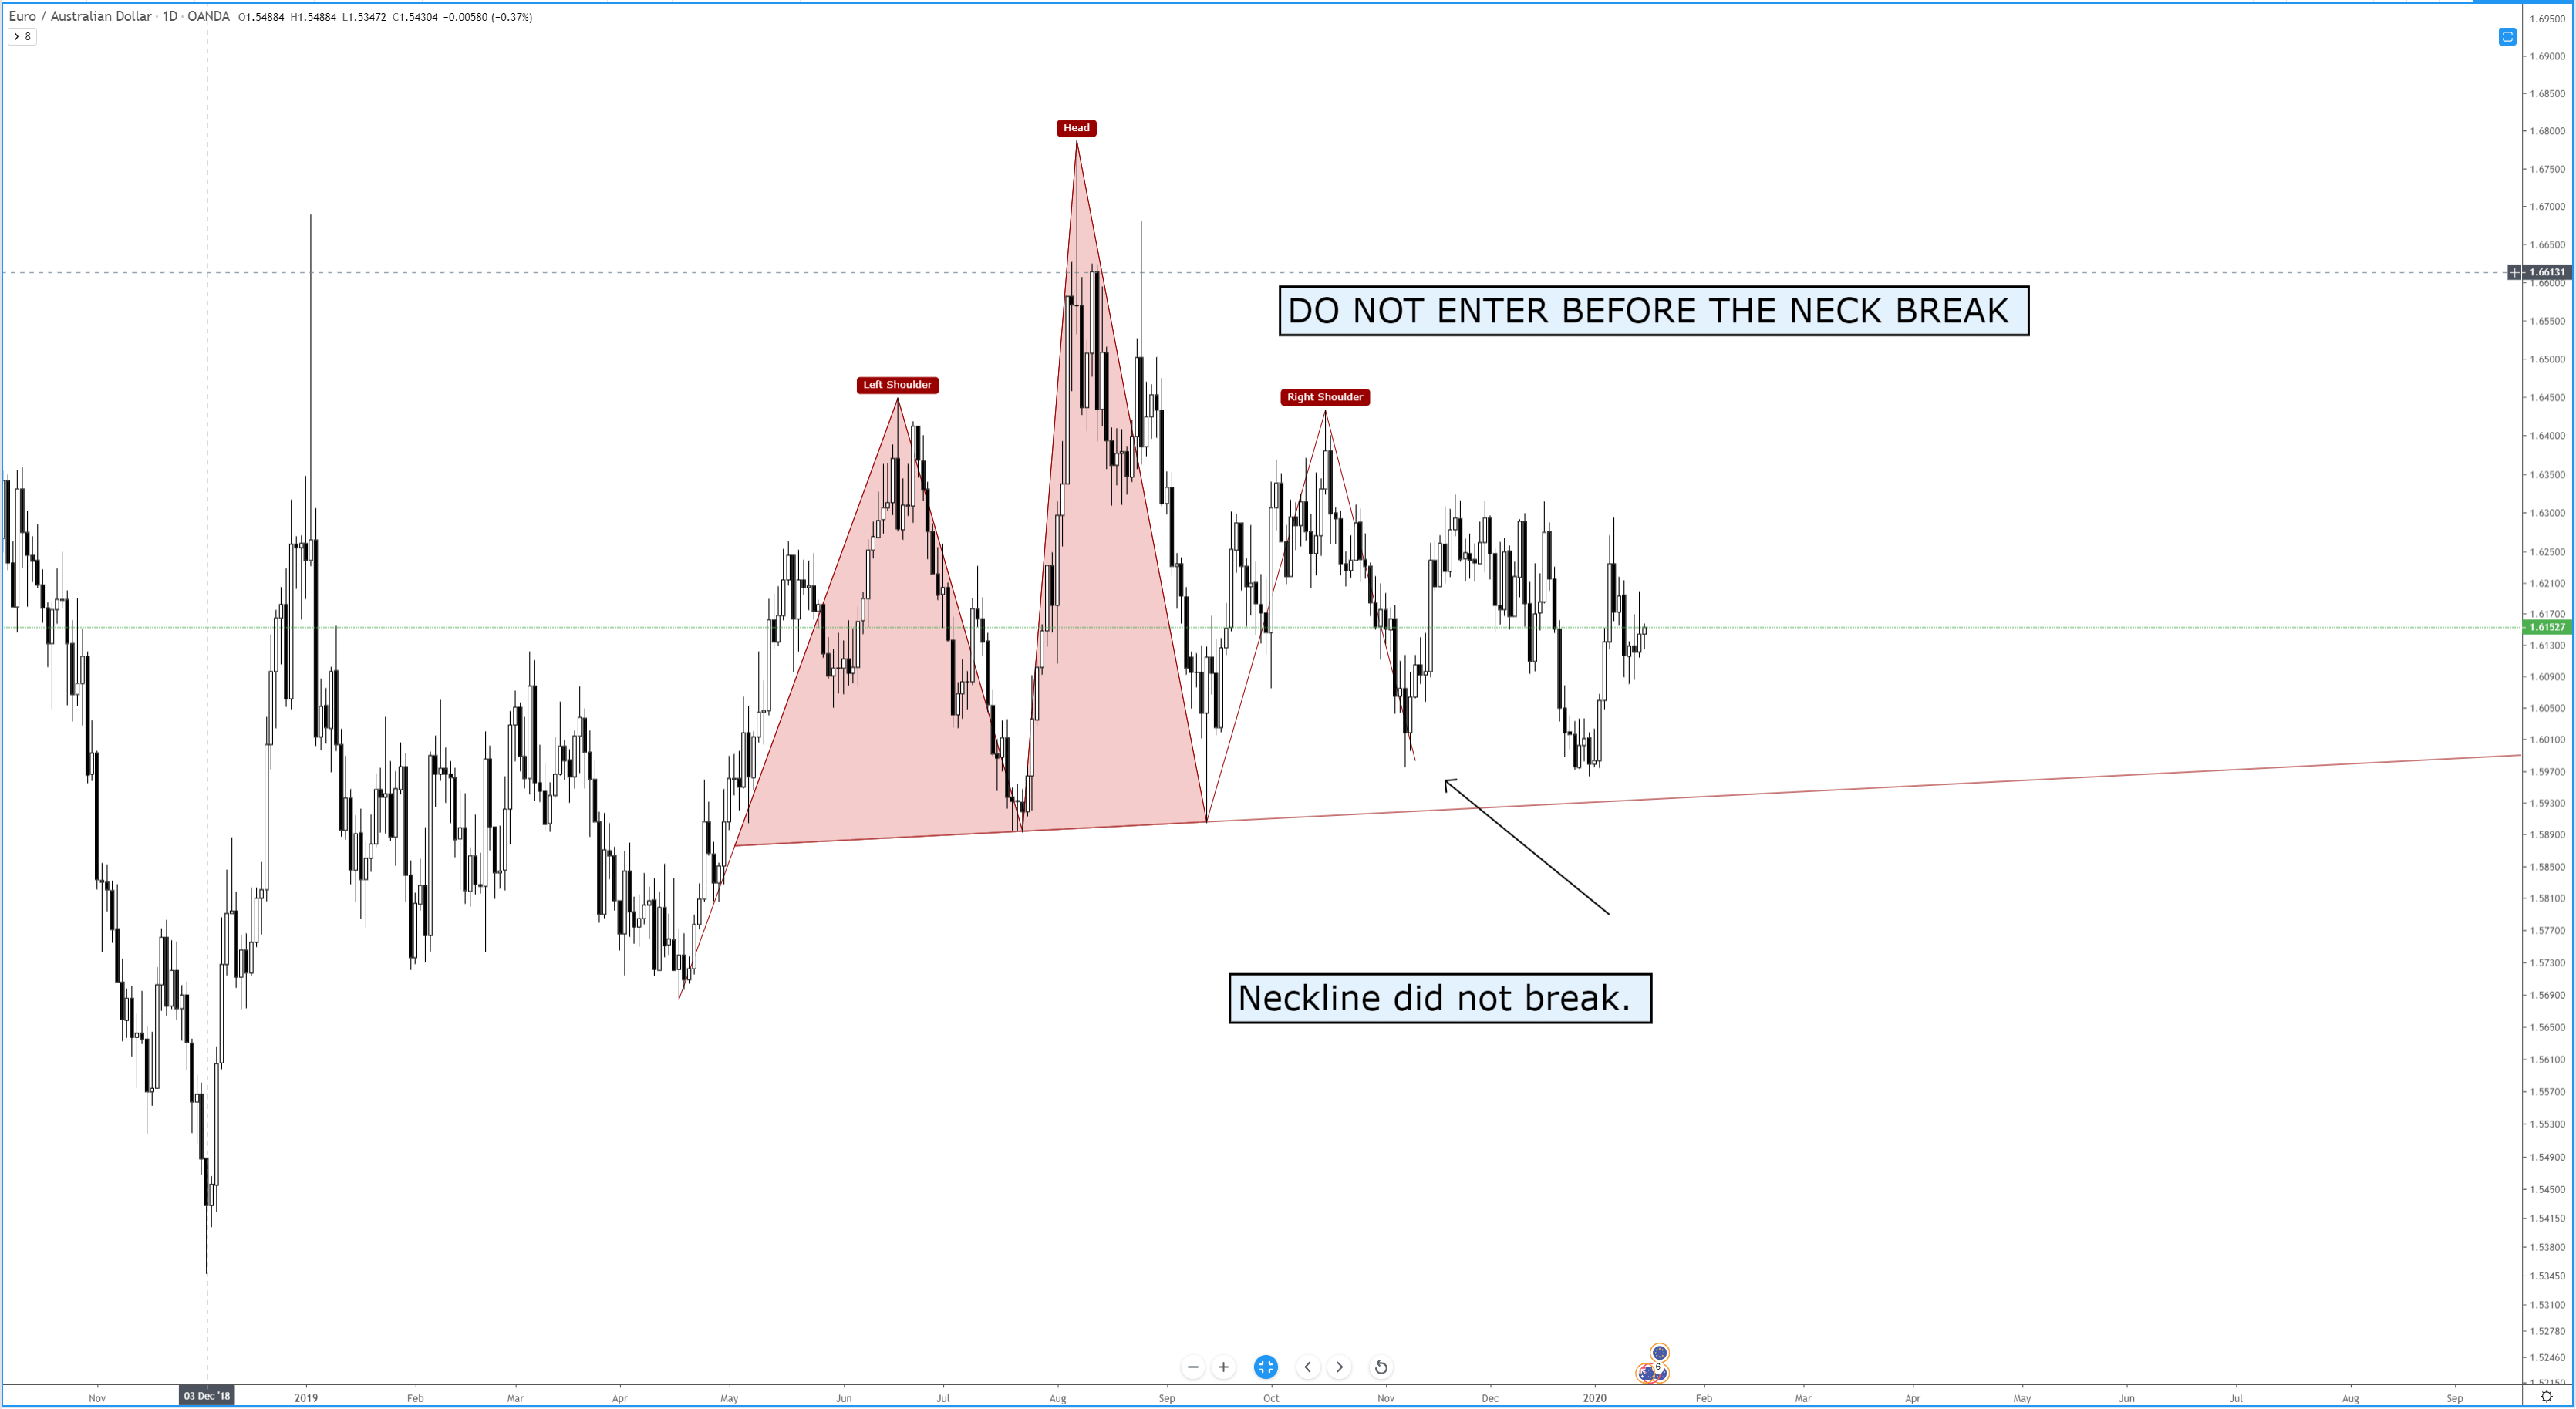
The image above shows two head and shoulder patterns, the regular pattern and the inverse pattern. It just so happened that the daily chart of the AUDUSD conveniently had both of the patterns right next to each other – not a common occurrence. Now, you can and will read a lot of rules and theories behind the head and shoulder pattern. I could go into the behavior of this pattern, the psychology behind the three triangles that make up the broader pattern, the symmetrical nature of the left and right shoulders, etc., etc., etc., but we don’t need to complicate a pattern that can be very easily understood.
There’s a great book by Larry Pesavento titled Trade What You See. While the book Trade What You See is focused primarily on Harmonic Patterns, the title always stuck with me. If you were to stand in front of a mirror, you would more than likely notice the symmetrical nature of your left and right shoulders (unless you’ve had some significant injury or disease. There’s a good number of people who believe that both the right and left shoulders need to be as exact as possible – but this isn’t necessary.
Here’s a simple rule to follow:
If it doesn’t look like a human head and shoulder, then it probably isn’t a head and shoulder pattern.
Are you familiar with the poker game Texas Hold’em or any other form of poker? There are several maxims that poker players follow, one of them is ‘Don’t chase the straight or the flush.’ Why? Because when you get dealt a hand that is missing just one card for your straight or one more suite to complete your flush, the odds are overwhelmingly against you getting that final card to complete the straight/flush. Head and shoulder patterns are the same way. The head and shoulder pattern is only complete when the neckline has been broken. Let me repeat that three times for you:
A head and shoulders pattern is not complete until the neckline is broken.
A head and shoulders pattern is not complete until the neckline is broken.
A head and shoulders pattern is not complete until the neckline is broken.
Many a trading account has been the victim of trying to anticipate the completion of a head and shoulder pattern, only to have it be broken. In addition to being the most profitable basic pattern, the head and shoulder pattern is also one of the most rejected patterns. We don’t chase straights or flushes in poker, and we don’t chase patterns in trading. In addition to the information above, here are some other factors that can help you interpret the head and shoulder pattern:
- If the volume in the left shoulder is greater than the right shoulder, there is an increased likelihood of the head and shoulder pattern completing.
- If the volume in the right shoulder is greater than the left shoulder, failure rates are higher.
- Horizontal necklines increase the probability of a head and shoulder pattern completing.
- The more dramatic the slop of the neckline, the more likely the pattern will fail to develop.
- Aggressive entries can be taken immediately when the price breaks the neckline.
- Conservative entries can be taken after the neckline has been re-tested post-breakout.
- If price breaks the neckline, retracements occur almost 70% of the time.
Sources:
Kirkpatrick, C. D., & Dahlquist, J. R. (2016). Technical analysis: the complete resource for financial market technicians. Upper Saddle River: Financial Times/Prentice Hall.
Bulkowski, T. N. (2013). Visual guide to chart patterns. New York, NY: Bloomberg Press.
Bulkowski, T. N. (2008). Encyclopedia of candlestick charts. Hoboken, NJ: J. Wiley & Sons.
Bulkowski, T. N. (2002). Trading classic chart patterns. New York: Wiley.