Introduction
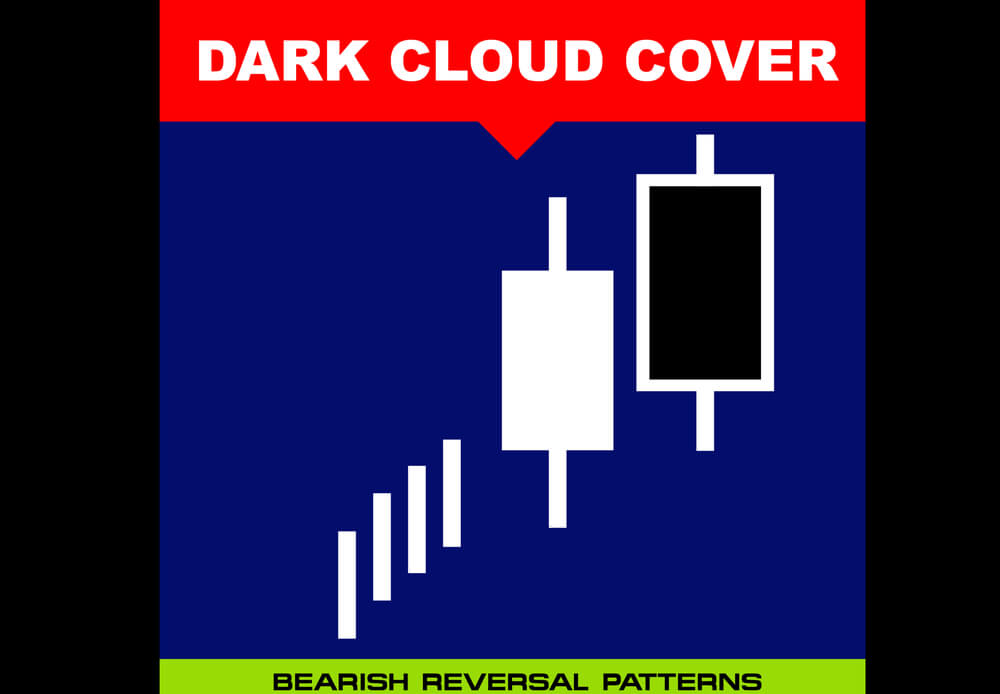
Dark Cloud Cover is a bearish reversal candlestick pattern. It essentially shows the shift in momentum from the buyers to sellers. This pattern is formed by a bullish candle, which is then followed by a bearish candle. Traders can look for an entry on the next red candle. The Dark Cloud Cover pattern can only be used when it occurs in an uptrend. Because, if the price rises above the Dark Cloud Cover pattern, it becomes less significant to trade. It is essential to know that the bearish engulfing pattern and Dark Cloud Cover pattern are very similar in their appearance. If the second candle of the pattern closes below the previous candle, you have the bearish engulfing pattern; if not, it is a dark cloud pattern.

Criteria to identify the Dark Cloud Cover pattern
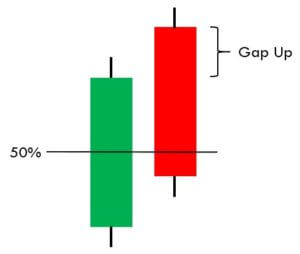
- The market must be in an existing uptrend.
- The first candle must be bullish candle within that uptrend.
- A gap must be on the following day.
- The gap up candle must close into a bearish candle.
Dark Cloud Cover Pattern – Trading Strategies
DCC + MACD Indicator
As we always say, do not trade any pattern stand alone in the market. Pairing the pattern with other credible trading tools like indicators or oscillators will dramatically increase the odds of your trades. In this strategy, we have paired the Dark Cloud Cover pattern with the MACD indicator to filter out the low probability trades. MACD indicator stands for Moving Average Convergence and Divergence. It is one of the most popular indicators that has been in use since the late 1970s. It belongs to the oscillator family, and it is designed to measure the magnitude, direction, and rate of change in any underlying currency pair.
STEP 1 – First of all, find the Dark Cloud Cover pattern in an uptrend.
STEP 2 – Wait for a MACD Crossover
Once you have found the Dark Cloud Cover pattern, the next step is to take the sell trade when MACD gives crossover at the oversold area.
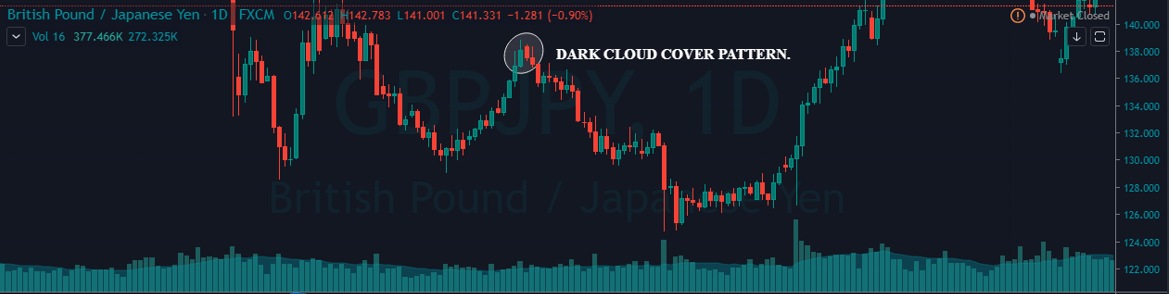
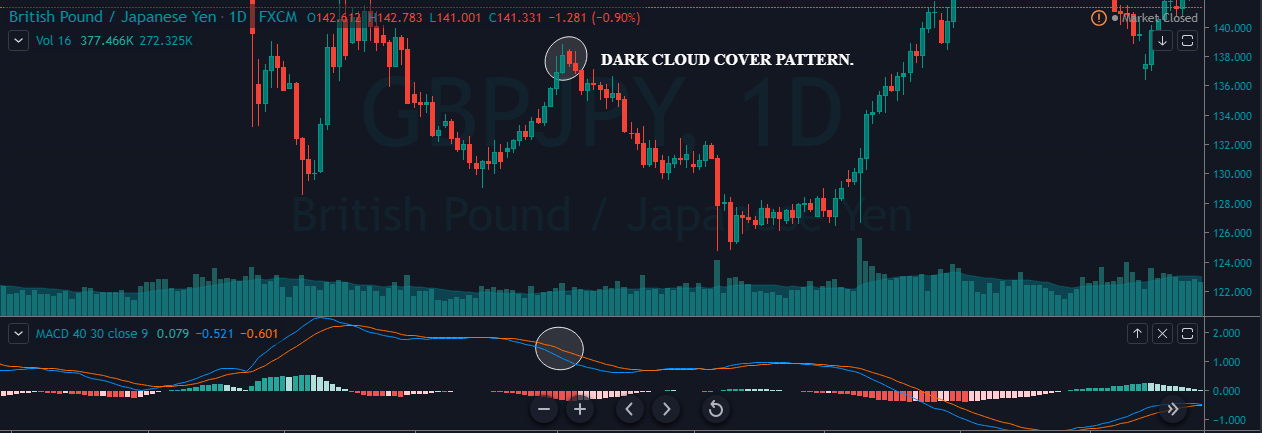
As you can see in the below daily chart of the GBPJPY forex pair, the price action turned sideways for some time. After that, it prints the Dark Cloud Cover pattern, and at the same time, we can see the MACD indicator giving a reversal at the overbought area. This is a potential sign for us to go short on this pair. As mentioned earlier, do not confuse between the Dark Cloud Cover and Engulfing Pattern. In a Bearish engulfing pattern, the red candle completely takes over the preceding green candle, whereas, in the Dark Cloud Cover pattern, the red candle takes over only 50% of the previous green candle.
Step 3 – Take Profit and Stop loss
In this strategy, we have closed our full position at the major support area, and stop-loss was above the Dark Cloud Cover pattern. Price action holds below the support area, but it immediately came back, and prints a brand new higher high. We can also close our positions based on the MACD indicator. When the MACD indicator reversed at the oversold area, it’s a perfect sign to exit our position. Always remember the sure sign of market reversal is when the price action is at the significant support area and the MACD lines crossover at the oversold region.

DCC + Donchain Channel
In this strategy, we have paired the Dark Cloud Cover pattern with the Donchain Channel. Richard Donchain developed the Donchain channel indicator in 1936. He was a fund manager, writer, and also known as the father of trend trading. Once the Donchain channel indicator is plotted on to the price chart, it helps the traders to visualize the price of an asset and if it is relative to the upper and lower bounds of the indicator.
STEP 1 – Find out the Dark Cloud Cover pattern in an uptrend.
STEP 2 – Check if the price action respects the upper Donchain Channel
Once you find the Dark Cloud Cover pattern in an uptrend, the next step is to check if the price action respects the upper Donchain Channel.
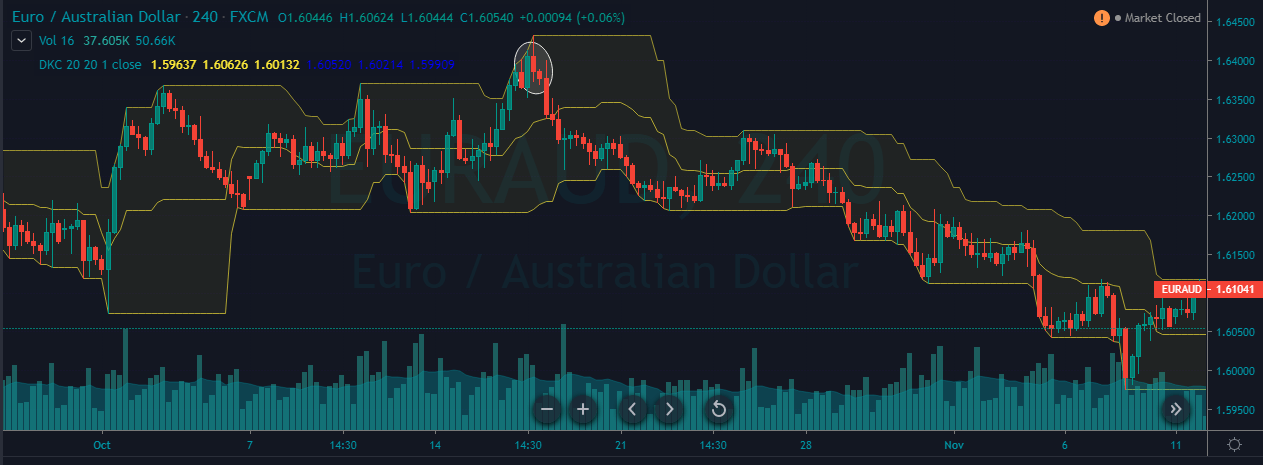
The image below represents the EUR/AUD forex pair, and the price action was held at the major resistance area. Before printing the Dark Cloud Cover pattern, the price hits the upper bound of the Donchain channel twice. When price action hits the upper bound of the Donchain channel and if the market prints the Dark Cloud Cover pattern at the same time, it is a clear indication of sellers stepping into the market. After the completion of the pattern, we activate our trade, and for a profit-booking, we aim for the second target.
STEP 3 – Take Profit and Stop loss
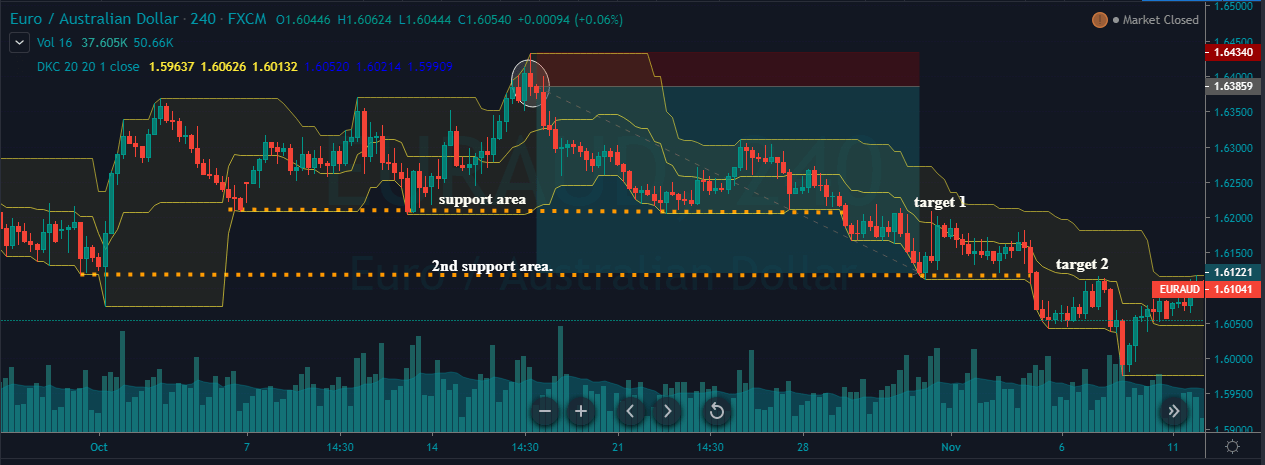
In this example, we have two target areas. If you are a short term or intraday trader, then exit your position at first support area, and if you are a positional trader or a swing trader, then go for target two. When you activate your trade and if the market has two major support areas, always try to exit your position at target two, because the end goal of every trader is to make as much money as possible when the market gives them an opportunity & minimize the losses when the trade goes against them. The placement of stop-loss should always be above the Dark Cloud Cover pattern.
Bottom Line
The Dark Cloud Cover is quite a popular trading pattern in the industry, and it can easily be recognized on the price charts. This pattern is only useful or reliable to trade when it appears in an overall uptrend. This pattern identifies the shift in momentum from buyers to sellers. The test of the resistance line or trend line can be used as a confirmation tool to take sell trades. If you are using the Dark Cloud Cover pattern alone, always use it on the higher timeframe. Also, use more significant stop loss because none of the indicators or patterns are capable enough to indicate accurate signals all alone. On a lower timeframe, this pattern often provides some false signals. Still, by pairing it with other trading indicators, we can dramatically filter out the low probability signals.
We hope you find this article useful. Try trading this pattern with the indicators we have mentioned above to maximize your profits, as these combinations have been back-tested by experienced traders. Cheers!