Categories
Forex Fundamental Analysis

Understanding ‘Interest Rate’ & It’s Impact On Various Currency Pairs

Introduction

Economic indicators measure how strong the economy of a country is. They `can measure specific sectors of the economy, such as housing or manufacturing sector, or they give measurements of the country as a whole, such as GDP or Unemployment. The following article will explain one such crucial economic indicator that drives the value of the currency – Interest Rate.

What is Interest Rate?

The interest rate is a fee we are supposed to pay for the money we borrow from the bank. It is generally expressed in terms of a percentage on the principal amount borrowed. The Bank’s primary source of income comes from the difference in the interest rate they charge to the borrowers and the lenders. They operate and profit from the difference between these rates.

When interest rates are high in a country, banks find it difficult to pass on such rates to consumers as it corresponds to fewer loans and more savings. This reduces spending in people, which will have an impact on the economy. Also, raising the interest rates curbs inflation and thus improves the economy.

Types of Interest Rates

The interest rate is frequently used by money managers while making investment decisions, and they look at different types of rates. The different kinds of Rates are Nominal, Real, and Effective interest rates. These are classified on the basis of critical economic factors that can help investors become smarter consumers and better investors. Let’s understand each of these types below.

Nominal Interest Rate

Nominal Interest Rate is the rate that is stated on a loan or bond. It signifies the actual price which the borrowers need to pay lenders in order to use their money. For example, if the nominal rate on loan is 10%, borrowers can expect to pay $10 of interest for every $100 they borrow from the lenders. This is referred to as the coupon rate because it used to be stamped on coupons that were redeemed by bondholders.

Real Interest Rate

It is named this way because, unlike the Nominal Interest Rate, it considers Inflation to give investors an appropriate measure of the consumer’s buying power. If an annually compounding bond gives an 8% Nominal yield and the inflation rate is 4%, the real rate of interest is only 4%. This can be put in the form of an equation as:

Real Interest Rate = Nominal Interest Rate – Inflation Rate

There are other pieces of information that the above formula provides in addition to the Real Rate. Borrowers and investors make use of this info to make informed financial decisions. They are:

  • When the Inflation Rates are negative, Real Rates exceed Nominal Rates, and the opposite is true when Inflation Rates are favorable.
  • There is one theory that suggests that Inflation Rate moves alongside the Nominal Interest Rate over time. Therefore, investors who have a long time horizon will be able to get investment returns on an Inflation-adjusted basis.
Effective Interest Rate

This type of Interest Rate takes the concept of compounding into account that the investors and borrowers need to be aware of. Let us understand how Effective Interest rate works with an example. If a bond pays 8% annually and compounds semi-annually, an investor who invests $1000 in this bond will receive $40 of interest payments for the first six months and $41.6 of interest for the next six months. In total, the investor gets $81.6 for the year. In this example, the Nominal Rate is 8%, and the Effective Interest Rate is 8.16%.

Economic reports & Frequency of the release 

Federal Open Market Committee (FOMC) members vote on where to set the Target Interest Rate. Later, they release the reports on the same with the actual rate and analysis. The policies of Central Banks also have an impact on the Interest Rates of a country. The Reserve Bank members hold meetings eight times a year and once every six weeks to evaluate the Interest Rates. These economic reports are published on a monthly and quarterly basis, and investors can compare the previous Interest Rates to Current Rates and analyze how they changed over time.

Impact on Currency

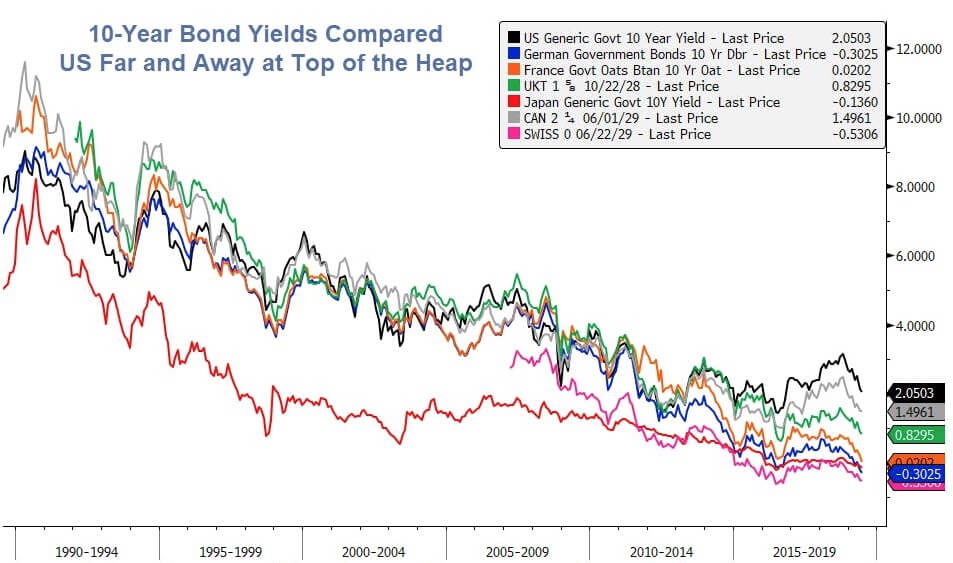
Investors are always interested in countries that have the highest Interest Rate, and they are more likely to invest in that economy. The demand for local currency is expected to increase, which leads to an increase in value.

High-Interest Rate means residents of that country get a higher rate of return on the deposit they made in banks and on capital investments. So obviously, investors will invest their capital in countries where they get a higher rate of return for holding their money.

Under normal economic circumstances, when investments increase in a country, the value of the currency appreciates and thus attracting the traders across the world.

Sources of information on Interest Rate

The Interest Rate data of some of the major economies can be found in the below references. The Rates of the respective countries are also available on the Reserve Bank website. However, the FOMC makes an annual report on the Interest rate that can be found here.

Authentic Sources To Find The Info On Interest Rates 

GBP – https://tradingeconomics.com/united-kingdom/interest-rate

AUD – https://tradingeconomics.com/australia/interest-rate

USD – https://tradingeconomics.com/united-states/interest-rate

CHF – https://tradingeconomics.com/switzerland/interest-rate

EUR – https://tradingeconomics.com/euro-area/interest-rate

CAD – https://tradingeconomics.com/canada/interest-rate

NZD – https://tradingeconomics.com/new-zealand/interest-rate

JPY – https://tradingeconomics.com/japan/interest-rate  

Interest Rate is one of the crucial factors that impact the currency of a country. It is especially crucial for traders who prefer taking trades on Fundamental analysis. But it is advised not to trade just based on this fundamental indicator alone. It is always better to combine the fundamental factors with proper technical analysis to get an edge over the market.

How ‘Interest Rate’ News Release Affects The Price Charts?

It is important to understand how the new releases of macroeconomic indicators like interest rates have an impact on the price charts. Below, we have provided some of the examples to demonstrate the impact of Interest Rates news release on various Forex markets. There is a reliable forum where all the government news release date is published, and it is known as Forex Factory.  Here, we can find all the present and historical information regarding most of the fundamental indicators like GDP, Interest Rates, Inflation Rate, etc.

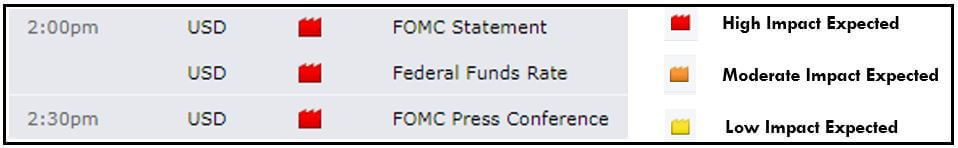
Below we can see a snapshot taken from the Forex Factory website. FOMC (Federal Open Market Committee) is a branch of the Federal Reserve Board that releases the Interest Rate data according to the predetermined frequency. On the right, we can see a legend that indicates the level of impact the Fundamental Indicator has on the corresponding currency.

Below, we can see the latest figures for Interest Rate data released by FOMC. We can see that the rate hasn’t changed from the previous release (both Actual and Previous being 1.75%)


Now, let’s see how this news release made an impact on the Forex price charts.

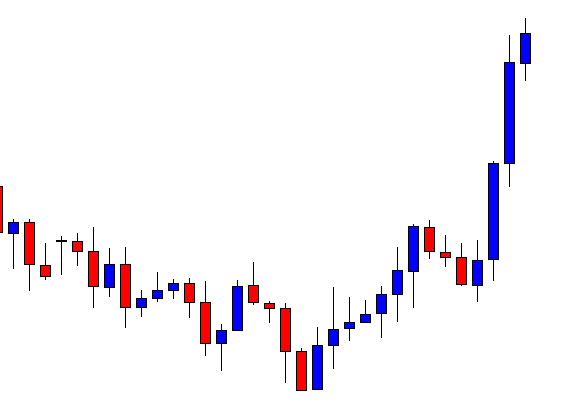
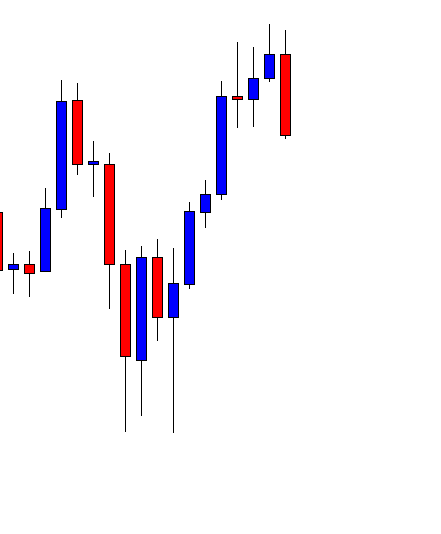
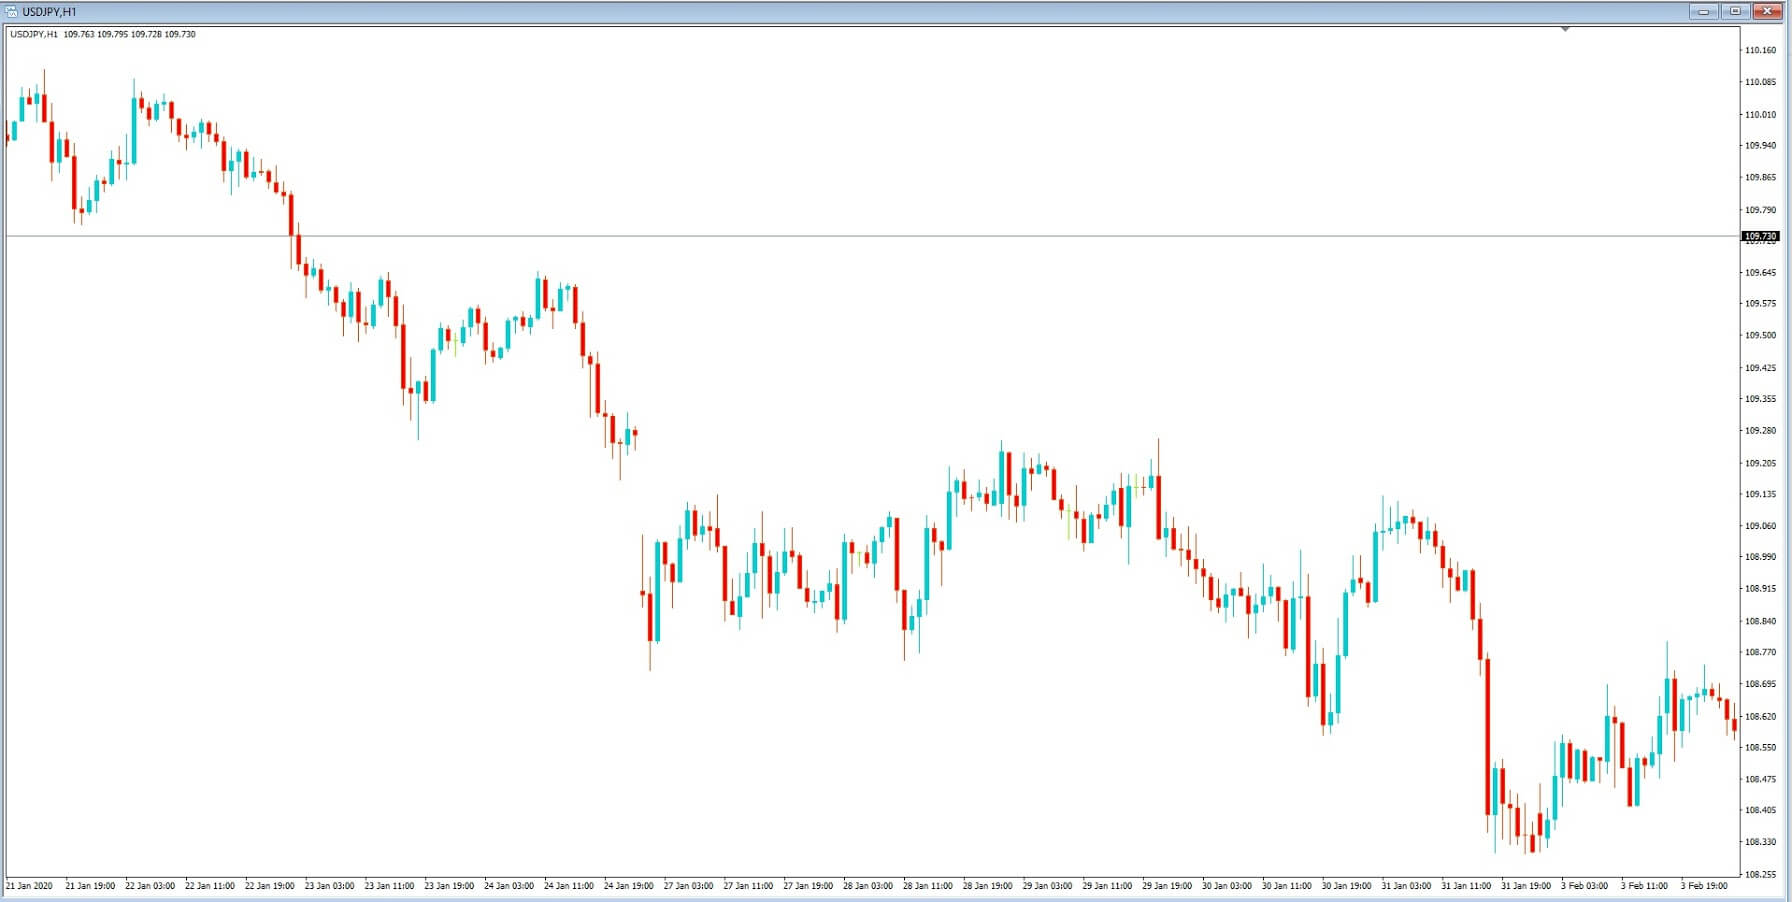
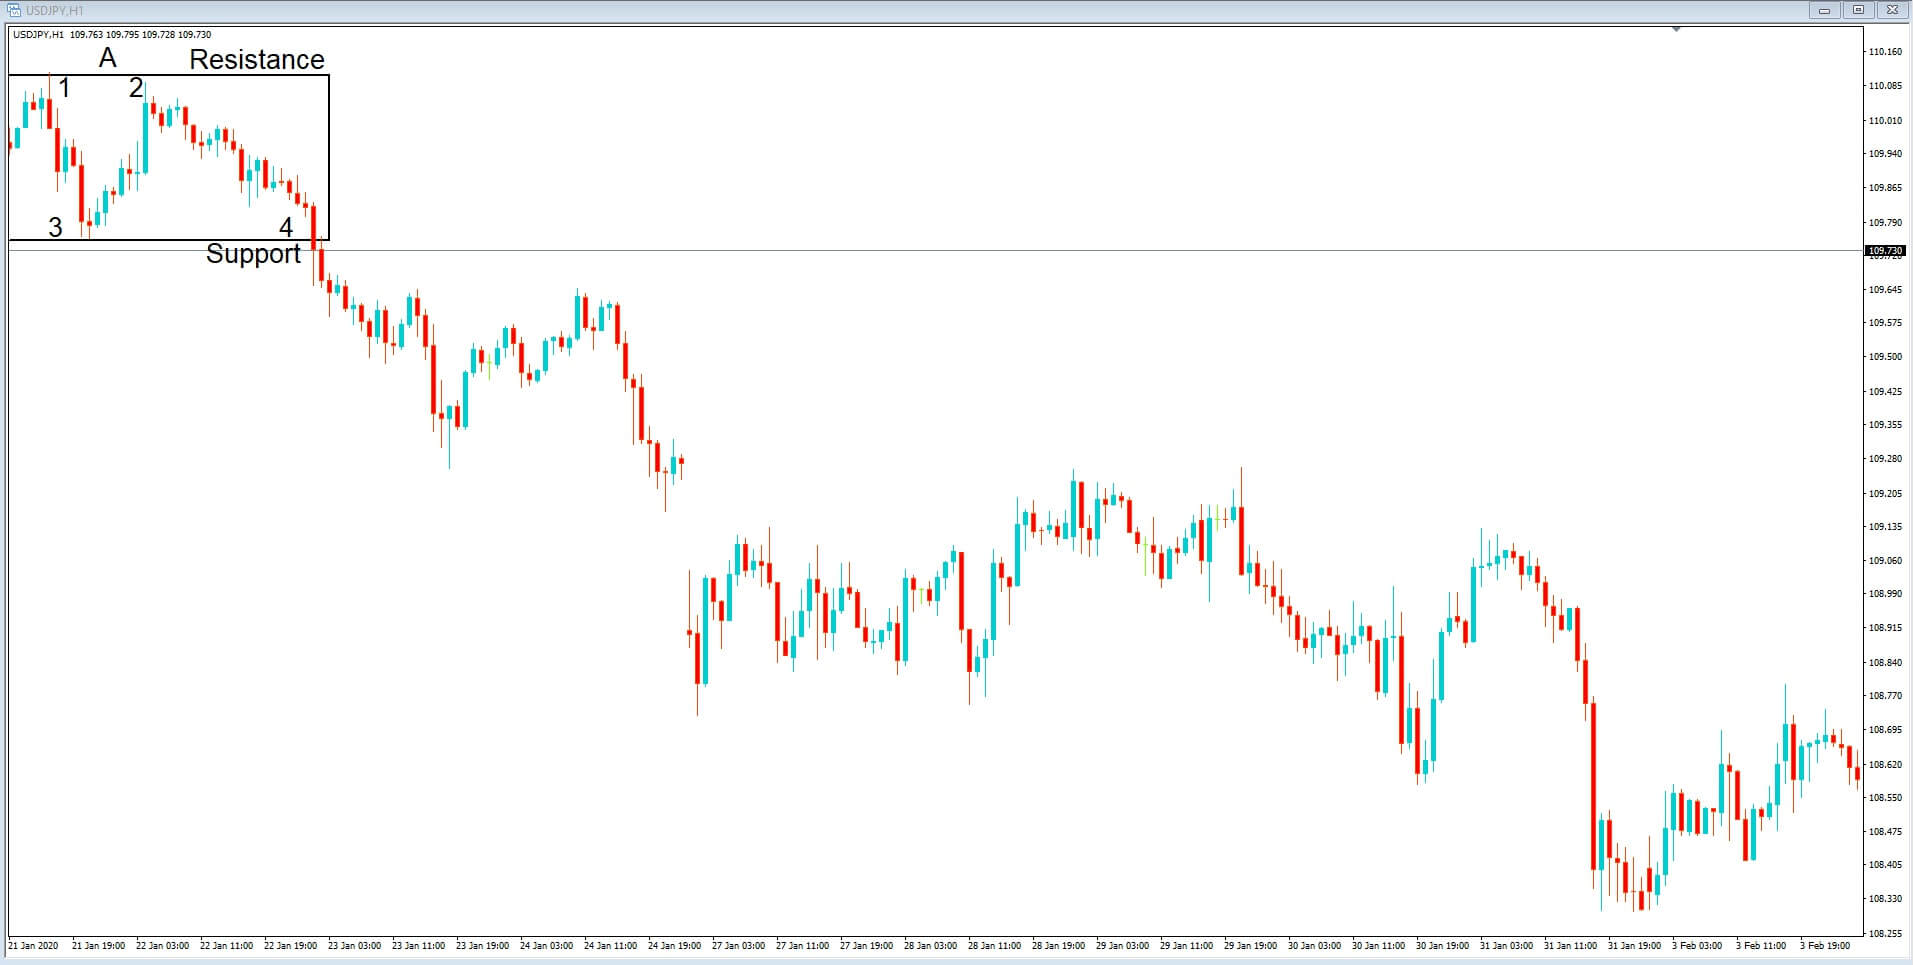
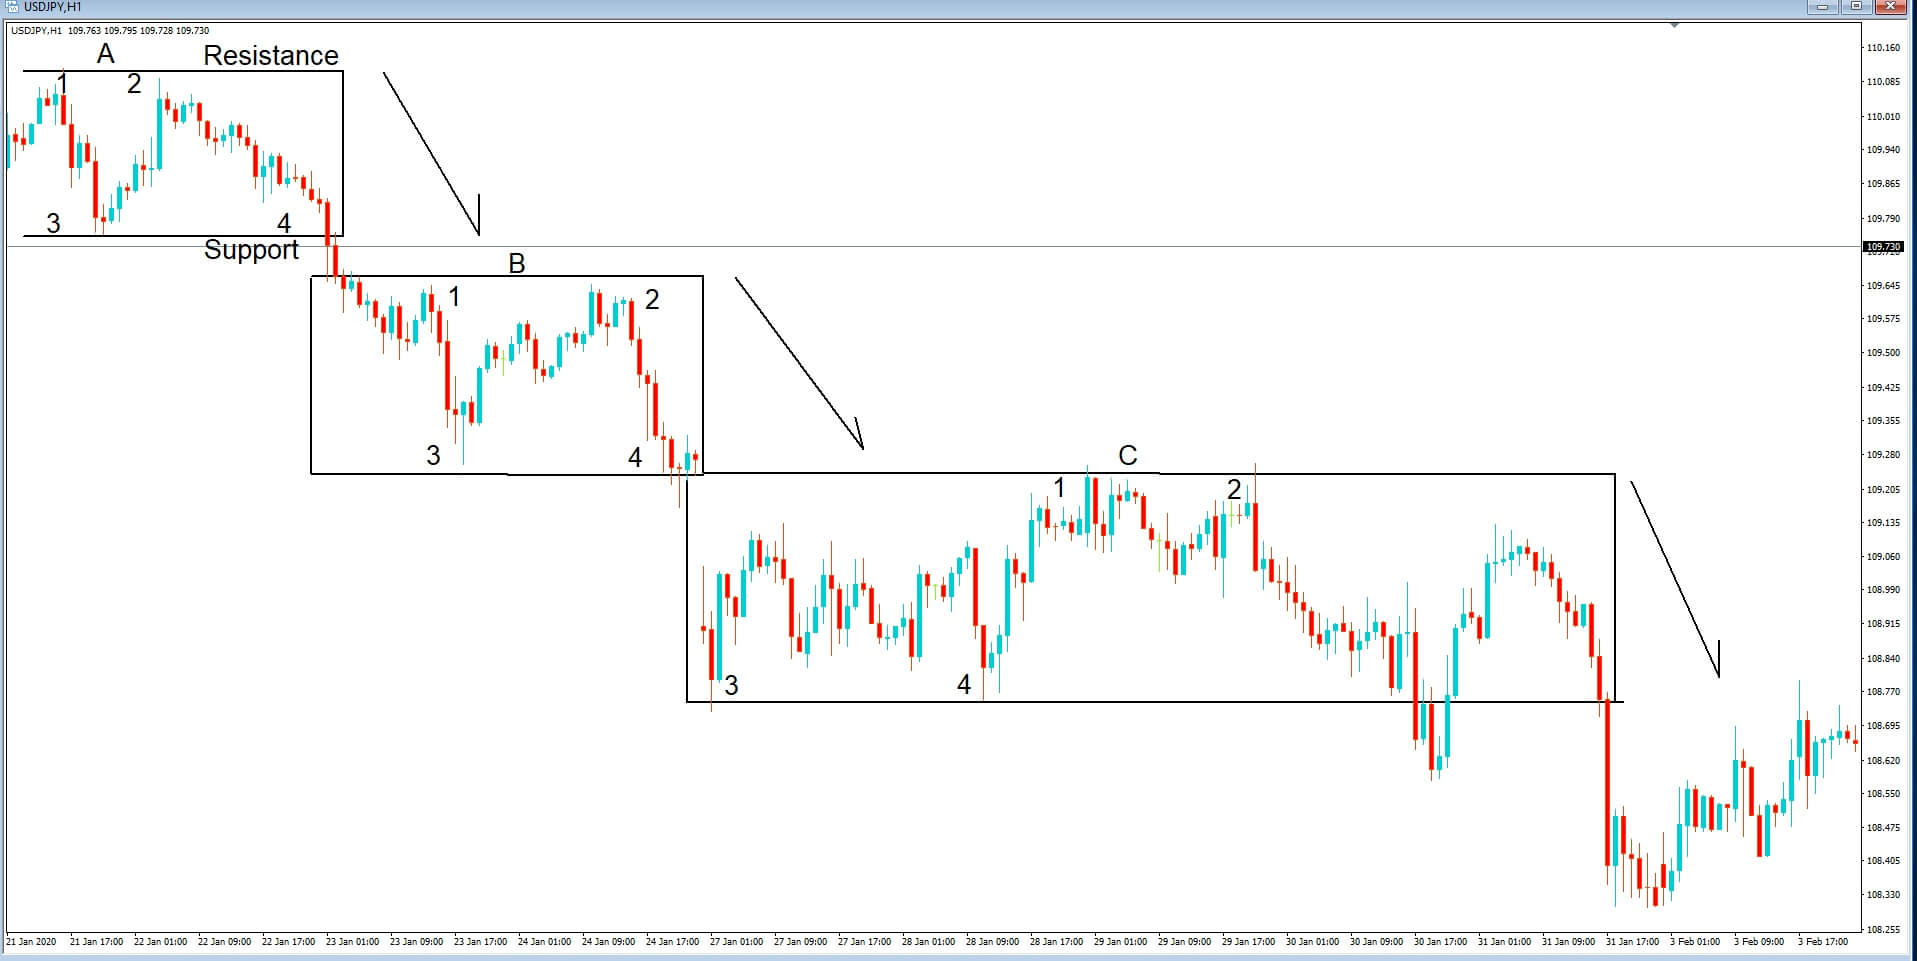
USD/JPY | Before The Announcement - (Jan 29th, 2020 | Just Before 2:00 PM) 

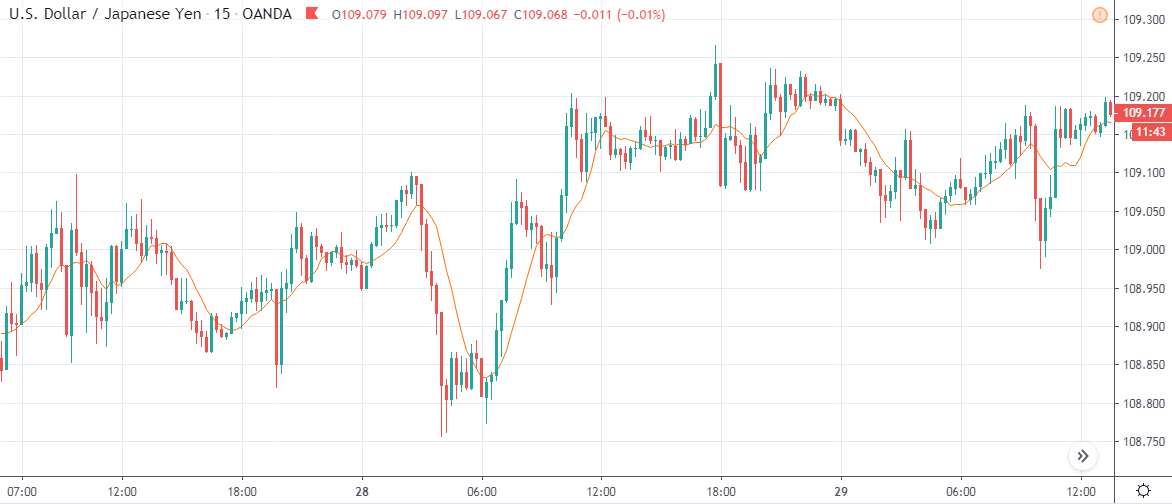
From the above chart, it is clear that before the news releases, the market was in a consolidation state (observe the last few candles.) Most of the Fundamental traders and investors must be waiting for the latest Interest Rate numbers. We have also plotted an MA on the chart to identify the market direction, and we can see the MA also being flat before the news release.

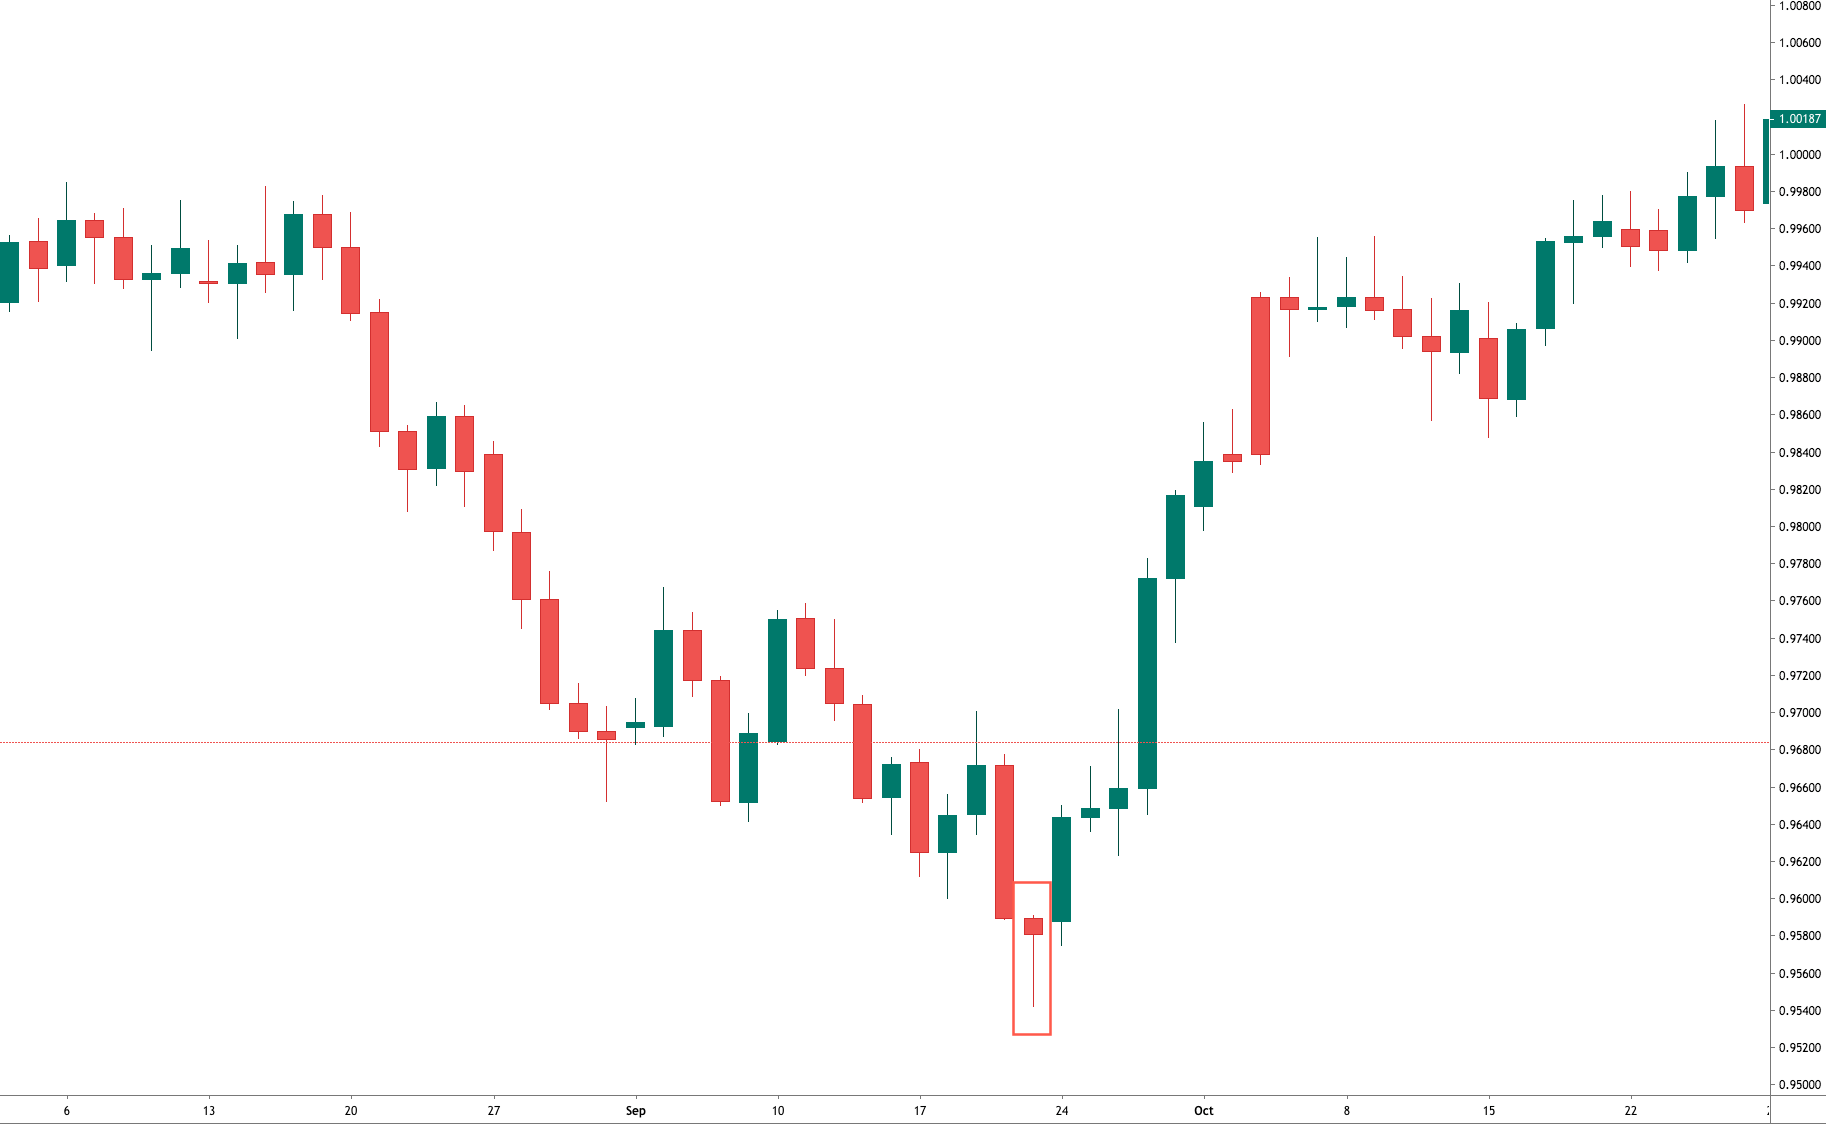
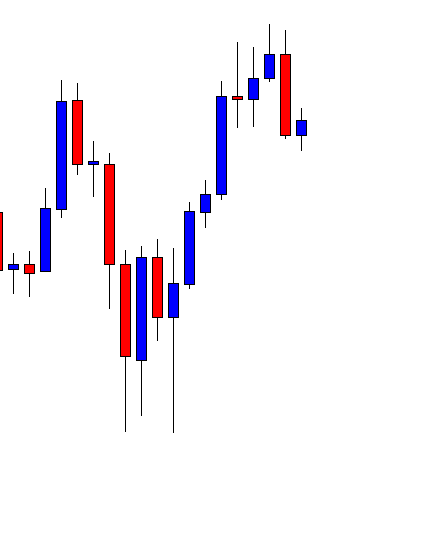
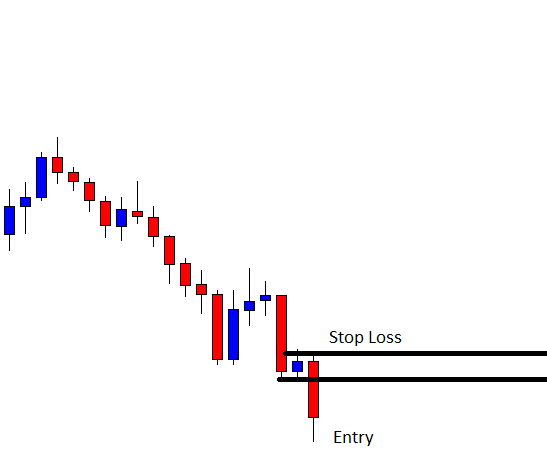
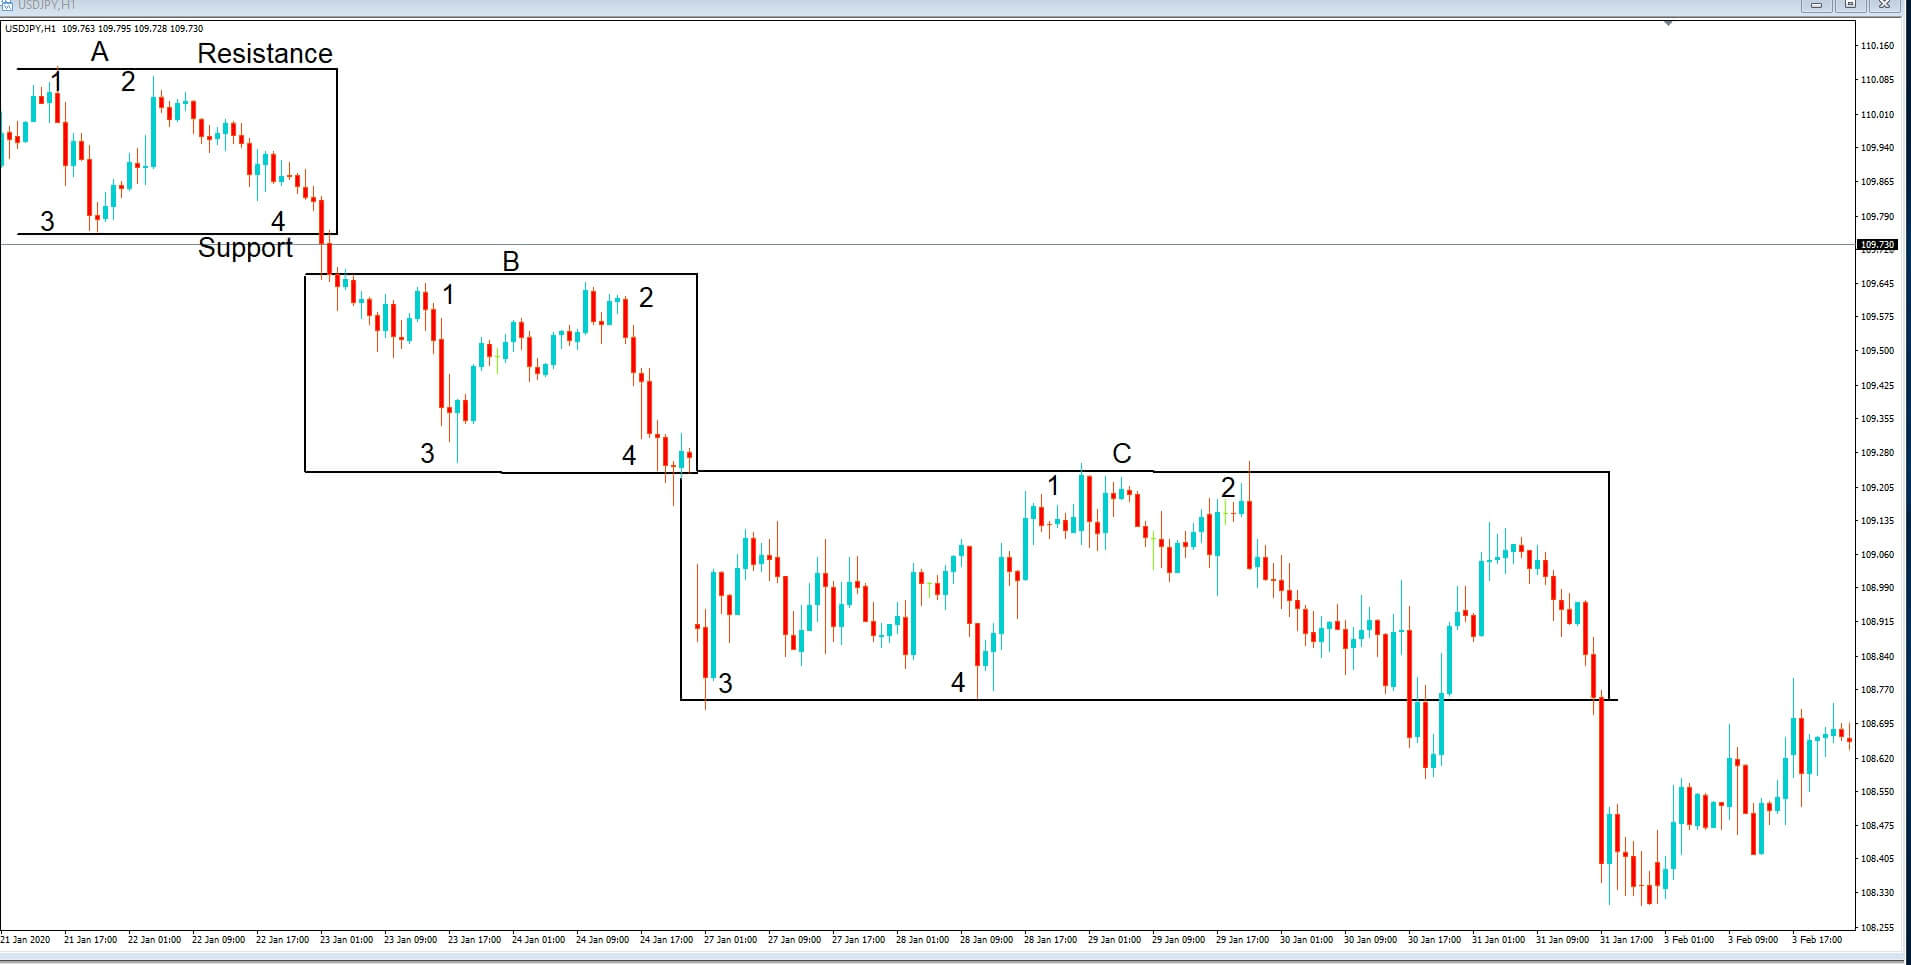
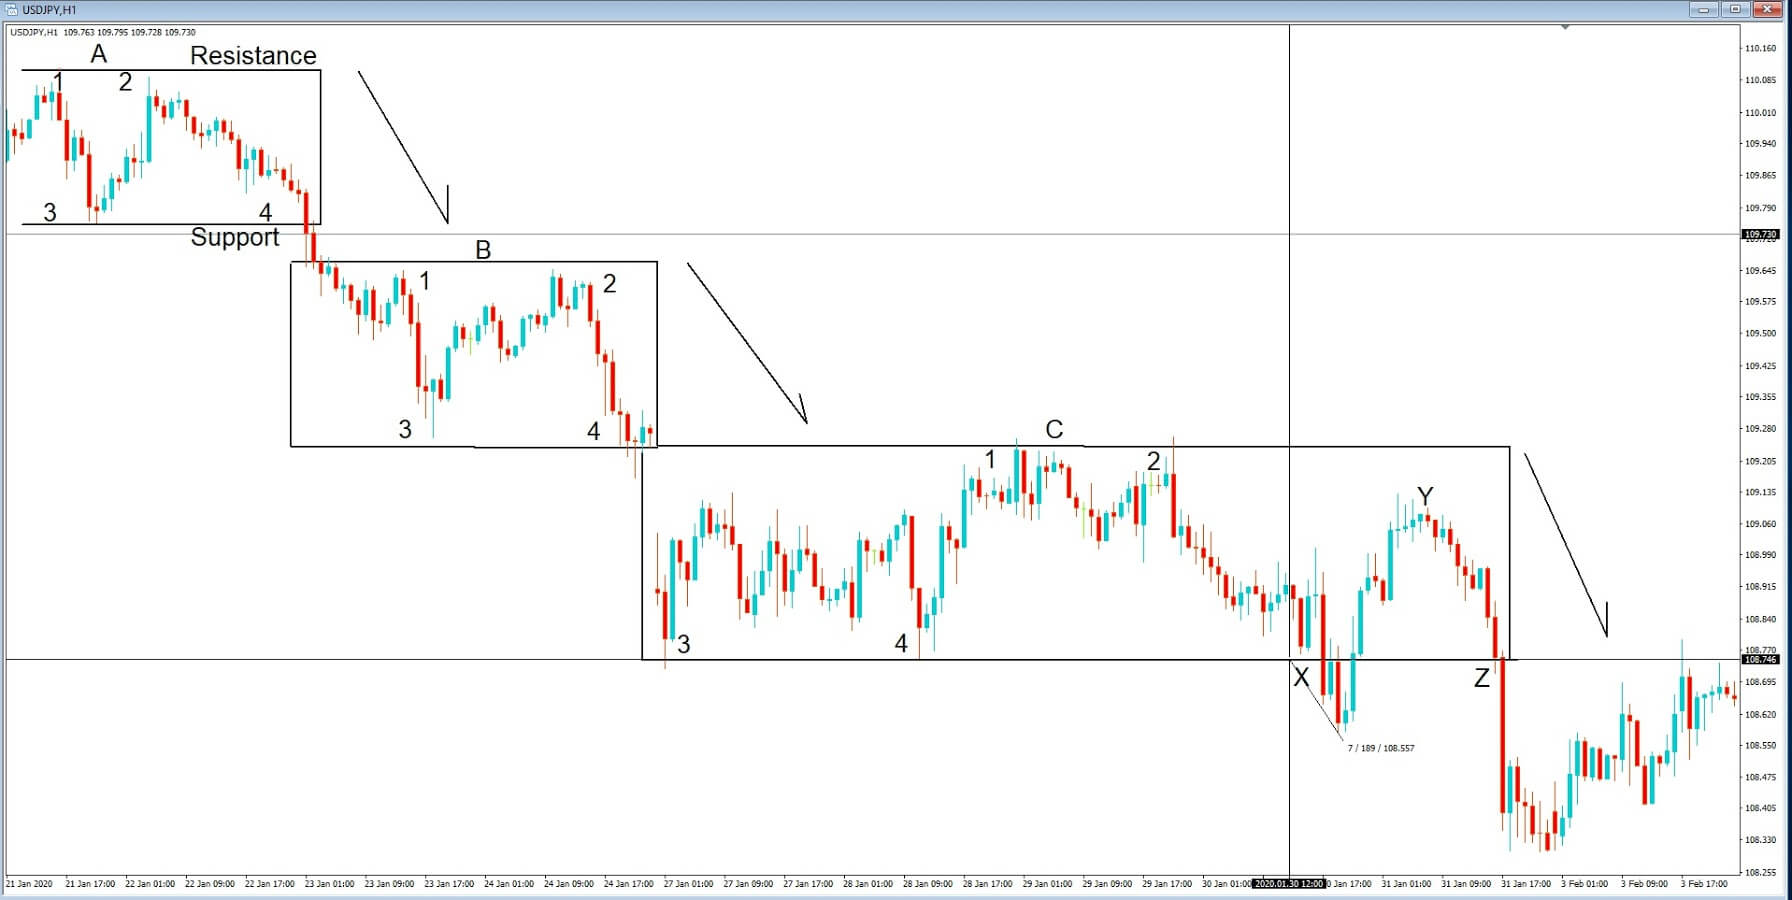
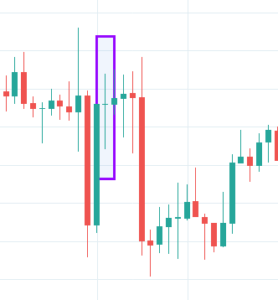
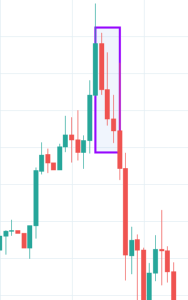
USD/JPY | After The Announcement - (Jan 29th, 2020 | Just After 2:00 PM)

Right after the release, we can observe a Bullish candle, which shows the initial reaction to the Interest Rate. It seemed to be positive for the US dollar, but later the market collapsed. The Interest Rates remained unchanged and were maintained the same as before, which should be positive for the US dollar. Hence, we see that initial reaction.

But why did the market collapse after a few minutes? This is because the market was expecting a rise in the interest rates, but FOMC kept a neutral stance and did not raise the rates. This explains the reason why the market fell after the announcement. The MA, too, does not rise exponentially, which shows the weakness of the buyers.

Since the market moved quite violently, later, the news release could prove to be profitable for the option traders who did not have any directional bias. There will be many traders who would want to take advantage of the market volatility right after the news release. So, even before the news is out, they employ various options strategies and make a profit. This requires a high amount of experience and knowledge of options and is not recommended for beginners. Now, let’s quickly see how this new release has impacted some of the other major Forex currency pairs.

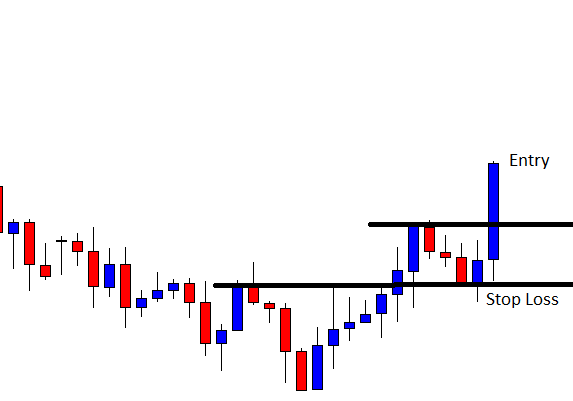
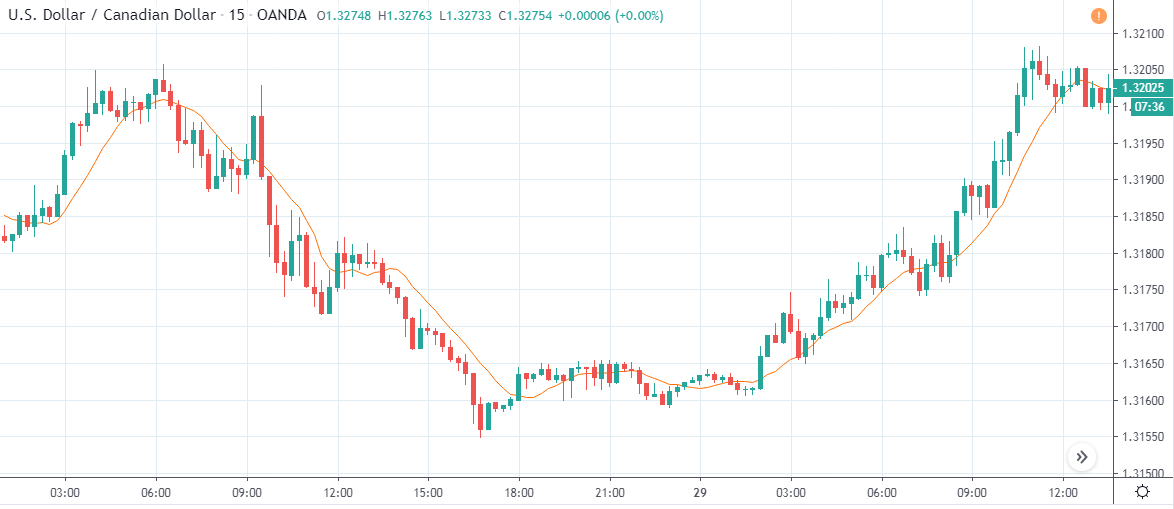
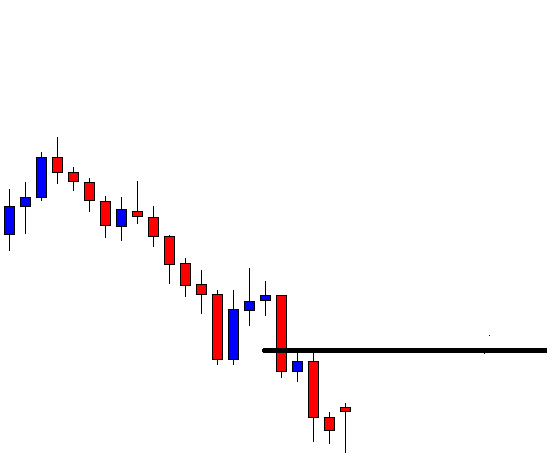
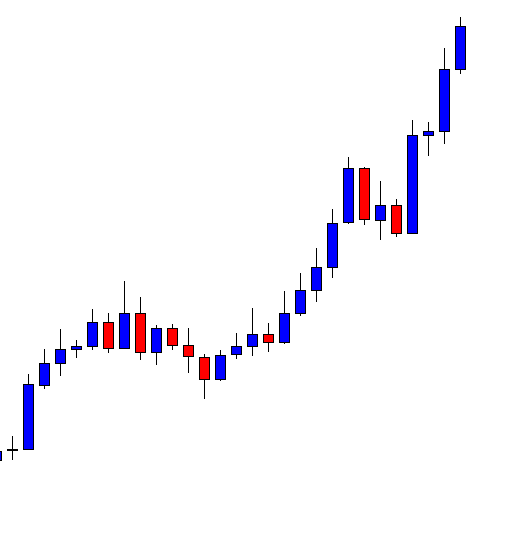
USD/CAD | Before The Announcement - (Jan 29th, 2020 | Just Before 2:00 PM)

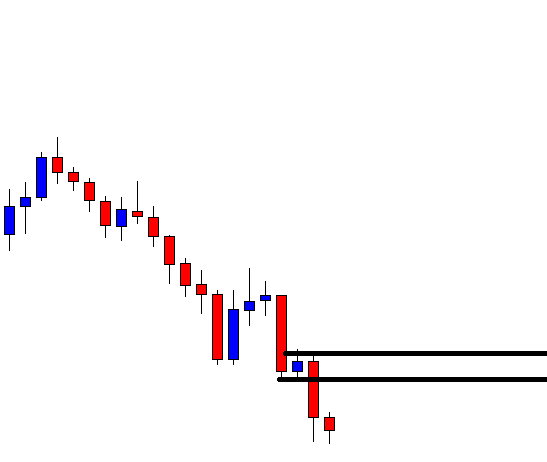
USD/CAD | After The Announcement - (Jan 29th, 2020 | Just After 2:00 PM)

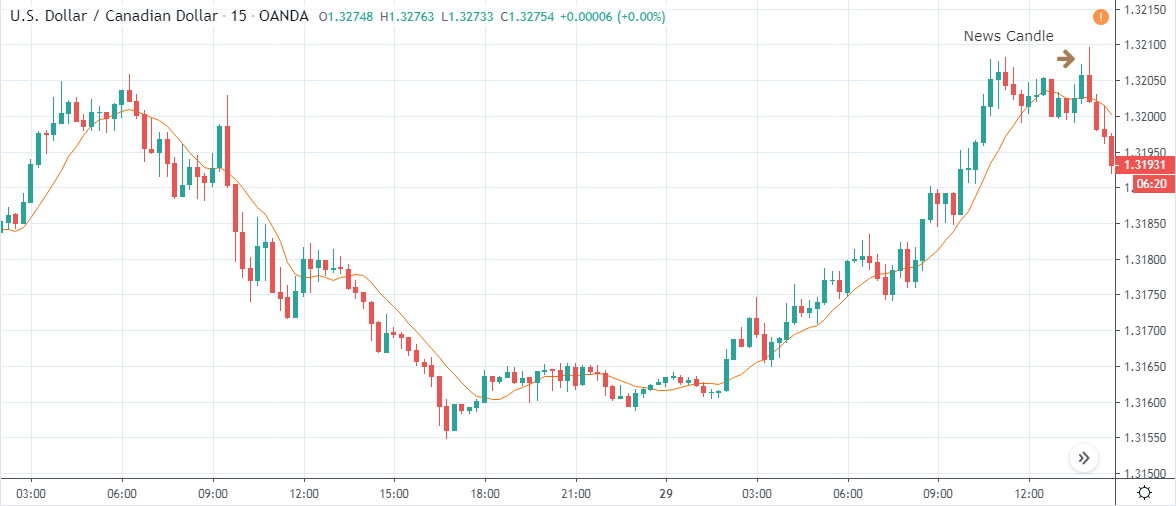
From the above charts, it is clear that the USD/CAD pair shows similar characteristics as that of our USD/JPY example. The last few candles before the news release portray a bit of consolidation prior to the news release, followed by a spike during the news announcement and then finally a collapse. One can take short trade in this pair and make a profit on the downside. Make sure to combine this with technical analysis for extra confirmation.

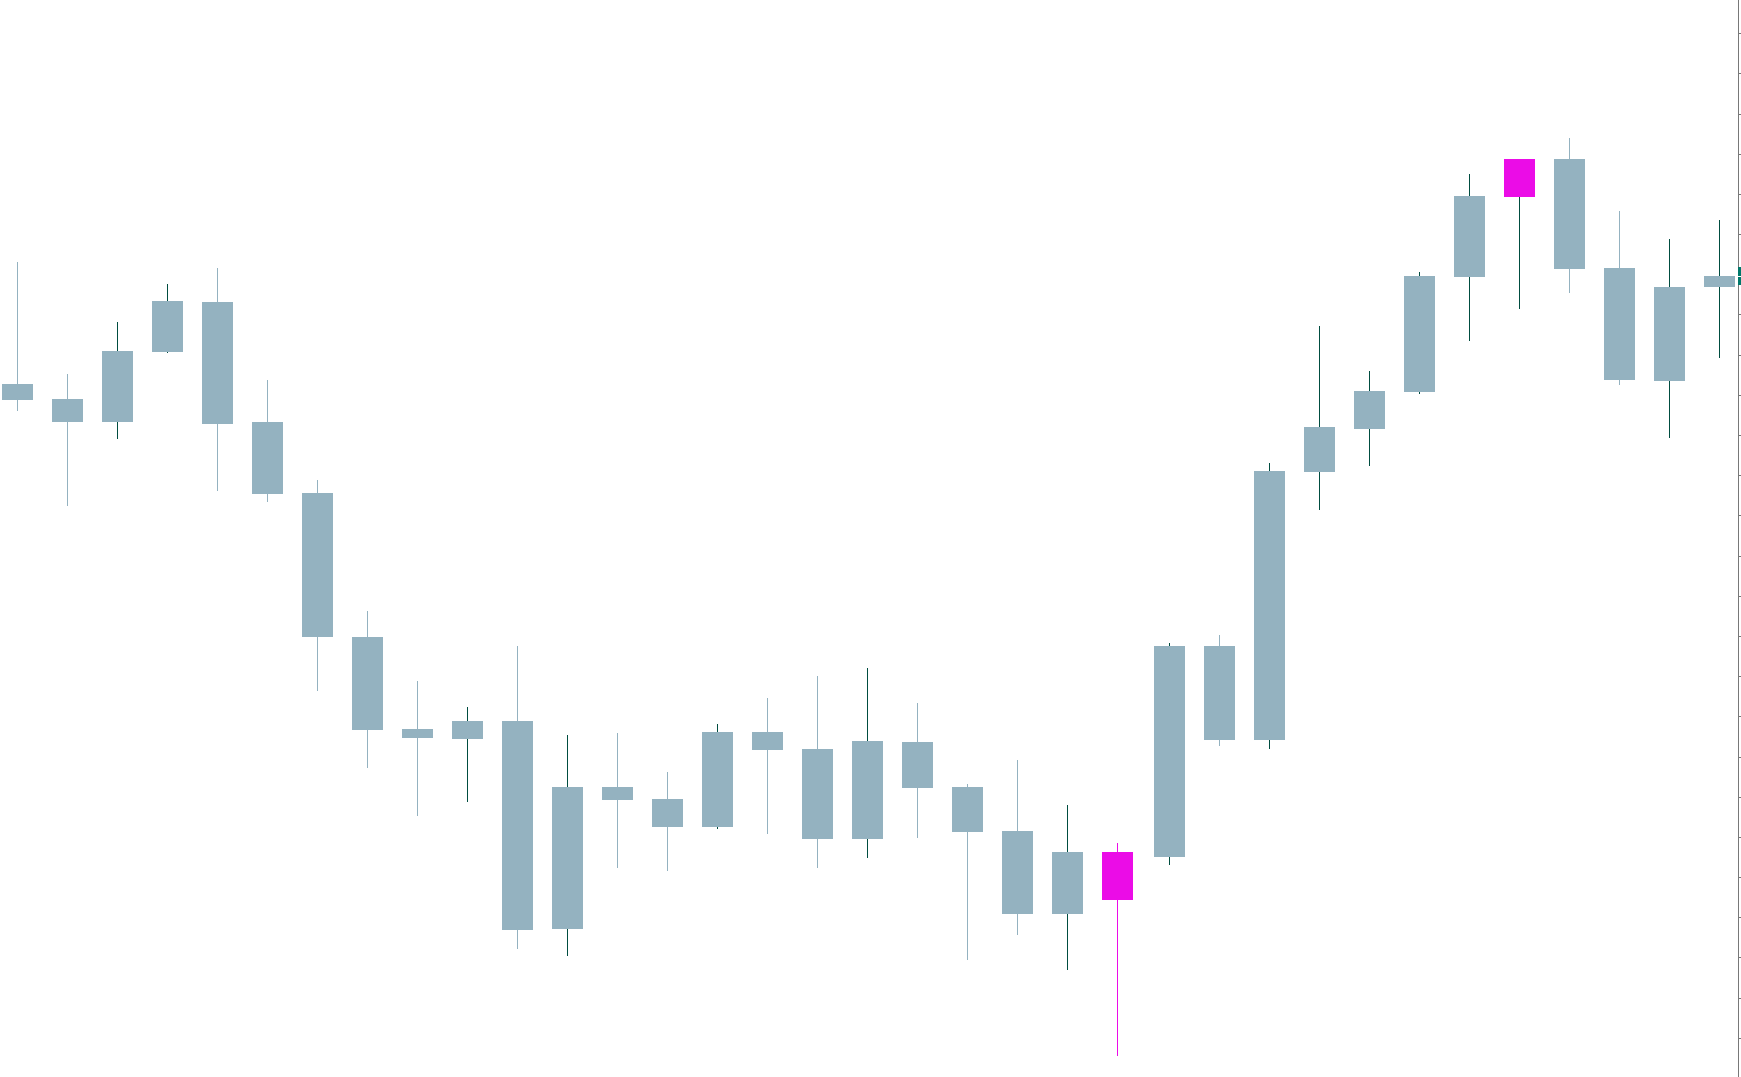
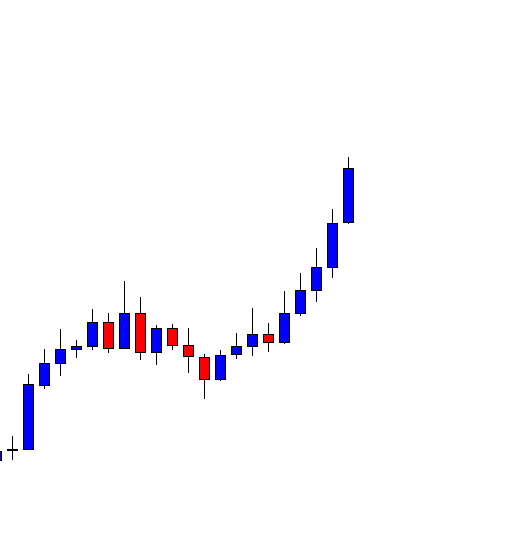
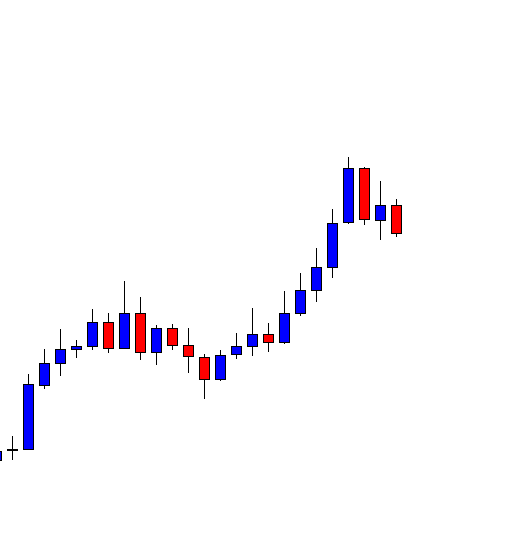
 AUD/USD | Before The Announcement - (Jan 29th, 2020 | Just Before 2:00 PM)

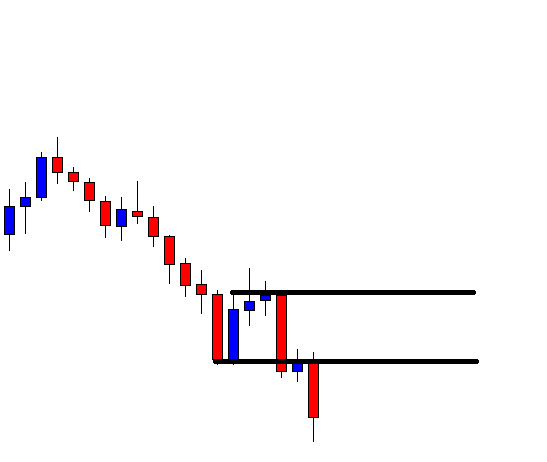
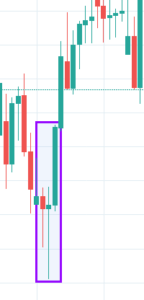
AUD/USD | After The Announcement - (Jan 29th, 2020 | Just After 2:00 PM)

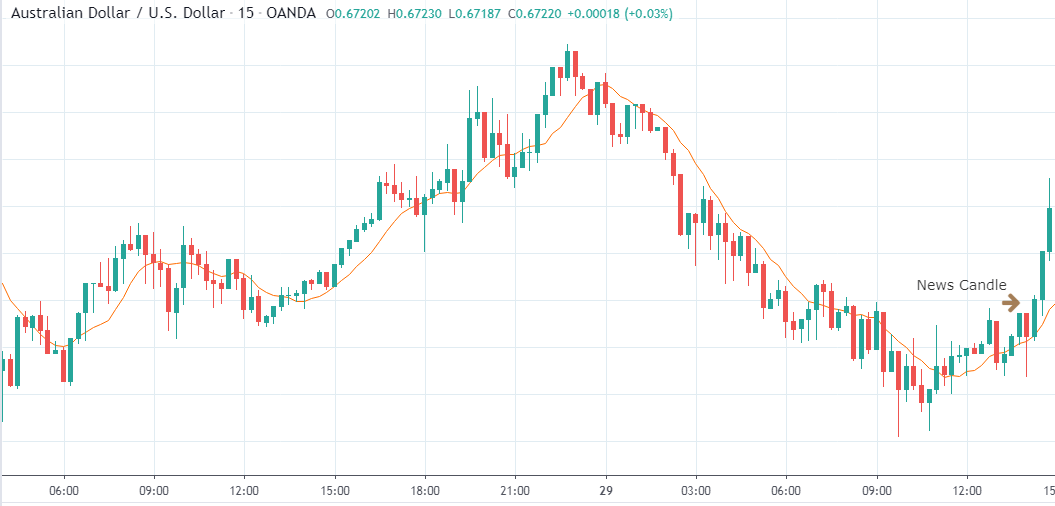
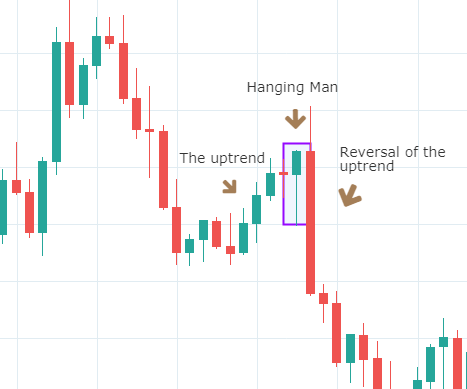
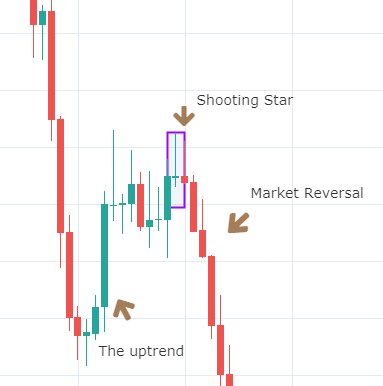
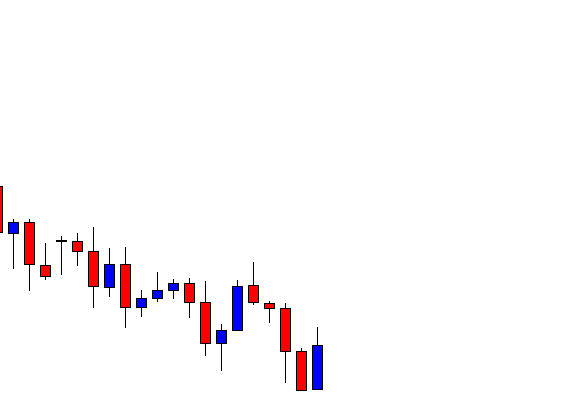
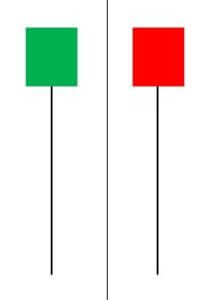
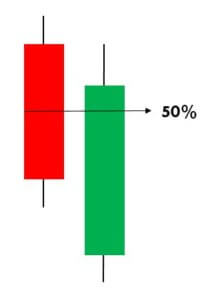
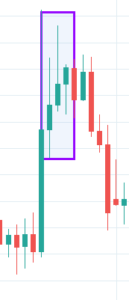
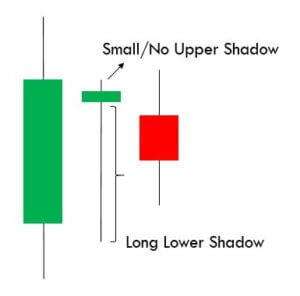
Since the US dollar is on the right side in this pair, ideally, we should see a bullish momentum after the news release. We can see that right after the release, the market prints a spike on the downside and forms a ‘hanging man’ pattern, which could be a sign of trend reversal. It can be clearly observed that the news had a significant impact on this pair as it reversed the trend almost completely.

Bottom Line

All we wanted to say is that the major Fundamental Indicators do have a significant impact on the price charts. At times we can see that these news releases can increase the market volatility significantly and even change the direction of the underlying trend. When we combine these Fundamental Factors with the Technical Analysis, we will be able to predict the market accurately and take trades with at most accuracy. Cheers!

We hope you find this article informative. If you have any questions, let us know in the comments below. Cheers!

Categories
Crypto Videos

Crypto Lending The Superior Way Of HODLing Part 2 OF 5

Crypto Lending – Where to lend your crypto? (part 2/5)


This part of the Crypto Lending guide will cover Nexo and BlockFi, two of the three platforms that we will show as good examples of how a lending platform should operate.

Nexo is a company founded in 2017 and is backed by Michael Arrington, the founder of TechCrunch. It has nearly 200,000 customers and even got covered by Forbes. The platform has back payments in 45 Fiat currencies.
Nexo Wallets are provided by BitGo. Therefore, users who borrow or lend Bitcoin or any other cryptocurrency are insured for up to $100,000,000.00. The insurance is backed by Lloyd’s bank. This amount is, however, for the total company in case it gets hacked or goes bankrupt. NEX allows its lenders to have their earnings deposited every single day, rather than having to wait for a week, month or more. They have an interest rate of 8%, with the option to withdraw anytime.

When it comes to user experience, they are top-notch. On top of that, this company constantly strives to get better and makes new beneficial partnerships quite often. When it comes to cons, there aren’t many. However, one comes to mind. Even though borrowers can withdraw in any of the supported 45+ fiat currencies, lenders are allowed to deposit only stablecoins and fiat currencies. Nexo is currently working on supporting BTC and ETH deposits, but they didn’t make any projection regarding the time of realization of this project.

BlockFi is a company founded by Zac Prince and Flori Marquez. It has raised over $20 million of capital from various firms. The company is young and growing at a fast pace. The company offers a 6.2% interest rate on BTC lending and 3.3% on ETH lending, compounded. Granted, this rate is only for deposits under 10 BTC and 100 ETH. The rates for larger amounts of crypto drop severely. When it comes to borrowers, they get a 4.5% interest rate by using the platform.

There is no minimum deposit, and all your crypto holdings are stored with Gemini. Gemini acts as a 3rd party depository trust that is a licensed custodian with insurance. It has a perfect track record when it comes to preventing hacks and fund losses.

When it comes to cons, there are a couple we can think of. The first one only applies to people that want to lend larger amounts of crypto. BlockFi offers digressive interest rates, meaning that the rates decrease to 2.2% and 0.2% for deposits larger than 10 BTC and 100 ETH. BlockFi also offers fewer choices of cryptocurrencies people can earn interest on as it supports only BTC, ETH, and GUSD. The last con would be that the platform is not FDIC insured (though Gemini – which protects BlockFi user’s assets – has a strong track record for security).

Check out part 3 of our Cryptocurrency Lending series, where we will cover Celsius Network as the third good option for crypto lending.


Categories
Crypto Daily Topic

What Does It Take to become a Blockchain Developer? [Updated]

In the crypto world, blockchain technology is essentially a ledger system on which cryptocurrency transaction data is recorded. Every entry is permanent and immutable, meaning it can’t be altered in any way. The data is then verified through consensus by multiple nodes, which are basically computers, making the technology secure and reliable. 

Given its benefits, virtually all industries, from banking, real estate, health-care, music, to logistics, are working towards integrating blockchain technology into their framework. As technology permeates across industries, there is a rising demand for skilled blockchain developers to help optimize the protocol to suit the needs of a specific industry. 

Considering that the technology is still in its budding stage, starting a career as a blockchain developer places you at the front seat to drive its growth. For those working in the tech field, chances are, they have the necessary foundation required to start a career as a blockchain developer. However, if you have no tech skills whatsoever, it’s still possible to become a blockchain developer, but it’ll take a bit more work and dedication to learn the basics. A good place to start is first understanding the most common programming languages used in most cryptocurrency projects. These languages include; Java, Python, JavaScript, Swift, and Solidity. 

Regardless of your skills level here’s are the essential skills required to kick-start your career as a Bitcoin developer: 

Understand the Principles of Blockchain 

Since most of the developer’s work involves interacting with blockchain technology, it makes sense to have a good grasp of how the entire protocol works. You also need to understand the foundational concepts of blockchain architecture such as; cryptographic hash functions, consensus, and distributed ledger technology. 

To understand these concepts, it’s advised to read through the Bitcoin Whitepaper. However, you’ll need a little bit of guidance to direct your learning curve, which is signing up for short-term certification courses on the same will be helpful. 

Data Structures Proficiency 

Data structures are an integral part of development. In the case of blockchain development, it becomes even more important since blockchain relies on data structures to build scalable and tamper-proof records. 

Besides, as a blockchain developer, you’ll spend most of your time working with data structures such as Merkle trees and petricia trees, among others, as you try to configure the network to meet specific needs. 

Smart Contract Development 

Smart contracts are one of the key components of blockchain technology, especially in a business-focused environment. The concept came into the spotlight after Ethereum used it in its protocol. Since then, almost all upcoming blockchain projects are striving to incorporate smart contracts in their functionality. Solidity, Viper, and Chaincode; are among the top programming languages used to develop smart contracts. So, it pays to invest time in learning these languages. 

Cryptography 

In a blockchain network, cryptography and data structures complement each other, to establish the integrity of the network. Asymmetric cryptography, in particular, is used in blockchain to generate digital signatures for verifying transactions. Also, cryptography algorithms help secure data on the blockchain. 

Web Development 

The majority of blockchain developers end up working in designing decentralized applications. Additionally, blockchain technology uses a huge variety of web-based services and APIs. As a blockchain developer, this demands that you understand both front-end and back-end development, which involves creating an intuitive user interface, request handling for the decentralized apps, and API handling. 

Once you have a good understanding of the concepts above, you need to know that there are two main types of blockchain developers. These are core blockchain developers and blockchain software, developers. Let’s look at what each one of them entails: 

i) Core Blockchain Developers

Core blockchain developers focus on developing the blockchain technology itself, including designing the consensus protocols. They can also advise companies on how to structure their Initial Coin Offerings (ICOs) as well as supervise and plan blockchain projects. 

ii) Blockchain Software Developers

Blockchain software developers use the blockchain protocol to build or design decentralized apps. As such, they can work together with the core developers to come up with unique software based on the protocol developed by the core developers. It is also the role of a blockchain software developer to design smart contracts and the other web development roles, as mentioned earlier.

Currently, most job opportunities lie in decentralized app development, as various industries and businesses strive to incorporate blockchain into their processes. 

Self-taught or Formal Education for Blockchain Developers 

Deciding to become a blockchain developer is one thing, choosing a mode of learning is a whole different thing. 

For starters, taking the self-taught route is appealing to those who already have a career in the tech industry. There are numerous online courses to guide you, so you only learn the required content. You can sign up for Coursera or Udemy courses or checkout GitHub repositories for guided content. Online learning platforms on the same, can also help sharpen your self-taught skills as you interact with other blockchain developers. 

If you are completely new to the tech world and possess no skills, formal education focused on basic concepts such as programming and software development is your best bet if you want to start a career as a blockchain developer. Some colleges these days even offer blockchain development courses as certification programs. So, once you enroll in such a college, you’ll not only learn the basic tech skills but also become a blockchain developer at the end of your program.

Nonetheless, you can as well learn the basic tech skills from online courses and other dedicated pages. Once you have mastered the concepts, including those mentioned above, you can then transition to become a blockchain developer by taking up courses on the same. 

Whether you sign up for online courses or enroll for formal education, remember the only way to perfect your skills and boost your resume is by getting hands-on experience. So, try working on solo projects or collaborating with like-minded developers. There are various online open-source projects you can contribute to sharpen your skills and get the much-needed experience. 

Conclusion

Blockchain is considered the next wave of tech innovation. This explains why well-established tech companies such as IBM, Microsoft, and Samsung are showing interest in this revolutionary technology, as they look to be at the forefront of the growing innovation. Moreover, as the technology is maturing and finding its roots across various industries, this is the best time to start your career as a blockchain developer. 

Categories
Forex Daily Topic

Adapt yourself to the FX Market!

From its very inception. the FX market was devised to guarantee that market insiders had an important advantage over retail traders. Because of the nature and lack of regulation, the FX market is, essentially, an unfair market for retail and non-pro players.

The Playing Field

Agustin Silvani, the author of Beat the Forex Dealer, explains in his book that since information is vital to succeeding in this market, “A player’s positioning on the FX food chain depends on his/her access to information and speed, and with no central clearing exchange, it can be difficult for nonprofessionals to gain access to this information and come up with an accurate view of the market.  

He also states that practices deemed illegal in traditional financial markets are regarded in the FX field as part of the game. Practices such as insider trading, front running, and price shading (adding pips to the current price if in an uptrend or subtracting them on a descending move) are commonly seen in FX with no legal repercussions.

There is no government or central trade book to compare trades, so large institutions are free to do whatever they want to their customers. An FX broker or dealer can quote any price it wishes.

The Dealers

If big banks were a car factory, an FX Dealer would be the salesman, selling the banks’ production. Hence, you need to understand how FX dealers make money to adapt and succeed. 

The dealer’s primary axiom is markets rarely move one-way only, especially in intraday timeframes, which are ranging 80 percent of the time. That means dealers, having bug pockets, will fade strong move, knowing that the price will eventually come back and make a profit. Sometimes they can lose money, but having deep pockets will help them stand considerably more than customers that are deep in the margin. That means that most of the time, the dealer takes the other side of its customer.

The Stones on the Road 

Non-transparent pricing

The FX market is not a centralized market on which the traders have direct access to a general order book. Therefore quotes are subject to manipulation, and traders trusting just the price shown on its MT4 chart cannot be sure if the price is fair or sharded.

Over-leveraging 

Many retail brokers boast about their leveraging ratios as if it were an advantage to traders. Instead, overleverage is the main reason for the blowoff of traders’ accounts.

 Trading against its clients

This practice is widespread among unscrupulous retail dealers. Retail trade sizes are small to be directly sent to the FX mainstream flow. Thus the broker takes the other side of the trade. The broker may wait for enough flow to send it out or simply hold the position and effectively trade against their customers. No dealing desks are the same, but dealers replaced by computers.

Unfair practices

Some retail brokers not only do sharding, encourage overleverage and trade against their customers, but also deny services, complicate trade executions, and finally throw our successful traders since they feel they lose money against them. Cases of denial of withdrawal after successful growth of an account were common on the binary options broker business, but also some examples of allegedly Australian-regulated FX brokers happened. Fortunately, these cases are not the general rule, and there are plenty of fair brokers to choose from.

How to Fight Back

Different price feeds

  • Use a backup feed service such as Tradingview, which is free, fast, and unbiased. Your second feed is like a second eye to the market that confirms your broker’s prices. 

Keep detailed records of your activity

If a trader finds the order is not rightly filled, it must show evidence to the broker. The lack of evidence can defeat a legitimate claim.

Take screenshots of all your trading actions, entries, exits, and any important market activity like strange price spikes not seen in your second data feed.

Check the costs of trading

Sometimes, in some trading pairs, the costs of trading are so high that it takes for hours of activity just to cover the costs. Be smart and don’t trade illiquid and high-spread pairs. 

Use your trading platform only to enter and exit your positions

  • Use limit orders and mental stop-loss levels. Do not give any information about your strategy away.

Money Management

Do not overleverage. We have already said it in our past articles. Don’t be impatient and limit your risk to a percent of your account. Start by 0.5 percent on each trade. After you have the feeling about what that means in terms of drawdown, move it up to 1 percent and, again, see what does it feel, especially on losing positions. If, after some time, you feel you can withstand more drawdown, go on and move it to 1.5 percent and repeat the process.

How much drawdown can be expected?

That depends very much on the percent of losers of your system and the risk size. As an example, if your system is right 60 percent of the time, it is wrong 40 percent of the trades. Typically, there is a 0.01 percent chance of ten consecutive losses. Thus, if we consider ten times the usual risk our max drawdown, we see that 0.5 percent risk on each trade would result in a 5 percent max drawdown, whereas, 1.5 percent risk would mean a trader will sometimes withstand 15 percent drawdown.

Overleveraging

Consider leverage as a tool to adjust your position, but also is the leading cause of failure on FX. Thus limit your trades to 5X leverage on any position.

Diversification

Trade multiple uncorrelated pairs, so losses in one lot can offset the risk in another one. 

Trading

Use technical charts as a guide to where the price goes, but take into account what we have said at the beginning of this article: learn how your broker makes money. Think. 80 percent of the time, the intraday market move in ranges, so look for overbought and oversold prices and fade.

Follow the flow of the market

Let the market tell you the way. Use mental stop points and follow the volatility direction, but don’t chase the trade. Let the price come to your desired levels.

Reward-to-risk of two or more

Use reward to risk ratios over 2 as a way to protect your system of a drop on the percent of winners. A RR higher than 2 guarantees you’re profitable if one over three trades succeed.


Further reading: Beat the Forex Dealer – Agustin Silvani 

 John Wiley & Sons Ltd.

Categories
Crypto Videos

Crypto Lending The Superior Way Of HODLing Part 1 OF 5

Crypto Lending – the superior way of HODLing cryptocurrency (part 1/5)


Bitcoin (and cryptocurrency in general) loans are quickly becoming a hot topic. Crypto lending sites and crypto-backed loans are becoming a new way for the investors, hedge funds, miners, and even the unbanked to utilize and leverage their finances as well as to support their business ideas. The HODLers with their crypto bags can also earn interest on their holdings and gain more financial freedom through earning passive income.

The concept is actually quite simple:

For borrowers: If you need a loan to support your business idea or some other endeavor, you will have to put up a small amount of crypto as collateral. After that, you can get a fiat or a stablecoin to use. You will have to pay back the loan according to the agreement.
For lenders: If you want to lend cryptocurrency, you will put up a certain amount of crypto and earn a predetermined amount of interest from it.
From what we have established, we can see that lending crypto is a great way of utilizing funds when you want to hold rather than trade or sell. However, lending cryptocurrencies doesn’t come without risks. If a bank fails, a chunk of their customer’s funds is insured by the government. If it happens that they go down, their customers are at least partially safe. However, what happens with crypto lending platforms and their insurance? You need to consider things such as safety and insurance policy alongside the things you would usually look for in a lending platform (more talk on that later on in the series).

Crypto lending – introduction

Certain studies have shown that when you have passive income, your stress and anxiety levels are greatly reduced. You also spend more time with friends and family, and you are freer to pursue hobbies and interests.

This 5 part series will cover:
What is Bitcoin lending, and why you should take advantage of the best Bitcoin lending sites to earn passive income

What to look for in a lending platform (We will be covering Nexo, BlockFi and Celsius Network)
What NOT to look for in a lending platform (We will be covering XCOINS and SALT)
Security and insurance policy and the importance of these factors.

Check out part 2 of the Crypto Lending series, where we will talk about Nexo and BlockFI, their advantages and disadvantages, and why they are good lending platforms in general.

Categories
Crypto Daily Topic

Ether Futures: The Definitive Guide

Speaking at an interview late last year, the new chairman of the U.S Commodity Futures Trading Commission (CFTC), Heath Tarbert, said that Ethereum Futures are likely to be launched sometime this year. 

Such a bold declaration, coming from the regulator of one of the largest derivatives markets in the world, will undoubtedly attract institutional investors who are looking to hedge losses in their fiat settled portfolios. 

But before we can examine the impact of ether futures on the crypto market, there is a good chance that the futures contract will not be launched as soon as expected. If at all it will even be possible to launch them in the first place. 

The Road to Launching Ether futures Contract

While CFCT is planning on launching Ethereum futures, the contracts have already been launched, and investors started to trade them on exchanges based outside the U.S. By extrapolating the market behavior on these exchanges, it’s safe to say that ether futures won’t trade in high volumes as anticipated.

On BitMEX, Huobi, and Deribit exchanges, where investors are actively trading ether futures, the contracts’ trading volume is less than 10% compared to that of bitcoin futures. It could be because Bitcoin futures were the first crypto derivatives to be launched, and have actually been in existence for quite some time now. As such, many investors view bitcoin futures as the crypto-asset of choice. Also, the difference in trading volume may be due to the fact that Ethereum is still maturing, and maybe it will eventually catch-up at its own time. 

Even without considering the trading volume, the launch of ether futures may not come to fruition due to the coin’s upcoming change in algorithm. The proposed change in algorithm will see Ethereum move from proof-of-work to proof-of-stake algorithm, making the coin more of a security than a commodity. 

Unlike proof-of-work where holders receive coin rewards randomly, once Ether moves to proof-of-stake, the coin holders will receive annualized rewards. As such, since the returns will be more regular and predictable, the entire Ethereum network will fall under the jurisdiction of the U.S. Security Exchange Commission (SEC). As it is widely known, SEC hasn’t warmed up to the whole idea of crypto-assets. This will likely delay the launch of Ether futures for quite a long time.

More so, the change in algorithm, which will be executed via hard forking, makes investing in Ethereum network riskier now than it would be if hard forking was executed when the network was in its infancy stage.  

Effects on The Crypto-market

Assuming that all goes well and ether futures are launched, the most immediate impact will be on Ethereum prices. 

Going back in time, the launch of Bitcoin futures coincided with the coin’s all-time high prices in the year 2017. Bitcoin pessimists were, therefore, able to enter the market via the futures, leading to a fall of  Bitcoin demand in the spot market. The lower the demand, the lower the prices.

The change in Bitcoin’s price dynamics, prompted the pessimists, as well as the initial coin holders, to short-sell in an effort to make returns off the falling prices, making the prices to decline further. 

History may repeat itself in Ethereum’s case, especially considering that the crypto-market is driven mainly by speculative investors. Yet, the Ethereum blockchain platform has the potential to shift the ETH market prices from speculation demand to benefit-driven valuation. This is possible due to the smart contract feature of the coin’s underlying protocol that allows users to complete transactions such as making a purchase without employing a third-party to oversee the whole process.  

Simply put, ETH isn’t just focused on cashing in the chips; instead, it’s focused on having a real-world use. This way, it’ll stick around for a long time and derive value from its transactional benefits. 

As Wall Street continues to work hard towards embracing cryptocurrencies, the launch of ether futures is critical, as it will incentivize deep pocket investors to enter ETH trade without necessarily owning the underlying asset. This might spark off an aggressive short-selling spree, but it might be a healthy thing for the market since it’ll help shift the focus to the real value of Ether. 

Companies who had raised money through ETH tokens – ERC20 – will, however, be affected if eth futures end up triggering short-selling panic. To hedge against further losses, these companies may resort to selling their token’s value for BTC or fiat currencies. In any case, whatever the resultants effect will likely increase Ether’s trading volume. 

With the increasing trading volume, more tools will be developed for seamless trading. Transactions will be faster, and even the current problems in the crypto-market, such as scalability, may eventually be solved. 

Besides the trading volumes and increased investment, Ether futures will help stabilize prices of the coin itself and, to a certain degree, those of Bitcoin. See, futures are, essentially, contracts to buy or sell a certain amount of an asset at a specific day and time. This is particularly useful when the underlying asset is highly volatile, which is the case with Ether. The rationale is that futures enhance liquidity, which is inversely proportional to volatility. 

Conclusion 

There are lots of mixed reactions about the expected launch of Ether futures. With Bitcoin options also hitting the market in the first quarter of 2020, perhaps, it’s best that ether futures are put on hold. 

For ETH, it’s futures may not attract a significant number of investors, since they are not the first of their kind to be launched. Nonetheless, their market debut will signify the maturation of the crypto-market, earning it mainstream acceptance. If the futures turn out to be as successful as Bitcoin’s, it might open the way for ETH options and other sophisticated trading instruments. 

However, before that, Ether will have to first mitigate the regulatory handle brought about by its algorithm change. Currently, analysts fear that the ETH may start out as a commodity but end up having a tangible value as it gets more decentralized. 


Categories
Forex Elliott Wave

Intermediate Wave Analysis – Motive Waves – Part 2

In our previous article, we covered the main rules of impulsive waves. In this educational post, we’ll present a complimentary set of rules of the impulsive waves.

The Alternation Rule

The alternation rule, as defined by R.N. Elliott, is not an author’s invention, alternation exists from the beginning of the universe, and this is a principle that governs nature. In the same way that the day alternates with the night, bullish market alternates with the bearish.

This rule is the foundation of wave theory; without the alternation, the wave theory would not exist. This rule states, “when two consecutive waves are compared, one must be different from the other and both must also be unique in form.

The essential element that distinguishes the alternation in the wave analysis is time. In other words, this means that if a movement on one wave occurs a reduced time span, the next move should take place in an extensive period compared with the previous move.

In wave theory, we observe the alternation in the following characteristics:

  1. Price: it is the vertical distance that the market advances.
  2. Time: it is the horizontal distance elapsed in the market progress.
  3. Severity: this corresponds to the percentage that price retraces an impulsive movement.
  4. Complexity: corresponds to the number of segments that conforms to the wave sequence.
  5. Construction: corresponds to the type of formation that market develops, for example, flat, zigzag, triangle, etc.

The Equality Rule

  1. The extension rule says that in an impulsive sequence, one of three motive waves must be the most extended. When the wave analyst has identified the extended wave, then, can apply the equality rule that refers to the other two waves that are as follows:1. If wave 1 is extended, then the rule applies to waves 3 and 5.
  2. If wave 3 is extended, then the rule applies to waves 1 and 5.
  3. If wave 5 is extended, then the rule applies to waves 1 and 3.

The equality rule establishes that two of non-extended waves tends to be equal in terms of price, time, or both.

This rule is useful, especially when the third wave is the extended wave, and the fifth fails. However, it is not helpful when the first wave is extended or is a terminal formation.

Superposition Rule

The superposition principle can be used in two different ways depending on the kind of impulsive structure; it means if the motive wave corresponds to a trend movement or a terminal sequence.

If the price action develops a trend movement, then waves two and four will never overlap. In terms of its internal sequence, the motive wave will have a 5-3-5-3-5 sequence.

If the price action follows a terminal move, then wave four will penetrate the second wave area partially. The internal subdivision of this find of waves will follow a 3-3-3-3-3 sequence.

GBPUSD Pair Follows the Elliott Wave Principle

The GBPUSD pair in its 12-hour chart illustrates the Elliott wave principle in the real market.

In the figure, we observe how the GBPUSD pair follows the Elliott wave principle. Firstly, the motive wave has five internal segments that create an upward trend; the third wave is not the shortest, and as shown in the chart, the third move corresponds to the extended wave.

Once finished the five-wave sequence, it starts a corrective move in the opposite direction of the trend following a three-wave structure, which still seems in progress.

Following the alternation rule, we observe that the first wave advanced 625 pips in 17 days, while the third jumped 817 pips in 11 days. Finally, the fifth wave ran 691 pips in 16 days. These measurements enable us to observe that the GBPUSD comply with the extension, equality, and superposition rules.

At the same time, we observe that corrective waves also alternates between themselves. The second wave retraced the movement formed by the first wave in 16 days, while the fourth wave retraced the advances of the third wave during 36 days.

Conclusion

In this article, we extended the toolbox for the wave analysis process, from where rules as the alternation, equality, and superposition, add to the seven basic rules and extension defined in our previous educational post.

In our next educational post, we will present the canalization process, which will allow the wave analyst to understand the price action from the Elliott wave perspective.

Suggested Readings

  • Neely, G.; Mastering Elliott Wave: Presenting the Neely Method; Windsor Books; 2nd Edition (1990).
  • Prechter, R.; The Major Works of R. N. Elliott; New Classics Library; 2nd Edition (1990).
Categories
Forex Course

75. Using Moving Average Crossovers To Take Trades

Introduction

In the previous article, we learned how to use the moving average for determining the direction trend. The Moving Average lines not only helps us in identifying the direction of the market but also tells us when a trend is about to end and potentially reverse. In today’s lesson, we will see how the moving averages can be used to enter trades at the reversal of a trend.

The principle of the strategy is to discover the crossover of the two moving averages on the chart. When the moving averages crossover, it is a sign of market reversal halting the existing trend. So at this point, we need to find a suitable ‘entry.’

Moving Average Crossover Strategy

Let us consider an example to explain the above-discussed strategy. Below, we have a daily chart of USD/CHF on which we have plotted the two moving averages (10-Period & 20-period). We can see the market being in a strong downtrend, and it is also confirmed by the two moving averages, where the ‘faster’ MA is below the ‘slower’ MA.

The next step is to find the overlap of ‘faster’ MA with the ‘slower’ MA from above, which is also known as the crossover of MAs. Once the crossover happens, there is a higher chance of the trend reversing. The below chart shows precisely how the crossover takes place, which means the trend can potentially reverse anytime now.

But, we shouldn’t be directly going long soon after the crossover. We need to confirm the trend reversal. A ‘higher low’ after the crossover validates the trend reversal, and this could be the perfect setup for going ‘long’ in this currency pair.

The below chart shows the ‘higher low,’ which is formed exactly after the crossover. Therefore, we now have confirmation from the market, so we can take some risk-free positions.

As we can see, in the below chart, the trade goes in our favor and hits our initial target. However, aggressive traders can aim for a higher ‘take-profit‘ as the new uptrend can reverse the entire downtrend, which is seen on the left-hand side. The reversal is also confirmed by moving averages where the ‘faster’ MA is above the ‘slower’ MA. The stop-loss for this trade is placed below the identified ‘higher low’ with a take-profit at a new high or significant S&R area.

Conclusion

The crossover strategy works beautifully in both volatile and trending markets, but they do not work that well in ranging markets. This is because the crossover takes place multiple times in the ranging market, and this leads to confusion about the market direction. To find high probability trades, one can also combine the strategy with other technical indicators to get additional confirmation of the trend reversal. In the next article, we shall see how moving averages can act as key support and resistance levels.

[wp_quiz id=”65842″]
Categories
Forex Course

74. Using Moving Averages To Identify The Trend

Introduction

In the previous lessons, we have understood the two types of Moving Averages and the difference between them. We have also seen which Moving Average should be used in different market conditions and the one that must be preferred most of the time. From this crouse lesson, let’s explore the real-time applications of Moving Averages and how we can find accurate trades using this indicator.

One of the simplest, yet important use of Moving Average is to determine the direction of the trend. This can be done by plotting the indicator on the chart and then deciding the position of candlesticks with respect to the line of Moving Average.

The ideal way of identifying a trend using MA is this – If the price action tends to stay above the moving average line, it usually signals an uptrend. Likewise, if the price action remains below the moving average line, it indicates a downtrend.

This approach of establishing the trend is too simplistic and also has a significant drawback. Let us understand that with the help of an example.

Below is the EUR/USD price chart, and we have added a 10-period MA line to it. According to the rules of MA, since the price is above the MA, we should be going ‘long’ in this currency pair.

Due to a news event, price drops suddenly and closes below the MA (in the below chart). So, this changes our plan, which means now we should be thinking of going ‘short’ in the currency pair. But before we do that, let us see what happens to the price in the next few candles.

The below image shows that the price fakes out and does not continue its downward trend. Hence, if we would have gone short, that would have resulted in the price hitting our stop-loss resulting in a loss. Let’s understand the problem with this setup.

The strategy mentioned above is right, but the problem is that we are using a single period MA line stand-alone and not combining it with any other indicator. The best way to use MA for determining a trend is by plotting an extra Moving Average line on the charts instead of just one. It will give us a clearer idea if the pair is trending up or down depending on the sequence of the MAs.

The best way is to check if the ‘faster’ moving average is above the ‘slower’ moving average for an uptrend, and vice versa for a downtrend. In the below chart, we can see that the ‘faster’ SMA is above the ‘slower’ SMA, and this shows the strength of the uptrend. Also, the fake-outs that happen because of news releases will also have less impact on the indication given by the Moving Averages. Combining this knowledge with trendlines can help us decide if we have to go ‘long’ or ‘short’ in the currency pair.

Conclusion

Moving Averages can be useful for establishing the direction of a trend, but it should never be used stand-alone. If not other indicators, additional moving averages itself can be combined with an existing moving average to decide the direction of the trend. In the next article, we will be discussing how we can enter a trade using moving averages and profit from this indicator.

[wp_quiz id=”65733″]
Categories
Forex Basic Strategies

Identifying And Trading The Bullish & Bearish ‘Crab’ Pattern

Introduction

We have learned the importance of harmonic patterns in our recent Forex strategy articles. Also, we have understood how to identify and trade many of the famous harmonic patterns like Butterfly, Bat, Gartley, etc. In this article, let’s explore one last pattern in the harmonic group – the Crab pattern.

H.M Gartley introduced the Crab pattern in 2001, and Scott Carney added the respective Fib ratios to it. Just like the other harmonic patterns, the ‘Crab’ is also a reversal pattern that is used to identify when the trend of an asset is going to end and potentially reverse. There are both bullish and bearish Crab patterns, and they indicate bullish and bearish reversals in the market, respectively.

Each leg of the Crab pattern is denoted by a letter, and in total, there are five swing points – X, A, B, C, and D. Just like other harmonic patterns, there are different rules to trade the Crab pattern. Only trade this pattern and take positions if all of these rules get validated.

Crab Pattern Rules

XA – In its bearish version, the first leg of the pattern forms when the price of an underlying asset decline sharply from point X to point A. It can be any random bearish move. (vice-versa in the case of bullish)

AB – The AB leg is the counter-trend move to the previous leg and must retrace from the 38.2% to 61.8% of the distance covered by the first leg.

BC – Concerning the BC leg, price action changes its direction and goes down to 38.2% or 88.6% Fibs ratio of the AB leg.

CD – The CD move is the last and most important leg of the Crab pattern. So for printing this leg, the price action again changes its direction and goes to counter-trend to XA. The CD leg reverses between the 161.8% of the XA leg.

To identify the Crab pattern, one must follow all the above rules. Take a long or short position at point D as this is where the Crab pattern completes. Below is the pictographic representation of bullish and bearish crab patterns.

Crab Pattern – Trading Strategies 

Trading The Bullish Crab Pattern

The Crab pattern is quite popular in the market, so the respective tool with embedded Fib ratios is widely available in most of the trading platforms. The images we are using in this article are taken from the TradingView tool. If you are also someone who uses TradingView software, you can find this pattern’s charting tool on a toolbar on the left side.

So, first of all, select the Crab pattern charting tool and follow all the above rules to identify the pattern. Keep in mind that the Fibonacci ratios are incredibly crucial to trade the Crab pattern. If you recognize the pattern on a price chart and if you find the Fibs ratios not matching with the pattern rules, it means that the pattern is invalid. So do not trade that pattern.

Identifying The Pattern

The below image is a four-hour chart of the GBP/USD Forex pair. Overall the market was in a downtrend, but when all the rules of the Crab pattern are met, price action changes direction. As you can see below, XA is any random bullish move. The price action then retraces to 61.8% of the AB leg. Furthermore, the price action goes up again and retraces close to the 38.2% Fib level of the AB leg.

At this stage, price action confirms the three moves of the pattern following all the rules. In the end, the last move of the pattern clears that the Crab pattern was genuine. This move of the pattern is the longest one, and it has reached the 161.8% Fib level of the AB leg.

Entry, Stop-Loss & Take-Profit

As the price action confirms the pattern, we have immediately entered for a buy. If you are a conservative trader, make sure to wait for a couple of bullish confirmation candles to enter the trade.

We have four targets (X, B, C, A) to place the take-profit order in the crab pattern. In the beginning, we planned to book full profit at point A, but when the price crosses point B, the market turned sideways. So we have booked half of our profit at point B and then closed our full positions at point A.

We have seen most of the traders placing their stop-loss way below point D. However, that’s a wrong way to do it because they are risking more because of this simple logic – If the price action breaks point D, it automatically invalidates the pattern. Makes sense? In the above image, we can see that we have placed the stop-loss just below the D point, and overall, it was an 8R trade.

Trading The Bearish Crab Pattern

The below Daily chart represents the EUR/USD Forex pair. We have identified the bearish Crab pattern and plotted the Fib ratios on to the chart. As you can see, the market was in an uptrend. The first leg, which is XA, can be considered as a random bearish move. The AB bullish move reached close to the 38.2% of the XA leg. The third leg, BC, goes in the counter direction and retraces to the 88.6% Fib level of the AB move. The last leg is crucial because our decision making depends on this move alone. We can see the last candle reaching close to the 161.8% level of the AB leg, and this confirms the appearance of the bearish Crab pattern.

Entry, Stop-Loss & Take-Profit

We immediately went short in this Forex pair as soon as the final leg of the pattern closed. For some traders, it might be challenging to take a trade on the face of strong buyers. But when the market follows all the rules of the pattern, you can confidently pull the gun. Furthermore, the bearish candles increase the chance of trade working in our favor. Conservative traders can wait for these confirmations and then take the trade. In the end, price rolls over, and prints a brand new lower low.

We have followed the same rules of risk management as we have done with a bullish Crab pattern. However, we were being optimistic and placed the take-profit order at the higher timeframe’s major resistance area. If the market had started moving sideways, we would have booked our profits either at B or C or A. Stop-loss is placed just above point D, as discussed before.

Conclusion

The Crab patterns appear less frequently compared to other harmonic patterns in the market. But when it does, it often provides a high risk to reward ratio trades. If you are new to this pattern, you need a bit of experience and skill set to identify and trade this pattern on the price chart. Once you master this pattern, new trading opportunities will emerge, which can exponentially grow your trading account. In the end, trade the bearish Crab only when it appears in an uptrend, and trade the bullish Crab only when it appears in a downtrend. Only then the odds of your trades performing increase.

We hope you find this educational article informative. If you have any queries, please let us know in the comments below. Cheers.

Categories
Forex Course

72. Understanding Exponential Moving Average

Introduction

In the previous course lesson, we understood the first type of Moving Average, which is SMA. We also saw how spikes could distort the SMA. The solution to this distortion is the Exponential Moving Average (EMA); so, let’s discuss this type of MA in our lesson today.

The EMA gives more weightage to the recent change in prices and does not give much importance to previous data. Learning how to calculate and plot EMA on the chart will provide us with a clear understanding of which Moving Average should be used at different times of the market.

We shall take an example to explain the definition of EMA. This example will also show how the EMA overcomes a significant limitation of the SMA. In the below figure, we have plotted a 10-period SMA on the daily chart of a currency pair. Here we have chosen the USD/CHF currency pair as an example.

Since we are calculating the 10 ‘period’ SMA, we need first to note down the closing prices of the last ten periods days. The prices are as follows:

0.97806,0.97986,0.97528,0.97336,0.97536,0.97461,0.97536,0.97829,0.98156,0.97636.

The next step is to add the above-given numbers together and then divide the result by 10. This equals to 9.76804 / 10 = 0.97680. Therefore, the SMA for the last 10 days is 0.97680. The end of the orange SMA line in the above chart points exactly to the price 0.97860.

Now let us consider a case where, on the sixth day, dollar drops drastically due to a news event that was bad for the US economy. If the sixth candle drops to a price around 0.97000 (closing of all other remaining the same) due to the news release, the new SMA will now be calculated as follows:

(0.97806 + 0.97986 + 0.97528 + 0.97336 + 0.97536 + 0.97000 + 0.97536 + 0.97829 + 
0.98156 + 0.97636) / 10 = 0.97654

The resultant SMA is lower than the SMA we had obtained in the previous step. This means when the price dropped on Day 6, it created a notion that the trend is going to reverse, but in reality, it was just a one-time event that was caused by news. We need a mechanism that will filter out these spikes so that we don’t get the wrong idea. This is where EMA comes to our help.

Taking the above example, EMA gives more stress on the recent price movements, such as the closing prices of the last four candles. This means the spike that happened on the sixth day will be of less value and wouldn’t have much effect on the moving average. It is always a smart and better idea to focus on what traders are doing recently rather than what happened long ago. Always remember that the past data is of less significance to us.

The below chart shows the difference between the two moving averages when they are plotted simultaneously.

Notice that the purple line (10-period EMA) appears to be closer to the candles than the orange line (10-period SMA). This means the EMA is more accurate in representing the recent price action, and now we know why. So, the bottom line is to pay attention to the last few candles rather than candles of last week or last month.

Conclusion

That’s about the two types moving averages with their own advantages. The EMA is a better option to use when you are swing trading as it gives precise analysis than SMA due to the reasons mentioned above. EMA, too cannot be used standalone and should be paired with a trading strategy. In the next article, we will discuss the pros and cons of using SMA and EMA.

[wp_quiz id=”65573″]
Categories
Cryptocurrencies

Is Celer Network the Most Advanced Layer-2 Scaling Platform?

While the first generation of blockchains inspired us with dazzling qualities such as decentralization, immutability, and radical transparency, it has also proven to have scaling issues as interest in cryptocurrency surges. For this reason, many cryptos have sprung up to address the scaling issue and even do even more. 

The Celer Network is one such crypto project, and it promises to provide a new blockchain experience for users through interactivity, topnotch security, and low or zero fees to create and interact with decentralized applications and smart contracts.  

The Celer Network is the brainchild of a team with PhDs from some of the most prestigious universities in the world, including MIT, UC Berkeley, Princeton, and experience from tech giants like Google, Amazon, Cisco, HP, and more.

In this article, we go deeper into the Celer Network and discover what makes it stand out from other crypto projects.

Crypto’s Scalability Problem

As cryptocurrency has become more popular in recent years, it has become clear that the traditional architecture of blockchain cannot really support millions of users. Nothing has made this clearer than Cryptokitties, a game atop Ethereum’s blockchain that allows users to buy, breed, and sell virtual cats. 

This game became so popular, with a massive surge in users, that the Ethereum blockchain couldn’t support it optimally anymore. As such, transactions took days to be completed. The developing team had to increase transaction fees to reduce the traffic on the blockchain. 

The Celer Network

Breaking down Celer

At its very core, the Celer Network comprises two components: 

  • cStack – Celer’s off-chain architecture that can be integrated on different blockchains
  • cEconomy – the network’s cryptoeconomics (combination of cryptography and economics) model. 

cStack

cStack features these layers: 

  1. cChannel: A generalized state channel and a side chain suite that maximizes utilization of liquidity
  2. cRoute: An optimal transfer route with high throughput 
  3. cOS: A developed framework that supports off-chain enabled applications
What is cChannel? 

As an off-chain solution, cChannel utilizes the two underlying components of off-chain platforms: state channel and sidechains. 

A state channel is one that allows two-way communication between participants, allowing them to conduct transactions outside of the blockchain. A state channel has these characteristics: 

  • A segment of the blockchain is locked up via a smart contract arrangement
  • Participants in a transaction sign off transactions among each other without involving miners at all 
  • After the channel closes, the final state is added on the main chain  

Some state channels deal with payments only. Celer’s state channel tracks all the programs that may occur between the parties, including payments. 

Why Are State Channels Important? 

To understand why state channels are useful, think of the blockchain. As an example, on the Bitcoin and Ethereum blockchains, users have to wait until a supermajority of nodes in the network vote for transactions to go through. Also, as more users interact with the network, this voting process takes longer. As you can see, this process is slow and unideal.

This is where state channels come in. Since transactions are taking place between two parties instead of passing through the mining verification process, they are simple, direct, and quick.

State channels also provide strong privacy. Blockchain transactions are available on a public ledger, and thus, anyone can see them. But state channel transactions are only known between the two transacting parties.

Celer network hopes to create a ‘state channel network,’ which is a network of individual state channels designed such that they can route state changes through each other. Via such a network, users may not have open channels with each other, but they can open a virtual channel between themselves.  

What is cRoute?

To understand the Celer network’s cRoute, let’s do a quick run-through of the problems with existing state channels, mainly the Lightning Network and the Raiden network. 

State channels depend on state routing, which determines the speed and volume of transactions on a state channel, which is why it needs to be designed efficiently.

The Lightning Network uses “Flare,” a type of Landmark Protocol, while the Raiden Network utilizes the A* tree search, a mechanism designed to look for the shortest routing path. 

Both these mechanisms are scrambling to find the “shortest route between two points.” While this mechanism helps put out a good throughput, it changes network topology (arrangement of the elements in a communication network) and, as such, interferes with the overall balance of the network. 

Distributed Balanced Routing 

Celer hopes to remedy this using the Distributed Balanced Routing (DBR). DBR provides for transparency and network balancing in the routing process. DBR is akin to a river flowing downhill. It doesn’t know its final destination. It just follows gravity. Here are the benefits of the DBR algorithm:

  • Provably optimal: It tracks the most optimal route for transfer requests
  • Channel balancing: Each state channel is built to maintain balanced transfers for the network’s topology
  • Complete decentralization: Its decentralized algorithm provides for each node to only need to communicate with its neighbors.
  • Failure-resistant: the DBR algorithm can detect and adapt to unresponsive nodes ultra-fast. If some nodes fail, the remaining nodes will pick the slack and still deliver the maximum possible throughput.
  • Privacy: Thanks to DBR’s multi-channels, transactions are accorded a high level of privacy without the need for additional privacy settings or tools. It can also integrate Tor-like routing to ensure anonymity.

cOS

coS is a framework that aims to help developers build decentralized applications (DApps) of a high level of abstraction. (Abstraction means creating a system such that the average person can use without the need to know the complex technology behind the scenes.)

Via cOS, developers will be able to create two categories of DApps:

  • Simple pay-per-use applications: These applications will allow users to receive small payments from the real world and stream them through the payment network.
  • Complex multi-party applications: These applications will improve the current smart contract models with new techniques such as metaprogramming and annotation processing.

cEconomy

cEconomy is the second most important value proposition of Celer. This cryptoeconomic model aims to ensure that the network’s ecosystem remains stable and functional at all times. It plans to achieve these trade-offs via these mechanisms:

Proof of Liquidity Commitment (PoLC), which is a virtual mining process tasked with acquiring liquidity for the off-chain ecosystem. The Celer Network has members known as “Network Liquidity Backers” who commit their liquidity (like ETH) to the Collateral Commitment for a certain time, after which are rewarded with CELR tokens as a reward. This is what maintains liquidity in the network.

Liquidity Backing Auction (LiBA), which helps off-chain service providers obtain liquidity through a crowdlending model. A lender’s priority status is determined based on the amount of solicited liquidity and the size of the stake in CELR.

State Guardian Network, a special side-chain that protects off-chain states when users are offline to ensure the availability of the network. To become state guardians, CELR token holders need to stake their CELR with the SGN, upon which they become eligible guardians.

What is CelerX? 

CelerX is a Celer app and the only layer-2 application available on Android and iOS. Through the app, users can: 

  1. Use Celer Pay to instantly money with zero costs
  2. Play a variety of games with zero or ‘millisecond’ latency and stand a chance to win prizes

Since its launch, CelerX has reached $1.4m+ in total prizes awarded, 11,000 players, and 300,000 matches from 88 countries. 

Funds deposited on Celer Pay are in your complete control at all times. CelerX uses the ERC-20 Game Token (GT) through which users can practice games like Solitaire Win, Fishjump, Diamond Break, Frog Jump, Fruit Punch, etc. in the app. 

The app provides competitions for approximately 80% of the world and 38 US states. As of February 25, 2020, users from these US states are not eligible for the games due to gaming restrictions in the states: Arizona, Arkansas, Connecticut, Delaware, Florida, Lousiana, Maryland, Montana, South Carolina, South Dakota, and Tennessee. Users from Maine and Indiana are prohibited from card games.  

Crypto-based games have proved to be a hit with the masses (cue Cryptokitties), and CelerX hopes to capitalize on this by providing a platform for skill-based gaming mobile-based e-sports. Through the app, users can buy cryptocurrencies through credit cards, Paypal, and ApplePay – a first not only in blockchain-based gaming but the mobile gaming industry itself.  

Tokenomics of Celer

The Celer token helps keep the network’s liquidity stable while also acting as a medium for payments and transaction fees.

These are the Celer token values as of February 25, 2020. The token is trading at $0.003660 at a market rank of #289. Its market cap is $13, 262, 362, and its 24-hour volume is 4, 825, 975, with a circulating supply of 3, 624, 044, 542. It has a total supply of 10 billion and a maximum supply of the same value. Its all-time high is $0.0302469 on March 25, 2019, while its all-time low was $0.003150 on January 24, 2020.

Closing Thoughts

Celer Network is not another run-of-the-mill crypto scalability project. It utilizes clever layer-2 solutions that put security and privacy at the forefront, always. Its CelerX app model is peerless, as is its cStack and cEconomy components. The project shows a lot of promise, and it will be interesting to see how it pans out in the future. 

Categories
Forex Course

71. Basics Of Simple Moving Average

Introduction

In the previous lesson, we understood the definition of Moving Average, their importance, and the significance of ‘length’ in MAs. We also learned the correct way of choosing the ‘length’ while using Moving Averages. In the upcoming articles, we shall see and understand the different types of moving averages. Let’s start off by learning the first type – Simple Moving Average (SMA).

Simple Moving Average

The SMA is a very simple Moving Average that is calculated by the summation of the last ‘n’ period’s closing prices and then by ‘n.’

Let us understand the above formula with an example.

When we plot 10 ‘period’ SMA on a 1-hour chart, we add the closing prices of the last 10 hours, and then divide it by 10. Similarly to plot a 5 ‘period’ SMA on a 4-hour chart, we need to add the closing prices of the candles in the last 20 hours and then divide that number by 5. These calculations are coded and embedded in the form of indicators. These indicators will be available in almost all of the trading platforms. All we need to do is to pick the indicator from the tools bar and plot them on the charts by selecting the appropriate period and timeframe.

In the below chart, we have potted three different SMAs on the chart. This chart represents the 1-hour time frame of a currency pair. As we see, longer the period of SMA, more it lags behind the price. This explains the reason why the 60 ‘period’ SMA is farther away from the 30 ‘period’ SMA; because the 60-period SMA adds up the last 60 periods and divides it by 60 as mentioned above.

When the period of an SMA is large, it reacts slowly to the price movement. Essential, SMA shows the overall sentiment of the market at any given point in time. However, SMA should always be used to find the direction of the market in the near future but not take trades based on this information alone.

Instead of looking at the current price of the market, we need to have a broader view and predict the direction of the future price movement. Using SMA, we can say if the market is in an uptrend, downtrend, or if it is moving sideways.

One major drawback of SMAs is that they are vulnerable to spikes. So, during the calculations, the prices of the currency pair, which is of no significance (high or low of spike), will be added up and shown by the SMA line. The reason behind less significance to the prices of spikes is because they give false signals, and we might think a new trend is developing, but in reality, it is just a failure of the price.

The below figure shows how the SMA would be when there are too many spikes in the chart. As we can see, the 10 ‘period’ SMA is not uniform and is not able to show the direction of the market in the occurrence of spikes.

Conclusion

The SMA should be plotted to know the market trend when it is not clear. It can also be used to forecast the price movement in the near future. It is very important to combine this indicator with a trading strategy as it can never produce the results when used standalone. In the next lesson, we shall introduce another type of moving average and see how it can solve the issues we face with SMA.

[wp_quiz id=”65345″]
Categories
Forex Course

70 – Introduction To Moving Averages

Introduction

After understanding various applications of the Fibonacci indicator, it’s time to learn about the next best indicator in technical analysis – Moving Average. MA is one of the most popular indicators in the technical trading community. This indicator, just like the Fibonacci Indicator, has a lot of applications and is commonly used by traders for different reasons.

A moving average smoothens the price movements and its fluctuations by eliminating the ‘noise’ in the market. By doing this, MAs shows us the actual underlying trend. A moving average is computed by taking the average closing price of a currency for the last ‘X’ number of candles. There are many moving averages depending on the number of periods (candles) considered.

Below is how a 5-Period Moving Average looks on the price chart.

One of the primary applications of the Moving Average indicator is to predict future price movements with high accuracy. As we can see in the above chart, the slope of the line determines the potential direction of the market. In this case, it is a clear uptrend.

Every Moving Average has its own level of smoothness. This essentially means how quickly the MA line reacts to the change in price. To make a Moving Average smoother, we can easily do so by choosing the average closing prices of many candles. In simpler words, higher the number of periods chosen, smoother is the Moving Average.

Selecting the appropriate ‘Length’ (Period) of a Moving Average

The ‘length’ of the Moving Average affects how this indicator would look on the chart. When we choose an MA with a shorter length, only a few data points will be included in the calculation of that MA. This results in the line overlapping with almost every candlestick.

The below chart gives a clear idea of a small ‘length’ Moving Average.

The advantage of a smaller length moving average is that every price will have an influence on the line. However, when a moving average of small ‘length’ is chosen, it reduces the usefulness of it, and one might not get an insight into the overall trend.

The longer the length of the moving average, the more data points it ll have. This means every single price movement will not have a significant effect on the MA line. The below chart gives a clear idea of a long ‘length’ moving average.

On the flip side, if too many data points are included, large and vital price fluctuations will never be considered making the MA too smooth. Hence we won’t be able to detect any kind of trend.

Both situations of choosing ‘lengths’ can make it difficult for users to predict the direction of the market in the near future. For this reason, it is crucial to choose the optimal ‘length’ of the Moving Average, and that should be based on our trading time frame and not any random number.

Conclusion

Moving Averages generate important trading signals and especially when two MAs are paired with each other. They give both trend continuation and reversal signals with risk-free trade entries. A simple way of reading the MA line is as follows – A rising MA indicates that the underlying currency pair is in an uptrend. Likewise, a declining MA means that the currency pair is in a downtrend.

In the next article, we will be learning two critical types of moving averages – Simple Moving Average and Exponential Moving Average, along with their applications on the charts. Stay Tuned!

[wp_quiz id=”65304″]
Categories
Crypto Daily Topic

An Investor Loses $45m worth of Crypto via a SIM Attack 

The crypto community is still reeling from the news of an alleged theft of $45 million worth of crypto from an investor through a SIM-swap attack. The attack is thought to have been a $30M Bitcoin Cash Attack and a $15m Bitcoin attack.

Using the username zhoujianfu, the alleged victim of the attack posted a link to the transaction history of Bitcoin Cash on Reddit’s Bitcoin community platform, adding: “is my address, goddamnit. It only had three confirmations, if any miners/the community can help somehow, I’ve got the private keys. Help help help…big reward, obviously.” He added, “Also for what it’s worth, they got $15m in BTC too…” The first post has since been deleted. The Reddit account appears to belong to Dreamhost founder, Josh Jones.

Due to the sheer magnitude of the attack, many community members had trouble believing its legitimacy. Some believed it was a troll attempt while others thought it was negligent to entrust crypto holdings in a SIM company.

What is a Crypto Sim Hack?

A crypto SIM attack happens when someone pretends to be you and convinces your mobile service provider that you have to transfer your phone number into a new phone. In reality, they’re taking your phone number and associating it with a different SIM card in their possession.  

You’ll know a SIM attack is successful when your phone stops registering the four network bars, and you can’t call or receive a call. Once a hacker gains control of your number, any information tied to it is now in their hands, including data, phone calls, text messages, passwords,  email, social media, bank accounts, and crypto holdings information. Not to mention that your 2-factor SMS authentication with your wallet is now in their hands. A hacker looking to steal cryptocurrency will usually scour for proof of crypto holdings and use your passwords to steal your crypto.

How to Protect Your Crypto from a SIM Attack?

Note that crypto transactions are irreversible, which makes a case for securing your assets even stronger. Storing your crypto information makes them susceptible to attacks – SIM swaps are an unsophisticated but effective method of transferring somebody’s information.

The first thing to know is that you should always store large amounts of crypto holdings in a secure location. Such a location and the safest thus far for crypto is a cold storage wallet. Cold storage wallets are those that when signing in or transacting, you don’t need to interact with an online server, i.e., your private key is stored offline. As such, a hacker can’t gain control of your crypto account through hacking, impersonation, phishing attacks, and so on.

With cold wallets, you can store keys in devices such as a CD, a paper, hard drive, and so on. A paper wallet is a paper document that has your public and private keys written on it. It has a QR code that will be scanned when you want to make transactions. Remember that you need to protect your paper document from damage from fire, water, and wear and tear.

Also, beware that hacking paper-wallet generator pages is likely to happen. A better procedure is to download a paper wallet app, copy it to a computer not connected to the internet or to a virtual machine, blocked from an internet connection, and create the keys there. For more on pitfalls of paper wallets, read this thread.

A hardware wallet uses an offline device to generate your private keys offline. These wallets look and function a lot like a USB device. When looking for a good hardware wallet, go for popular and time-tested wallets such as Ledger Nano, TREZOR, KeepKey, ColdWallet, ColdCard, OpenDime, and so on.


Categories
Cryptocurrencies

Private, Public and Consortium Blockchains

Bitcoin brought with it blockchain technology – the technology that allows digital information to be distributed but not edited or copied. After it became a hit with Bitcoin, eager innovators from all over the world have made it their mission to replicate it in nearly every conceivable industry. From finance to healthcare to supply chains, industries are experimenting with blockchain to improve efficiency, transparency, and accountability in their systems.

What is Blockchain? 

A blockchain is a database whose entries cannot be deleted or edited but only distributed. It’s a time-stamped series of transactions that are immutable and whose data is managed by a network of computers.

Cryptocurrency, a form of digital money that prevents double-spending, is so far the dominant application of blockchain. Blockchain as a concept had been floated around the computer science space from as early as 1991, but only materialized 18 years later when Satoshi Nakamoto, the anonymous creator of Bitcoin, employed it as the underlying technology of Bitcoin. 

Now, as its appeal has increased in recent years, it has been borrowed for use in all kinds of digital information.

Today, there are three kinds of blockchains: private, public, and consortium chains. This article sets to exploring each of these. Before that, let’s point out three characteristics all three share. 

☑️ An append-only ledger – this means that on a blockchain, you can’t modify or alter what’s already recorded – you can only add to the last block. This procedure greatly reduces the chances of fraud.

☑️ A network of peers – all network participants (called nodes) hold a copy of the database. This setup promotes fairness and autonomy. 

☑️ A consensus mechanism – a blockchain network must have a mechanism through which nodes can agree upon the authenticity of a transaction. This feature promotes a democratic – everyone-has-a-say – process.

What is a Public Blockchain?

A public blockchain is an open-source blockchain. That means it’s open to the public. Anyone and everyone of every age, nationality, or social status is welcome to join the network, have a say, and take part in core activities. Public blockchains are also called ‘permissionless’ since you don’t need permission from anyone to interact with the protocol.

The idea behind public blockchains is self-governance and autonomy. No one dictates the rules, and anyone can join and leave as they wish. As well, all transactions that take place on a public blockchain are entirely open for anyone to see.

Public blockchains are ‘censorship-resistant’ in that they are run by users all over the world, making it hard for any authority or government to control or shut them down.

Also, public blockchains have a token that incentivizes various participants of the network to keep the network active.

The Good

Public blockchains are highly secure, courtesy of being run by computers from all over the world.

They ensure privacy for users in that you don’t leave your personally-identifying details on the chain, but rather transaction information like wallet number, time, and amount.

Transactions are peer-to-peer, meaning users are in complete control of their money with no one capable of freezing their funds

The Bad

Public blockchains like Bitcoin consume a lot of energy, which is expensive and bad for the environment

The majority of public blockchains are pseudonymous, meaning users do not have absolute and inviolable privacy or anonymity.

Some users of the network might have malicious intent, including hacking, stealing of tokens, or network clogging.

Public Blockchain Use Case

Bitcoin is the first-ever and the most well-known application of a public blockchain. 

Bitcoin transactions can be examined by anyone on the Blockchain Explorer. Other public blockchains are Ethereum, Litecoin, ZCash, Monero, Dash, and so on.

What is a Private Blockchain?

A private blockchain is one in which you need authentic and verified credentials to gain access. A private blockchain differs from a public one in that you need permission, depending on your position in the system’s hierarchy, to contribute and maintain the network. People at the top of the hierarchy or those with express access can also override processes as they deem necessary.

A private blockchain makes sense in a business context where managers want to improve efficiency but don’t want to put company data on the public blockchain. As well, a business has the right to amp up privacy restrictions any time they deem fit.

In a private blockchain, there’s the question of who enters entries, who can see updated transactions, who can begin a process, and so on.

The Good

Since only specific users can control the network, there’s no waiting times or periods of high demand which would slow down the network.

Entities that use private blockchains can keep sensitive data from the public while also realizing improved levels of efficiency.

Private blockchains do not have to provide any incentives to participants; neither do they consume massive amounts of energy. 

There is no possibility of downtimes arising from a spike in demand.

The Bad

Without support from computer users all over the world, a private blockchain is prone to stunted growth. It can also be slow to scale up and meet changing customer needs. 

Since they are centralized, public blockchains are susceptible to human error, manipulation, abuse, and other unfair dealings.

Use Case of a Private Blockchain

The best use case of a private blockchain is Hyperledger Fabric, a permissioned blockchain that businesses can deploy on their platform. The blockchain is also available in a plug and play mode, allowing businesses to set it up anytime and plug off when they don’t need to use it.

Walmart is a well-known user of Hyperledger Fabric. The retail giant can now trace the origin of more than 25 food products, from farm to store, to ensure quality levels and food safety.

What is a Consortium Blockchain?

The consortium blockchain is a type of blockchain that combines elements of both public and private blockchains. This is the distinction between a consortium blockchain and either of the two other types:  in a public blockchain, anyone can contribute to the network by inputting entries, validating blocks, etc. In a private blockchain, only a few entities have access to the chain and have the authority to initiate processes, enter entries, and so on. On a consortium blockchain, it’s a handful of equally powerful participants that can access the chain.

After that distinction, the rules of the system are not cast in stone. Some selected individuals may be the only ones who can view the chain, or it can be everyone in the consortium. As long as decisions are arrived at by consensus, they can be rolled out to the satisfaction of all parties.

Consortium blockchains rely significantly on the integrity of the validators. Provided a certain threshold of the validators can act with integrity, the network will work without issue.

Consortium blockchains make sense in the context where multiple organizations operate in the same industry and see it fit to collaborate on certain aspects of their business. This way, they can save on costs and function better individually and collectively. An organization would be motivated to join such a consortium courtesy of information and insights into the industry that they’d gain from other industry players. Sometimes the organizations involved can be termed “frenemies” since they are working together but also competing against each other.

Use Cases of Consortium Blockchains

There are currently many consortium blockchains that exist all over the world. Let’s briefly look at a few below:

☑️BankChain, a platform for banks whose goal is to explore, build, and implement blockchain software. Members of the BankChain community include Deutsche Bank, Bank of Baroda, Lulu Exchange, Kotak Bank, etc. 

☑️B3i, a community of insurers and reinsurers that attempts to improve industry efficiency through blockchain. Members include Liberty Mutual, Swiss Re, SBI Group, Tokio Marine, Allianz, and so on.

☑️Enterprise Ethereum Alliance (EEA), a consortium that aims to promote Enterprise Ethereum, an organization that delivers both public and private Ethereum blockchain for businesses.

Final Words

Blockchain has evolved a lot from the days when it was associated with Bitcoin only. It’s definitely exciting to see it as the new and hot technology that industries of all types are scrambling to get a piece of. And understandably so, because it embodies features that are a first, and which have the potential to revolutionize not just how we do business but also society itself. 

Companies need to choose what type of blockchain they want to get involved with, depending on their end goal and overall objective. Meanwhile, blockchain enthusiasts will be watching for new developments in this thrilling space.

Categories
Crypto Guides

What Are IEOs & How Are They Better Than ICOs?

Introduction

In our previous guide, we learned about what an Initial Coin Offering (ICO) is all about. We also discussed that 2017-18 was the golden era of ICOs, where some of the biggest ever ICOs like EOS, Telegram, and Dragon Coin happened. But what happened after that? ICOs took a hard hit after the Chinese government banned them. Also, there was a lot of negativity in this space after many large ICOs turned out to be scams. So it has been challenging for the Crypto startups to raise funds for their companies ever since the downfall of ICOs. This necessity resulted in the invention of a fantastic solution – Initial Exchange Offering (IEO)

Understanding IEO

In an IEO, any crypto company willing to raise funds for their project will approach a credible cryptocurrency exchange. The crypto tokens sales of that particular company will happen on that exchange, and the companies will have to pay a certain amount of fee and a percentage of tokens that got sold during an IEO. The exchange here is acting as a platform for the companies to sell their tokens.

So basically, Initial Exchange Offering works just like how Initial Coin Offering works without the decentralization part. That means, there is Smart Contract functionality in this process. All the transactions are centralized as they are authorized by the exchange in which the tokens are being sold. This is a win-win situation where the crypto companies can have a smooth fundraising process, and the exchanges can make profits by listing new crypto tokens in their platform.

Working of an IEO

In an ICO, people who are interested in purchasing tokens must send their funds to a given smart contract. But since IEO is a centralized process, interested participants must create an account with the exchange that is undertaking an IEO and complete their respective KYC procedures. Then they must deposit their funds in the exchange wallet and purchase the newly issued tokens using those funds. Most of the deposits are accepted in cryptocurrency only.

Top IEOs Till Now

Unless you are absolutely new to the crypto world, you must have heard about the Binance exchange. This exchange is one of the first ones to start the IEO revolution by designing a platform known as Binance Launchpad. The first successful IEO was of BitTorrent, a popular torrent service provider, and it was launched on the Binance Launchpad. BTT (BitTorrent Token) sales created a record in the world of IEOs by raising more than seven million dollars in a mere fifteen minutes. This company was backed by TRON, so this success isn’t a surprise.

If not for IEOs, it would be impossible for a new crypto startup to raise this amount of funds in hours or minutes. One more notable success story of an IEO is also from the Binance Launchpad only. A crypto company known as Fetch has raised about six million dollars and met the target in less than half a minute. After seeing the massive success of Binance Launchpad, many other exchanges have shown keen interest in this space. Let’s see what those exchanges are in the below section.

Top Exchanges That Embrace IEOs

As discussed, it is a potential business for any exchange for conducting IEOs using their platform. So many exchanges have shown great interest in the recent past to conduct IEOs and increase their visibility as well. Some of the top exchanges include Binance (Binance Launchpad), BitMax (BitMax Launchpad), Bittrex (Bittrex Int. IEO), KuCoin (KuCoin Spotlight) and Huobi (Huobi Prime).

IEOs have many pros over ICOs in terms of legality, security, and ease of access. That’s about IEOs; in our upcoming article, let’s discuss another fundraising method known as STO.

Categories
Forex Course

68. Using Fibonacci Retracements To Place Appropriate Stop-Loss

Introduction

Until now, we have paired the Fibonacci levels with various technical tools to find appropriate trading opportunities. Some of them include support/resistance, trendlines, and even candlestick patterns. In the previous lesson, we also saw how to place appropriate ‘take-profit’ orders to maximize our profits. The uses of the Fibonacci levels do not end here. There is another incredible application of these levels, and that is to find the appropriate ‘stop-loss’ levels. ‘

As a trader, one should always use the ‘Stop-Loss’ orde as they are critical to avoid the risk of bearing huge losses. In some adverse situations, if this order is not used, it would result in a complete drain of trading capital where we can have the risk of losing everything in a single trade. Placing an appropriate stop-loss ensures that we do not expose ourselves to the unbearable risk.

However, placing the stop-loss order randomly might expose us to the risk of getting stopped out very early. So the proper placement of this order is crucial, and it can be hard for traders who aren’t experienced enough. So the Fibonacci tool can be a great help for us in determining accurate stop-loss levels.

Using Fibonacci Levels To Place Appropriate Stop-Loss Orders

In the below chart, we see a big initial move to the upside on which the Fibonacci levels are plotted using the Swing low and Swing high. Using the ‘Fibonacci strategy,’ we can notice a retracement that has reacted fairly well from the 61.8% Fib level, and now if the next candle is green, this could be a confirmation for us to go ‘long.’

We notice in the below chart that the next candle appears to be Green, and now with that confirmation, we can place our ‘buy’ trades with appropriate ‘stop-loss’ and ‘take profit.’ The traditional way of using a stop-loss order is to place it 50 pips away from the point of entry. Most of the novice traders use this method even today. This is said to be a layman’s approach with no suitable reasoning. When we use such methods, there is a high chance of we getting stopped out before the trade moves in our favor.

The below chart shows that how placing a 50 pip stop-loss can prove to be dangerous. We can see the stop-loss getting triggered by the immediate next candle after the entry was made.

Now let’s see how to place the stop-loss order using Fibonacci levels. The strategy is to place the stop-loss at the Fib level, which is below the Fib level from where the retracement reacts and gives a confirmation candle. Taking the above example, since the retracement touched the 61.8% Fib ratio and gave a confirmation candle, the stop-loss will be placed at the 78.6% Fib ratio. This seems to be very simple, yet most traders are not aware of this.

In the above chart, we can see how the price just misses our stop-loss placed at the 78.6 Fib level and later directly went to our take-profit. This shows the precision of stop-loss placement, which was established using the Fibonacci levels.

Conclusion

We must understand that stop-loss determination is a crucial step and has to be calculated mathematically using any reliable technical indicators. Indicators like Fibonacci have a mathematical approach in determining these levels. Make sure to use these levels before going to place your stop-loss levels next and let us know how they have worked for you. Cheers!

[wp_quiz id=”64961″]
Categories
Forex Videos

Master Forex By Trading Double Tops and Double Bottoms

Double Tops and Double Bottoms

In mastering technical analysis, one of the key pattern formations is the double top and double bottom, and it is essential that you understand what this is, and that you develop your skills for identifying it, and implementing it in your trading because these patterns will recur time after time. It will provide you with invaluable information when it comes to trading around it.
Double tops and double bottoms will enhance your trading by showing you where potential reversals in price action may occur, whether or not they form the basis of technical support and resistance levels.


Example A


So what exactly is a double top? Let’s take a look at example A, which is a 5-minute chart of the GBPUSD and where only price action is shown on the chart.


Example B


Now, let’s drill down a little further on this chart as per example B, pair and where we have a high at position A and where we have had a pullback, followed by another push higher at position B, and where the price action stopped at the same level as position A, before selling off again.
So what is the rationale behind this double top? Traders read their charts from left to right, because they tell a story of how price action is unfolding as time goes on. Firstly we have the area of support which has seen price action fails to go lower on at least two occasions, which will have been observed by traders, and where price action moved higher from this line, and then ran out of steam at position A, before retreating, and whereby traders would again keenly observes the area of support and therefore started to close out their short positions when price failed to breach the support line while expecting a reversal. This does indeed happen and where we see price action move up to position B, and where traders would have noted the reversal at position A, and used that as a possible area of resistance, and therefore exited their long trades when price failed to move higher than position A, and thus leaving a double top formation.


Example C


In example C, we have the reverse, which is a double bottom formation, where we can see that price has failed to breach the resistance line at positions 1 2 and 3, before moving lower to position A, and where price action failed to move any lower and where it reversed before failing to reach the resistance line, and then has a second attempt to move lower to the support line at position B. Thus forming a double bottom formation.

Incidentally, we can see that eventually, price action does move higher and breaches the line of resistance at position 4, which then becomes a line of support for future price action.

Categories
Forex Videos

Make Money In Forex Using The Ichimoku Cloud indicator!

Simplifying the Ichimoku Cloud indicator for trading the Japanese Yen

The Ichimoku Cloud technical indicator was developed by Goichi Hosoda, a Japanese journalist, in the late 1960s. It is favoured by Japanese traders who use it to predict areas of support and resistance and it also shows momentum. It produces its data on historical price action and is therefore considered to be a lagging indicator.

All types of traders use the indicator for various currency pairs, however it is predominantly used for trading the yen. The Ichimoku Cloud is composed of 5 lines of calculations and where clouds form on charts along with moving averages and lines showing momentum.
The basic principle is that if price action is going on underneath the bottom section of the cloud, it is confirming an area of resistance is above and that a downtrend is likely or happening and if price action is going on above the top section of the cloud it is confirming that the cloud is supporting price action, or that an uptrend is in progress. Another key feature of the cloud is that it should ideal be moving in the direction of the trade that you wish to take.

Example A


Example A, is the cloud component only on a 1-hour chart of the USDJPY pair. We can see various clouds forming on the chart in areas 1, 2, 3 and 4.

Example B


Example B shows us that if we were trading this chart and waited patiently for the above methodology to kick in we have a downwards move on the cloud at position ‘A’ which is followed by subsequent price action to the downside producing 65 pips.
While later on, at position B we have an upward moving cloud and where price action is supported by this set up producing 62 pips. This is simply using the cloud only component of the indicator.

Example C


In example C we have added the moving average components and we are looking for the price action to be above the black MA, and where the black MA is above the green MA, and where our cloud must be ascending to support our buy side trade. Or we need price action to be underneath the the green moving average and where the green MA is below the black MA, and supported by a descending cloud to support our sell-side trade. It is important to note that the calculations for the MA’s in this chart are calculated differently than the usual simple moving averages. The cloud MA’s are based on highs and lows over a period, and then divided by two.

In order to keep things as simple as possible, we have elected not to use the final momentum part of the indicator, because it throws up an awful lot of noise on the chart. One of the biggest criticisms of this indicator is that there are too many components on the chart, thus making it difficult to read. The best way to identify trend is by analysing the shape and size of each candlestick. The larger the candlestick, the greater the momentum.
It is also important to point out that if the indicator is predominantly use for trading the yen currency and we would suggest that you stick to this if you decide to use the indicator because at the very least it shows you you what other yen traders are looking at on their charts. And the bottom line is we want to be trading the same way as the big guns in order to be successful.

Categories
Elliott Wave Guide

Guide to Preliminary Elliott Wave Analysis

We have completed the section that covers the preliminary concepts of the Elliott Wave Analysis described by Glenn Neely. These concepts are explained and include the following aspects.

  1. Introduction to wave analysis. In this section, we introduce the concept of Wave Theory, the benefit of its study, and its pros and cons.
  2. Basic concepts of wave analysis. This section presents the key concepts to understand the wave analysis process.
  3. How to start a wave analysis. In this four-part section, we unfold the essential steps to understand the nature of price movements.
    1. Waves identification.
    2. The concept of directional and non-directional movement.
    3. How to identify the end of a movement.
    4. Waves observation and identification.
  4. How to use retracements to analyze waves. This section, divided into five parts, exposes the use of Fibonacci retracement to discover what kind of Elliott wave movement is in progress.
    1. First Rule. This section presents what occurs when the second wave (W2) retraces less than 38.2% of the first wave (W1).
    2. Second Rule. This section exposes the scenarios when W2 retraces between 38.2% and 61.8% of W1.
    3. Third Rule. This article unveils what kind of pattern is in progress when W2 retraces 61.8% of W1.
    4. Fourth Rule. This article unveils the potential kind of Elliott wave patterns when W2 retraces between 61.8% and 100% of W1.
    5. Rules Fifth to Seventh. In this article, we present what occurs when W2 exceeds over 100% of W1.
Categories
Forex Elliott Wave Forex Fibonacci

How to Use Retracements to Analyze Waves – Part 5

Until now, we studied different scenarios for the retracement of W2 when it is lower than 100% of W1. In this educational article, we’ll review what to expect when the retrace experienced by W2 is higher than 100% of W1.

The Fifth Rule

The fifth rule surges when the price runs in wave two (W2) and its progress extends between 100% and 161.8% of the first wave (W1).

In this case, could exist four possible conditions as follows.

Condition a: this condition occurs if W0 is lower than 100% of W1. As a first scenario, W1 could be part of a corrective sequence, and in consequence, W1 should identify as “:3”. In terms of the Elliott wave formations, W1 could be the first or the second segment of a corrective pattern, like a Flat pattern, a triangle formation, or the center of a Complex Correction.

A second option considers the possibility of a five-wave structure. If it occurs, W1 should label as “:5”, and the structure could correspond to the end of a zigzag pattern.

Condition b: occurs when W0 moves between 100% and 161.8% of W1. In this scenario, W1 should be part of a three-wave structure. It means that we should identify it as “:3”. In consequence, W1 could belong to the first segment of a Flat pattern, a section of a Triangle structure, or the center of a Complex correction.

Condition c: this condition occurs if W0 is between 161.8% and 261.8% of W1. In the same way that condition b, in this scenario, W1 should be part of a corrective formation as a flat (which should be an irregular flat), triangle, or complex correction.

Condition d: occurs when W0 is higher than 261.8% of W1. In this case, W1 likely will be the first part of a corrective structure; then, W1 should identify as “:3”. In terms of the Elliott wave formations, the structure in progress could correspond to a Flat pattern, a triangle, or the center of a complex correction.

The Sixth Rule

This rule will activate if wave 2 retraces between 161.8% and 261.8% of W1. The possible conditions are similar as in the fifth rule and are detailed as follows.

Condition “a”: this condition occurs if W0 is lower than 100% of W1. In this scenario, W1 could be a three-wave structure (labeled as “:3”), and W1 could correspond to a flat, triangle, or the connector of a complex correction. A second scenario considers that W1 could be a five-wave formation (identified as “:5”), then, W1 could be the end of an impulsive movement.

Condition “b”: occurs when W0 moves between 100% and 161.8% of W1. In the same way that Rule 5, condition b, the most probable formation for W1 is a three-wave structure and should identify as “:3”. W1 could be the first segment of a flat, an internal section of a triangle, or the center of a complex correction.

Condition “c”: this condition occurs if W0 is between 161.8% and 261.8% of W1. The structure that W1 develops could correspond to a corrective pattern, which should identify as “:3”, and the formation developed could be a flat pattern with failure in C or an expansive triangle.

Condition “d”: occurs when W0 is higher than 261.8% of W1. In this case, W1 could be part of a zigzag, a segment of a contractive triangle, a flat pattern with a failure in C, or the correction of an impulsive move. In any case, W1 should identify as “:3”.

The Seventh Rule

The wave analyst must use this rule when the retrace experienced by wave 2 is higher than 261.8% of wave 1. In this case, the possible conditions of W0 are similar to rules fifth and sixth, which are as follows.

Condition “a”: this condition occurs if W0 is lower than 100% of W1. In this case, W1 could be part of a three-wave structure (identified as “:3″) developing a complex correction, or a flat with a complex wave B. Another option for W1 could be a five-wave structure (labeled as”:5″) running in the failure of the fifth wave.

Condition “b”: occurs when W0 moves between 100% and 161.8% of W1. In this condition, W1 could be a three-wave structure (identified as “:3”) performing the center of a complex correction, a flat pattern, or a contractive triangle.

Condition “c”: this condition occurs if W0 is between 161.8% and 261.8% of W1. In this case, W1 could be part of a corrective formation as a continuous correction, a flat pattern, or a contractive triangle, and W1 should identify as “:3”.

Condition “d”: occurs when W0 is higher than 261.8% of W1. In this scenario, the structure suggests that W1 could be part of a corrective formation (tagged as “:3”) as a zigzag pattern, the connector of a double zigzag, the center of a complex correction (or wave-x), or a contractive triangle.


Conclusions

In this educational article, we reviewed what should be the Elliott wave structure that W1 build when W2 exceeds 100% of W1. As can be observed, in most cases, the formation developed by W1 corresponds to a corrective sequence.

According to R.N. Elliott’s words, the knowledge of the corrective formations could provide to wave analyst an edge over what should be the next move. In this context, the comprehension of different rules and conditions presented could ease and offer a relevant clue in the wave analysis to the Elliott wave trader.

Suggested Readings

  • Neely, G.; Mastering Elliott Wave: Presenting the Neely Method; Windsor Books; 2nd Edition (1990).
  • Prechter, R.; The Major Works of R. N. Elliott; New Classics Library; 2nd Edition (1990).
Categories
Forex Basic Strategies Forex Daily Topic

Consolidation Length: An Important Aspect of Price Action Trading

In price action trading, new traders at their beginning often ignore an important factor. This leads them towards taking losing entries. In today’s lesson, we are going to demonstrate an example of a winning trade and a losing trade on the same pair. Later, we try to find out what that important factor is.

This is an H4 chart. On the chart, the price heads towards the South with good bearish momentum. Upon finding support, the chart produces three consecutive corrective candles. The sellers must keep their eyes on the chart. A bearish reversal candle, along with a breakout at consolidation support, would be the signal to go short on the pair.

The price action produces a bearish engulfing candle, which closes below the level of consolidation support. The sellers may trigger a short entry right after the candle closes with 1:1 risk-reward. Another point I may add here is the daily level of support is far enough, which allows the H4 chart to travel towards the South a lot further down.

The next candle comes out as an inside bar bullish candle followed by another bearish candle. The sellers are to wait a bit more to hit their take profit level. As things stand, it may not take long. Do you notice something here? Let us have a look at the same chart with more drawings on it.

Does it not offer another short entry? It does, since the daily support level is far enough, as mentioned earlier. Typically, the sellers shall go with 1:1 risk-reward. Let us proceed to the next chart. Do not forget that we have two entries here.

The next candle comes out as a bearish candle as well as closing within the previous candle, though. The first entry does not hit the target yet. It has a few more pips to reach. Things look good for those two entries.

The next candle hits Take Profit level for the first entry. Let us wait and find out what happens with the second one.


The price gets choppy and hits the stop loss of the second entry. Can you find the difference between the two entries? Do not worry about the next level of support. Both entries meet all the requirements for the sellers. However, there is one difference, which is consolidation length. On the first occasion, the price makes a deeper correction/consolidation. On the second occasion, the price makes a shallow correction. Usually, the price travel four times of consolidation length. It means if the consolidation length is 10 pips, the price travel 40 pips in total (from where the trend starts). Thus, the deeper the consolidation length, the stronger the trend gets. In our future articles, we will learn more about consolidation length, breakout, and target. Stay tuned.

Categories
Forex Videos

How To Make Profit Using The Box Trading Strategy – 144 Pips Made!

Simplified trading using boxes produces 144 pips

One of the biggest areas where new traders fall down is because they overload their screen charts with too many indicators. Many professional and institutional size traders will often use price action only to trade. Or may supplement their charts with a minimal amount of indicators, while many prefer draw lines in order to calculate areas where price action has consolidated into a sideways movement. They can then trade where the breakout will occur.

Example A


Example A is a one hour chart of the USDJPY pair, with only price action in the form of Japanese candlesticks. Blue for bullish, or up, and red for bearish, or down. On the face of it, although there seems to be a general bias to the downside, it would be fairly difficult to pinpoint where to enter as the hours roll by.
In order to confirm consolidation or sideways trading, a simple rule applies: price action must have touched at least two areas of resistance and at least two areas of support.
Traders will confirm this on the charts by simply adding a couple of horizontal lines, once they have identified this consolidation, as per the price action. They will then make the necessary trading decision based on the information they see.


Example B


Now let’s look at example B, we always read our charts from left to right, because they tell us a story, and at the beginning of the session in question we can see that at position A, we have a confined area of resistance and support, where we can see that both lines have been touched by price action on at least two occasions. In the example, we have closed off the end of the parallel lines, and thus, we can now identify this area as a box, And where we can see that at position price action punches through the support area, and traders will have gone short at this position.

Example C


If we move on during the course of the training session, we can identify another two boxes, in example C, firstly at position B, and then position C, we’re both have the minimum requirements of 2 touches of the support and resistance lines.

Example D


In example D, we can drill down a little bit more and identify that this pair is consolidating at position A, and then taking a move lower, then consolidating again at position B, before taking another step lower and then consolidating again at position C, and where traders will have picked up on the bias to the downside, and traded accordingly at breaks in the support lines.


Example E


Finally, in example E, let’s take a closer look at the false breakout to the downside at position X. There will always be times when traders are wondering if the market has topped or bottoms out, and this will cause breakouts from our boxes to be quickly reversed, and this happens at position X where we see a break of the support line and where the selling action has run out of steam, and the buyers have come in and reversed price action back into box C. However the move lover still produced 18 pips to the downside on this occasion, which is not an unreasonable amount.

But importantly, price action does not continue up to the area of resistance and begins stalls at position Y, before fading back to the support line and where the second breach at position Z is much more enhanced and producers 45 pips to the downside before price action looks to form the basis of another consolidation period.
The total move lower, just by using this simplified box trading, produced a total of 144 pips.

Categories
Crypto Videos

Surviving a Bear Market! – Crypto Trading Strategies Part 1

Cryptos in a bear market – what to do? part 1/2

Ever since Bitcoin got created (over ten years ago), investors have learned how volatile the cryptocurrency market can be. As the years passed, bull and bear trends have constantly replaced one another, with little to no way of predicting or preventing them. Even the smallest details were enough to change the situation of the market completely.


The biggest growth that cryptocurrencies have ever seen came in 2017 when the bulls took over the market and brought coins to entirely new heights. Those that have invested prior to the bull run, made quite a fortune. However, those that invested while the prices were up — lost a fortune. This was due to a massive market crash that happened in early 2018. The downtrend continued throughout the year, all the way until now.

These days, experts predict a new bull run, as they believe that cryptocurrencies follow an established market cycle. Considering the situation and the state the crypto market was in, investors needed to develop various strategies in order to survive the bear market. These strategies were not necessarily about making a profit but rather preserving money. We will present four strategies that might work in such a situation, and these are as follows:

Shooting
Holding
Buy low – sell high
Diversification
Shorting


Short-selling, or “shorting,” occurs when traders predict that a market is about to decline. If their prediction is correct, they earn a profit as they bet on the market going down. This method works in many different markets and is not limited to just crypto markets.

The most well-known example of shorting happened in 1992 when an investor called George Soros predicted the drop of the British pound and made nearly $1 billion in profit.
Shorting has proven itself to be quite an effective way of making a profit. This way of trading is possible through CFDs (Contracts For Difference) as well as cryptocurrency margin exchanges. By employing this strategy, traders can sell assets that they do not own. Instead, they borrow assets and sell them at current prices, and then rebuy them at (hopefully) lower prices.
If the market moves down, their position goes up, which then lets traders buy the asset at a much lower price, and make a profit. Exchanges such as Bitmex offer its users shorting options based on how much Bitcoin they own.
Shorting doesn’t have to be used for just making a profit. It can also be used for hedging purposes.


If a trader is holding large amounts of a certain asset, such as Bitcoin, they can open a short position to decrease the risk of losing money in case the asset moves in the opposite direction.

Check out part 2 of our How to trade in a bear market guide to learn more about the strategies that can be employed in a downtrend.

Categories
Forex Videos

Why You Will Never Make Money In Forex! Hard Facts!

What is it that successful traders have, that 75% of retail traders do not?

Regulated forex brokers are now required to advertise the percentage of losing accounts, and where this information can usually be found at the bottom of the broker’s website landing page.
If you have the time to flick through a few of these, you will notice that the average amount of retail traders who lose their funds trading CFDs or spread betting runs at well over 70%. So just what are these people doing wrong?
Well, there is no single formula for success in trading Forex, but most new traders do not appreciate that there is a steep learning curve before one can jump in and start trading. Many of them will see a couple of videos on YouTube about trading and think that they are off to the races. When, in fact, trading in the financial markets requires great skill and knowledge.


There is an old adage that: failing to prepare is preparing to fail, and never has that been more true than in the forex market. But let’s say that you have learned about fundamental analysis and how economic factors can affect the value of a currency, and whereby economic data releases can also cause extreme exchange rate fluctuations and where you have done your homework and learned about some technical indicators, and yet you have hit a brick wall and are not trading successfully. What are the professional traders doing that you are not?
Professional Traders are rigid in their approach to trading. They will have developed a trading methodology, and they stick to it like glue. And this is one of the biggest mistakes that new traders fall into: they chop and change their routine, they do not have a designated methodology, developed through trial and error and use many different technical indicators and timeframes, and flit from one currency to another and even one asset class to another such as turning from Forex to stock indices and oil, etc.


It is essential that you choose a time frame to suit yourself and your lifestyle. If you have a busy life and are looking to trade Forex as a supplemental income, do you really want to be trading on a long-term timeframe, such as daily, weekly or monthly charts, where positions could run against you for weeks at a time and cause you stress, worry and sleepless nights? If you do not have a problem with this, fine. But if you are looking for quick in and out trades, on an intraday basis, then you need to be looking at a 5-minute or 15-minute timeframe and certainly no longer than an hourly chart.

And therefore, psychology really does play an important factor in your trading. This is another key area that new traders do not take into consideration when they start their journey into Forex.


Professional traders have discipline, where new traders tend to be eager and haphazard in their approach to trading. A professional trader will be patient and wait until the price action reaches an area that he or she has defined as being the correct level to instigate a trade in order to maximize their profits. Professional traders will have tested their methodology and tuned it to perfection and stick to it without deviation. Therefore, what new traders must do is to find a trading formula that works for them, having first tested it on a demo account. Because if you cannot make money there, you will not be able to make it on a real money account. Once your methodology is working consistently, only then should you consider risking your real money trading Forex.

But the number one key feature that professional traders use consistently is risk control, by implementing stop losses. And the number one feature where new retail
traders lose their money is because of poor risk control, and where a lack of stop losses will see account balances wiped out

Categories
Cryptocurrencies

How to Choose and Accept Cryptocurrency for Your Business

As with any other technology, the digital currencies have revolutionized not just the tech world but also the health, finance, and manufacturing industries. 

Their disruptive aspect can be linked to the underlying protocol, blockchain, which most cryptos run on. 

This technology delivers faster and more secure transactions compared to using fiat currencies. Moreover, there are no central authorities such as banks or government, involved in the transaction. As a result, this lowers the transaction fees saving you money in the long haul.

But, ever since the Bitcoin craze back in 2017, there has been an influx of cryptos in the market. For any business owner, the overwhelming number of cryptocurrency choices can be daunting, especially with reports that some coins are a Ponzi scheme. 

Criteria used to choose the right crypto for your business

So, which criteria should business owners use to choose the right cryptocurrency for their enterprise?

☑️Value of the Coin

Choosing a coin that has high value shields your business from losses caused by the volatile nature of cryptocurrencies. This is especially true since highly valued coins tend to be more stable, meaning their prices don’t change radically. 

The value of a crypto is directly related to its demand. The higher the demand, the higher the value of the coin. 

☑️Usability

The usability of a coin can be viewed in different spectrums, but it all boils down to how users interact with a coin. 

The most basic usability aspect of a coin is in terms of the number of people using the coin. A popular digital coin certainly has a more significant number of users compared to a less popular coin. The idea here is to choose a digital coin that has a good number of users. This way, you can be assured that most of your customers have access to the coin of your choice. 

Also, usability entails the user-friendliness of a cryptocurrency. A coin with a complex interface can be intimidating to a particular demographic of your customer base, thus limiting your products or services to the tech-savvy clientele. 

A coin with an intuitive interface should be easy to perform simple functions such as opening and funding the wallet as well as sending and receiving funds. 

☑️Transfers

One of the primary reasons behind businesses accepting payments in cryptocurrencies is due to the fast transaction associated with the payment process. 

It’s common for business owners to wait for days or even weeks for payments made using a debit card, to reflect in their bank accounts. This can be frustrating, especially if you have urgent bills to pay or need to make a payroll.

While cryptocurrencies offer faster transactions than conventional currency, some aren’t as fast as you would wish. Take bitcoin, for instance. The network on which it operates has a scalability problem, which translates to slower transactions due to its limited blockchain size and frequency. 

Of course, there are altcoins such as Monero, and Litecoin that offer faster transactions and even charge less than bitcoin for sending and receiving funds. These coins take less time to confirm a block, amping up the transaction process. 

How to Accept Cryptocurrency for your Business

There are three main ways of accepting cryptocurrency as a form of tender for products and services. 

Direct Deposit

If you only have a small number of customers using cryptocurrency, direct deposit works best. All you need is to create a wallet and share its address with your customers. 

Ideally, you should partner with an exchange platform to help you create a wallet. This way, it will be easy for you to link your wallet to your bank account, so as to withdraw funds in fiat currency. 

Besides crypto exchanges, you may consider creating a versatile digital wallet with popular providers such as Exodus and Jaxx. With one of these wallets, you can accept any type of cryptocurrency for efficient conversion to conventional currency. 

To make the transactions easier for your customers, you should present your wallet in the form of a QR-code. Customers will just scan the code with their phones, and transfer the agreed amount directly to your wallet. You can request a wallet QR-code from the exchange site you’ve partnered with or use an independent app dedicated to creating one for streamlined cryptocurrency payments. 

Point of Sale (PoS) Equipment

A cryptocurrency PoS equipment is accompanied by a piece of software that automatically links your wallet to your bank account, for a seamless payment experience. The equipment also supports cryptocurrency-based debit cards and even offers withdrawal services in the form of fiat currency. 

Alternatively, instead of buying a cryptocurrency  PoS terminal, you can create a merchant digital wallet and link it to your existing PoS system. Unlike the traditional digital wallet, a merchant wallet comes with unique functionalities that make it compatible with your accounting systems for easy bookkeeping. 

Once you’ve created a merchant digital wallet with your preferred provider, you’ll then receive a public address, private key, and a QR-code. Now, using the instructional manual, integrate these details to your existing PoS system, invoices, and shopping cart. 

Plug-ins and Cash Out

Exchanges such as Binance and Coinbase offer plug-ins that are installed into your online store. It becomes easier to integrate these plug-ins if your store is on popular platforms such as Shopify, WordPress, or eBay. 

Customers can, therefore, shop from your store and check out using crypto, which is then deposited to your wallet address or bank account. 

Boost Your Business by Accepting Cryptocurrency Payments

Accepting cryptocurrency payments gives your business a competitive edge, as technology becomes more integrated into all business operations. Being an international currency, cryptos are also a gateway to broadening your market outreach. 

Of course, there are a few drawbacks with this payment method. Volatility remains the biggest downside to cryptocurrency payment for business services. With such unprecedented price swings, the most viable solution is to convert any cryptos to fiat currency, immediately upon receipt to protect yourself from loss of value. 

In addition to volatility, you should also maintain compliance with regulatory tax schemes that are subject to your jurisdiction. 

Nonetheless, business owners are advised to keep an eye out for cryptocurrency trends and consult experts in the field, to understand every aspect of digital currencies before integrating them into payment systems. 

Categories
Crypto Daily Topic

Bitcoin’s Path to $1 Million: A Mere Speculation or Inevitable Reality? 

nEver since Bitcoin hit an all-time high bull run in 2017, there has been speculation about its potential to hit the $1 million mark. 

John McAfee, with all his controversial personality and expertise in the tech world, has been at the front-seat, fuelling the $ 1 million BTC price speculation. In fact, he’s part of the reason why bitcoin reached $20,000 in December 2017, thanks to his bold prediction on Twitter in November of the same year.

Well, he didn’t exactly predict that it would be worth the $20,000 but instead claimed that the coin would be worth as much as $500,000 by the end of 2020. Although he didn’t get into the specifics of how he had arrived at that number, the prediction spiked a mass adoption of BTC in 2017, resulting in the bull run. 

A few months later, McAfee doubled up the prediction to a $1 million price target. Recently, other notable industry players such as PayPal director & CEO, Wences Caseres, threw in their weight on the prediction, saying it’s possible for BTC to hit $1 million in the next to seven to ten years. 

The Critics

Of course, there are a good number of respectable individuals opposed to the idea that bitcoin is a sound investment, leave alone the price prediction. Warren Buffet, the Oracle of Omaha, describes Bitcoin as a store of fear, not a store of value. Others who doubt bitcoins potential include JP Morgan and Chase Bank CEO Jamie Dimon and Paul Krugman, an esteemed economist and columnist for The New York Times. 

Despite the harsh skepticism facing Bitcoin’s future, it doesn’t mean it is entirely impossible for the cryptocurrency to grow in value, and even surpass the $1 million mark. 

But before that, there are several hurdles the digital currency must overcome to place itself on a path to the highly anticipated price target. 

Scaling Problem

For Bitcoin to experience any massive growth, its market capitalization has to grow first. Case in point, since the first real Bitcoin transaction back in 2010, the infamous Pizza purchase, the crypto’s market cap rose by a whopping 2,300%. This happened after a few weeks of increased adoption/transactions by the general public, who were eager to get a piece of this new digital currency. The increased market cap resulted in an increased BTC price from just $0.0025 to $0.06. 

Unfortunately, Bitcoin’s block size is insufficient to support the high number of transactions required to boost its market cap and eventually achieve the $1 million target. The actual block size is 1 MB, which often causes sluggish transactions even with the current of $178 billion. Keep in mind that the $1 million BTC argument dictates that the market cap must amount to approximately $16 trillion, an equivalent of 13% of global GDP! 

There have been attempts to solve this problem, but its success hasn’t materialized. Two Bitcoin developers created a two-layer solution dubbed the Lightning Network (LN). This off-chain payment tool makes the transfer of BTC funds faster, except that the payment information doesn’t touch the main blockchain unless the transaction link is closed. 

Besides, LN doesn’t completely solve the high bitcoin transaction fee problem, which could jeopardize the network’s adoption among the BTC community. 

Regulation from External Authorities

In line with the idea that there has to be a massive adoption of BTC to propel it to high price points, the current regulatory environment hasn’t been doing any good to the Bitcoin community. As such, more people are finding it hard to fully invest in Bitcoin, considering the negative reviews from government institutions. 

To put into perspective, consider the BitLicense law imposed by the New York State Department of Financial Services (NYSDFS). According to the law, any start-up centered around bitcoin will have to pay an exorbitant fee of about $5,000 to acquire a business permit/license. The worst bit is that it’s not guaranteed that the NYDFS will approve their license request. 

On top of that, there are states with varying bitcoin taxation laws, some of which are unfair. In such states, BTC is treated as an asset, thus subject to capital gain tax. The idea behind this is due to the unpredictable volatility of BTC, which. in an ideal case, would result in a bitcoin holder’s net worth increasing if the coins price were to increase in the first place. Consequently, this discourages business owners who would like to accept Bitcoin payments for their products or services. 

While the government’s interference is aimed at creating a sound atmosphere in the cryptocurrency space, it doesn’t come out well for people who loved Bitcoin’s decentralized nature. That said, there needs to be a bilateral trust between the Bitcoin community and the government, for the digital currency to reach $1 million in value. 

Banking Support

Probably, the major hurdle standing on the way to 1$ million BTC value is the lack of dependable liquidity. If the currency is to be accepted by the masses, they need a reliable option to change their fiat currency to BTC and vice versa. 

Unfortunately, in many countries, the central bank bars the subsidiary banks from offering liquidity options to BTC users. Some credit card companies even probit their users from purchasing cryptocurrencies. There have also been numerous cases of frozen accounts for those trading cryptocurrencies. 

Such strict laws not only discourage new investors but also causes panic selling among the existing Bitcoin holders, resulting in a bearish run in the crypto market. 

The Rationale Behind $ 1 Million BTC Price Prediction

Regardless of the seemingly impossible hurdles to overcome, Bitcoin still stands a chance to come close if not reach the ambitious price target. 

Let’s objectively look at some underlying factors that make the price target more of a reality than a speculation

Technological Growth

In the theoretical stages of technological growth and adoption, every new tech solution or tool starts out with an innovator as the pioneer and first user. Gradually, the tool/solution grows and becomes adopted by the first group of people known as early adopters. The early adopters aren’t big in numbers, but the subsequent mid and late adopters are often in large numbers, thus giving the tech solution in the mainstream attention and usage. 

Bitcoin by itself is a technological solution which in this case, the majority of the coins are held by the early adopters. These are a small group of people who invested in Bitcoin when it was worth pennies. As such, it’s quite safe to say that Bitcoin hasn’t yet achieved mainstream usage and adoption as spelled out in the developmental stages of technology solutions. 

More so, big corporations and the government have realized the importance of blockchain, the underlying cryptocurrency technology, as evident from the launch of Libra ( a digital currency expected to be launched by Facebook, soon). 

The cryptocurrency industry as a whole will, therefore, gain public acceptance placing BTC on its path to $1 million. 

Cushion Against Financial Crisis

Financial recession often results in loss of wealth among the citizens of the affected country. Bitcoin and another cryptocurrency, therefore, stands as a cushion against unpredicted financial crisis since it lacks a central authority controlling it. 

This idea is even more practical in countries such as Zimbabwe and the Philippines, where the local currency has lost much of its value. Bitcoin and other cryptos are an alternative store of value medium, to citizens in such countries. 

The higher the number of people safeguarding their wealth in cryptos, the more likely bitcoin will grow market cap and finally achieve a $1 million valuation. 

Conclusion

Judging from the past bull run, it’s easy to see why Bitcoin’s future cannot be accurately predicted. There are factors beyond the rational market principles that have and could influence Bitcoin prices, making the coin’s price growth subject to speculations. 

Nonetheless, for a stable growth towards high price points, Bitcoins must overcome the setbacks stated above. Only this way, and in combination with factors favoring its growth, will Bitcoin hit and surpass the $1 million price target with little volatility. 

Categories
Crypto Videos

Crypto Exchanges VS Crypto Brokerages Part 1 – Are You Getting The Best Deal?


Crypto exchanges VS. Crypto brokerages – part 1/2

There are two ways that people can trade cryptocurrencies:Over an exchange Or With a broker.

This article will touch upon the basic things a trader has to do when trading cryptos over an exchange, as well as by using an online broker.
Extreme volatility and virtually unlimited profit potential that the crypto market brings got people going crazy about it. As a result, a lot of products and services appeared in the market. Trading via a broker or via an exchange has some differences, and they are not completely clear to the general public.


Signing up/Verification

Exchanges
The process of signing up to a crypto exchange is (in most cases) is as simple as registering on their website. Users are required to provide their email, create a password, and confirm the email address. Some exchanges might require a KYC verification, where you would be required to submit a valid ID as well as a proof of residence. The exchanges usually respond to verification requests within a day. There are, however, some cases where you don’t have to get verified once signed up.

Brokers
Signing up with a broker is, just like with exchanges, not a very difficult thing. In fact, the signup process is almost the same as on a regular exchange. On the other hand, in order to deposit funds and start trading, you will need to verify your account. As a rule, you will have to submit scan copies of either one or two documents: A valid ID or Proof of address.
The verification process is done much slower than on exchanges, as the average time of the verification is 15-days.


Deposits and Withdrawals

Exchanges
Depositing fiat to crypto exchanges can often be a hassle. Most exchanges do not accept fiat-to-crypto purchases. While there are many ways to buy cryptocurrencies out there, these transactions often have high fees and commissions.
On the other hand, withdrawing funds from exchanges can go two ways. If you want to withdraw your cryptocurrencies to a non-exchange wallet, this can be done easily and cheaply. However, withdrawing cryptocurrencies to a fiat currency account can be quite a hassle. Withdrawing cryptocurrencies to a bank account can be an issue as quite a lot of banks don’t accept money from crypto exchanges. The reason for this is that they can’t determine the origin of such money and transactions.

Brokers
Unlike cryptocurrency exchanges, depositing with a broker is much easier. A broker’s client offers a large number of ways to make a deposit. This includes credit cards, e-wallets, bank accounts, etc. You can deposit US dollars, euros, and often times, some other currencies. The ease of depositing simplifies the whole process quite a bit. On top of that, there are no deposit fees whatsoever on almost all brokerages.
As for withdrawals, broker terms are often more attractive than the terms that a cryptocurrency exchange has. While many exchanges pride themselves with low trading fees, they earn money on high withdrawal fees. However, brokers usually charge a fee of between 0% and 3%. This number can vary depending on the withdrawal method.

Check out our part 2 of Crypto exchanges VS. Crypto brokerages to find out more about the differences between the two in terms of trading as well as safety protocols.


Categories
Forex Elliott Wave Forex Fibonacci

How to Use Retracements to Analyze Waves – Part 1

In our previous educational post, we learned to identify the end of a movement. In this article, we will discuss how to use and evaluate retracements in the wave analysis.

Defining Retracement Rules

Glenn Neely, in his work “Mastering Elliott Wave,” establishes a set of rules and conditions to evaluate the retracements that each wave makes.

The first step begins with the analysis of the first movement and comparison of the retracement made in the second move (W2) with the first one (W1). Once we evaluated the retracement of W2, we need to analyze the retracement developed on the previous wave (W0) with respect to the first move.

In summary, depending on the retracement of wave 2 (W2) with respect to wave 1 (W1) and the retrace of wave zero (W0) compared to W1. Neely defined a ser of rules and conditions to evaluate and identify each movement. The set of rules will be as follows.

First Rule

We consider this rule when the second wave (W2) is lesser than 38.2% of the first wave (W1). Once we have measured the retracement made by W2, we must evaluate the previous wave (or wave W0). Under this rule, there are four possible conditions.

Condition “a”: occurs when the high of W0 is below the 61.8% level of W1. However, it is necessary to evaluate the retracement experienced by the previous wave to W0 (it is W-1). Depending on its length, W1 could be identified as “:3” or “:5”. It means that W1 could be part of a corrective or impulsive structure.

Condition “b”: this condition occurs when if  W0’s high is above 61.8% but below 100% of W1. Depending on the length of W-1, W1 could correspond to an impulsive or a corrective wave; thus, W1 could be identified as “.5” or “:3.

Condition “c”: this condition occurs when W0 is above or equal to 100%  of W1 level and less or equal than 161.8 of W1. In this case, we will label as “:5” the end of wave 1. However, under certain conditions, W1 could correspond to a “:3” structure.

Condition “d”: occurs when W0 is larger than 161.8% of W1. In this case, the end of W1 must be identified as “:5”. The labeling means that W1 corresponds to a five-wave sequence.


Conclusions

The evaluation of the retracements experienced by W2 and W0 could deliver insights to the wave analyst of what kind of wave is W1. However, in some cases, it is necessary to evaluate the context of more waves. This study would provide the wave analyst an overview of the Elliott wave structure that the market develops. For example, if the structure in progress corresponds to a terminal movement of a corrective sequence or an impulsive wave in development.

In the following article, we will continue discovering the rules described by Gleen Neely for the wave analysis.

Suggested Readings

– Neely, G.; Mastering Elliott Wave: Presenting the Neely Method; Windsor Books; 2nd Edition (1990).
– Prechter, R.; The Major Works of R. N. Elliott; New Classics Library; 2nd edition (1990).

Categories
Forex Videos

Forex Academy Education For Absolute Beginners Session Six – Advantages Of StartingA Forex Business

Forex for absolute beginners; The advantages of starting a Forex business

The foreign exchange market, also known as Forex or FX, is a decentralized global market where all the world’s currencies are exchanged and is the biggest business on the planet, with over $5 trillion dollars traded each day by banks, financial institutions, traders and investors and since the advent of the internet, retail traders who make up an ever-growing proportion with over 9 million retail traders currently getting involved every day.


Foreign exchange currency rates constantly fluctuate, and essentially, forex traders bet weather exchange rates will go up or down. If they bet a currency exchange rates will move up, and it does, they make money, while if It moves down, they will lose money. Traders can control how much they lose on a trade if they are wrong, but they cannot control how much they win because there is a great deal of skill involved in judging where to exit a trade and take a profit.
The advantage of trading in the forex market is that you can start with minimal investment with some retail brokers allowing you to commence trading with as little as $10, although, you would probably need at least a couple of thousand dollars to realistically make any kind of positive impact to your bank account. You can trade Forex full time, where the market operates 24-hours a day five days a week, or you can just commit to a few hours per day in order to supplement your income or to suit your lifestyle. All trading accounts have a stop loss software feature so you can stop your losses running out of control, and a designated take profit feature, which allows you the ability to not have to be sat at your PC screen all the time monitoring your trades.


Other benefits are that you do not have to buy stock; you do not need an office; you do not need to employ staff. All you need is a computer and a broadband connection. And what’s more, this industry is recession-proof. It simply keeps churning over, day after day. This makes it one of the lowest start-up costs in opening a new business and is one of the main reasons that retail traders have chosen to get involved. What’s more, if you are in the UK you don’t need to pay business rates for an office, you do not need to complete reams of new business start-up documentation or form a new company. All you need to do is trade Forex via a spread betting account, and any winnings are classed as gambling under the current laws and, therefore, not subject to income tax!


However, in order to succeed, there is a steep learning curve. And just like any other profession, you will only get out what you put in; in other words, you will need a Forex education. But do not be alarmed, because here at the Forex Academy we have all the educational tools at your disposal in order to teach you all you need to know about how this market works, and what you will need to do in order to be a consistent winner.

Categories
Forex Course

58. Exploring More Candlestick Patterns – Cheat Sheet!

Introduction

In the previous lessons, we have discussed many candlestick patterns out of which some were single, some were multi-candlestick patterns (Dual & Triple). But there are many more patterns that one needs to be aware of. Since it is not possible to cover each and every one of them, we have picked some of the most profitable and important patterns everyone should be aware of. So, this article basically acts as a cheat sheet for any reference. By referring to this guide, one can get the basic price-action structure of all these important patterns that are mentioned below.

Hammer Candlestick Pattern

It is a single candlestick pattern signaling a possible reversal to the upside. The Hammer is mostly seen after a prolonged downtrend. On the day this pattern is formed, the market will be inclined towards the sell-side. As the candle comes to a close, the market recovers and closes near the unchanged mark or maybe a bit higher.


That is a clear indication of the market reversal. We must take trades only after the appearance of a confirmation candle and not before. So we see a bullish candle on the charts immediately after the Hammer pattern, consider buying the currency pair.

Doji Candlestick Pattern

This pattern is formed from a single candle and is considered a neutral pattern. A Doji represents the equilibrium between demand and supply. The appearance of this pattern indicates a tug of war in which neither the bulls nor the bears are winning.


In the case of an uptrend, the bulls will be winning the battle, and the price goes higher, but after the appearance of Doji, the strength of the bulls is in doubt. The opposite is true in case of a downtrend. If we come across this pattern, we must wait for extra confirmation to take any action.

Piercing Candlestick Pattern

The Piercing Pattern is a two candle reversal pattern that implies a possible reversal from downtrend to an uptrend. This pattern is typically seen at the end of a downtrend. The second candle in the pattern must be bullish and should open below the low of the previous day and closing more than halfway into the previous day’s bearish candle.


We generally will have two options after noticing this pattern. Either we can buy the forex pair to benefit from the uptrend that is about to begin, or we can look at buying ‘options’ to reduce risk.

Engulfing Candlestick Pattern

It is two candle reversal pattern that is formed at the end of a downtrend or an uptrend. Bullish Engulfing Pattern is formed when a small ‘Red’ candlestick is followed by a large ‘Green’ candlestick that completely engulfs the previous day’s candle. For a Bearish Engulfing Pattern, the situation is vice-versa.


The shadows of the small candle should be preferably short, and the body of the large candle should overpower the entire previous day’s candle. When we come across a Bearish candlestick pattern, we must activate our sell trades and vice-versa.

Meeting Line Candlestick Pattern

This pattern is a two candle reversal pattern that occurs in a downtrend. The first candle must be a bearish candle followed by a second long bullish candle that gaps down and closes higher. It has the close at the same level as the close of the first candle.


This pattern only signals partial bullishness and buying strength, but not completely. Traders must look for other signs of reversal than just relying on the pattern stand-alone because just the Meeting Line pattern is not a clear confirmation for a complete reversal of the trend.

Harami Candlestick Pattern

It is a dual candlestick reversal pattern indicating the reversal of a bullish or bearish trend. In Bullish Harami pattern, the first candle is usually a Red candle with a large real body, and the second one is a small Green Candle. It’s opposite in the case of a bearish Harami pattern.        

Traders must look at the appearance of a bullish Harami pattern as a good sign of taking long positions in the market. Likewise, we must be shorting once we confirm the appearance of the bearish Harami Pattern.

Three Black Crows Candlestick Pattern

This pattern consists of three Red candles and predicts the reversal of an uptrend. It does not occur very frequently, but when it occurs, we can be sure that the market is going to reverse.


The first candle in this pattern is a long bearish candle that appears in a prevailing uptrend. The second and third are also approximately the same size and color, indicating that bears are firmly in control. This pattern is most useful for long-term traders, who take short positions and hold them for several weeks.

Abandoned Baby Candlestick Pattern

It is a three candle reversal pattern that occurs during a downtrend. The first candle in this pattern is a bearish one. The second candle is a Doji, which gaps down from the previous candle. The third candle is a long bullish candle and opens above the second candle.


We must take long positions only if the price breaks above the third bar in this pattern. Also, make sure to use a stop-limit order for additional risk management.

Deliberation Candlestick Pattern

The Deliberation is a three-line bearish reversal candlestick pattern that occurs during an uptrend. This pattern is comprised of three bullish candles. The first and second candles have significantly large bodies than the third one.


This pattern signals a bearish reversal of the current uptrend. The confirmation is usually a Red candle that overcomes the midpoint of the second candle’s body. We can take aggressive short positions in the currency pair right after we notice the confirmatory candle. This pattern is rarely seen on the price charts, but it does appear, it is highly rewarding.

Three Line Strike Candlestick Pattern

We have discussed single, dual, and triple candlestick patterns till now. Three Line Strike is the first four candlestick pattern, which signals the continuation of the current trend. This pattern can be found in both bullish and bearish markets, depending on the trend.

In an uptrend, the first, second, and third are bullish, and each candle needs to close above the previous candle. The fourth candle is bearish and closes below the open of the first candle. We can take long positions only after the trend is confirmed by technical indicators like RSI & MACD

Learning to recognize and interpret candlestick patterns is important for anyone who aspires to be a professional technical trader. Perfecting this skill will take time and practice. But once you master these patterns, you can trade with enough confidence as you will know how to read the market better.

That’s about candlestick patterns and how to trade them. In the upcoming lesson, we will see how to trade candlesticks using support and resistance levels. We hope you practice these patterns better and become a better trade. Kindly let us know if you have any questions in the comments below. Cheers.

[wp_quiz id=”61830″]
Categories
Crypto Videos

Changelly Exchange In Depth Review Part 2 – The Cheapest Way To Buy Crypto?

Changelly exchange in-depth review – part 2/3


This is the second out of three parts of the Changelly in-depth review. This part of the review will touch upon the exchange’s tools, its user interface as well as supported countries.

Changelly Tools

The platform released a new version of their mobile app with the feature of a fixed-rate mechanism onboard for both Android and iOS in October 2019. This feature allows users to swap their assets while avoiding the risks of market fluctuations. However, to those who would like to exchange cryptocurrencies at a floating rate, Changelly offers a market fee of 0.25% for all crypto-to-crypto transactions. This rate is considered the industry average at the moment. In addition to these features, users have the ability to buy the desired crypto assets by using their bank card right from the Changelly mobile app. They have the option to explore crypto exchange trade rates in real-time mode.
The app features do not end here. Changelly mobile app gives its users the ability to log in to their original Changelly website account, track the transaction history, store an address list for the most used wallets on the account as well as get assistance from the Changelly team in the support section.

The platform also offers its API as well as a customizable payment widget to any crypto service provider that wishes to broaden its audience by implementing new exchange options. Many wallets are using this feature on top of their web/desktop/mobile applications.

Changelly User Interface

The user interface is one of the most important things for traders, and one of the main characteristics of different exchanges. The user interface at Changelly is quite simple and more intuitive than what you could see with regular centralized exchanges. The reason for this is because:
Changelly is more of an exchange service rather than an actual exchange;
Changelly is made to be used by the inexperienced individuals, which requires user interface simplification.

Restricted Jurisdictions

While Changelly is available in many countries, it restricts users from many countries as well from joining. The platform is not accessible to traders from the USA, Cuba, Iran, North Korea, Crimea, Sudan, Syria, Bangladesh, or Bolivia. Users from other countries that are subject to United Nations Security Council Sanctions List, as well as its equivalents, are not allowed to the user the platform.

Changelly implemented AML/KYC procedure into their service. This means that the platform has the option to ask its users to show “proof-of-funds” as well as to go through the KYC check. The KYC procedure is done only if the Changelly’s automated risk management system marked some user’s transactions as suspicious.
Check out the third and last part of our series on Changelly, where we will discuss the platform fees, deposit methods as well as security.

Categories
Forex Daily Topic Forex Economic Indicators

What Moves the Forex Markets?

Analyzing the Forex Market

There are three ways to interpret the Forex markets: Fundamental Analysis, Technical Analysis, and Sentiment Analysis. But the markets move for just one reason: Supply and demand.
Supply and demand changes slowly or fast, depending on the current economic events, but that change is due to the Sentiment or beliefs of the major operators about what they think are imbalances of the market. That happens when institutional traders believe the current price is not a fair price, and it is due to change in the near or far future. The best strategies combine the tree methods to make the trading decisions, but a trader must always keep in mind the fundamental forces that move the Forex markets.

Fundamental Analysis

Fundamental Analysis deals with the economic and political events and situations that change supply and demand. Among the most important indicators are economic Growth Rates, Inflation, Interest Rates, Government Debt and Spending, Gross Domestic Product, and Unemployment. Fundamental Analysis combines all this information to determine the possible sentiment of the market participants and ultimately forecast the future performance of an asset.

Supply and Demand

Currencies’ prices change primarily driven by supply and demand. If the supply is larger than the demand, the price drops, and if the opposite happens, it goes up. We, as traders, cannot determine if the imbalance of the supply-demand forces is due to hedging, speculation, or monetary conversion. For example, the US dollar moved with strength from 1998 to 2001 when the Internet as the NASDAQ boom drove international investors to participate in the US financial markets in search of high returns. Investors had to buy dollars and sell their local currency, so the Dollar gained strength. At the end of 2001, the political climate changed after the 9/11 event, the stock market fell hard, and the FED started to cut interest rates. Therefore, stock investors moved their capital elsewhere, so they sold the Dollar, and its price dropped.

Capital Flows and Trade Flows

The flows of capital and trade are two major factors in the balance of payments. These two factors quantify the amount of demand for a currency. Common sense tells us that a balance of zero is needed for a currency to hold its value.
A negative number in the balance of payments will indicate that capital is leaving the domestic economy more rapidly than it is entering. Under these circumstances, the currency should move down. The opposite should happen if the balance of payments is positive.
An example of this is the Japanese Yen. Despite the fact of negative interest rates, the Japanese yen has managed to trade mostly moved by its high trade surplus; thus, this currency tends to increase in value. The Japanese government uses a negative interest rate policy and increases the money supply (by printing new money), counteract the inflows of currency coming from the export business to hold the currency’s value to a level not endangering its export business.

The capital flows show a measure of the net amount of currency bought and sold due to capital investments. A positive figure implies that the inflows originated from international investors entering the country exceded those bought by domestic investors abroad.

Physical Flows

Physical flows are originated by foreign investments, directly purchasing real estate, manufacturing facilities, and acquisitions of local firms. These operations require that foreign investors buy dollars and sell their local currency.
Physical flows data are essential, as they show the underlying changes in the physical investment activity. A change in the local laws encouraging foreign investments would boost Physical inflows. That happened in China when it relaxed the laws for foreign investment due to its entry into the World Trade organization in 2001.

Portfolio Inflows

Portfolio inflows measure the capital inflows in the equity and fixed-income markets.

Equity Markets

The Internet and computer technology enabled a greater easy to move fast and easily capitals from one market to another one in the search for profit maximization. A rally in the stock market can be an opportunity for any investor no matter where he lives. If the equity market rises, the money will flow in and drive the local currency up. If it moves down, investors would quit and move their money away.

Fig 1 – US Yields versus Stock Market Cycles

(source: http://estrategiastendencias.blogspot.com/)

The attraction of the equity markets compared to fixed-income markets ( bonds and monetary investments) is growing since the early 90ies. For example, the foreign transactions of US government bods dropped from 10-1 to 2-1.
That can also be verified when we see that the Dow Jones has over 80 percent correlation with the US Dollar Index.

Fig 2 – US Dollar Index and the DOW-30 correlation  (Created using Tradingview)

Fixed Income Markets

Fixed income markets start being appealing in times of global uncertainty due to the perceived safe-haven nature of this type of investment. As a result, countries offering the best returns in fixed income products are more appealing and attract foreign money, which would need to be converted to the country’s money, boosting the demand for this particular currency.
A useful metric to analyze fixed-income flows is the short and long-term yields of the different government bonds. For example, comparing the 10-year US Treasury note yield against the yields on foreign bonds. The reason is that investors tend to move their money to countries offering the highest-yields. Thus, for instance, a rise in yields would signify a boost in the inflow of fixed-income capital, which would push the currency up.
Aside from the US Treasury notes, the Euribor futures or the futures on the Interbank Rate is a good gauge for the expected interest rate in the Eurozone.

Fig 3 – 10-year note yield curves on Industrialized Countries

(from https://talkmarkets.com/)

Trade Flows

Trade flows are needed for import and export transactions. The Trade flows figure is a measure of the country’s trade balance. Countries that are net exporters will show a net surplus. Also, they will experience a rise in the value of their currencies as the result of the exchange transactions, when exporting companies trade the foreign currency for local money, as the local currency is bought more than sold.
Net importer countries will show a negative figure in its trad flow metric, and, since its currency is more often sold than bought will experience a push to the downside.

Economic Surprises

It seems logical that changes in any of the discussed flows would affect the involved currency pair. Traders, though, should focus on economic surprises. That is, data releases that are considerably different from the consensus forecasts. An unexpected figure would shatter the market and likely produce a long-term trend change. The trader should not trade the event itself, but use it to forecast future price trends and plan his short-term trading strategies with the long-term figure in mind.


Reference: Day Trading and Swing Trading the Currency Market, Kathy Lien


Categories
Forex Course

57. Trading Triple Candlestick Patterns – Part 2 (Reversal)

Introduction

We have discussed some of the major triple candlestick continuous patterns in the previous articles. In this lesson, let’s talk about the triple candlestick reversal patterns. Morning Star and Three Inside Up patterns are very well known as they provide some of the most profitable signals. Let’s get right into the topic.

Morning Star Candlestick Pattern

Morning Star is a bullish candlestick pattern consisting of three candles and is interpreted as a bull force. The pattern is formed following a downtrend and indicates the start of an uptrend, which is a complete reversal. After an occurrence of the Morning Star, traders seek reversal confirmation through additional technical indicators. The RSI is one such indicator which tells that the market has gone into an oversold condition and that a reversal can happen anytime.

Below is how a Morning Star Pattern looks like on a price chart

Criteria for the Morning Star pattern

  1. The first candle is a long bearish candle with little or no wicks.
  2. The second candle is a smaller bullish or bearish candle that captures the indecision state of the market, where the sellers start to lose control.
  3. The third and last candle is a long bullish candle that confirms the reversal and marks a new uptrend.

A trader must lookout for a bullish position in the Forex pair once they identify the Morning Star pattern on the charts. Another important factor for traders to consider is to pair this pattern with a volume indicator for additional confirmation.

Three Inside Up Candlestick Pattern

The Three Inside Up is also a triple candlestick reversal pattern. This pattern indicates the signs of the current trend losing momentum, and warns the market movement in the opposite direction. It is a bullish pattern that is composed of large bearish candle, a smaller candle contained within the previous candle, and then a bullish candle that closes above the second candle.

Below is the picture of how the Three Inside Up pattern would appear on a chart.

Criteria for the pattern

  1. The market should be in a downtrend with a large bearish first candle.
  2. The second candle should open and close within the real body of the first candle, which shows that sellers have stopped selling further.
  3. The third candle is a bullish candle that closes above the second candle, trapping all the short-sellers and attracting the bulls.

Traders must take long positions at the end of the third candle or on the following green candle, which provides additional confirmation. This pattern is not always reliable when used stand-alone. So there are chances that the trend could reverse once again quickly. So risk management should be in place before taking any trades. A stop-loss must be placed below the second candle, and it depends on how much risk the trader is willing to take.

Conclusion

The opposite of the Morning Star candlestick pattern is the Evening star. Even this is a reversal pattern, but it signals a reversal of an uptrend into a downtrend. Likewise, the opposite of the Three Inside Up pattern is the Three Inside Down pattern, which reverses an uptrend. Learn about more triple candlestick patterns and how to trade them. The more you research, the better trader you will be. Cheers.

[wp_quiz id=”61446″]
Categories
Forex Course

56. Learning The Triple Candlestick Patterns – Part 1 (Continuous)

Introduction

After acquiring a fair bit of knowledge about Single and Double candlesticks patterns, let’s now proceed and learn the Triple Candlestick Patterns. A Triple Candlestick Pattern, as the name clearly suggests, is formed by three candles. In the next couple of articles, we discuss two Continuation patterns and two Reversal patterns to understand how these patterns are formed. Also, most importantly, we will be learning how to trade these patterns as well. So in this article, we will be discussing the basic & well-known Continuous Triple Candlestick Patterns – Three White Soldiers and Falling Three Methods.

Three White Soldiers Candlestick Pattern

Three White Soldiers is a bullish triple candlestick pattern that predicts the reversal of the short term downtrend. The reversal of this short term trend leads to the continuation of the long term trend, and hence this pattern is classified as a continuation Pattern. This pattern consists of three long-bodied candles that open within the previous candle’s body and close above the previous candle’s high.

Below is how the Three White Soldiers candlestick pattern looks on the price chart

Criteria for the pattern

  1. The second and third candles should open within the body of the previous candle
  2. All three candles in the pattern should not have very long shadows.
  3. The continuation pattern is confirmed by other technical indicators such as the RSI and EMA.

Three White Soldiers pattern is used by traders for both entry and exit. Traders, who were short in the currency pair will look for exit and traders who were following the long term uptrend take a bullish position and enter the market.

Falling Three Methods

The Falling Three Methods is a major trend continuation pattern and is sometimes referred to as five candle patterns because of the confirmation candles at the first and fifth positions. These two long candles confirm the trend and its continuation. The sole of this pattern is the three counter-trend candlesticks in the middle. This pattern should never be considered as a reversal pattern; it is a clear trend continuation pattern.

Below is an image of how the pattern looks on the price chart

Criteria for the pattern

  1. The Falling Three Methods is a bearish continuation pattern with two long candlesticks in the direction of the main trend and three counter-trend candles in the middle of the two big bearish candles.
  2. The series of small-bodied candles should be of the same color. However, a bearish Doji as the third candle can also be considered.

This pattern is used by traders to initiate new short positions or add to an existing one. A trade is taken only after the fifth candle, which confirms that the trend is going to continue. There are also traders who use the 10-day moving average to confirm that the market is in a downtrend. While trading this pattern, one needs to make sure that this pattern is not at the key support level.

Conclusion

These are two famous triple candlestick trend continuation patterns. Make sure not to use these patterns stand-alone. They must be paired with other credible technical tools like indicators or chart patterns to confirm the authenticity of signals they generate. In the upcoming lesson, let’s look at some of the Reversal Triple Candlestick Patterns. Cheers!

[wp_quiz id=”61436″]
Categories
Forex

Forex Hacks – Recurring Shapes & Patterns Part 1 of 2

recurring shapes and patterns Part 1 of 2

When trading from charts, one often finds at certain shapes and patterns recurring time after time. This is because the forex market, just like other financial markets, tends to retrace price action. In fact, over 80% of the movement in price action, within the forex market, is price action retracing.

Some pattern formations in price action, such as price seemingly complying with moving averages, MACD, and stochastics, for example, are very self-evident. However, we know that price action does not move in a straight line, and therefore we need to be looking elsewhere for help in determining the possible future direction in price action movement. Some patterns and shapes are somewhat subjective, but, nonetheless, when a trader realizes that these other patterns and shapes, which recur time after time, exist, it will help add another dimension in the art of forex trading.

Example A


Let’s take a look at example A, which is a one-hour chart of the USDJPY pair. Picking up the price action from the left-hand side of the screen, we can see that after an initial push higher the volatility slows as the pair’s move takes on a more gradual move higher and where we can see the price appearing to arch through 90 degrees to the right. We then find a slight pullback lower where there seems to be a wave encompassing the price action as it moves higher. Other examples have been added and which, on a subjective basis, might show further waves and arches acting as makeshift support and resistance areas.

Example B


Now let’s take a look at example B, which is a 4-hour chance of the GBPUSD pair. This time the shapes are slightly less subjective, and we can see clear examples of triangular formations. They tend to form when there is a spike in the price action in either direction and where the price action fades back to the original levels of the spike and where the base of the triangle is often an area of support and resistance.

Example C


Example C is a 4-hour chart of the CADJPY pair. This is a sight that you may be more familiar with: the box or square. To conform there must be at least two similar exchange rate levels of support and two similar levels of exchange rate levels acting as areas of resistance. The longer that price action is contained in boxes, the more likely of a volatile breakout at some point.

Example D


An example D, we stick with the 4-hour chart of the CADJPY pair, and this time we have added tracks, which are simple moving averages, acting as areas of support and resistance to price action. Traders often draw these tracks on their charts and look for areas where price action breaks out of the tracks, to try and determine future price direction.

Look out for more shapes and patterns in Part 2.

Categories
Forex Videos

The Best Way To Trade The NFP

How to trade US Non-Farm payrolls like the professionals do

The United States Non-Farm payrolls provide a picture of the country’s labor market, and the report usually comes out on the first Friday of each month at 13:30 GMT.
The report measures the number of jobs gained during the previous month and which are not farm-related. The report includes the unemployment rate and average hourly earnings. It is one of the biggest market-moving events of each month. It tells policymakers in the United States if the country is close to maximum employment and will help to determine future interest rates. If job growth is close to the maximum, the Federal Reserve will typically look to raise interest rates, assuming that inflation is where they need it to be, and vice versa.


Example A


In example A, let’s look at a 30-minute chart of the EURUSD for the 10th of January, when the figures were released, and where 164K jobs were expected to be added to the US labor market.
Just prior to the release of the NFP, seller’s drove price action down at position 1. We can only determine that the market expectation was for a strong number, possibly above 164K. However, as marked on our chart at position 2, with the price adjacent to the 30-minute candle associated with the release at position A after the number came out, which was 145K, less than expected, the price action spiked higher to position B before being sold again to position C, an overall move of 27 pips during this period. Buyers then drove the price action higher at position 3, before price action consolidated between an area of support and resistance at position 4. Please note that the time on our chart is set 2 hours ahead of the actual time.

Example B


Let’s now look at example B, which is the same chart, but with some trading ideas. In the run-up to the release of the NFP, we can see that an area of resistance and support has formed at positions A and B and were a sell-off happened just before the release, probably because the market expected a strong number from the United States.
There was an opportunity to go short at position B when price action fell below the support line. A tight stop loss should have been implemented. On this occasion, 17 pips were available to the downside with the possibility of bagging some profit and closing the trade just before the data release.
However, we already know that the data was worse than expected and should have anticipated that the dollar would start to lose ground. We can also see tails developing on some of the candlesticks and a classic V formation, which occurs during this event.
The next trade opportunity is when price action moves higher, and above our previous areas of support at position B, and above our previous area of resistance at position A and where position D offers a buying opportunity, as price action takes out all of the previous highs.
This setup can also be applied in reverse, should the NFP data be better than expected.
If the data is + or – a few thousand as per the expected number, expect a muted response by the market.
Had the number been much better than the 164k, which was expected, we would have likely seen a further decline in the pair. Bear in mind that when this data is released, it is dependent on how the market assimilates it. Sometimes the data may be bad, but not as bad as expected, and sometimes it could be good, but not as good as expected, and often the NFP report is released simultaneously with

the Canadian unemployment release.
Therefore it is not wise to pull the trigger on a trade within a couple of minutes either side of this very important data release. The best way to trade Non-Farm payrolls is in the hour or so before the event or an hour or so after the event.
Keep out for this classic price action formation for each payroll event as it recurs an awful lot!

Categories
Forex Price-Action Strategies

The ABC Pattern’s C Point May Confuse You Time to Time

In today’s lesson, we are going to demonstrate an example of the ABC pattern trading. In this example, the price does not make a full-wave correction to produce C point. However, the signal candle comes out as a strong reversal candle, which drives the price towards the trend’s direction. Let us get started.

The price makes a long bearish move and produces a bullish reversal candle. The price heads towards the last swing high. The buyers are to wait for a breakout at the level of resistance (swing high) first. A correction followed by a bullish engulfing candle at the breakout level would be the signal to go long here.

The chart makes a breakout keeps producing bullish candles. The buyers are to wait for the chart to produce a bearish reversal candle to make a downside correction. Since the chart produces one more bullish candle, it may make a correction soon.

After producing a bearish reversal candle, the price keeps making a correction. Ideally, the buyers would love to see the price come back to the breakout level. However, it is the Forex market. Things do not always go by the book here.

As mentioned, things do not always go by the book. The price does not make a full-wave correction. Nevertheless, look at the bullish reversal candle. The candle closes way above the last swing high. The buyers may trigger a long entry right after the last candle closes. We must remember that this is not an A+ entry as far as the ABC pattern trading is concerned. Let us proceed to the next chart to find out how the trade goes.

The price heads towards the North with good bullish momentum. Typical 1 R is achieved as well. In a word, the long entry gets the profit for the buyers. As mentioned earlier, this is not an A+ entry. The question is, shall we go for such entry?

In most cases, such price action may get us profit. However, if we do not like to take losses, we may skip taking such entry. Especially, in the beginning, traders find it hard to digest losses. Thus, for beginners, it would be best if they skip taking such entry and only go for A+ entry. Traders learn the art of digesting losses with time. Yes, you have read it right. Digesting losses in Forex trading is an art. If you have already learned the art, then you may as well go with an entry like this. In the end, you will be able to come out with a profit.

Categories
Forex Course

54. Learning The Dual Candlestick Patterns – Part 1 (Continuous)

Introduction

In the previous article, you were made familiar with different single candlesticks patterns that gave both continuous and reversal signals. In this article, we shall acquaint ourselves with the rest of the most popular double and triple candlestick patterns. In the following sections of the article, we will talk about the continuous double candlestick patterns – Tweezer Tops and Bottoms & Harami. Both of these candlestick patterns involve two candles, and they indicate signs of trend continuation in the market.

Tweezer Tops and Bottoms Candlestick Pattern

Tweezer patterns are double candlestick patterns that indicate a continuation of the current trend. But a broader context is needed to confirm the signal since Tweezers can occur frequently. A topping pattern occurs when the highs of two candlesticks occur at almost exactly the same level following a bullish candle. A bottoming pattern occurs when the lows of two candlesticks occur at almost exactly the same level following a decline in price.

The idea behind the topping and the bottoming pattern is that the first candle shows a strong move in the direction of the short term trend. While the second candle may be a pause or even a candle that completely reverses the previous day’s action. It means a short-term shift in momentum has occurred, and the price moved in the direction of the long term trend.

The image below shows how the pattern looks and explains the concept clearly.

Charts are taken from Tradingview

Pattern Confirmation Criteria

  • The first candle needs to have a large real body, i.e., the difference between open and close should be preferably big.
  • The second candle can be of any size. But if it is larger than the previous candle, the price can accelerate soon in the same direction.

Traders view this pattern as a potential sign of trend continuation and enter into a new position depending on the broader trend, with a minimum stop loss.

Harami Candlestick Pattern

Harami is a candlestick pattern that is formed by two candlesticks and indicates a continuation in the trend. Let’s discuss the Bullish Harami pattern to understand this concept better. A Bullish Harami Pattern essentially shows that the short term downtrend in an asset is coming to an end, and the market may continue its uptrend.

The pattern is formed by a long candlestick followed by a relatively smaller body. The second candle is completely contained within the vertical range of the previous body.

The chart below shows a Bullish Harami pattern. The few candles before the pattern indicate a short term downtrend in the currency, and the Green candle represents a slightly upward trend, which is wholly contained within the previous candle.

Charts are taken from Tradingview

Pattern Confirmation Criteria

  • It is necessary to have initial candles that indicate a clear short-term downtrend and that a bearish market is pushing the price lower.
  • The second candle needs to close near the middle of the previous candle, signaling a higher likelihood that a reversal of this downtrend will occur, and the price will move in the direction of the major uptrend.

Traders look at the appearance of the Bullish Harami pattern as a good sign of entering into a long position on an asset. This pattern is also combined with single candlestick patterns for confirmation signals. The opposite is the case for Bearish Candlestick Patterns.

While Tweezer Tops patterns are more flexible and easy to identify, Harami has a mandatory requirement of a ‘Doji’ (Candles with tiny body and long shadows) as the second candle. Both of these are trend continuation patterns with a high degree of accuracy. There are many more dual candlestick trend continuation patterns which you should be researching on your own. In the next lesson, we will be discussing double candlestick trend reversal patterns. Cheers!

[wp_quiz id=”60881″]
Categories
Crypto Guides

Lightning Network – A Potential Solution To Blockchain Scalability Issue?

Introduction

Cryptocurrencies that were in the boom a few years back are still in the business, and it is believed that their decentralized blockchain technology will keep them alive for a very long time.

The transactions on credit cards and debit cards are different from that of transactions on cryptocurrencies. VISA (a payment provider) processes about 4,000 transactions per second. In fact, it has a capacity of 65,000 transactions to process per second. But, a typical Bitcoin Blockchain, on the other hand, can process only up to seven transactions per second with a block size of 2MB. Hence, there is a clear issue of scalability. Also, the Bitcoin transaction costs are pretty high when compared to other traditional transaction methods. Thus, to solve this issue, the ‘Lightning Network’ technology came into existence.

What is the Lightning Network technology, and why do we need it?

The Lightning Network technology is a system that is used to process a transaction instantly. This technology was developed to send and receive payments instantly without any hassle and also to reduce transaction fees. In the next section, let’s see the backend of this technology.

Working of the Lighting Network Technology

⚡ A multi-signature wallet with some amount of Bitcoins is set up either by the sender or the receiver.

⚡ The public blockchain network keeps a record of the user’s wallet address and the balance sheet* (smart contract). This process is referred to as the payment channel.

*Balance sheet – An agreement that proves how much Bitcoin belongs to whom.

⚡ When the payment channel is wholly set, the parties can make any number of transactions without the involvement of the blockchain network.

⚡ On each transaction, the parties update their multi-signature wallet to keep track of how many Bitcoins were sent to whom.

⚡ So, basically, the balance sheet is the one that is always updated and not the blockchain network. A copy of this balance sheet is maintained by both parties.

⚡ Finally, when all the transactions are completed, the payment channel is closed. The most recent balance sheet is presented to the blockchain network for verification. And when the transaction is confirmed, the users receive their share of Bitcoins into their wallets.

The Interconnected Lightning Network

A great feature of the Lightning Network is the interconnection in the network. Let us understand this with an example. For instance, let’s say there is a payment channel between P1 and P2. And there is P3 who has a payment channel with P2. Now, if P3 wants to transact with P1, a separate channel need not be created between P3 and P1. P3 can send the coins to P2, and P2 can, in turn, send it to P1 and complete the transaction. Hence, making the Lightning Network interconnected.

The Present and Future

Presently, the proof-of-concept is being implemented on the Bitcoin Testnet. And an experimental implementation is being carried on the Bitcoin Mainnet. In fact, this technology has come into the real world in a few countries, and it ought to grow in the coming years. That’s about Lightning Network and its working. Let us know if you have any questions in the comments below. Cheers!

Categories
Forex Course

53. Trading The Single Candlestick Patterns – Part 2

Introduction

In the previous lesson, we discussed some basic single candlestick patterns, which gave us trend continuation signals. In this lesson, we will look at reversal patterns that are formed by a single candlestick and how traders should perceive them.

These patterns are very important to learn as they indicate clear market reversals. So essentially, when we find these patterns on the charts, we should anticipate a reversal and take our trades accordingly.

The Hanging Man Candlestick Pattern

A Hanging Man is a single candlestick pattern that occurs during an uptrend. They give warning signals that markets are going to fall. This candlestick pattern is composed of a small body, a long lower shadow, and no upper shadow. Since it is a reversal pattern that reverses the current uptrend, The Hanging Man indicates the selling pressure that is starting to increase. Below is how the Hanging Man candlestick would look like.

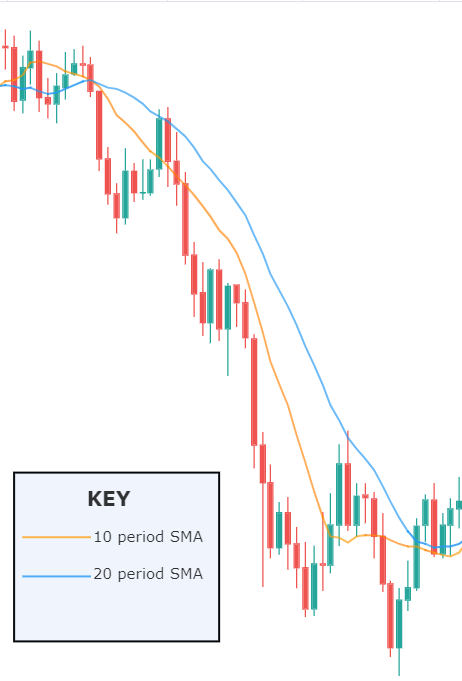
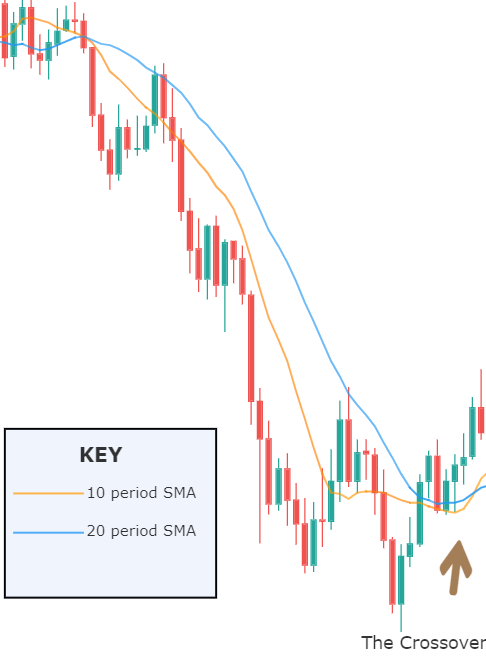
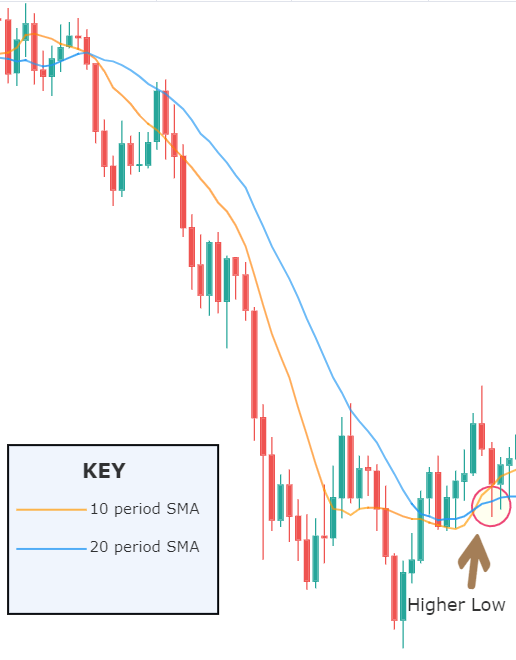
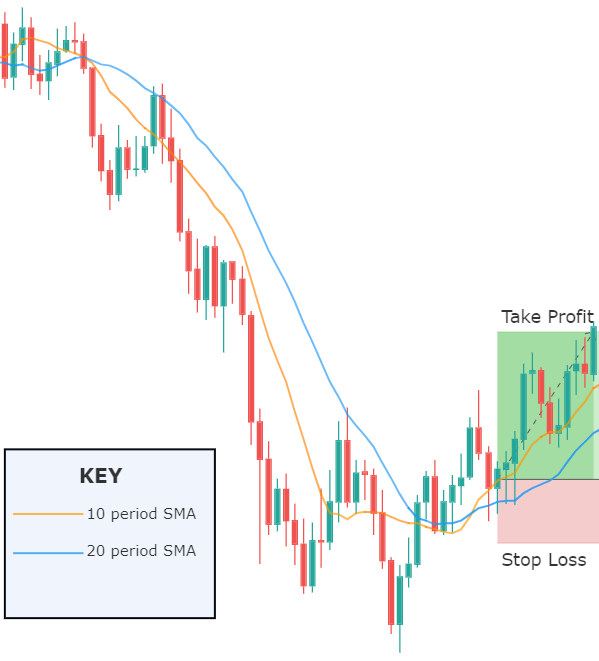
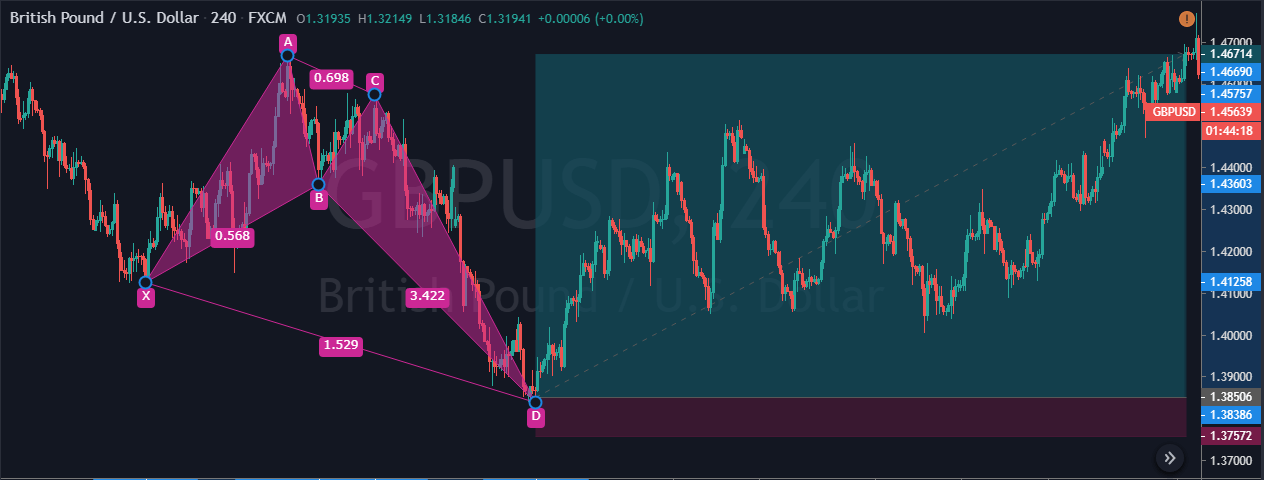
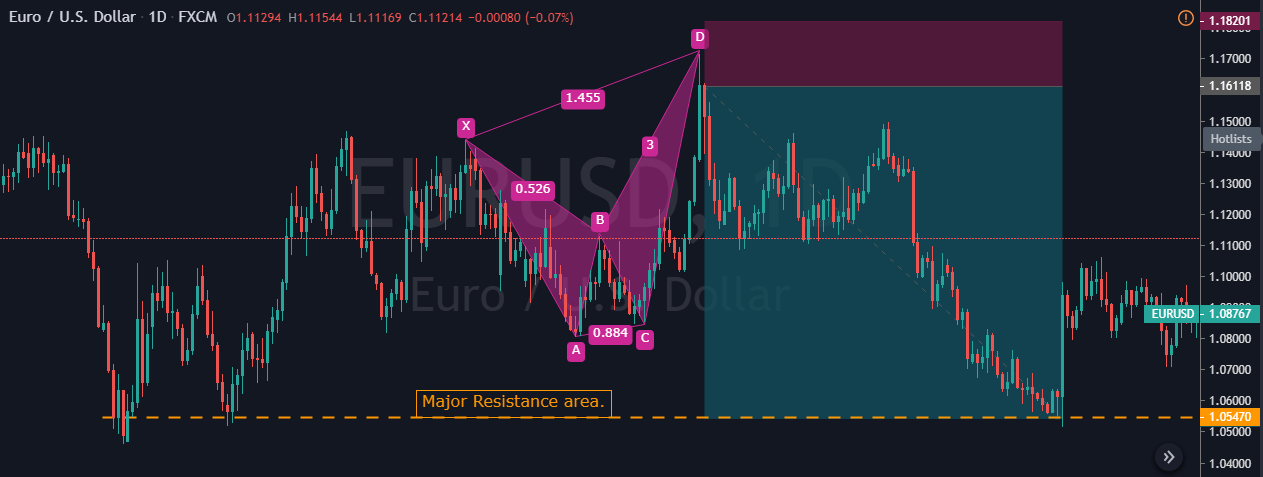
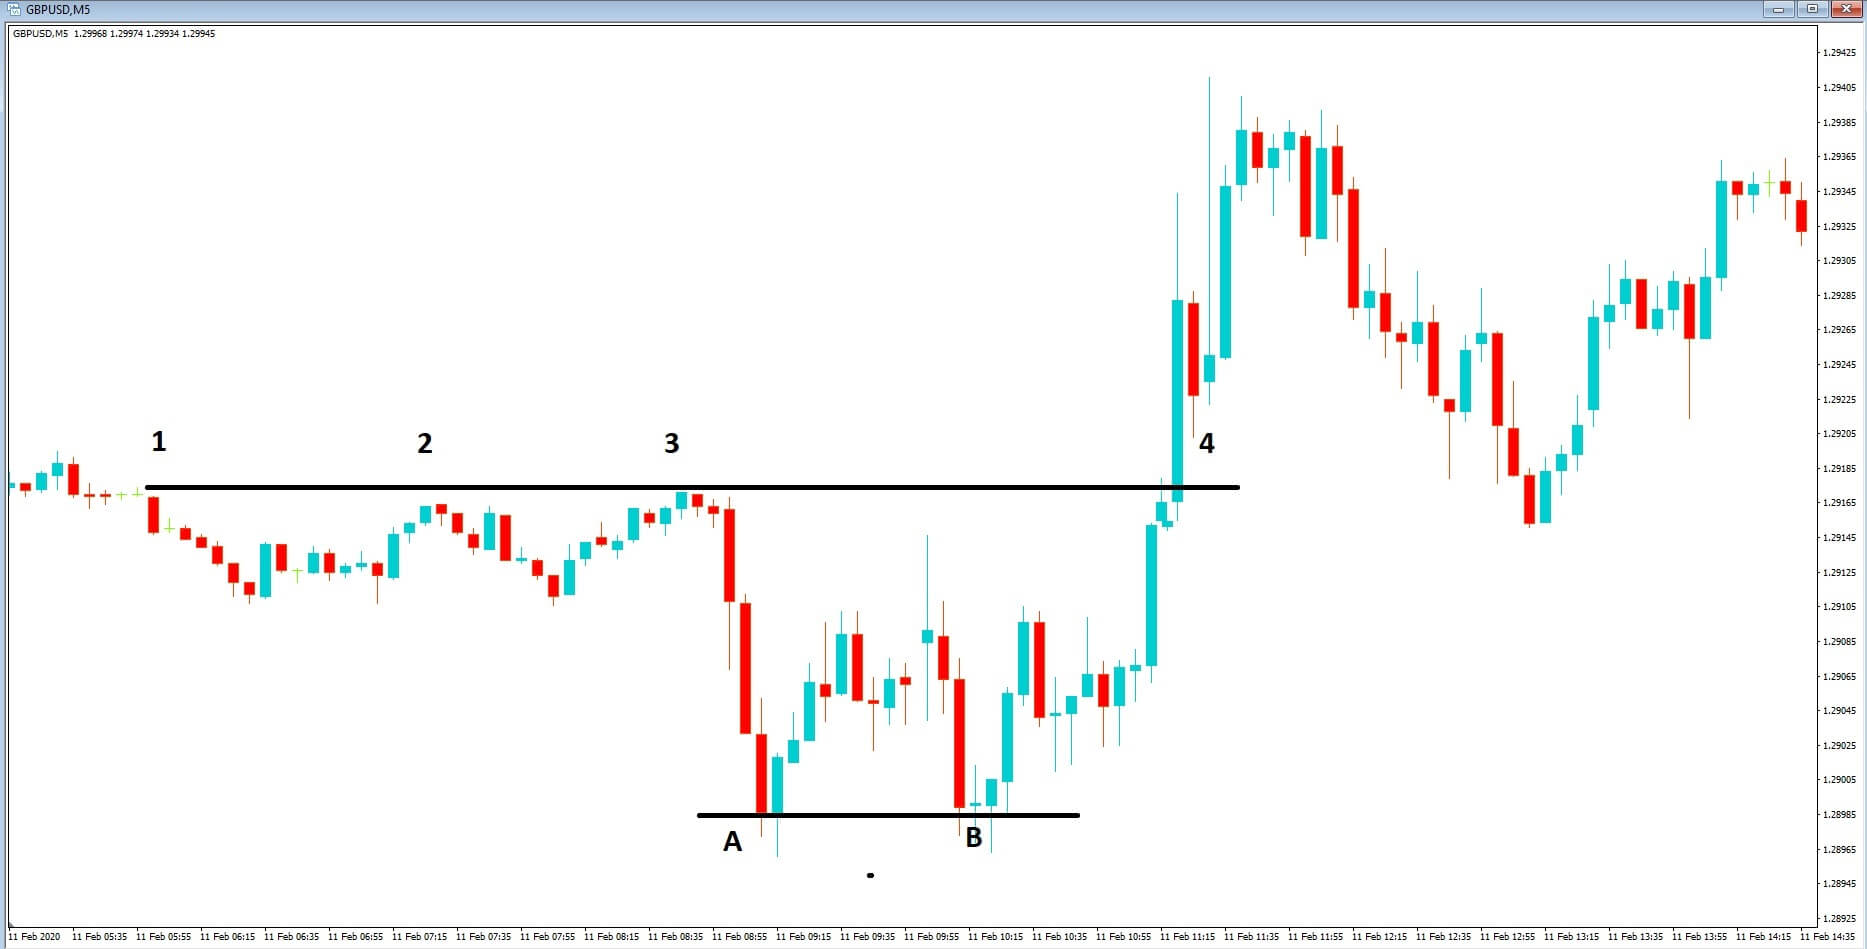
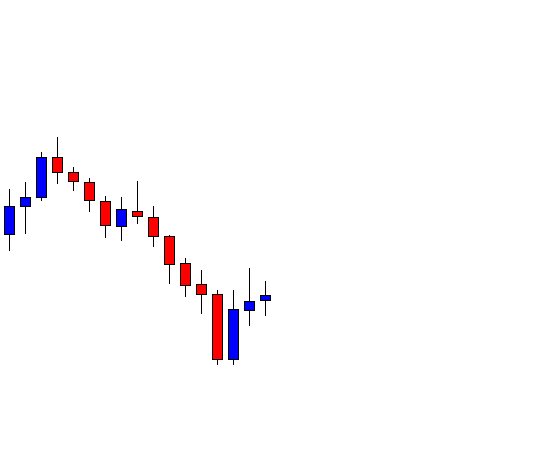
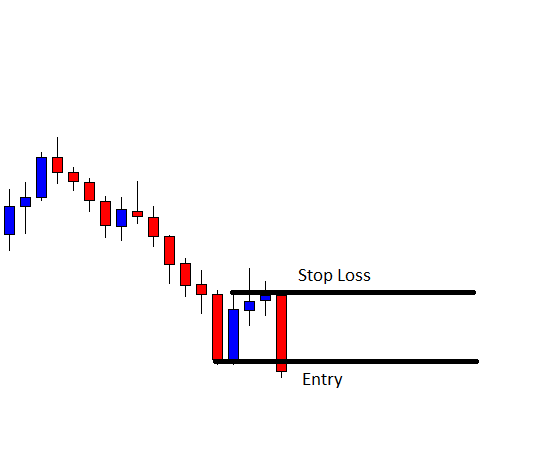
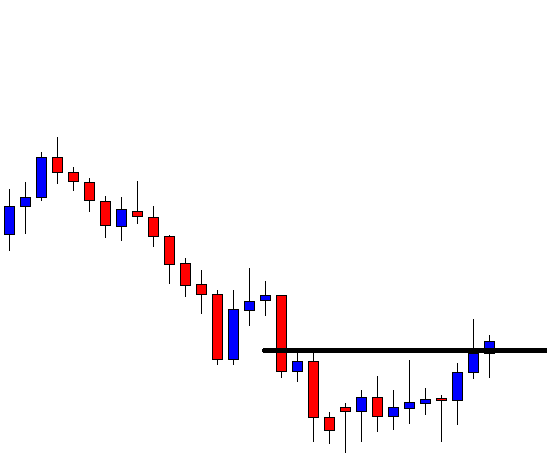
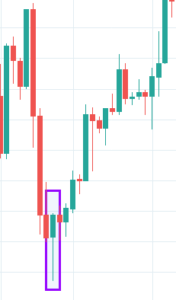
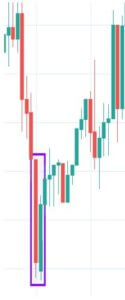
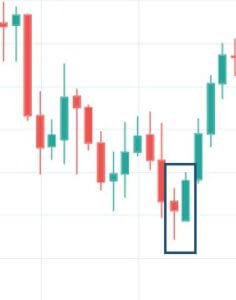
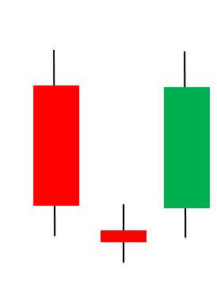
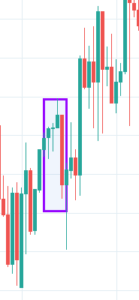
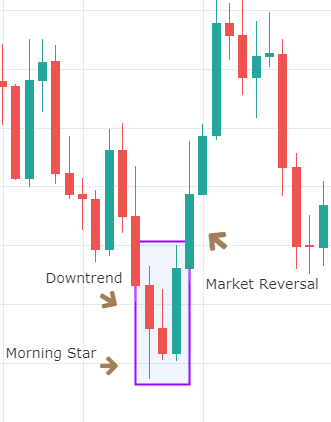
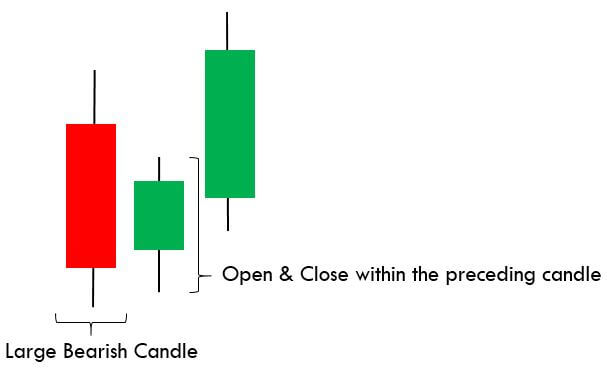
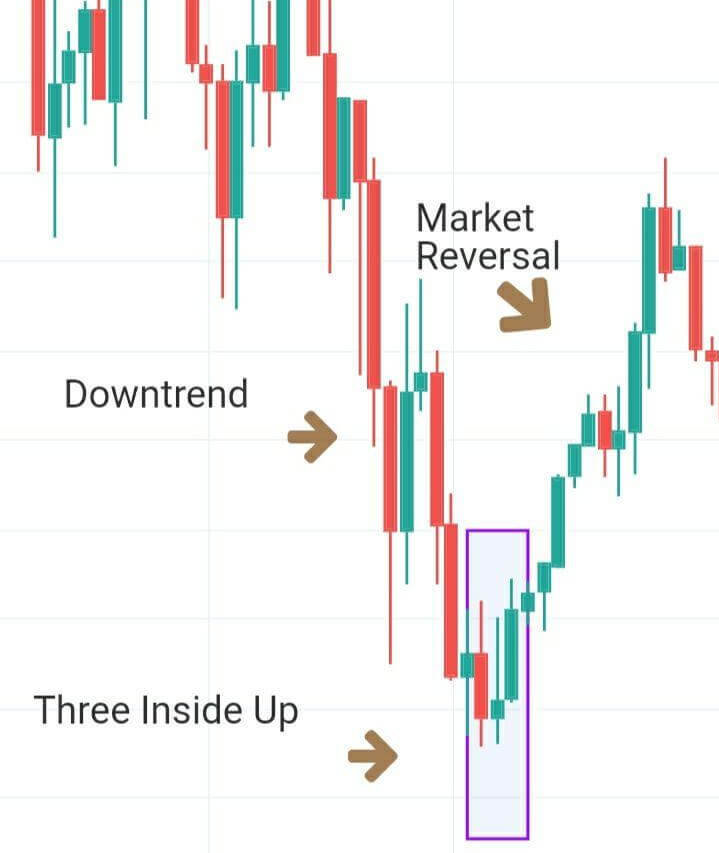
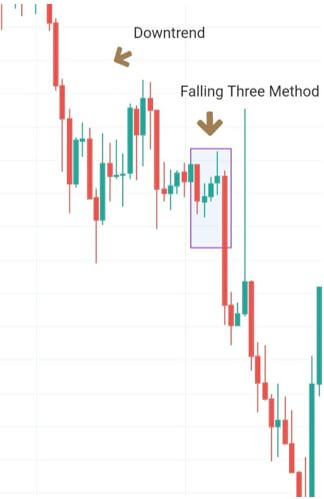
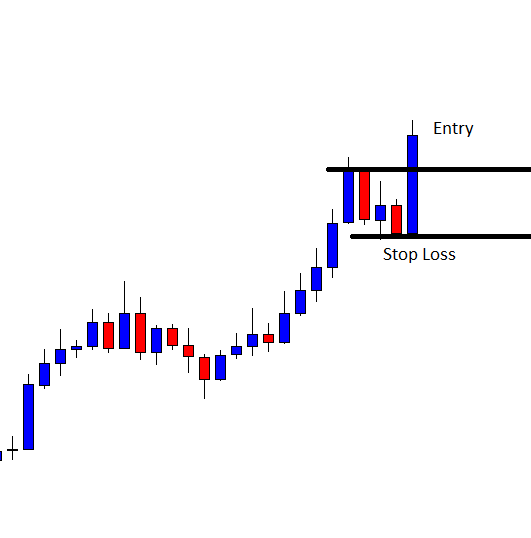
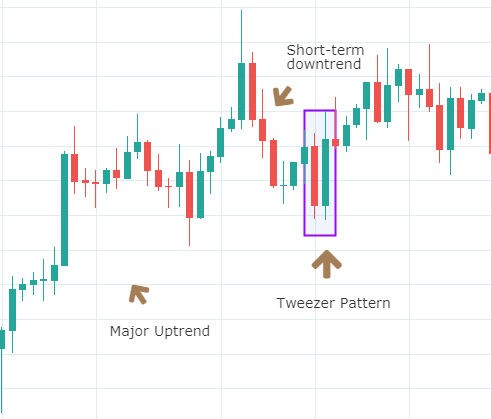
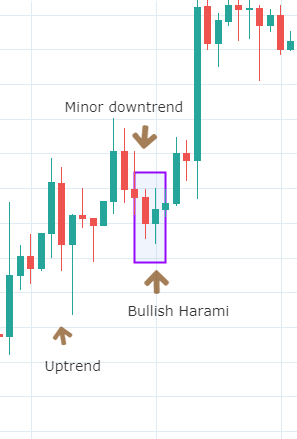
Below is a picture of how this pattern would like on the chart and how the trend reversal takes place.

Pattern Confirmation Criteria

  • Hanging Man is a single candlestick pattern that forms after a small rally in the price. The price rally can also be big, but it should at least be composed of few candles moving higher overall.
  • The candle must have a small body and a lower shadow at least twice the size of the real body.
  • This pattern is only a warning and a bearish candle after the formation of this pattern is highly desired. This is necessary for the Hanging Man pattern to prove to be a valid reversal. This is called confirmation.

The Hanging Man pattern is used by traders to exit long positions or enter into new short positions. After entering for a short position, stop loss can be placed above the high of the Hanging Man candle.

The Shooting Star Candlestick Pattern 

A Shooting Star is a bearish single candlestick pattern which also indicates a market reversal. It has a long upper shadow with little or no lower shadow and a small body.

This pattern typically occurs after an uptrend and forms near the lowest price of the day. The Shooting Star pattern can be seen as the market creating potential resistance around the price range. It implies that the sellers stepped in, erasing all the gains, and pushed the price near the open. Basically, at the appearance of this pattern, buyers are losing control, and sellers are taking over.

Below is a picture of how the pattern would look like on a chart

Pattern Confirmation Criteria

  • The pattern must appear after an advance in price. The price must rally in at least alternate green and red candles if not in all green candles.
  • The distance between the highest price of the candle and the opening price must be twice the length of the body of the candle.
  • It is best if there is no shadow below the body of the candle.

Traders should not take immediate action after the formation of this pattern. They should wait to see what the next candle does following the Shooting Star. If they see a further price decline, they may sell or short that currency pair. However, if the price continues to rise, it means the uptrend is still intact. So traders must favor long positions over shorting.

The difference between the Hanging Man and the Shooting Star is in the length of upper and lower shadows along with the context. By now, we have understood how continuous and reversal single candlestick patterns work. In the upcoming lessons, we will be learning dual candlestick patterns and their implication. Cheers!

[wp_quiz id=”60770″]
Categories
Forex Assets

Analyzing The USD/SGD Forex Currency Pair

Introduction

US dollar versus the Singapore dollar, in short, is referred to as USDSGD. USD stands for the US dollar and is the base currency, and SGD stands for the Singapore dollar and is the quote currency. This currency pair comes under the sack of exotic currency pairs. Unlike the major and minor currencies, exotic currencies tend to have high volatility and low volumes.

Understanding USD/SGD

Comprehending the value of USDSGD is simple. The number of SGD equivalent to one USD is the value of the currency pair USDSGD. It is quoted as 1 USD per X SGD. So, if the value of this pair is 1.3641, then 1.3241 units of SGD are to be produced to purchase one USD.

Spread

Spread is a term given to the difference between the bid price and ask price of a currency pair. This value varies from broker to broker and on the type of execution model.

ECN: 7 | STP: 9

Fees

The fee is similar to the commission that is paid on each trade. This value, too, varies based on how the brokers execute a trade. Note that there is no fee on STP accounts. However, there is a fee on ECN accounts. And for exotic pairs, the fee is pretty high.

Slippage

Slippage is the difference between the price that a trader expected to receive and the price he actually got. There is always this difference due to the volatility of the market and the broker’s execution speed.

Trading Range in USD/SGD

Assessing the profit or loss that a trader is liable for is considered to be a vital factor in trading. This can easily be determined using the table below, which represents the pip movements in the currency pair in a given timeframe.

Procedure to assess Pip Ranges

  1. Add the ATR indicator to your chart
  2. Set the period to 1
  3. Add a 200-period SMA to this indicator
  4. Shrink the chart so you can assess a large time period
  5. Select your desired timeframe
  6. Measure the floor level and set this value as the min
  7. Measure the level of the 200-period SMA and set this as the average
  8. Measure the peak levels and set this as Max.

USD/SGD Cost as a Percent of the Trading Range

The total cost on a trade does not remain static even though you’re trading with the same broker. It varies depending on the volatility of the currency pair. To find the variation of these costs, we consider the values in the pip movement table and find the ratio with the total cost, and represent in percentage.

ECN Model Account

Spread = 7 | Slippage = 3 |Trading fee = 3

Total cost = Slippage + Spread + Trading Fee = 7 + 3 + 3 = 13

STP Model Account

Spread = 9 | Slippage = 3 | Trading fee = 0

Total cost = Slippage + Spread + Trading Fee = 9 + 3 + 0 = 12

The Ideal way to trade the USD/SGD

As mentioned, exotic pairs are pretty expensive to trade. However, it can still be traded in some moments when the costs are low.

It can be ascertained from the above table that the percentages are maximum in the min column and minimum on the max column. This means that the costs are high when the market’s volatility is low and vice versa.

Now, to ensure moderate volatility with affordable costs, it is ideal to trade when the volatility of the market is somewhere around the average values of the volatility table.

Slippage is a variable in the total cost that can be erased by trading using limit orders instead of market orders. In doing so, the costs will be reduced by a significant value. For example, if the total cost on the trade was 13 (including slippage=3), then the costs would be reduced to 10 as slippage is not considered.

Categories
Forex Daily Topic Forex Price-Action Strategies

Look for Such Price Action to Trade on the ABC Pattern

In today’s lesson, we are going to demonstrate an example of the ABC pattern trading. The trend-initiating candle comes out as a bullish engulfing candle followed by a bullish breakout. The price then makes a bearish correction and makes a bullish move upon producing a bullish reversal candle at a flipped support. Let us demonstrate with the charts how it happens.

The price has been bearish, but it has produced a bullish engulfing candle at the support zone. The buyers are to wait for the price to head towards the North and make a bullish breakout at the last swing high. Let us proceed to the next chart.

The price makes a breakout at the nearest swing high. The buyers are to wait for consolidation or correction and a bullish breakout. The last candle comes out as a strong bullish candle as well. It may keep going towards the North. Let us wait and find out what it does next.

It starts having a correction. Then, it produces a bearish inside bar followed by two more bearish candles. The price is at the flipped support. The buyers are to keep their eyes on this chart very closely.

Here it comes. The chart produces a bullish reversal candle. Do not miss the point that the level is the breakout level when the price heads towards the North. Such level is very significant as far as the ABC pattern trading is concerned.

The price makes a bullish breakout again and produces a new higher high. Traders may trigger a long entry right after the last candle closes by setting stop loss below the level of flipped support. It usually provides at least 1:1 risk-reward, which is the safest option. Let us proceed to the next chart to find out how it goes.

The price heads towards the North as expected. It hits the target (1R) with ease. The chart suggests that it may go towards the North further. Anyway, the ABC pattern traders shall enjoy their profit and hunt for the next one somewhere else.

In this example, we have seen that four aspects of the ABC pattern trading such trend initiating candle, breakout, reversal candle at the breakout level, and the signal candle get 10 on 10. Consequently, the price heads towards the desired direction with good momentum. If any of them fails to get 10 on 10, the trade may not go, exactly we would love to see it go. To keep excellent trading consistency, try your best to trade the ABC pattern on such price action that we have demonstrated today.

Categories
Candlestick patterns Forex Candlesticks

Candlestick Reversal Patterns IV – The Hammer and The Hanging Man


The Hammer

The Hammer is a one-candle pattern. The Hammer is identified as a small body with a large lower shadow at the bottom of a downtrend. The result of having a small body is that the open and the close are near each other. The large lower shadow means during the session sellers could move down the price but, then, buyers stepped in and pushed the price back to the levels of the open, or, even, a bit further up. That means sellers lost the battle, and the buying activity started dominating the price action. A positive candle is needed to confirm the price action. This usually converts this candle into a Morning Star formation.

Chart 1 – Hammer in the USDCHF Pair

Criteria for Hammers

  1. The lower shadow must be at least twice the length of the body
  2. The real body is at the upper side of the range. The color does not matter much, although a white body would increase the likelihood of the reversal.
  3. There should be no upper shadow or a very tiny one.
  4. The longer the lower shadow, the better
  5. A large volume on the Hammer is a good signal, as a blob woff day might have happened.

Market Psychology

After a relatively large downtrend, the sentiment of the traders is rather bearish. The price starts moving down at the open and makes a new low. Then, buy orders to move the price up. Profit-taking activity also contributes to the upward move. Then intraday stop-loss orders come in fueling the action further up. A positive follow-up candle would confirm the control of the action by the buyers.

The Hanging Man

The Hanging Man is also a figure similar to a Hammer, with its small body and large lower shadow, but it shows up after a bullish trend. The Japanese named this figure that way because it looks like a head with the body and feet hanging.

Chart 2 – Three Hanging Man in the DOW-30 Index

Criteria for the Hanging Man

  1. The lower shadow must be at least twice the length of the body
  2. The real body is at the upper side of the range. The color does not matter much, although a white body would increase the likelihood of the reversal.
  3. There should be no upper shadow or a very tiny one.
  4. The longer the lower shadow, the better
  5. A large volume on the Hammer is a good signal, as a blowoff day might have happened.

Market Psychology

After a strong trend, the sentiment is quite positive and cheerful. On the day of the Hammer, the price moves higher just a bit, then it drops. After reaching the low of the session, the buyers step in again and push the price back up, close to the open level, at which level the session ends. This would indicate the price action is still in control of the buyers, but the considerable drop experienced in the first part of the session would mean the sellers are eager to sell at these levels, and a resistance zone was created. A lower open or a black candlestick the next day would move the control to the sell-side.


Reference.
Profitable Candlestick Patterns, Stephen Bigalow

Categories
Forex Videos

How To Get An Edge In Forex Using Statistical Thinking – Trade Like A Forex Titan Part 5


Stats for Traders V – Assessing the Quality of the Forex Markets

In our previous video offering, we were presented with a way to assess the quality of a trading strategy or system. It was a modification of the T-

Test Called SQN. Essentially, the test is a measure of the signal-to-noise ratio of distribution. Being the mean of the distribution, m, the signal, and one-tenth of the standard deviation, the noise divisor. Therefore, the higher the SQN, the better the signal of the distribution. It means, also, its difference with a zero mean distribution (everything is noise) is larger.

Random Walks

Market prices, although not entirely normal-distributed, short-term, prices approach a Bell curve very much. The picture we see is the composite image of one thousand different games of a coin toss in which the player wins 1 dollar if heads and loses one dollar if tails.
The paths are the history of wins and losses over 500 coin tosses for each game.
We can see that, even it is counterintuitive, not all games end with zero gains. Some paths are luckier, whereas other paths suffer from bad luck.
The figure we see on the image is representative of what is called a diffusion process, with no drift. It is essentially saying it is a complete stochastic or random process with no trend involved.


A market depicting a potentially profitable component, usually a slightly positive trend would look like this. In this image we see that although there are some paths luckier than others, the average direction is positive, which is why the smoke cloud points slightly upwards.

Market prices can be described by a signal component mixed with noise, or random fluctuations.

Sometimes, the market shows a relatively high signal, whereas, on other occasions, it is just noise. To traders, it is essential to distinguish both market states, as it is impossible to profit long-term on a market with just noise.

SQN as a measure of the trading quality of a market

We can rank the markets offered by our forex brokers by their quality or signal to noise ratio, using SQN or a T-Test with less than 100 sample periods. We could apply this measure to our usual timeframes, using from 30 to 60 samples to obtain a quality map of our usual markets. Then we rank them by quality. This measure, together with the volatility stats and the rest of statistical information we already explained in previous videos, allows a savvy trader to choose the current best markets and discard the ones not showing adequate signal-to-noise characteristics.

Range Stats

Another interesting measurement that could help us assess potential reward to risk factors and also trim our targets properly is the intraday range measurements. We could set a 30-day, and also a 100-day and yearly stats, of what is normal market ranges percentwise for each asset in our basket. To do this measurement, we first mark the swing highs and lows and register the price differences. Then we apply the statistical measures to get the average and the SD values. A table could tell us what we could expect from the next move and set potential targets at the mean and also at the mean plus one SD.
We can also refine the information by splitting the table into swing high and swing low tables. That kind of information will give us valuable insight into the potential quality of the next trade, including the available range, its likely continuation, the possible reward-risk ratio, and the distance to targets.

Categories
Forex Course

51. Fundamentals Of Candlestick Patterns

Introduction

In the previous course lessons, we have discussed the basics of candlesticks along with the pros and cons of using them. From this lesson, we will learn the basic candlestick patterns and their usage. As discussed, the idea of candlesticks charts has started in Japan in the late 1870s. These charts were then introduced to the outside world by Steve Nison through his first book, ‘Japanese Candlestick Charting Technique.’

In this lesson, let’s discuss the primary advantage of using candlestick charts. Although a single candlestick gives us many details about the price movement of an asset, a sequential set of candlesticks is more powerful. These sets are also known as patterns in simple trading language, and using these patterns, traders across the world take trading decisions.

Expert traders have decoded many such patterns and rigorously backtested them to analyze what those patterns will eventually result in. They also examined how the market direction will change after the appearance of these patterns on the charts. Now, let’s see the different candlestick patterns one must know.

Different types of candlestick patterns

There are single, dual, and triple candlestick patterns depending on how many candlesticks are involved in them. For example, if there are the candlestick pattern is formed by three candlesticks, it is known as the triple candlestick pattern. Every single pattern has its own significance and can be found in most of the Forex charts.

The main intention of identifying any candlestick pattern is to understand the further price movement in the market. Hence these patterns are classified into two different types – Continuation Patterns & Reversal Patterns. When we identify a continuation candlestick pattern on the chart, it means that the market will continue in the same direction as the underlying trend. Contrarily, if we identify a reversal pattern on the charts, we can expect the price to change its direction. Also, these patterns are internally classified as bullish and bearish continuous/reversal patterns, which will be discussed in the upcoming lessons.

Examples of Continuation Candlestick Patterns

  • Deliberation Pattern
  • Concealing Baby Swallow Pattern
  • Rising Three Methods Pattern
  • Separating Lines Pattern
  • Doji Star Pattern

Examples of Reversal Candlestick Patterns  

Some of these are single candlestick patterns, while some are multiple candlestick patterns. We shall be discussing each of these patterns in detail in our future articles.

Psychological context of candlestick patterns

The candlestick patterns demonstrate the psychological trading that takes place during the period represented by a single or multiple candles. We need to start imagining the price movement as a battle between buyers and sellers. Typically, Buyers expect that prices will increase and drive the price up through their trades. Whereas sellers bet on falling prices and push the price down with their selling interest.

Also, the Japanese gave very visual names to these patterns so that it impacts the mentality of a trader. For instance, pattern names like Hanging Man and Dark Cloud Cover represent negativity, while the patterns like Three White Soldiers and Morning Star indicate positive market results. Hence, as soon as we hear the names of these patterns, our sub-conscious memory will know whether the forecast of the market is positive or negative.

Benefits of trading candlestick patterns

Although initially conceived for daily timeframes, Candlestick patterns can be used by swing traders, day traders, and even long term investors. Below are some of the significant advantages of these patterns.

  • They are very easy to identify and comprehend. They provide a detailed description of the occurrences and happenings in the markets.
  • Interaction between the buyers and sellers can easily be understood just by reading the pattern and without having to analyze the market entirely.
  • Candlestick patterns can be used in conjunction with other indicators for extra confirmation on the trading signals generated.
  • They display reversal patterns that cannot be seen in other charts like Line & Bar charts.

That’s about the introduction to Candlestick patterns. In our upcoming lessons, we will discuss different candlestick patterns and how to generate trading signals using these patterns. So, stay tuned.

[wp_quiz id=”60271″]
Categories
Forex Assets

What Should You Know Before Trading The CHF/JPY Currency Pair

Introduction

CHFJPY is a symbolic representation of the Swiss franc against the Japanese yen. Here, CHF is the base currency, and JPY is the quote currency. Since it does not have USD involved, it is classified as a cross-currency pair.

Understanding CHF/JPY

The market price of this pair is the number of JPY that are required to purchase one CHF. It is quoted as 1 CHF per X JPY. For example, it’s current value is 112.31, then 112.31 yen are needed to buy one Swiss franc.

Spread

Spread in forex is the difference between the bid price of a currency and the ask price of it. And this pip difference is used up by the brokers as a form of fee. However, it is not a fixed value. It varies from brokers to brokers.

ECN: 1.3 | STP: 2.1

Fees

Spread is not the only form of fee that is levied by the brokers. There is a commission on the trade as well. The commission is nil on STP accounts, but pips on ECN accounts.

Slippage

When entering a trade using market orders, the trader does not get the exact price he intended when he executed it. There might be a difference in pips. This difference is referred to as slippage. Slippage may be in favor of or against the trader.

Trading Range in CHF/JPY

The trading range is simply a representation of the minimum, average, and maximum pip movement in a currency pair. With these values, one can assess how much money a trader will be risking in a particular timeframe. For example, if the average pip movement on the 4H in this pair is 15 pips, then a trader can expect to win or lose $150.6 in about 4H or so.

Procedure to assess Pip Ranges

  1. Add the ATR indicator to your chart
  2. Set the period to 1
  3. Add a 200-period SMA to this indicator
  4. Shrink the chart so you can determine a large time period
  5. Select your desired timeframe
  6. Measure the floor level and set this value as the min
  7. Measure the level of the 200-period SMA and set this as the average
  8. Measure the peak levels and set this as Max.

CHF/JPY Cost as a Percent of the Trading Range

Apart from knowing the profit or loss can one can incur in a given timeframe, it is necessary to assess the cost of these trades as well. Below is a table that represents the cost variation in different volatilities. And these costs are determined by finding the ratio between the total cost and the volatility.

ECN Model Account

Spread = 1.3 | Slippage = 2 |Trading fee = 1

Total cost = Slippage + Spread + Trading Fee = 2 + 1.3 + 1 = 4.3

STP Model Account

Spread = 2.1 | Slippage = 2 | Trading fee = 0

Total cost = Slippage + Spread + Trading Fee = 2 + 2.1 + 0 = 4.1

The Ideal way to trade the CHF/JPY

The forex market is open 24hours. However, it is not ideal to enter the market at any time. There are times when the costs are low, and times when it’s high.

The percentages in the table are directly proportional to the costs of the trade. It is seen that the percentages are high in the minimum column, and low in the maximum column. Hence, we can conclude that costs are inversely proportional to the volatility of the market. Now, when it comes to choosing the right time to trade, it is best to enter during those times when the volatility of the market is around the average values. This will ensure enough volatility in the market and low costs as well.

In addition, placing orders using limit/pending orders reduces costs too because this will completely nullify the slippage on the trade and will bring down the total cost significantly.

Categories
Forex Daily Topic Forex Price-Action Strategies

Trading on the Daily Chart More Rewarding Than It Looks

Trading on the daily chart is very rewarding as well as hassle-free comparing to intraday trading. Trade management is different since it allows enough time for the traders to make a decision about their positions. This often allows the traders to earn more pips. In today’s article, we are going to demonstrate an example of price action trading on the daily chart, which allows the traders to hunt some extra pips. We find out how traders do it.

This is a daily chart. It shows that after being bullish for seven trading days, it produces a bearish engulfing candle. The Bearish engulfing pattern is one of the strongest bearish reversal patterns. The sellers are to wait for the price to consolidate and give them a level of resistance where they set Stop Loss above to ensure better risk-reward.

This is what the sellers want to see. The chart produces a bullish inside bar, which states that the sellers may take over the control upon getting another bearish engulfing candle closing below the level of support.

Look at the last candle. It comes out as a bearish engulfing candle closing below the level of consolidation support. The sellers may trigger a short entry right after the candle closes by setting the stop loss above the highest high of the signal candle. To set take profit, some traders may close the trade manually upon getting a bullish reversal candle; some may set at 1:1 risk-reward; some may set at the last significant lowest low. It depends on traders’ psychology and with the strategy (in terms of taking profit) they feel comfortable with.

The price consolidates with one more candle after triggering the entry. However, the price hits the target, which is set at the level of the significant lowest low. As mentioned, some traders may keep holding the position since the price is still with the bear. Let us proceed to the next chart and find out what the price does in the next candle.

It makes a breakout as well. The sellers holding the position may dream big. It seems the price may keep heading towards the South further. This is the good thing about trading on the daily chart. Traders get enough time to decide about their positions. They get 1:1 risk-reward in almost every trade. If they understand daily price action well and get well acquainted with daily trading, it usually gets them very lucrative risk-reward. Imagine, if traders want to manage trade like this on the H4 or the H1 chart, how painful it could be. Moreover, the H4 or the H1 chart is not as consistent as the daily chart. In our fore coming articles, we will demonstrate more examples of how we can maximize our profit by trading on the daily chart. Stay tuned.

Categories
Forex Elliott Wave

How to Start a Wave Analysis – Part 4

In our previous educational article, we learned to identify the end of the directional and non-directional movements. In this article, we will learn to recognize neutral movements.

The Neutral Movement

When the wave analyst faces the market in real-time, it is common to observe the price action running at a lower price/time relationship than the usual market speed. When this phenomenon occurs, we are in the presence of a neutral movement.

In particular, when the price changes its direction if the angle between the initial move and the next one is lesser than 45° thus, we are facing a neutral movement.

Depending on the kind of movement developed by segments under study, there exist two possible scenarios of a neutral move.

  • If the neutral movement runs in the middle of two legs that advances in the same direction, thus the end of the first path will be at the end of the neutral segment.
  • The second case occurs if the neutral movement advances between two segments that run in the opposite direction. In this case, the end of the first movement will be at the end of the second segment.

Neutral Movements in the US Dollar Index

The following chart shows the US Dollar Index in its 8-hour timeframe. In the figure, we observe a first neutral movement, which runs upward from 96.98 until level 97.40.

The ascending sequence makes two pauses that look horizontal. Applying the neutral movement concept, we conclude that this movement corresponds to a single path that advances into the rectangle.

In the second rectangle, we observe the decline that the Dollar Index from level 97.72 until 96.45. This bearish move exposes an acceleration that turns complex the wave analysis. In this case, the neutral movement concept helps us in determining that the bearish move corresponds to a single movement.

If the wave analyst looks for a detailed decomposition of the entire bearish segment simplified by the neutral movement, in words of R.N. Elliott, the wave analyst should have to study the move in a lower timeframe to identify every segment.

Waves Observation

Until the previous section, we observed that each movement produced is divided into two main categories depending on the segments that compound each sequence.

According to the Wave Principle, R.N. Elliott described the existence of a movement that follows a trend, and the reaction of the initial move. Elliott defined to these movements as an impulsive and corrective wave.

  • An impulsive wave progresses in a defined direction. Its internal sequence is formed by five segments, where three movements follow the same path, and the other two move against the main trend.
  • A corrective wave characterizes by its progress against the main trend direction. A corrective formation is composed of three segments.

Identifying Movements

To facilitate the wave analysis, R.N. Elliott, in his Treatise, defined the use of labels to identify the advance of the movement of each segment.

Elliott, in his work “The Wave Principle,” tells us that the use of tags to identify each movement is not an end by itself. Instead, it is a tool to ease the wave study.

The following chart represents the GBPUSD in its 4-hour range. From the figure, we observe the Cable developed a rally that advanced in five segments from level 1.19585 touched on September 03rd, 2019.

The sterling reached its highest level at 1.35149 on December 12th, 2019, from where the price action began a corrective process that still looks in progress.

Conclusions

Sometimes, the nature of the movement makes complex the waves’ observation process, and in consequence, to determine where it begins or ends.

The neutral movement concept aid the wave analyst to determine, in an objective way, where it starts or ends a move when it is not simple to define. Once the wave analyst discerns where each movement starts and finishes, the analyst will be able to advance in the wave identification process.

Suggested Readings

  • Neely, G.; Mastering Elliott Wave: Presenting the Neely Method; Windsor Books; 2nd Edition (1990).
  • Prechter, R.; The Major Works of R. N. Elliott; New Classics Library; 2nd edition (1990).