
recurring shapes and patterns Part 1 of 2
When trading from charts, one often finds at certain shapes and patterns recurring time after time. This is because the forex market, just like other financial markets, tends to retrace price action. In fact, over 80% of the movement in price action, within the forex market, is price action retracing.
Some pattern formations in price action, such as price seemingly complying with moving averages, MACD, and stochastics, for example, are very self-evident. However, we know that price action does not move in a straight line, and therefore we need to be looking elsewhere for help in determining the possible future direction in price action movement. Some patterns and shapes are somewhat subjective, but, nonetheless, when a trader realizes that these other patterns and shapes, which recur time after time, exist, it will help add another dimension in the art of forex trading.
Example A
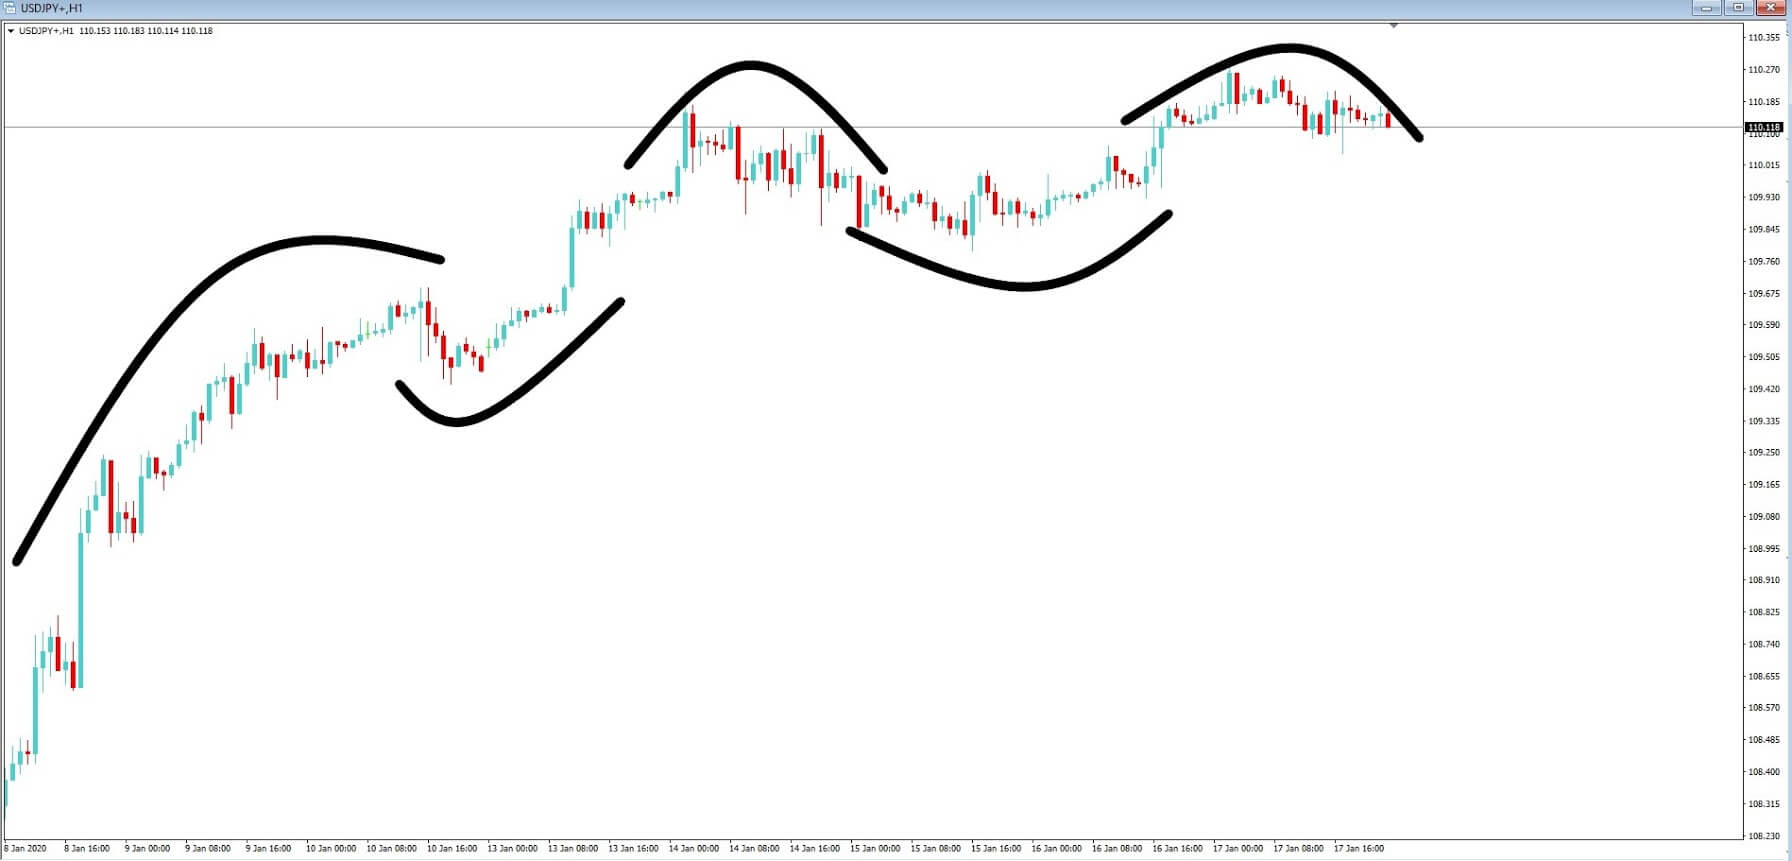
Let’s take a look at example A, which is a one-hour chart of the USDJPY pair. Picking up the price action from the left-hand side of the screen, we can see that after an initial push higher the volatility slows as the pair’s move takes on a more gradual move higher and where we can see the price appearing to arch through 90 degrees to the right. We then find a slight pullback lower where there seems to be a wave encompassing the price action as it moves higher. Other examples have been added and which, on a subjective basis, might show further waves and arches acting as makeshift support and resistance areas.
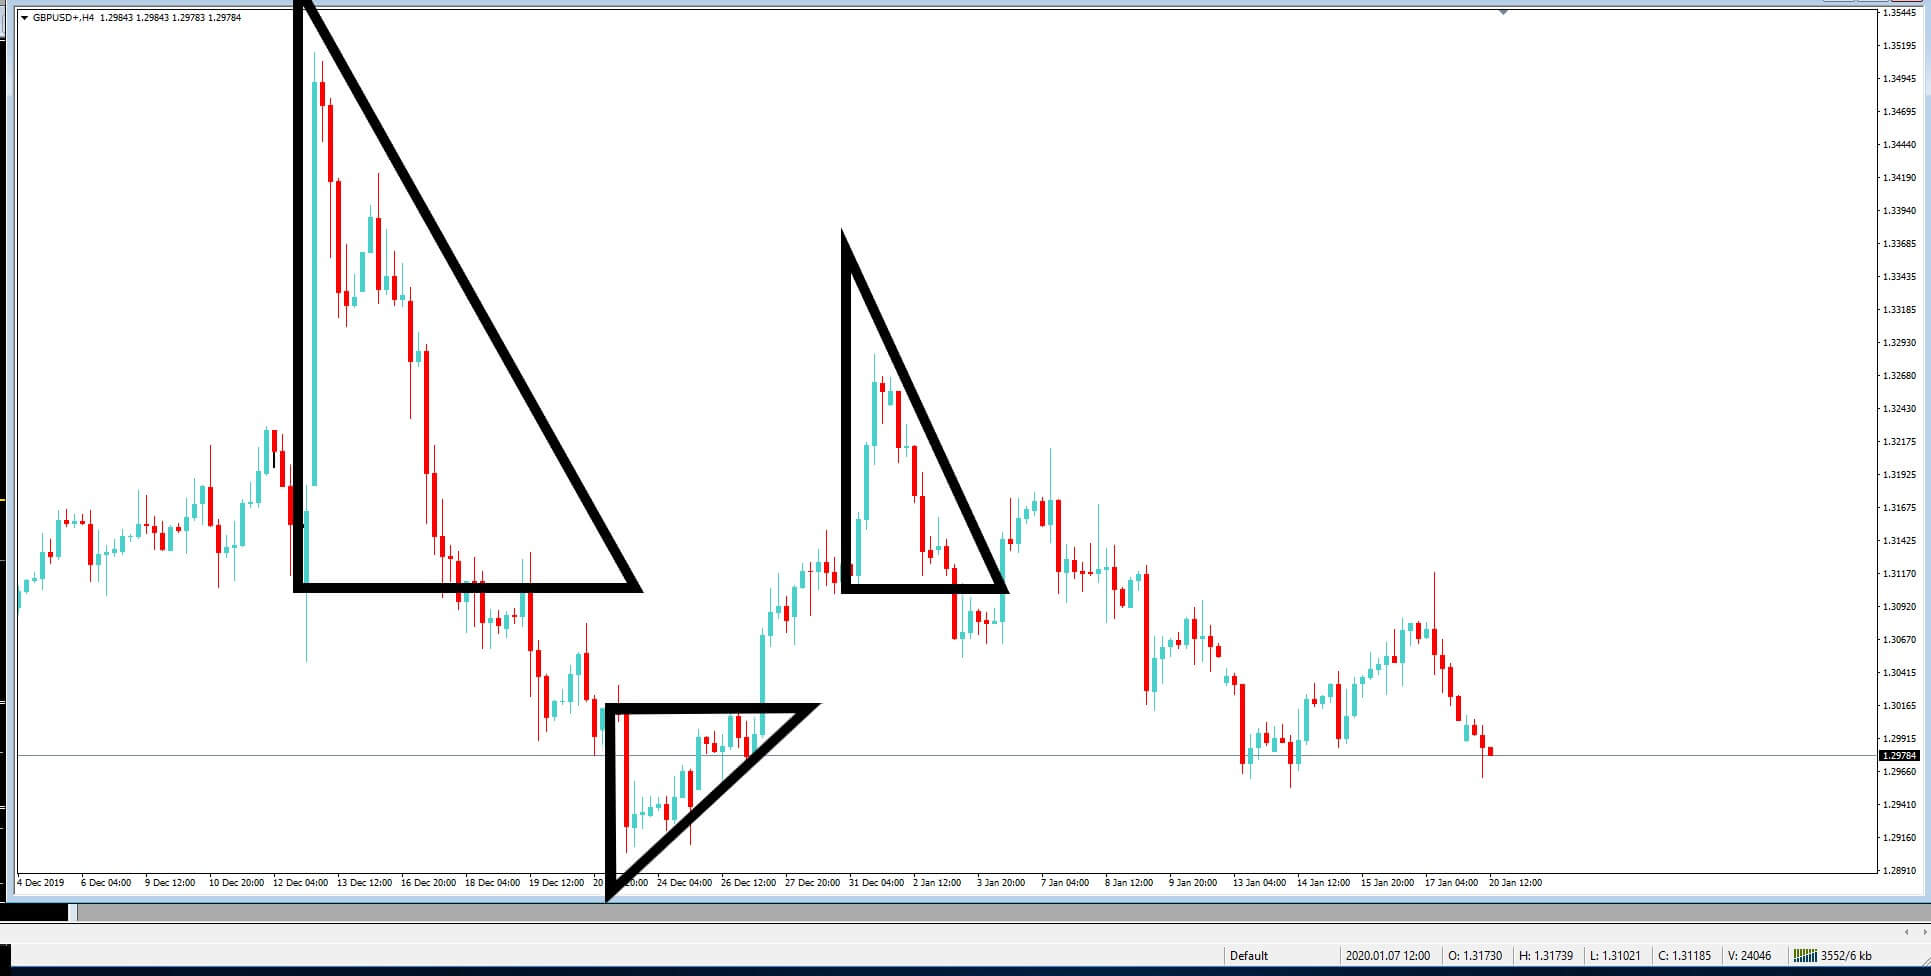
Example B
Now let’s take a look at example B, which is a 4-hour chance of the GBPUSD pair. This time the shapes are slightly less subjective, and we can see clear examples of triangular formations. They tend to form when there is a spike in the price action in either direction and where the price action fades back to the original levels of the spike and where the base of the triangle is often an area of support and resistance.
Example C
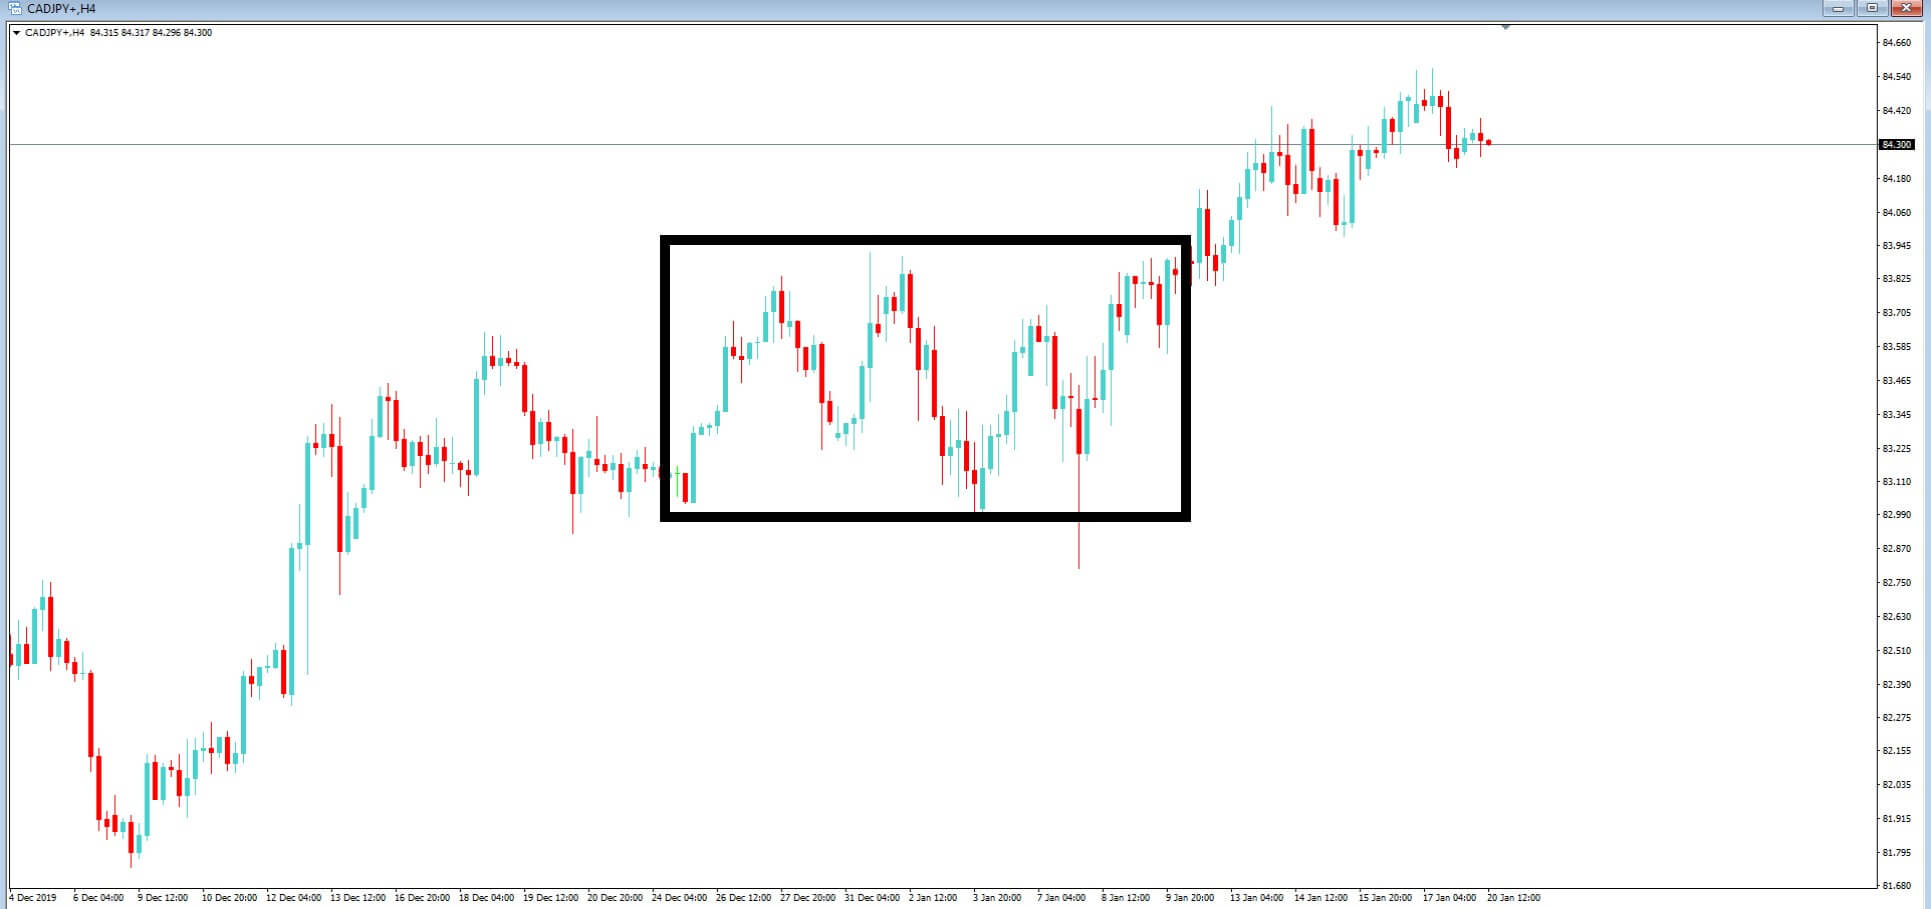
Example C is a 4-hour chart of the CADJPY pair. This is a sight that you may be more familiar with: the box or square. To conform there must be at least two similar exchange rate levels of support and two similar levels of exchange rate levels acting as areas of resistance. The longer that price action is contained in boxes, the more likely of a volatile breakout at some point.
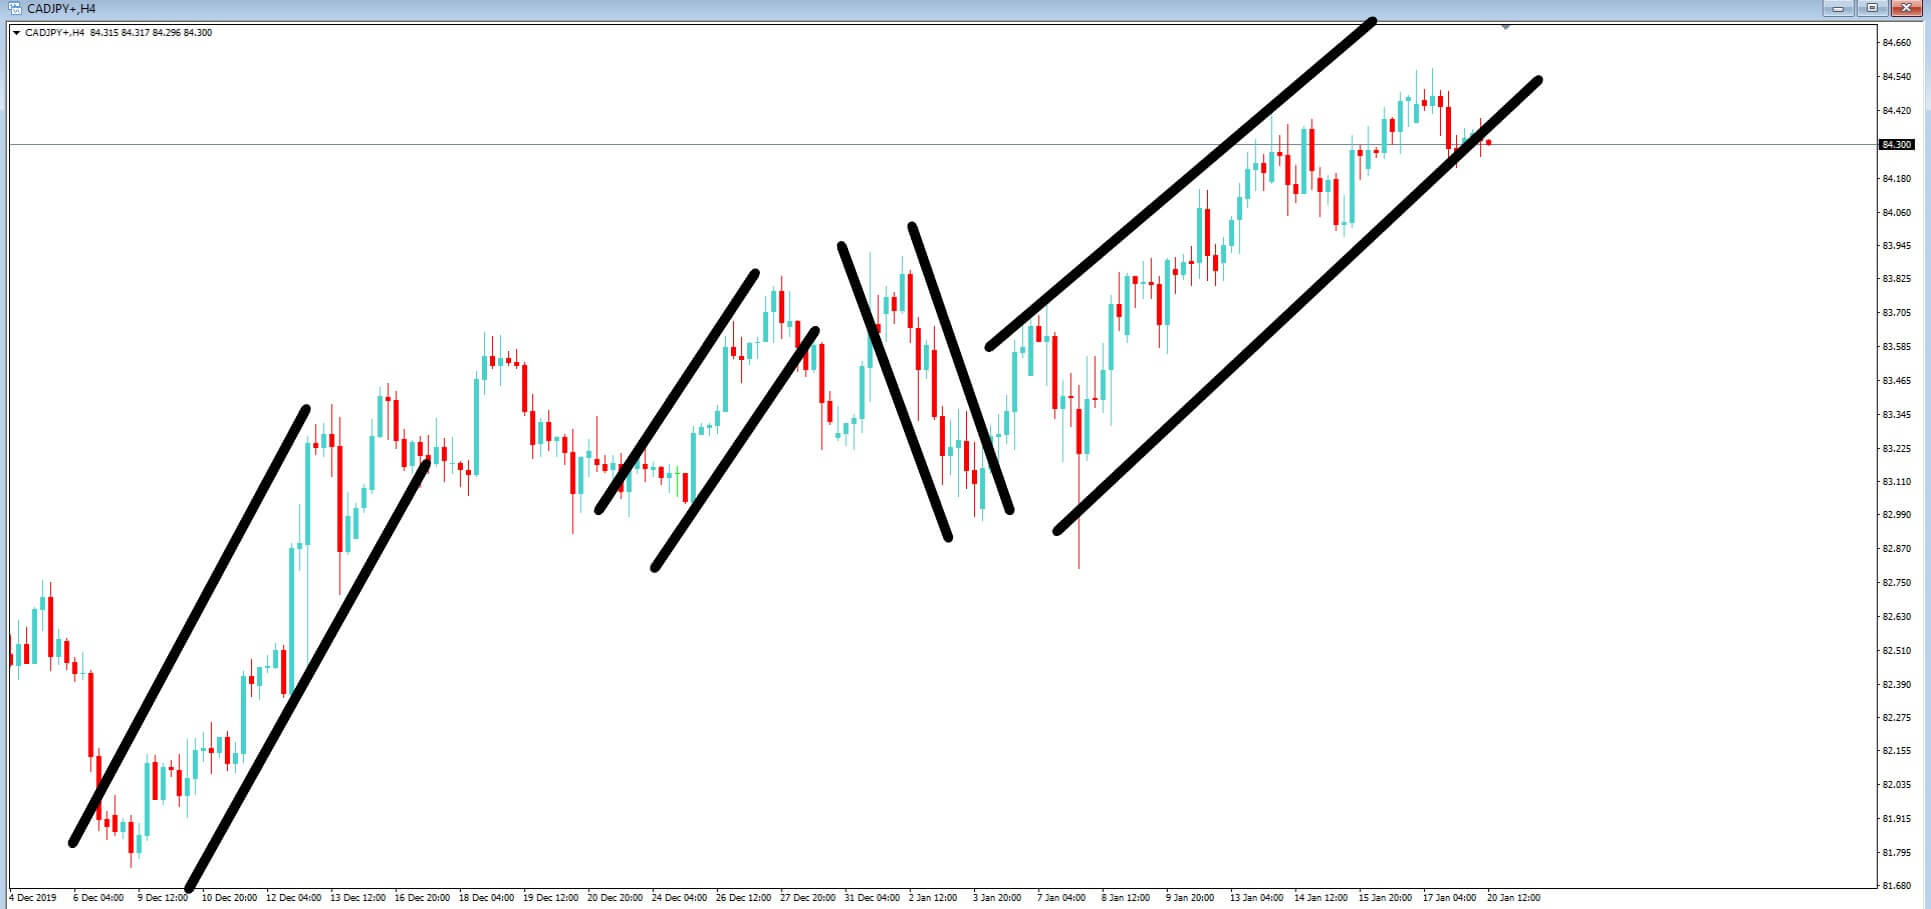
Example D
An example D, we stick with the 4-hour chart of the CADJPY pair, and this time we have added tracks, which are simple moving averages, acting as areas of support and resistance to price action. Traders often draw these tracks on their charts and look for areas where price action breaks out of the tracks, to try and determine future price direction.
Look out for more shapes and patterns in Part 2.