
How to trade US Non-Farm payrolls like the professionals do
The United States Non-Farm payrolls provide a picture of the country’s labor market, and the report usually comes out on the first Friday of each month at 13:30 GMT.
The report measures the number of jobs gained during the previous month and which are not farm-related. The report includes the unemployment rate and average hourly earnings. It is one of the biggest market-moving events of each month. It tells policymakers in the United States if the country is close to maximum employment and will help to determine future interest rates. If job growth is close to the maximum, the Federal Reserve will typically look to raise interest rates, assuming that inflation is where they need it to be, and vice versa.
Example A
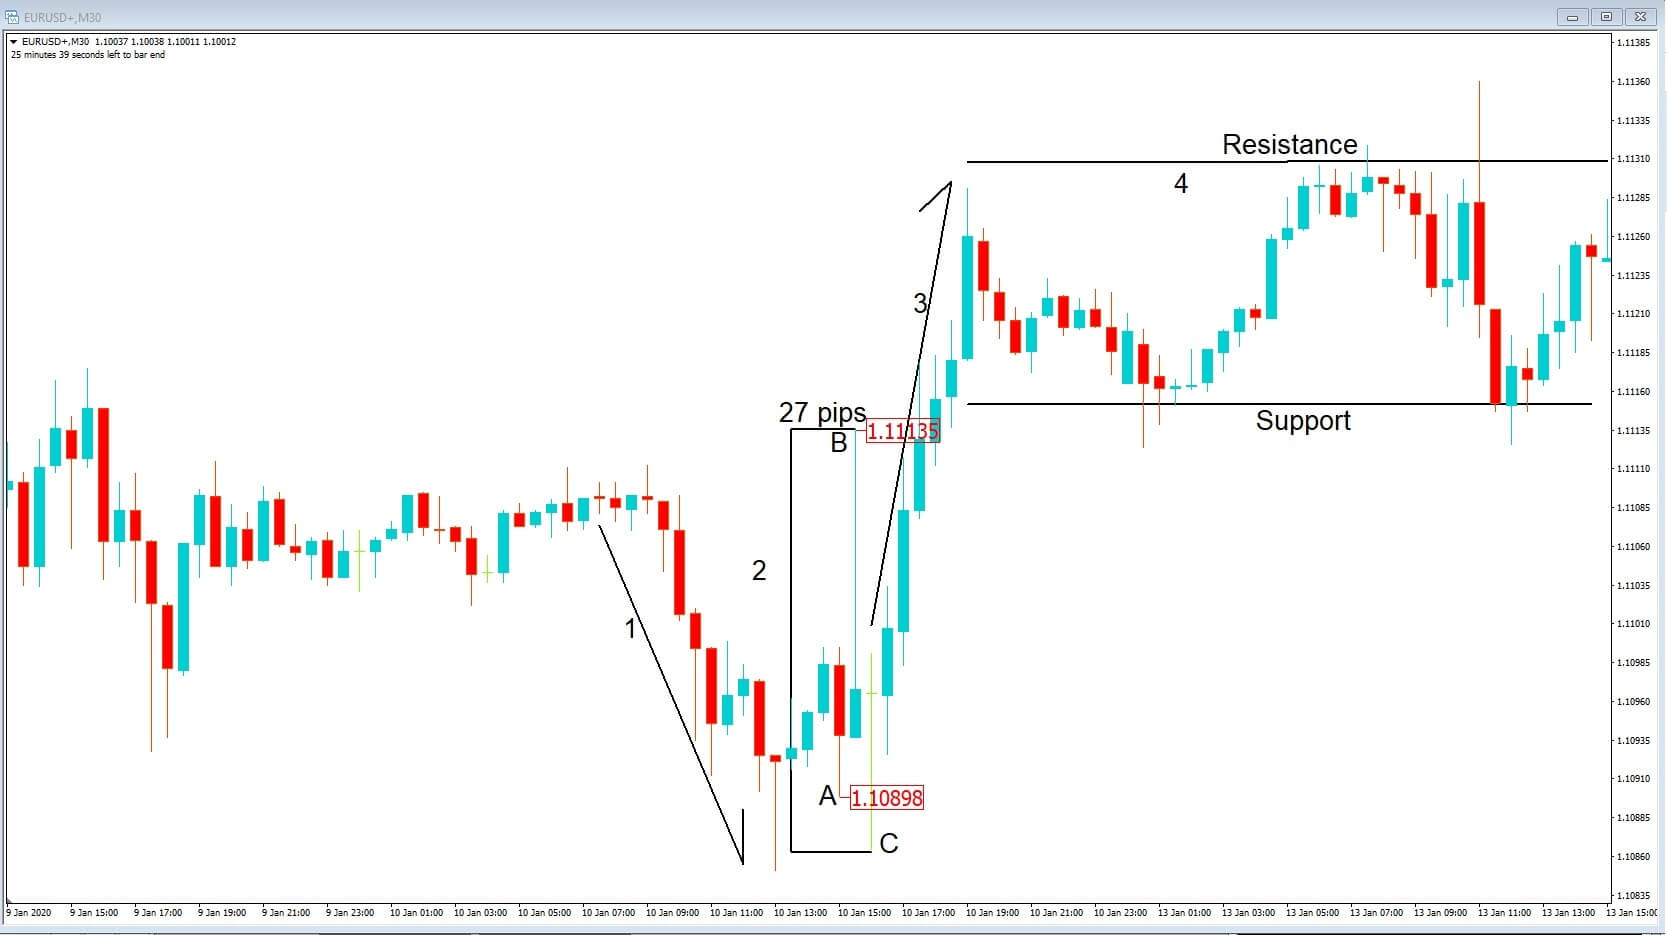
In example A, let’s look at a 30-minute chart of the EURUSD for the 10th of January, when the figures were released, and where 164K jobs were expected to be added to the US labor market.
Just prior to the release of the NFP, seller’s drove price action down at position 1. We can only determine that the market expectation was for a strong number, possibly above 164K. However, as marked on our chart at position 2, with the price adjacent to the 30-minute candle associated with the release at position A after the number came out, which was 145K, less than expected, the price action spiked higher to position B before being sold again to position C, an overall move of 27 pips during this period. Buyers then drove the price action higher at position 3, before price action consolidated between an area of support and resistance at position 4. Please note that the time on our chart is set 2 hours ahead of the actual time.
Example B
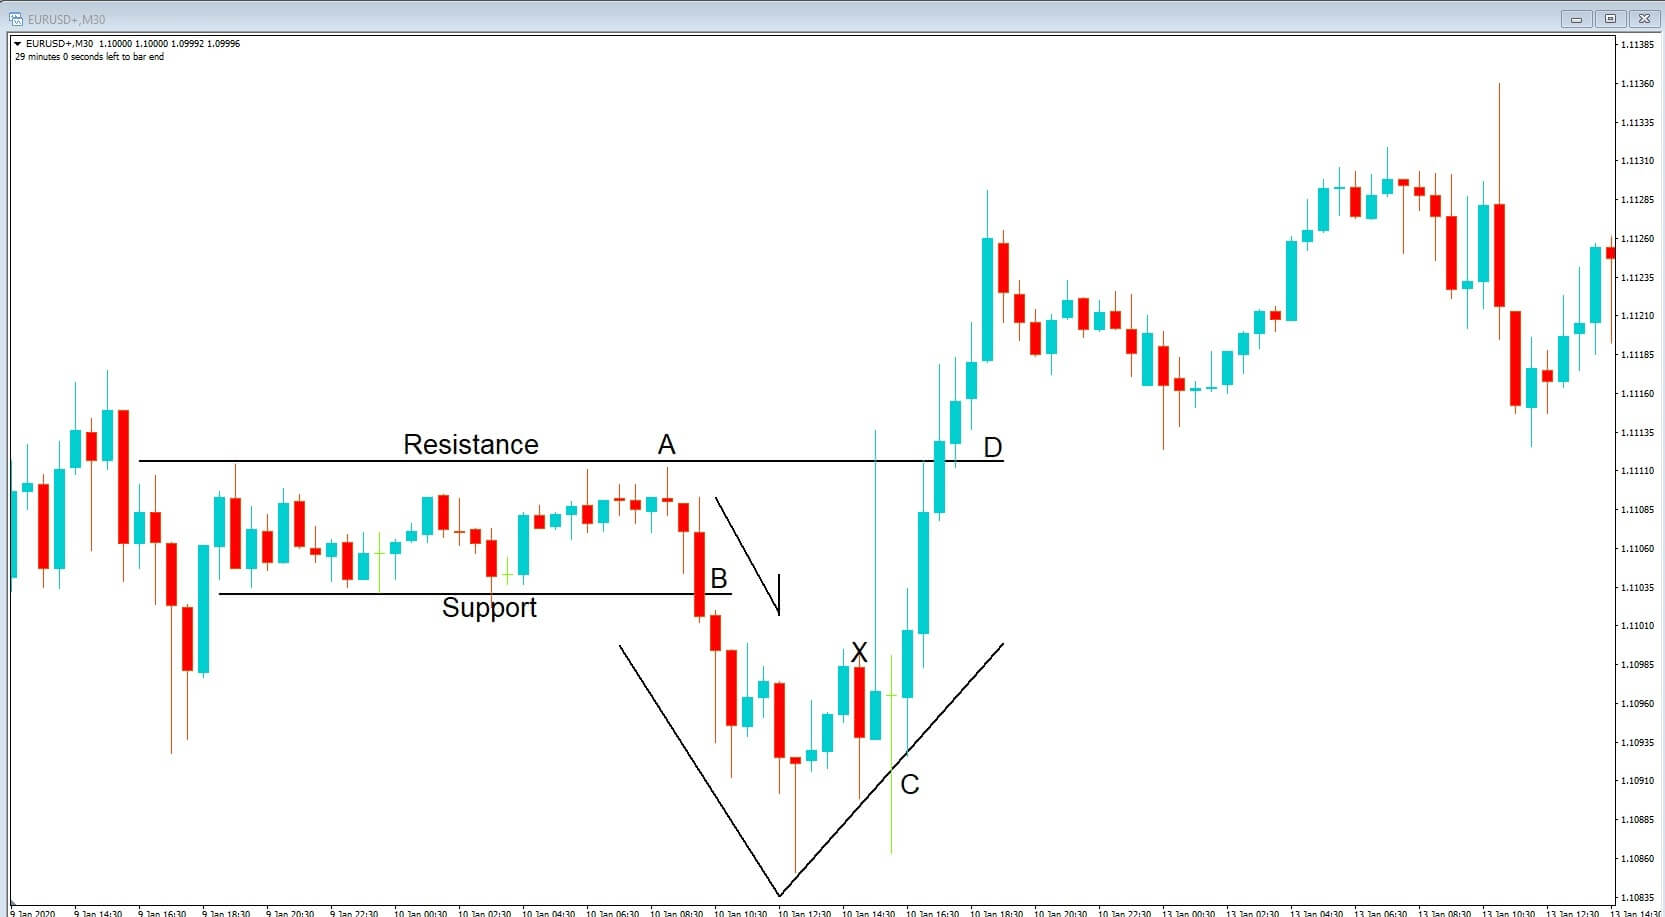
Let’s now look at example B, which is the same chart, but with some trading ideas. In the run-up to the release of the NFP, we can see that an area of resistance and support has formed at positions A and B and were a sell-off happened just before the release, probably because the market expected a strong number from the United States.
There was an opportunity to go short at position B when price action fell below the support line. A tight stop loss should have been implemented. On this occasion, 17 pips were available to the downside with the possibility of bagging some profit and closing the trade just before the data release.
However, we already know that the data was worse than expected and should have anticipated that the dollar would start to lose ground. We can also see tails developing on some of the candlesticks and a classic V formation, which occurs during this event.
The next trade opportunity is when price action moves higher, and above our previous areas of support at position B, and above our previous area of resistance at position A and where position D offers a buying opportunity, as price action takes out all of the previous highs.
This setup can also be applied in reverse, should the NFP data be better than expected.
If the data is + or – a few thousand as per the expected number, expect a muted response by the market.
Had the number been much better than the 164k, which was expected, we would have likely seen a further decline in the pair. Bear in mind that when this data is released, it is dependent on how the market assimilates it. Sometimes the data may be bad, but not as bad as expected, and sometimes it could be good, but not as good as expected, and often the NFP report is released simultaneously with
the Canadian unemployment release.
Therefore it is not wise to pull the trigger on a trade within a couple of minutes either side of this very important data release. The best way to trade Non-Farm payrolls is in the hour or so before the event or an hour or so after the event.
Keep out for this classic price action formation for each payroll event as it recurs an awful lot!