In our previous educational article, we learned to identify the end of the directional and non-directional movements. In this article, we will learn to recognize neutral movements.

The Neutral Movement
When the wave analyst faces the market in real-time, it is common to observe the price action running at a lower price/time relationship than the usual market speed. When this phenomenon occurs, we are in the presence of a neutral movement.
In particular, when the price changes its direction if the angle between the initial move and the next one is lesser than 45° thus, we are facing a neutral movement.
Depending on the kind of movement developed by segments under study, there exist two possible scenarios of a neutral move.
- If the neutral movement runs in the middle of two legs that advances in the same direction, thus the end of the first path will be at the end of the neutral segment.
- The second case occurs if the neutral movement advances between two segments that run in the opposite direction. In this case, the end of the first movement will be at the end of the second segment.
Neutral Movements in the US Dollar Index
The following chart shows the US Dollar Index in its 8-hour timeframe. In the figure, we observe a first neutral movement, which runs upward from 96.98 until level 97.40.
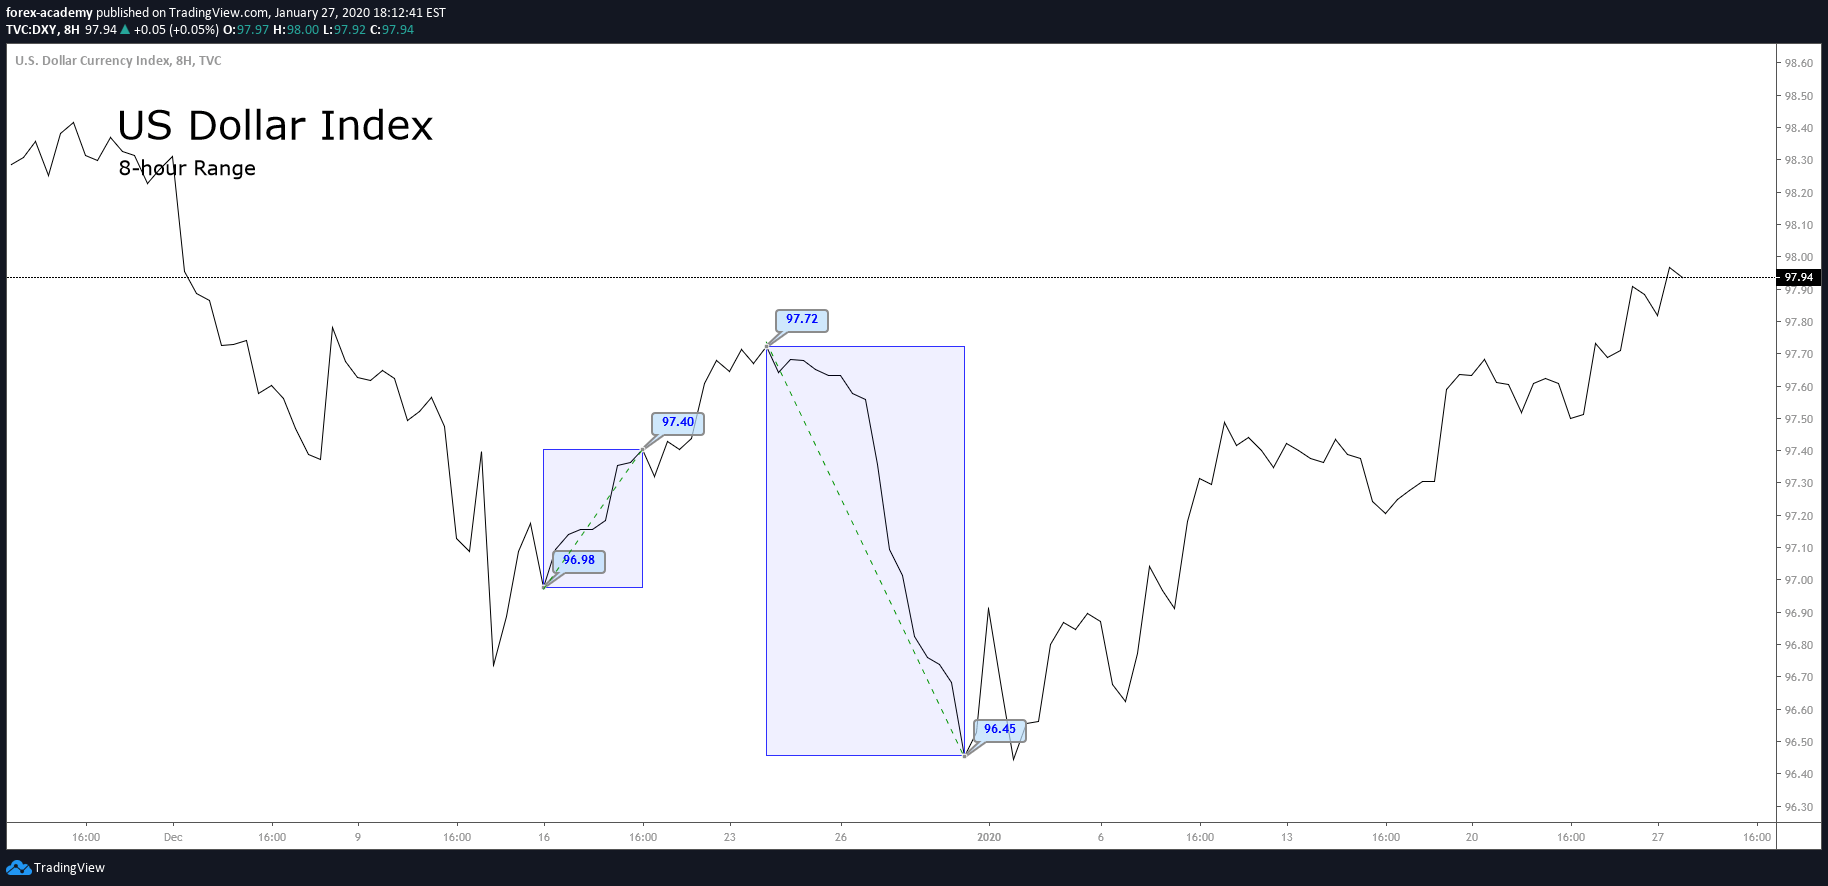
The ascending sequence makes two pauses that look horizontal. Applying the neutral movement concept, we conclude that this movement corresponds to a single path that advances into the rectangle.
In the second rectangle, we observe the decline that the Dollar Index from level 97.72 until 96.45. This bearish move exposes an acceleration that turns complex the wave analysis. In this case, the neutral movement concept helps us in determining that the bearish move corresponds to a single movement.
If the wave analyst looks for a detailed decomposition of the entire bearish segment simplified by the neutral movement, in words of R.N. Elliott, the wave analyst should have to study the move in a lower timeframe to identify every segment.
Waves Observation
Until the previous section, we observed that each movement produced is divided into two main categories depending on the segments that compound each sequence.
According to the Wave Principle, R.N. Elliott described the existence of a movement that follows a trend, and the reaction of the initial move. Elliott defined to these movements as an impulsive and corrective wave.
- An impulsive wave progresses in a defined direction. Its internal sequence is formed by five segments, where three movements follow the same path, and the other two move against the main trend.
- A corrective wave characterizes by its progress against the main trend direction. A corrective formation is composed of three segments.
Identifying Movements
To facilitate the wave analysis, R.N. Elliott, in his Treatise, defined the use of labels to identify the advance of the movement of each segment.
Elliott, in his work “The Wave Principle,” tells us that the use of tags to identify each movement is not an end by itself. Instead, it is a tool to ease the wave study.
The following chart represents the GBPUSD in its 4-hour range. From the figure, we observe the Cable developed a rally that advanced in five segments from level 1.19585 touched on September 03rd, 2019.
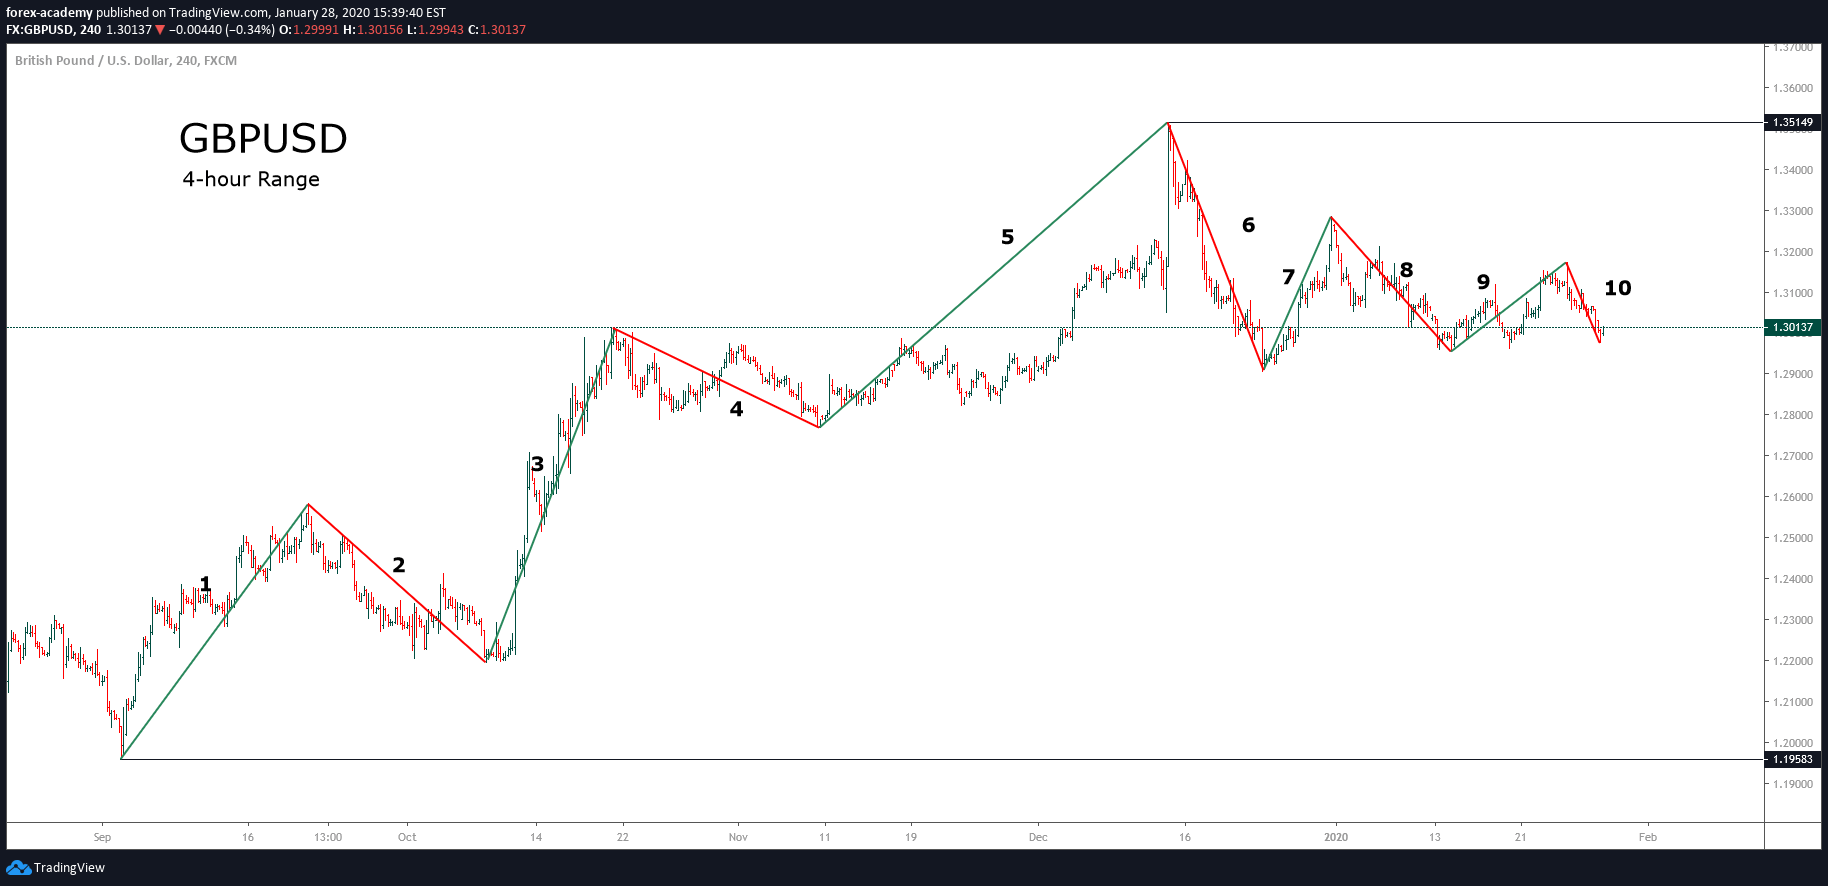
The sterling reached its highest level at 1.35149 on December 12th, 2019, from where the price action began a corrective process that still looks in progress.
Conclusions
Sometimes, the nature of the movement makes complex the waves’ observation process, and in consequence, to determine where it begins or ends.
The neutral movement concept aid the wave analyst to determine, in an objective way, where it starts or ends a move when it is not simple to define. Once the wave analyst discerns where each movement starts and finishes, the analyst will be able to advance in the wave identification process.
Suggested Readings
- Neely, G.; Mastering Elliott Wave: Presenting the Neely Method; Windsor Books; 2nd Edition (1990).
- Prechter, R.; The Major Works of R. N. Elliott; New Classics Library; 2nd edition (1990).