Until now, we studied different scenarios for the retracement of W2 when it is lower than 100% of W1. In this educational article, we’ll review what to expect when the retrace experienced by W2 is higher than 100% of W1.
The Fifth Rule
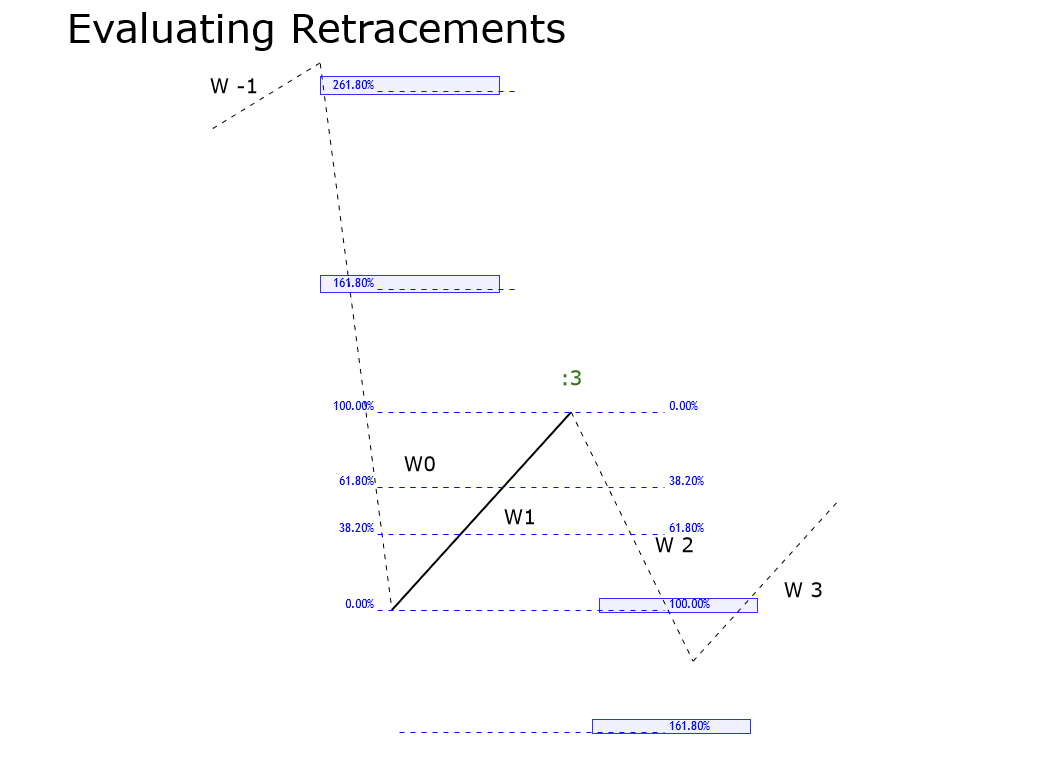
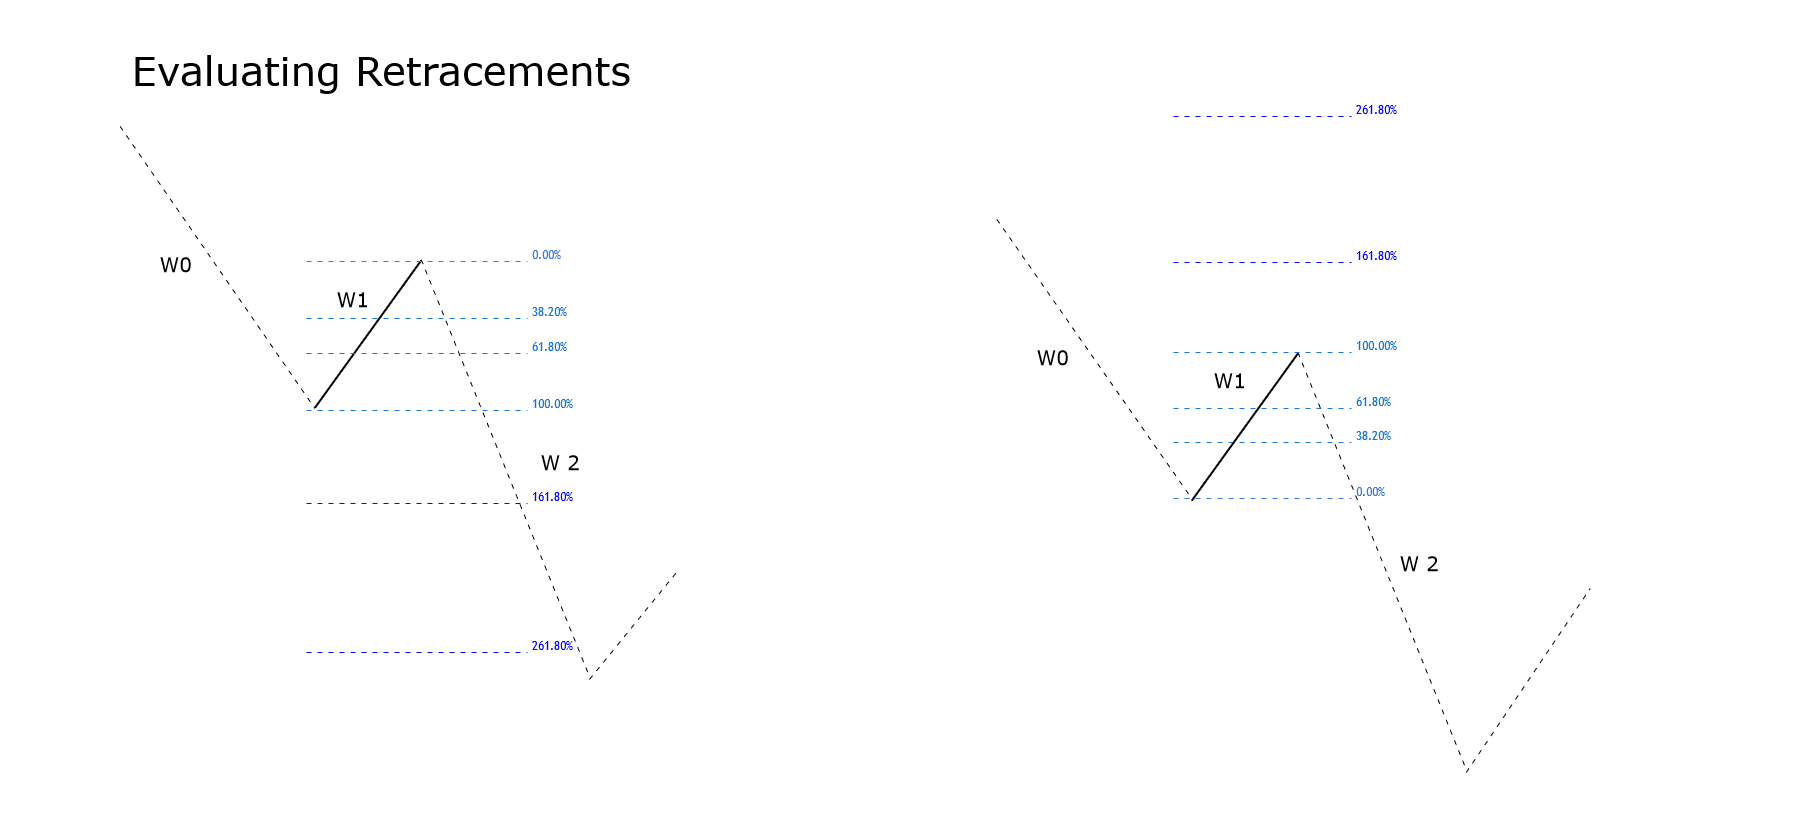
The fifth rule surges when the price runs in wave two (W2) and its progress extends between 100% and 161.8% of the first wave (W1).
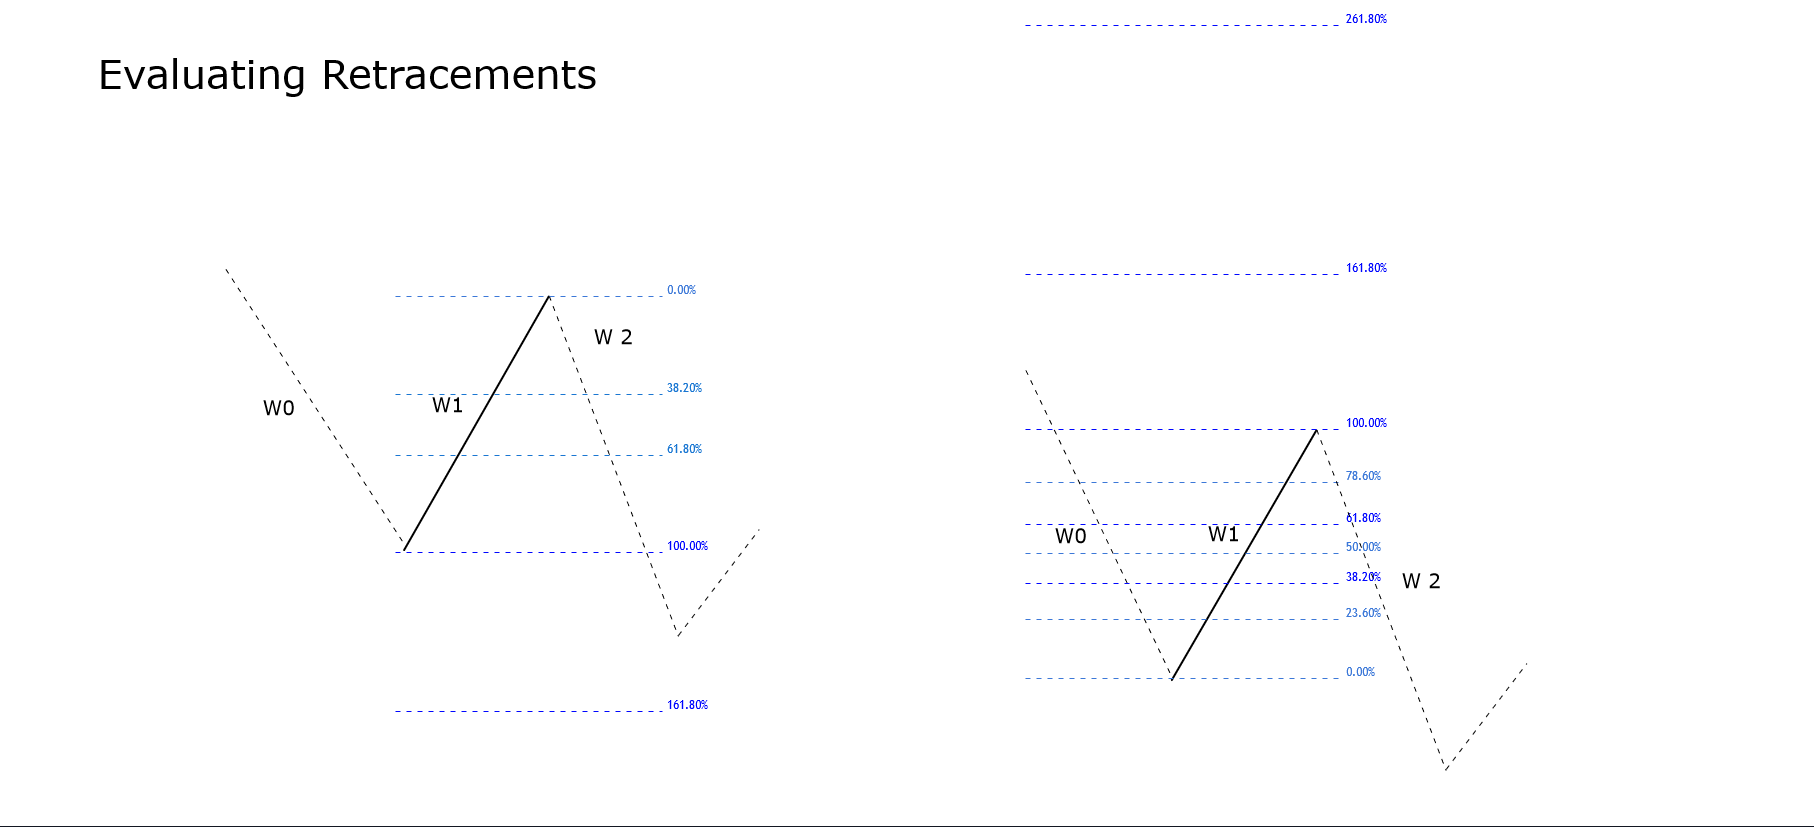
In this case, could exist four possible conditions as follows.
Condition a: this condition occurs if W0 is lower than 100% of W1. As a first scenario, W1 could be part of a corrective sequence, and in consequence, W1 should identify as “:3”. In terms of the Elliott wave formations, W1 could be the first or the second segment of a corrective pattern, like a Flat pattern, a triangle formation, or the center of a Complex Correction.
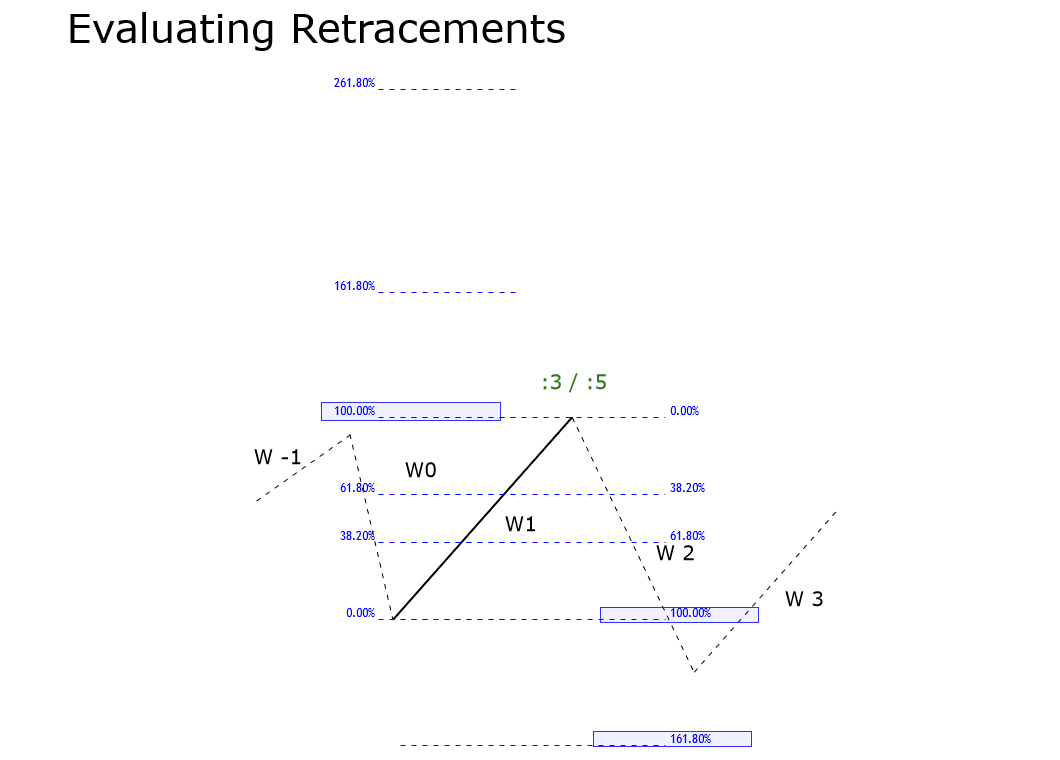
A second option considers the possibility of a five-wave structure. If it occurs, W1 should label as “:5”, and the structure could correspond to the end of a zigzag pattern.
Condition b: occurs when W0 moves between 100% and 161.8% of W1. In this scenario, W1 should be part of a three-wave structure. It means that we should identify it as “:3”. In consequence, W1 could belong to the first segment of a Flat pattern, a section of a Triangle structure, or the center of a Complex correction.
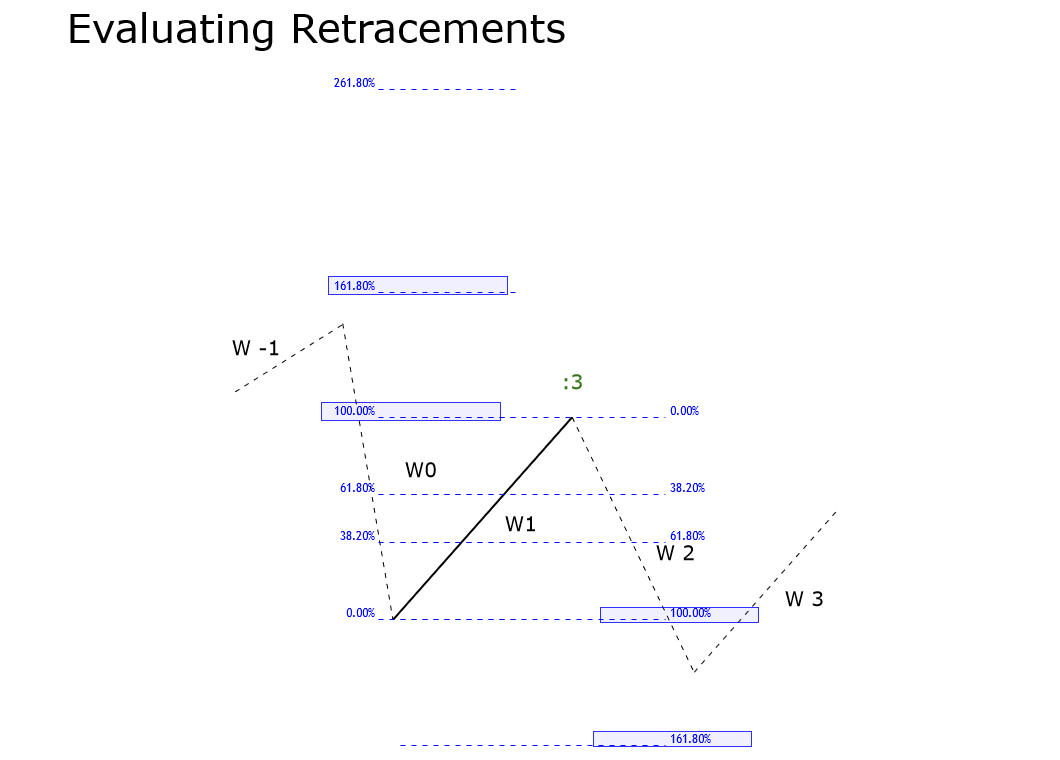
Condition c: this condition occurs if W0 is between 161.8% and 261.8% of W1. In the same way that condition b, in this scenario, W1 should be part of a corrective formation as a flat (which should be an irregular flat), triangle, or complex correction.
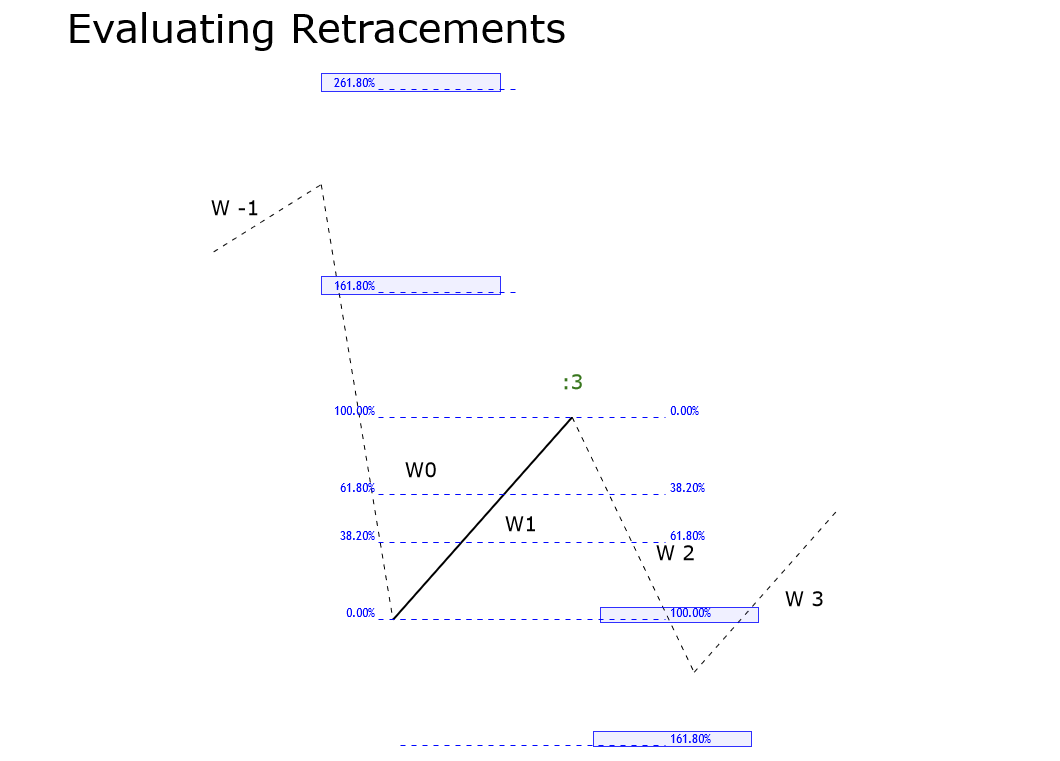
Condition d: occurs when W0 is higher than 261.8% of W1. In this case, W1 likely will be the first part of a corrective structure; then, W1 should identify as “:3”. In terms of the Elliott wave formations, the structure in progress could correspond to a Flat pattern, a triangle, or the center of a complex correction.
The Sixth Rule
This rule will activate if wave 2 retraces between 161.8% and 261.8% of W1. The possible conditions are similar as in the fifth rule and are detailed as follows.
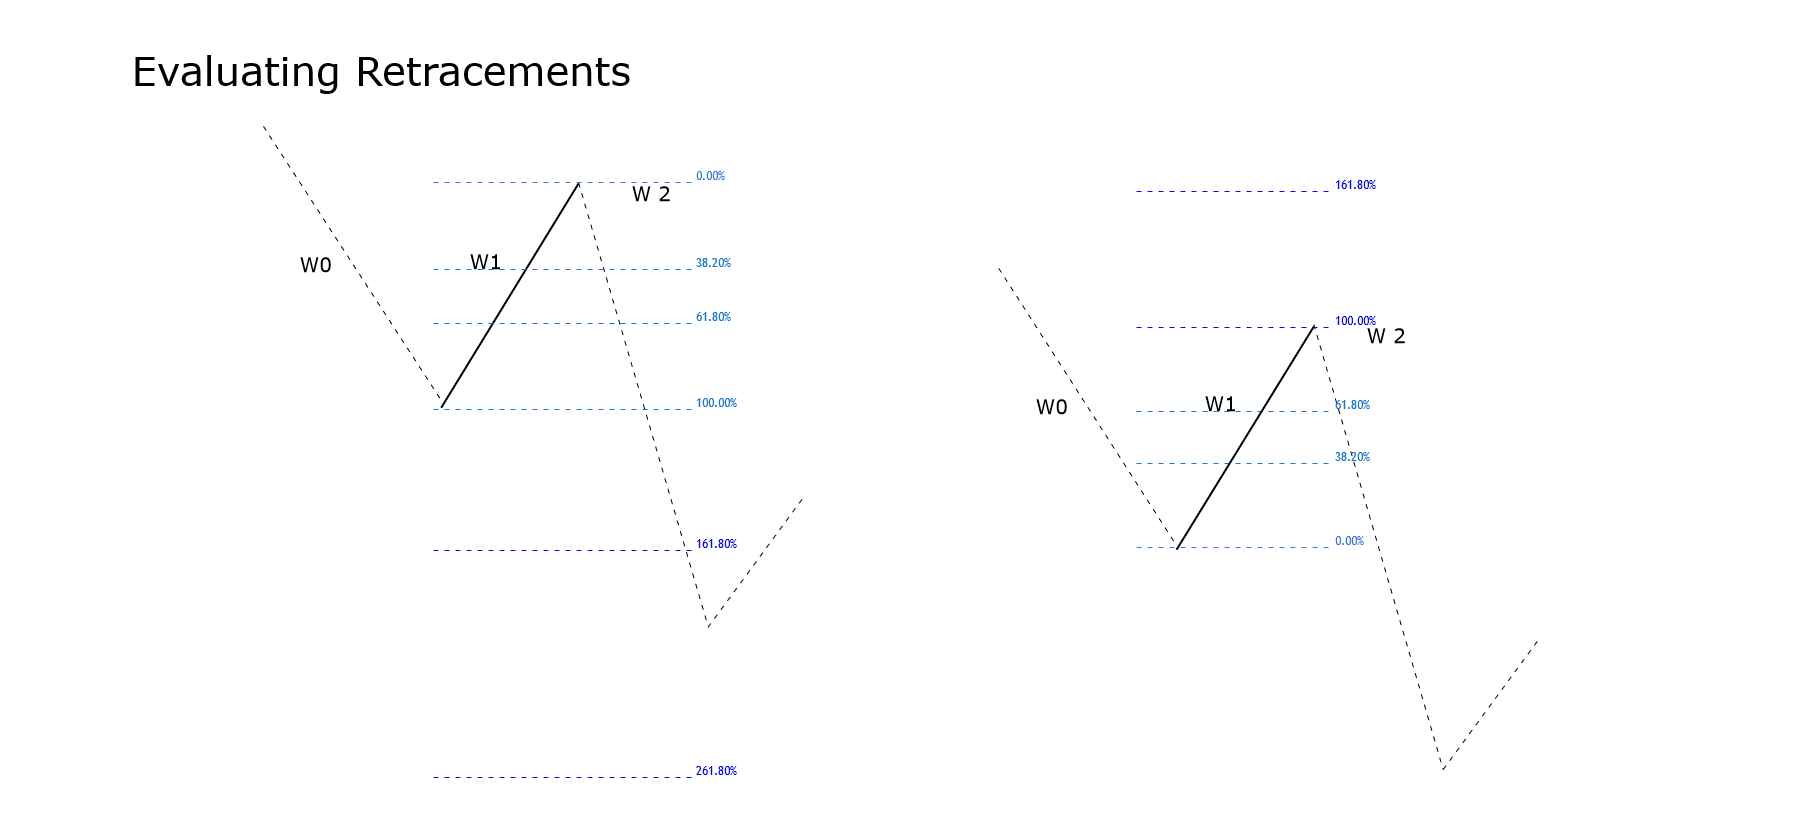
Condition “a”: this condition occurs if W0 is lower than 100% of W1. In this scenario, W1 could be a three-wave structure (labeled as “:3”), and W1 could correspond to a flat, triangle, or the connector of a complex correction. A second scenario considers that W1 could be a five-wave formation (identified as “:5”), then, W1 could be the end of an impulsive movement.
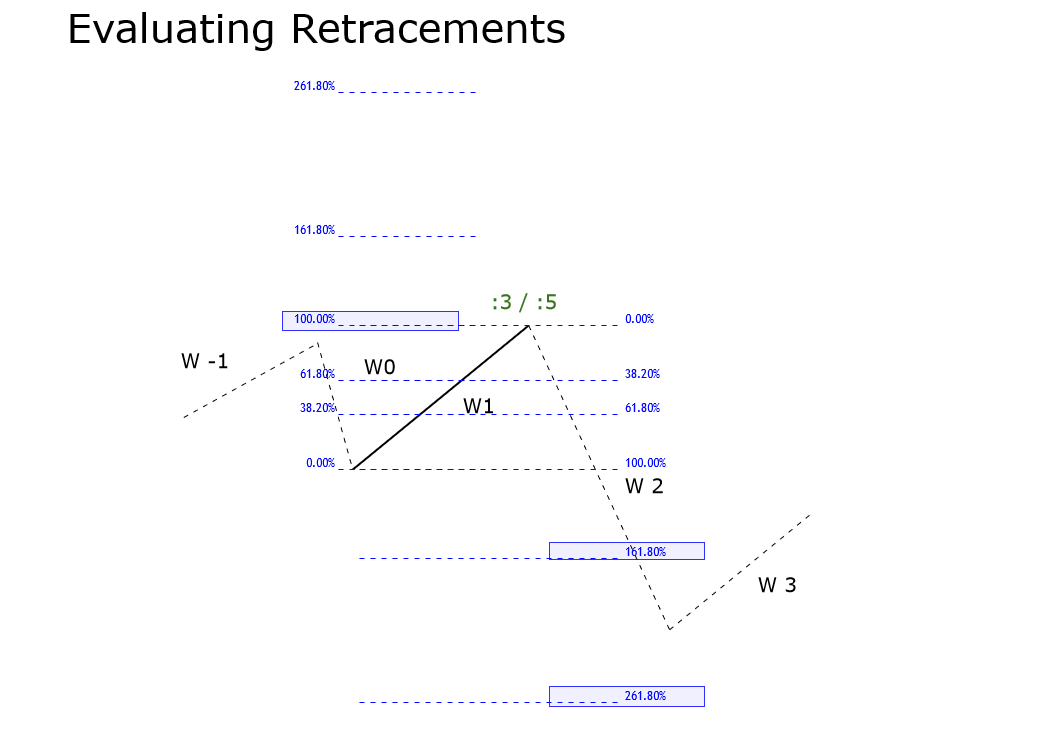
Condition “b”: occurs when W0 moves between 100% and 161.8% of W1. In the same way that Rule 5, condition b, the most probable formation for W1 is a three-wave structure and should identify as “:3”. W1 could be the first segment of a flat, an internal section of a triangle, or the center of a complex correction.
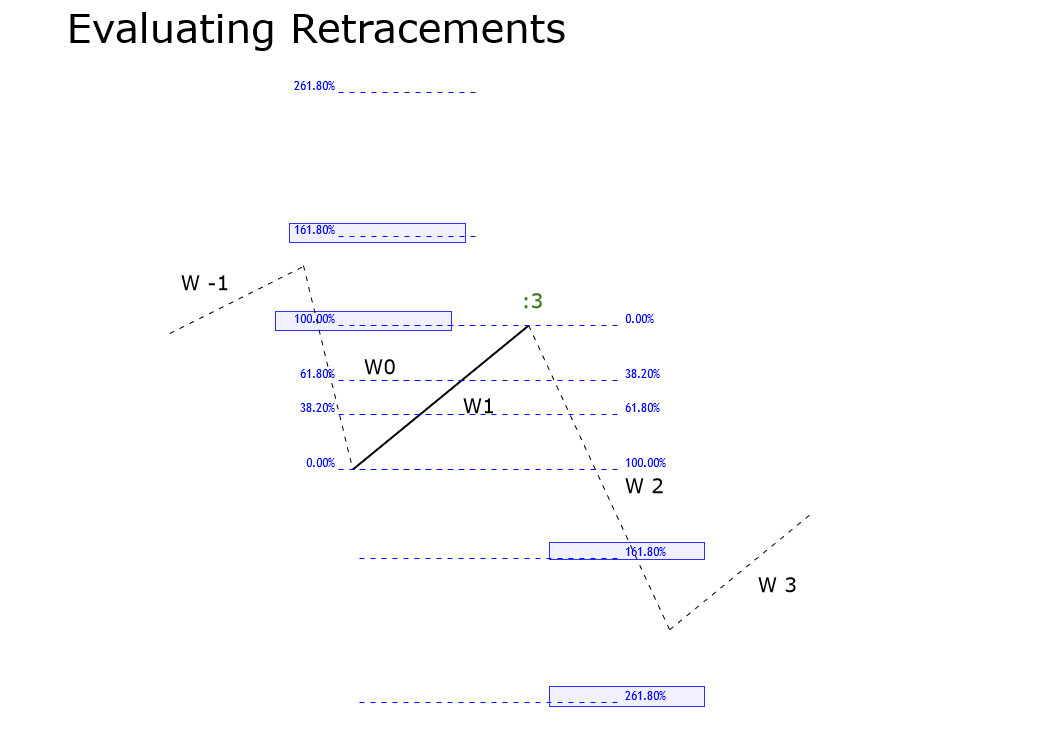
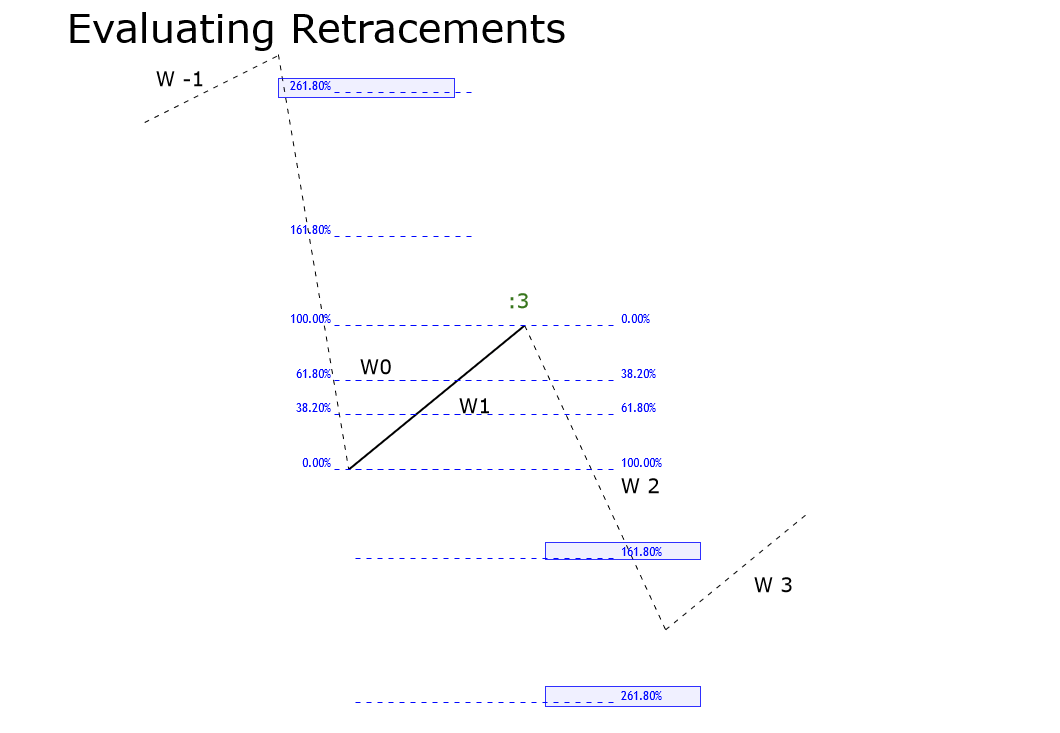
Condition “c”: this condition occurs if W0 is between 161.8% and 261.8% of W1. The structure that W1 develops could correspond to a corrective pattern, which should identify as “:3”, and the formation developed could be a flat pattern with failure in C or an expansive triangle.
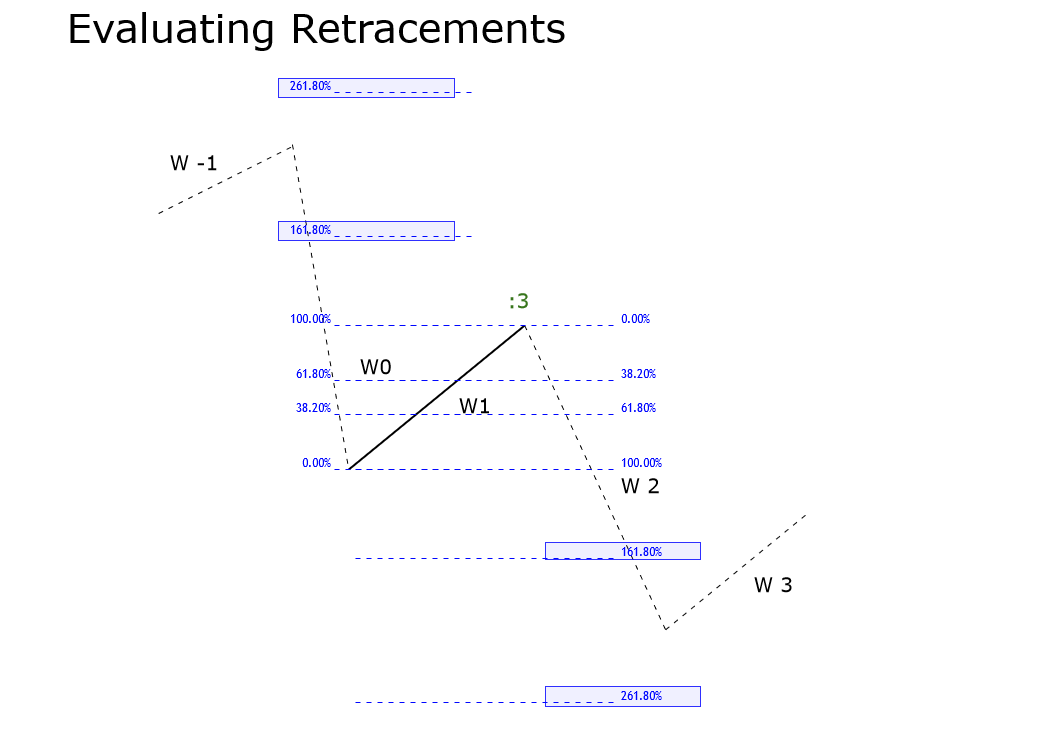
Condition “d”: occurs when W0 is higher than 261.8% of W1. In this case, W1 could be part of a zigzag, a segment of a contractive triangle, a flat pattern with a failure in C, or the correction of an impulsive move. In any case, W1 should identify as “:3”.
The Seventh Rule
The wave analyst must use this rule when the retrace experienced by wave 2 is higher than 261.8% of wave 1. In this case, the possible conditions of W0 are similar to rules fifth and sixth, which are as follows.
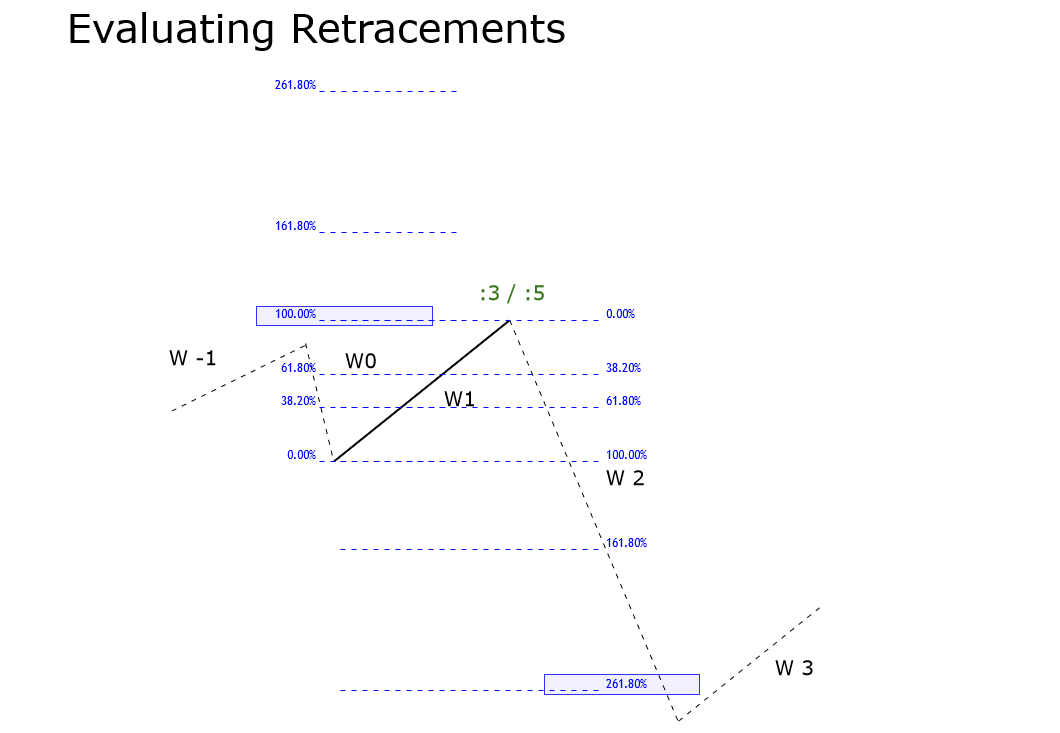
Condition “a”: this condition occurs if W0 is lower than 100% of W1. In this case, W1 could be part of a three-wave structure (identified as “:3″) developing a complex correction, or a flat with a complex wave B. Another option for W1 could be a five-wave structure (labeled as”:5″) running in the failure of the fifth wave.
Condition “b”: occurs when W0 moves between 100% and 161.8% of W1. In this condition, W1 could be a three-wave structure (identified as “:3”) performing the center of a complex correction, a flat pattern, or a contractive triangle.

Condition “c”: this condition occurs if W0 is between 161.8% and 261.8% of W1. In this case, W1 could be part of a corrective formation as a continuous correction, a flat pattern, or a contractive triangle, and W1 should identify as “:3”.
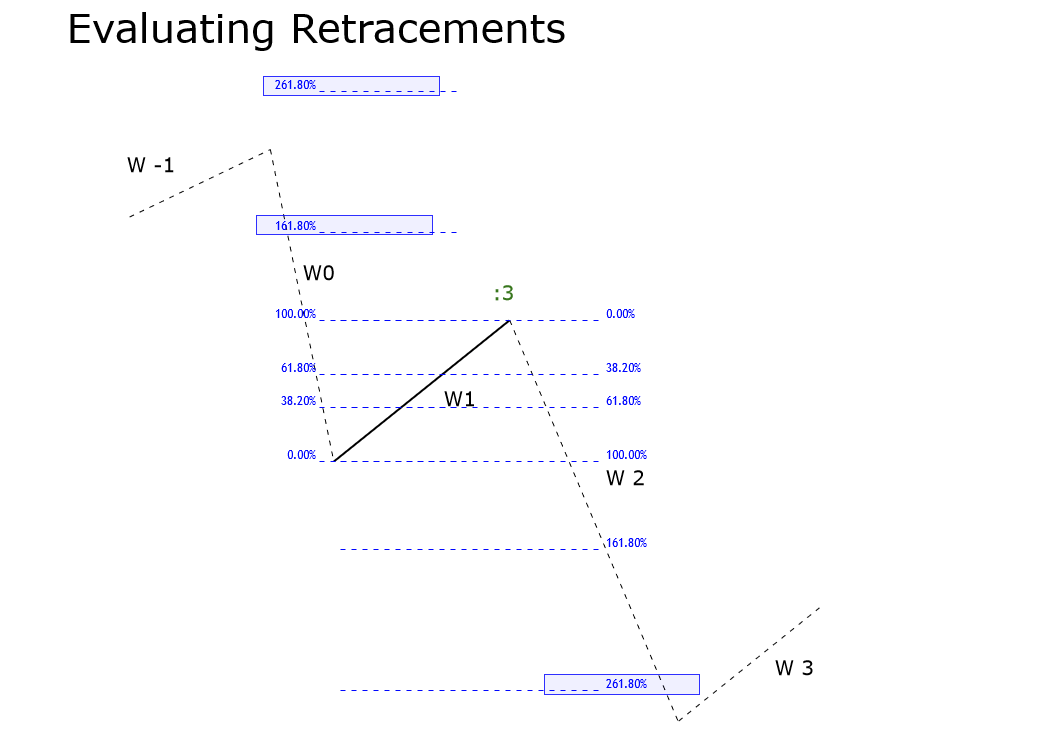
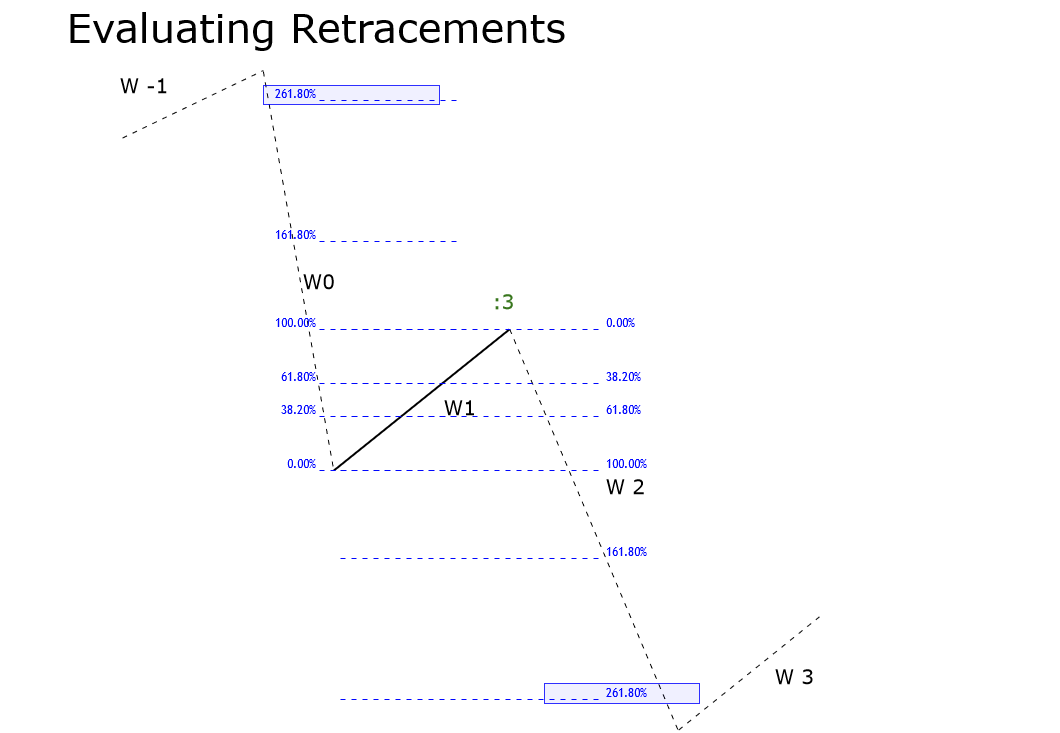
Condition “d”: occurs when W0 is higher than 261.8% of W1. In this scenario, the structure suggests that W1 could be part of a corrective formation (tagged as “:3”) as a zigzag pattern, the connector of a double zigzag, the center of a complex correction (or wave-x), or a contractive triangle.
Conclusions
In this educational article, we reviewed what should be the Elliott wave structure that W1 build when W2 exceeds 100% of W1. As can be observed, in most cases, the formation developed by W1 corresponds to a corrective sequence.
According to R.N. Elliott’s words, the knowledge of the corrective formations could provide to wave analyst an edge over what should be the next move. In this context, the comprehension of different rules and conditions presented could ease and offer a relevant clue in the wave analysis to the Elliott wave trader.
Suggested Readings
- Neely, G.; Mastering Elliott Wave: Presenting the Neely Method; Windsor Books; 2nd Edition (1990).
- Prechter, R.; The Major Works of R. N. Elliott; New Classics Library; 2nd Edition (1990).


