
Simplified trading using boxes produces 144 pips
One of the biggest areas where new traders fall down is because they overload their screen charts with too many indicators. Many professional and institutional size traders will often use price action only to trade. Or may supplement their charts with a minimal amount of indicators, while many prefer draw lines in order to calculate areas where price action has consolidated into a sideways movement. They can then trade where the breakout will occur.
Example A
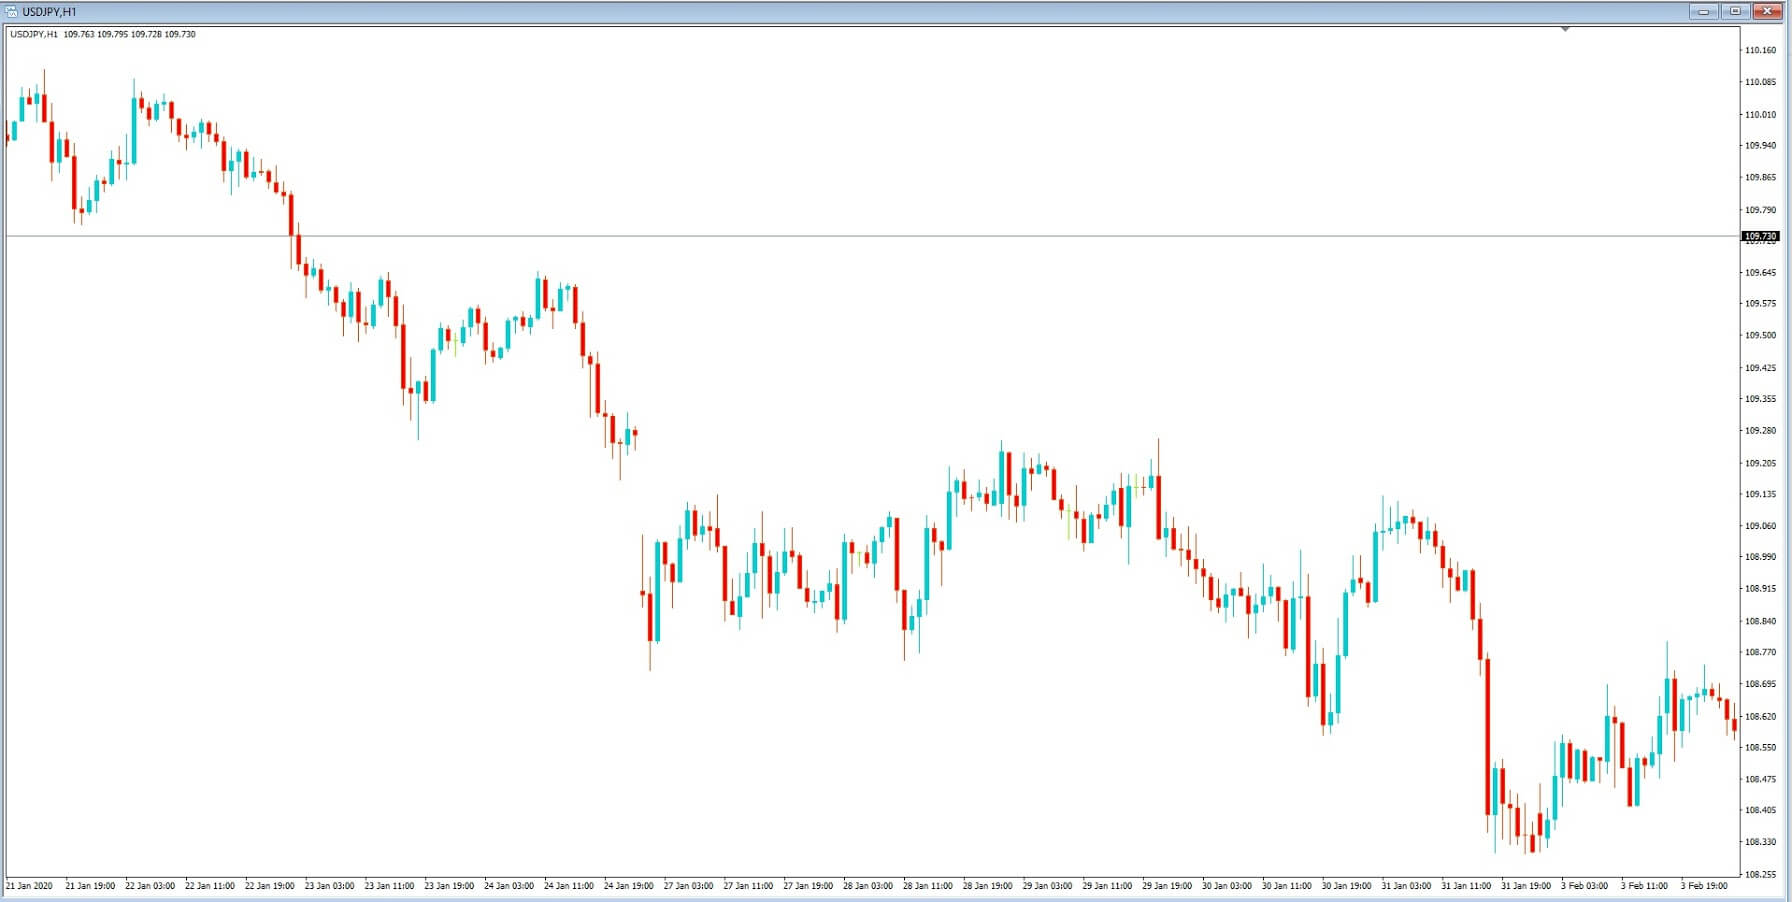
Example A is a one hour chart of the USDJPY pair, with only price action in the form of Japanese candlesticks. Blue for bullish, or up, and red for bearish, or down. On the face of it, although there seems to be a general bias to the downside, it would be fairly difficult to pinpoint where to enter as the hours roll by.
In order to confirm consolidation or sideways trading, a simple rule applies: price action must have touched at least two areas of resistance and at least two areas of support.
Traders will confirm this on the charts by simply adding a couple of horizontal lines, once they have identified this consolidation, as per the price action. They will then make the necessary trading decision based on the information they see.
Example B
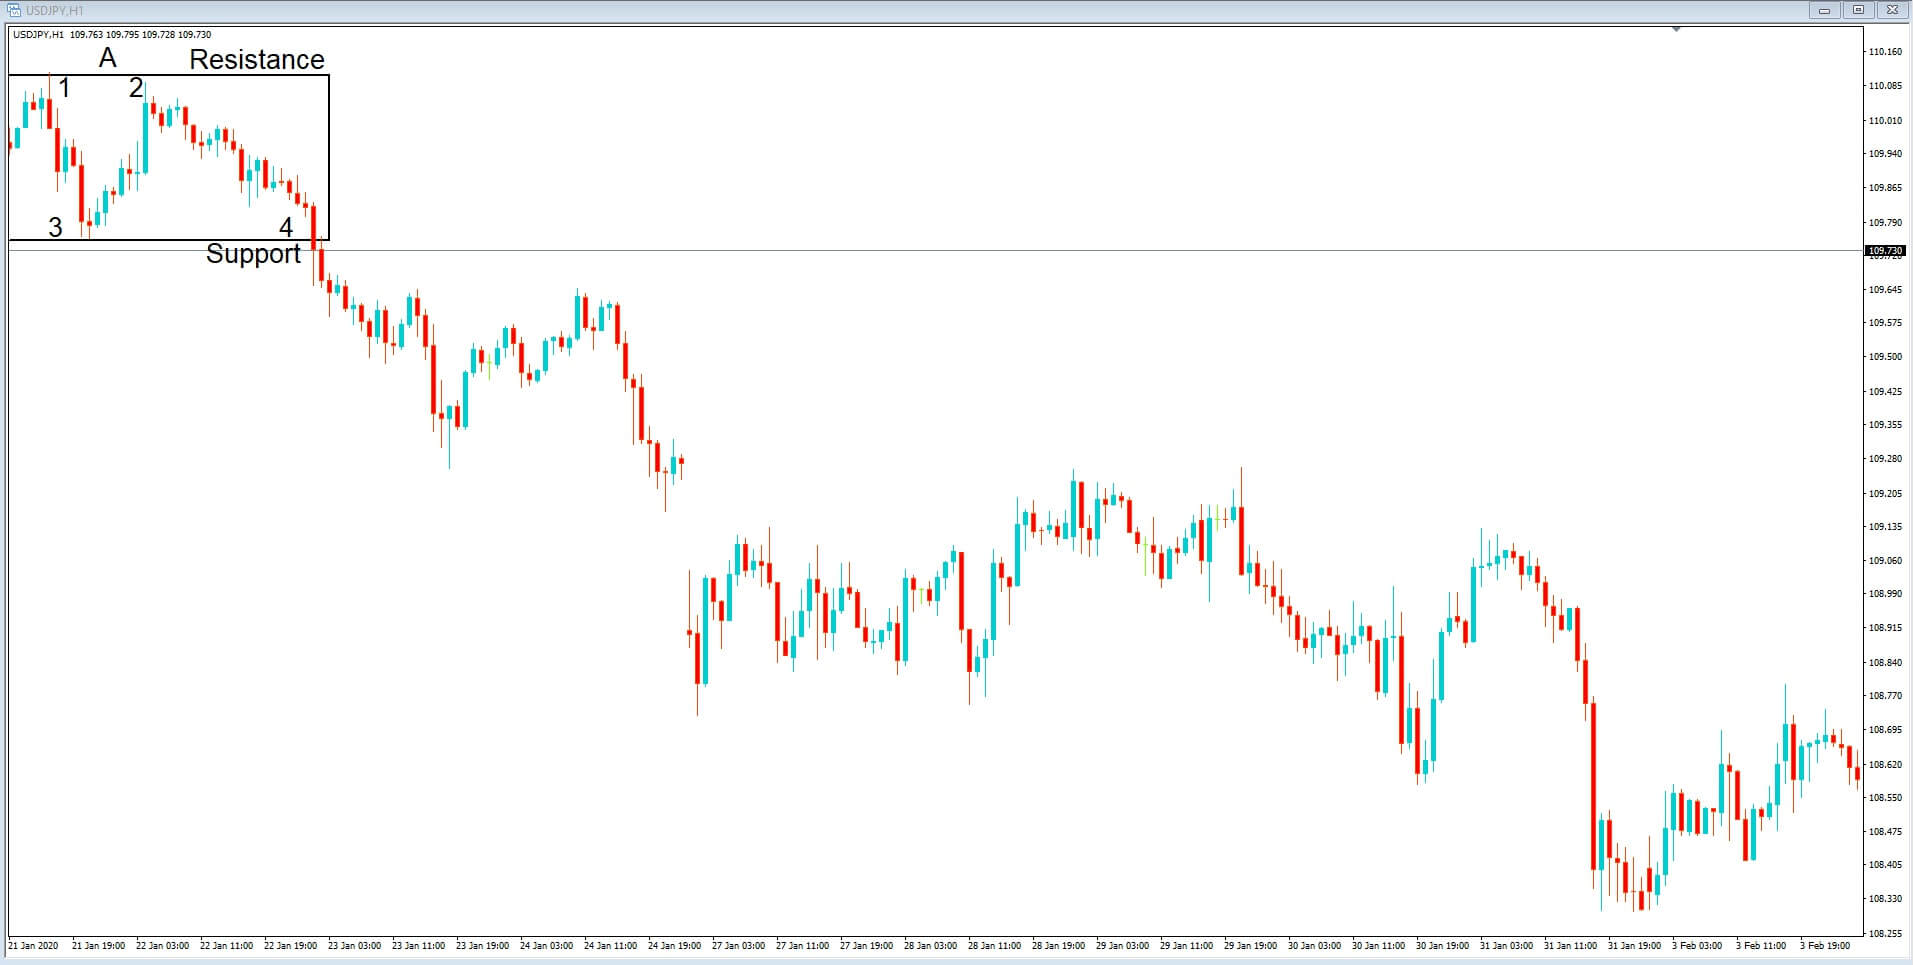
Now let’s look at example B, we always read our charts from left to right, because they tell us a story, and at the beginning of the session in question we can see that at position A, we have a confined area of resistance and support, where we can see that both lines have been touched by price action on at least two occasions. In the example, we have closed off the end of the parallel lines, and thus, we can now identify this area as a box, And where we can see that at position price action punches through the support area, and traders will have gone short at this position.
Example C
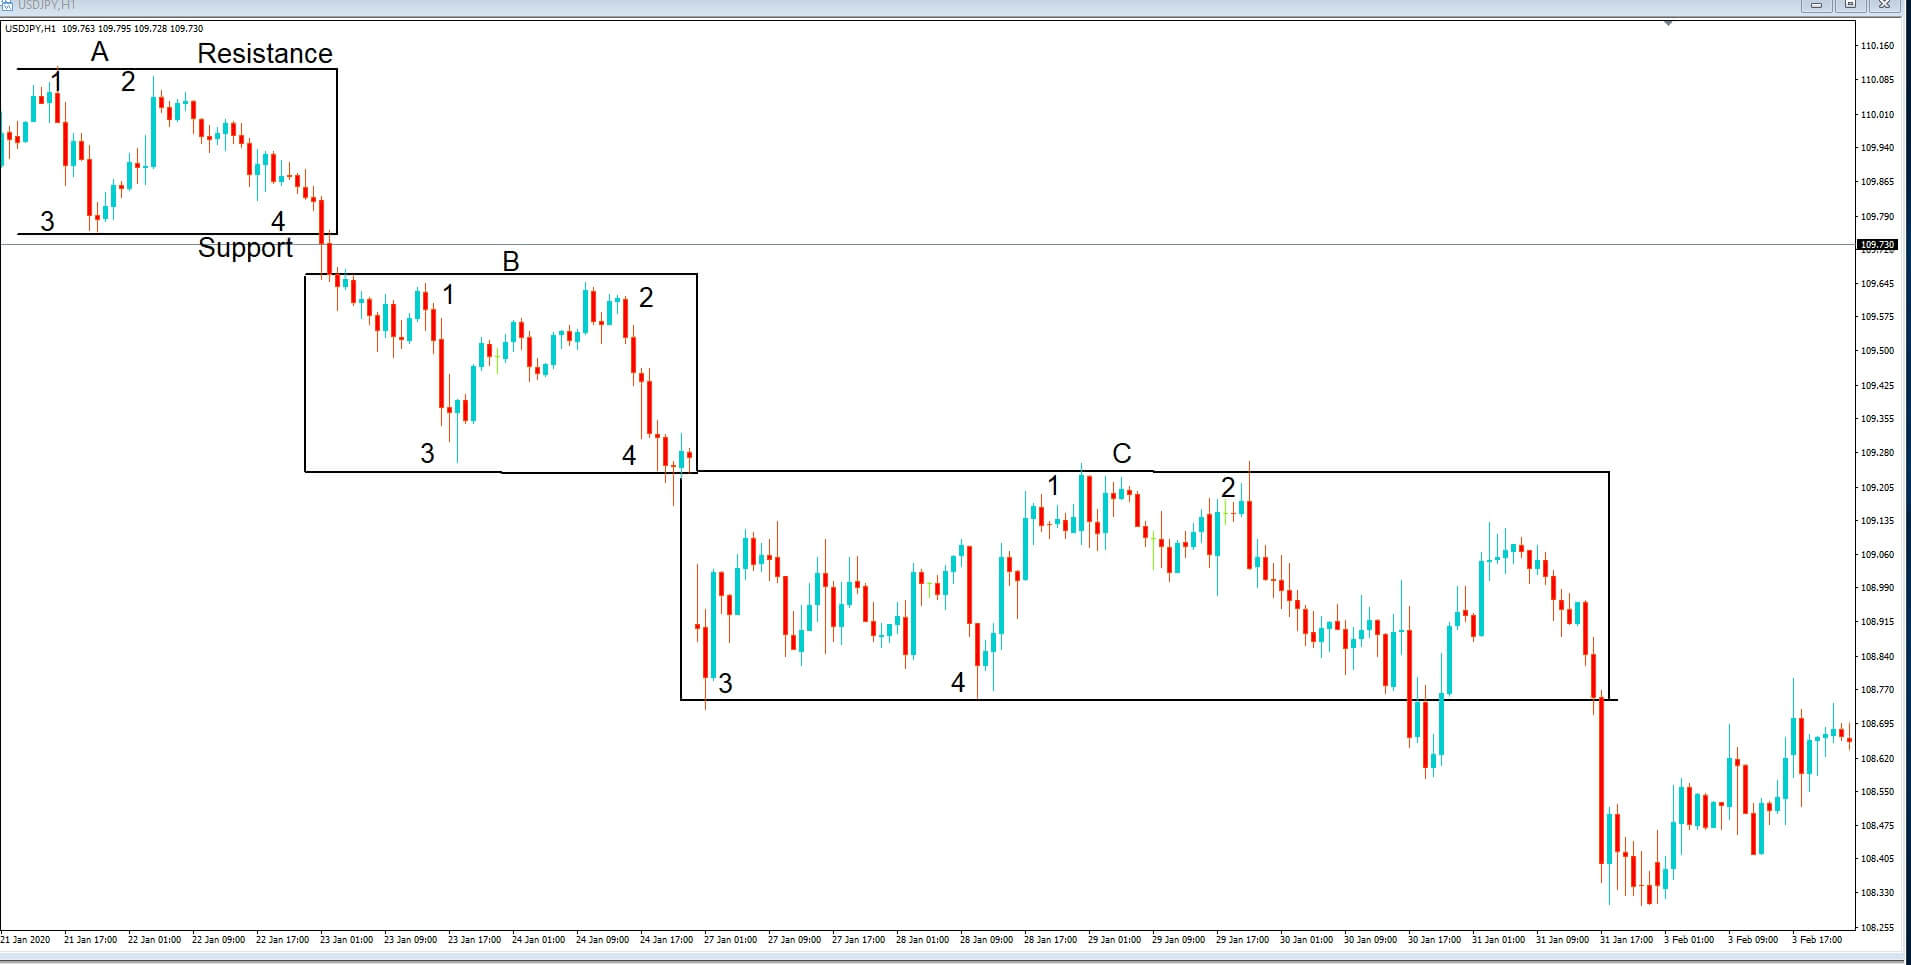
If we move on during the course of the training session, we can identify another two boxes, in example C, firstly at position B, and then position C, we’re both have the minimum requirements of 2 touches of the support and resistance lines.
Example D
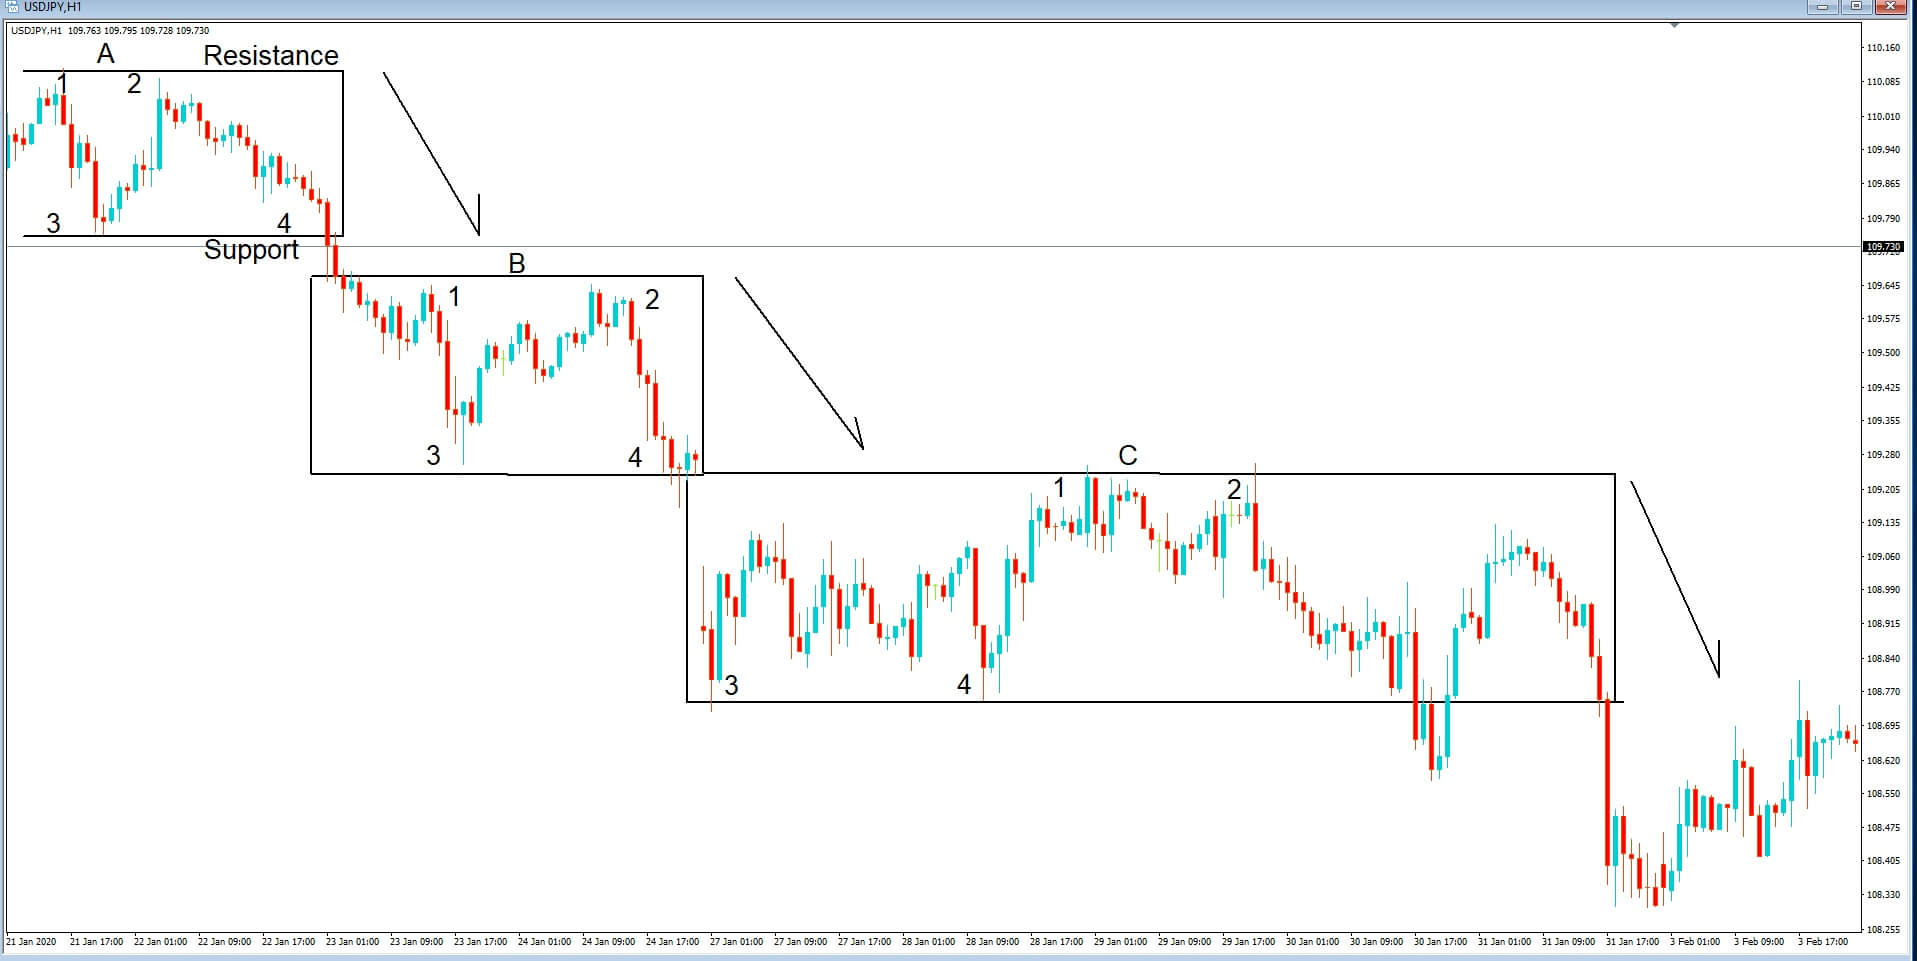
In example D, we can drill down a little bit more and identify that this pair is consolidating at position A, and then taking a move lower, then consolidating again at position B, before taking another step lower and then consolidating again at position C, and where traders will have picked up on the bias to the downside, and traded accordingly at breaks in the support lines.
Example E
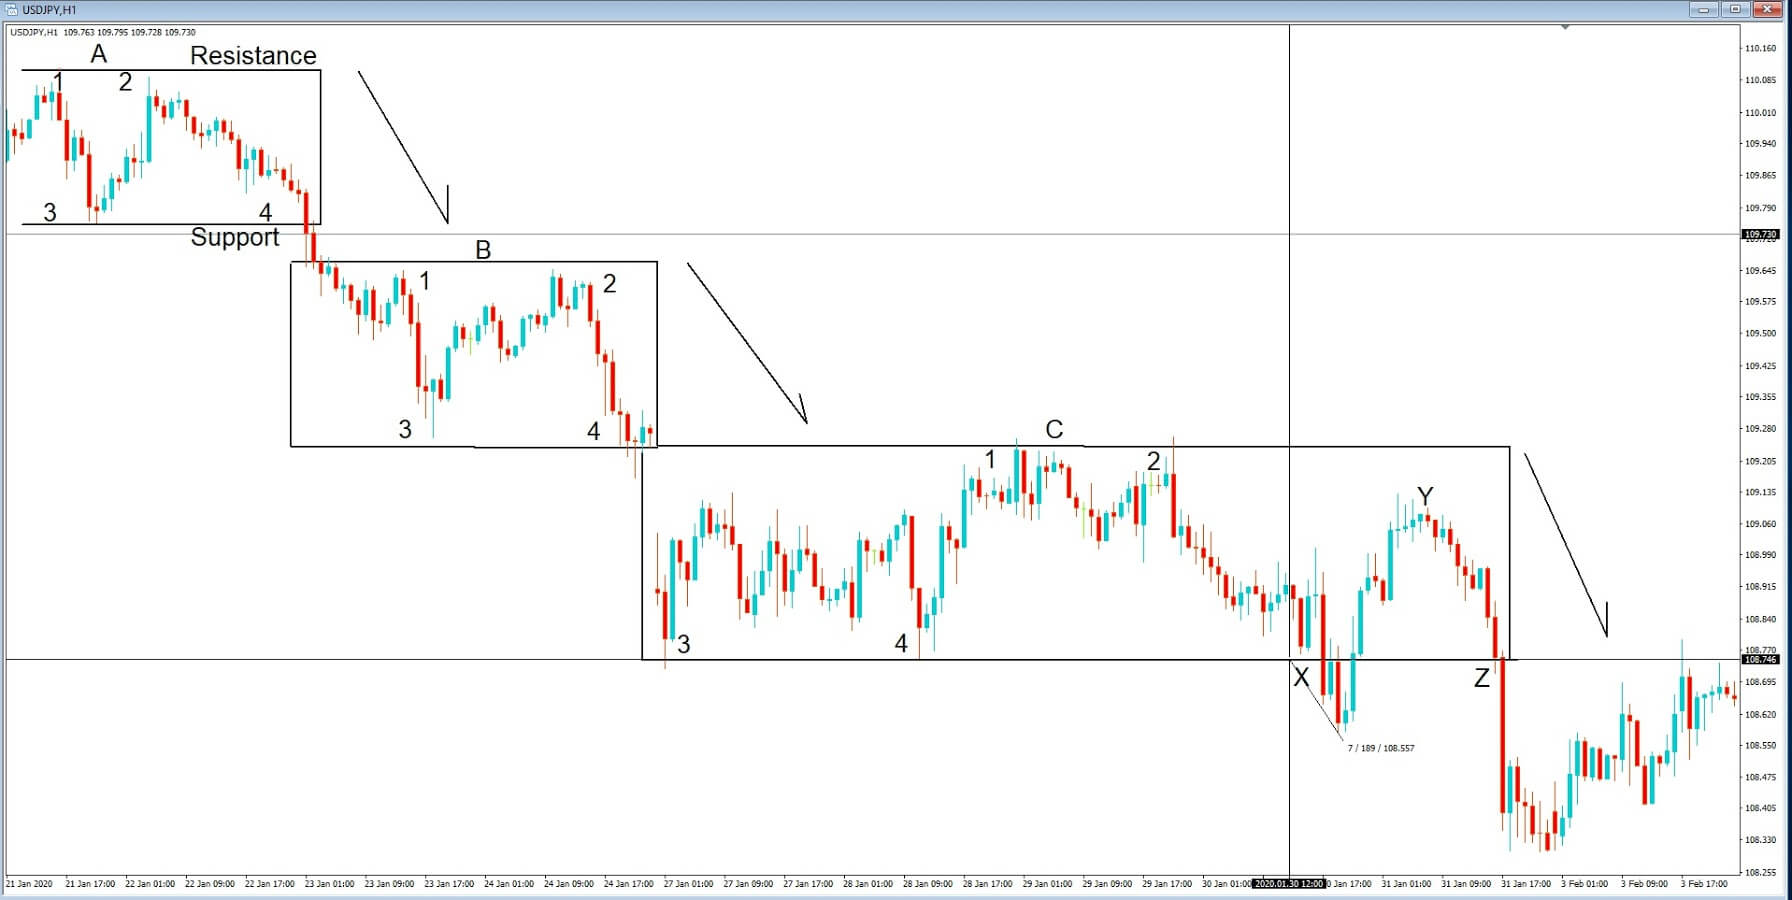
Finally, in example E, let’s take a closer look at the false breakout to the downside at position X. There will always be times when traders are wondering if the market has topped or bottoms out, and this will cause breakouts from our boxes to be quickly reversed, and this happens at position X where we see a break of the support line and where the selling action has run out of steam, and the buyers have come in and reversed price action back into box C. However the move lover still produced 18 pips to the downside on this occasion, which is not an unreasonable amount.
But importantly, price action does not continue up to the area of resistance and begins stalls at position Y, before fading back to the support line and where the second breach at position Z is much more enhanced and producers 45 pips to the downside before price action looks to form the basis of another consolidation period.
The total move lower, just by using this simplified box trading, produced a total of 144 pips.